Article

Phosphate Management for High Soybean and Maize Yields in Expansion Areas of Brazilian Cerrado

by
Lenir Fátima Gotz
1,
Marquel J. Holzschuh
2,
Vitor P. Vargas
2,
Ana Paula B. Teles
1,
Mayara M. Martins
1 and
Paulo Sergio Pavinato
1,*
1
Department of Soil Science, University of Sao Paulo—College of Agriculture “Luiz de Queiroz”, Piracicaba 13418-900, Brazil
2
SLC Agricola, Porto Alegre 90620-010, Brazil
*
Author to whom correspondence should be addressed.
Agronomy 2023, 13(1), 158; https://doi.org/10.3390/agronomy13010158
Submission received: 28 October 2022 / Revised: 21 November 2022 / Accepted: 25 November 2022 / Published: 3 January 2023
(This article belongs to the Special Issue Management Practices Affect Soil Carbon and Nutrient Dynamics)

Abstract

:
The low phosphorus (P) availability is considered one of the most limiting factors for suitable crop production in Brazilian Cerrado areas. We aimed to define the best P fertilizer management for maximum soybean and maize grain yield and minimum soil P adsorption in new agricultural areas. Two experiments were carried out in a Hapludox (pH 5.0) over six years. The first experiment evaluated five P fertilizer management (correction and maintenance): correction and maintenance at furrow; correction incorporated and maintenance at furrow; correction at furrow and maintenance broadcasted; correction and maintenance broadcasted; gradual correction (five years) and maintenance at furrow. The second experiment evaluated doses of P2O5: 0, 60, 120, 180, 240, 300 kg ha−1 year−1 applied at furrow or broadcasted. The P correction incorporated (0–20 cm) and maintenance at furrow resulted in higher yield and soil labile P. The yield increased up to 250 kg ha−1 of P2O5, and soil P fractions linearly increased, independent of application mode. Thus, the best P management would be full correction incorporated in bulk soil and maintenance at furrow; initial P correction (up to 250 kg ha−1 of P2O5) is essential in new Cerrado areas. These results are useful for orientating P management decisions in new sustainable agricultural systems.

1. Introduction

Agriculture production in the Brazilian Cerrado (savanna) is regarded as one of the greatest achievements of agricultural science in the 20th century, being the main frontier for Brazilian cropland expansion [1,2]. However, the low phosphorus (P) availability is one of the most limiting factors for suitable crop production in these areas. Therefore, to enhance the natural low available P content in Cerrado soils requires a substantial amount of fertilizer dose/source management because of the high P-fixation capacity. This is a consequence of the predominance of low-activity clay minerals (e.g., kaolinite) and Fe/Al oxides in soil composition, demanding occasionally high P addition [1,3,4,5].
The high soil/plant P demand, associated with the recent and predicted future increases in P fertilizer costs, with declining reserves of P rock, have raised serious concerns about the efficient use of this non-renewable resource [3,6,7]. Thus, it is essential to have an efficient P fertilizer management in agricultural systems, especially in Brazilian Cerrado where future P demand is expected to increase [3,8,9], to guarantee global food security. In newly cultivated areas of Cerrado it is mandatory to build up soil P availability before cropping, in which the fertilizer placement may play an important role. Usually, correction P is applied in soil surface and incorporated (0–20 cm); the maintenance P should be applied at seed furrow during subsequent growing seasons, replacing the exported P by harvesting. Another way is the gradual P correction at seed furrow, annually applying an amount of P greater than P requirement by plants [4,10,11]. In recent years, broadcasting P fertilizer application has spread due to operational agility in the field, which allows for the best sowing timing [9,12]. Moreover, operational costs have highly increased, and P incorporation means a significant part of the total cost when opening new cultivated areas.
Distinct fertilizer P application mode can affect crop P utilization, changing soil P dynamics and accumulating P at soil profile [8,13]. Broadcast P fertilization is the simplest method that reduces working time and labor, but results in P accumulation on the top surface, which may limit P access by plant roots [4]. Otherwise, furrow P application may minimize P fixation due to the smaller volume of the soil in contact with the fertilizer [4,14,15]. However, Coelho et al. [8], in a 10-year experiment, observed that broadcasted P fertilizer increased the labile and moderately labile P down to 7.5 cm, with similar or even greater P fertilizer use efficiency by crops compared to furrow application. It stands out that the gradual P correction is a way of making gradual adjustments but may limit the achievement of higher yields.
In this context, suitable fertilizer P management, according to soil type/local condition, is essential for a better crop development/P use efficiency in new areas. For that, it is essential to have a more comprehensive understanding of soil P dynamics over time in the beginning of the cultivation system. For that, the procedure proposed by Hedley et al. [16] is the most common to identify the redistribution of P applied to the soil via fertilizers [8,17], being considered an adequate methodology for our purpose. The present study was established with the hypothesis that the phosphate correction is essential to obtain higher yield, and the management most practiced by farmers (the full correction incorporated + maintenance at seed furrow) is still the best management in new cropping Cerrado areas; furthermore, when high doses of P are applied, there is no difference between the application mode. Thus, we aimed here to define the best management of fertilizer P as corrective (soil build up) and/or maintenance (production) in new cropping Cerrado areas, for maximum grain yield and minimum P adsorption in stable fractions in the soil. Our study innovates for showing the best P fertilizer management relative to P correction and P maintenance, and to the best P dose for higher grain yield in expansion areas of Brazilian Cerrado.

2. Materials and Methods

2.1. Experimental Area
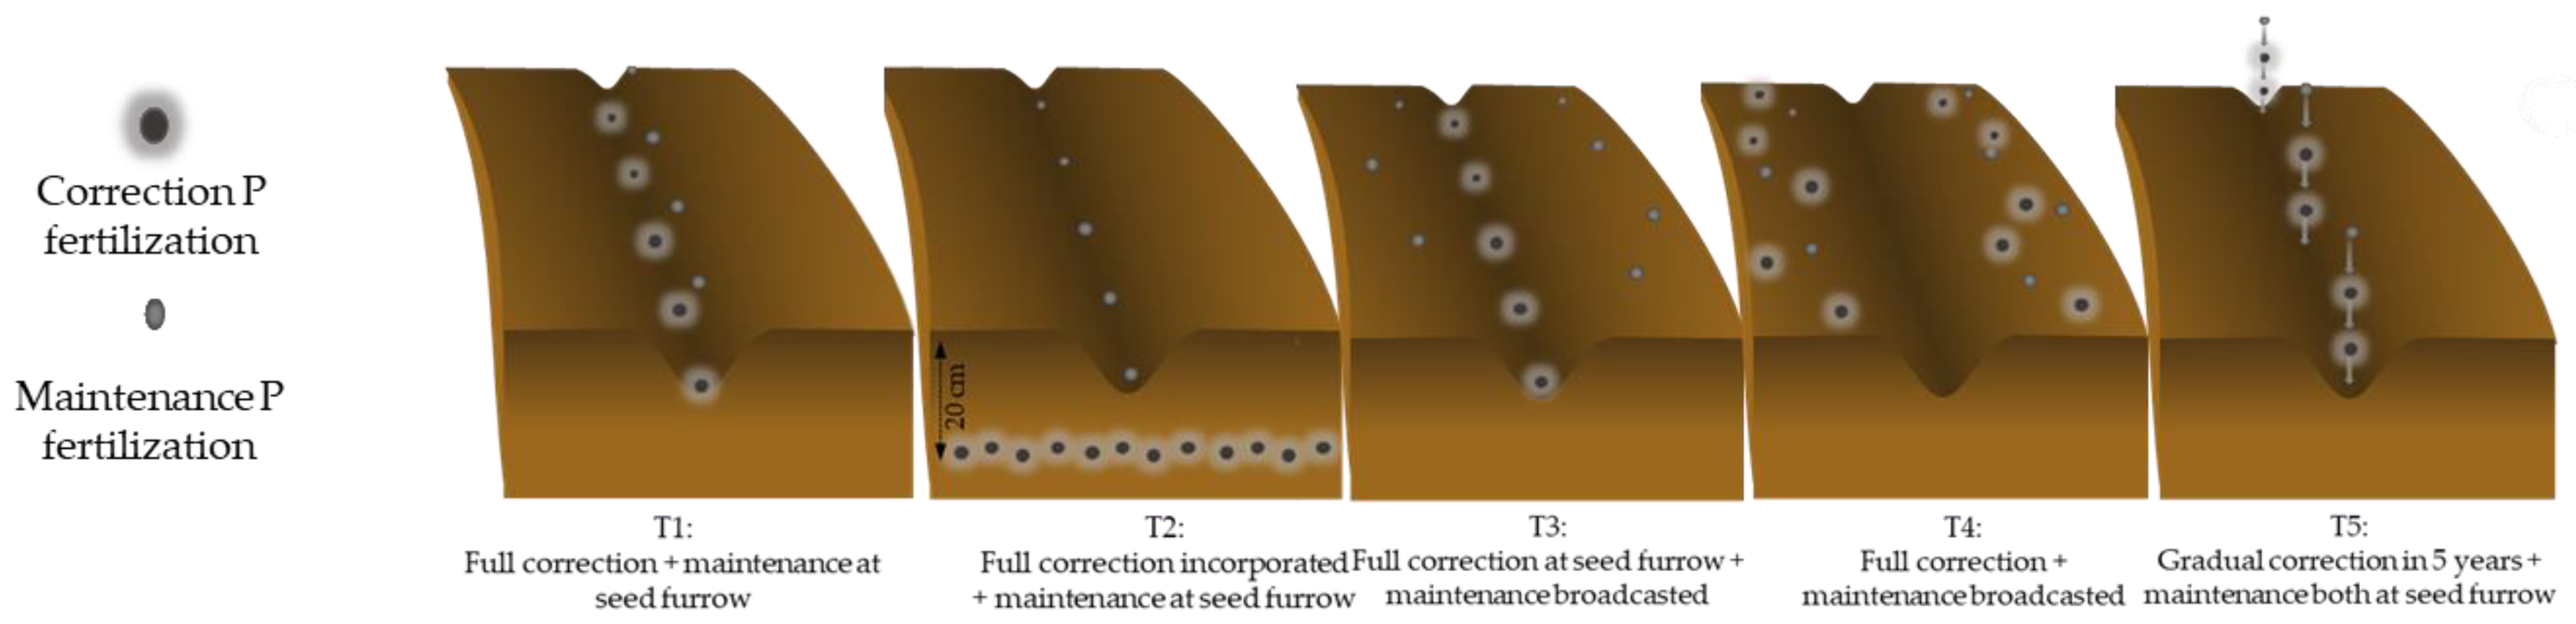
Two experiments were set up side-by-side in Querência, Mato Grosso State, Brazil (12°6′5.3″ S, 52°25′11.2″ W, 320 m altitude), in order to predict better P management in building up soil P availability for new cropped areas. The soil is classified as Latossolo Vermelho-Amarelo Distrófico according to Brazilian Soil Classification System [18], corresponding to Hapludox according to Soil Taxonomy [19]. The regional climate is classified as Aw according to Köppen. The accumulated annual precipitation and temperature range in each crop season were: 2014/15: 1512 mm and 15 °C to 28 °C; 2015/16: 1758 mm and 18 °C to 30 °C; 2016/17: 1795 mm and 22 °C to 30 °C; 2017/18: 1890 mm and 23 °C to 37 °C; 2018/19: 2019 mm and 19 °C to 33 °C; and 2019/20: 1823 mm and 21 °C to 38 °C. Soil characterization for both experiments at the establishment is presented in Table 1.
The establishment of experiments was in October 2014, in a previous pastureland used for cattle grazing for nearly 20 years since opening the native forest. The region is located between Cerrado and Amazon Forest biomes. During the six consecutive years, a succession with soybean (Glycine max (L.) Merr.) as a cash crop was cultivated, and millet (Pennisetum americanum) as a cover crop, until 2019/20. Soybean variety M8372 IPRO was cultivated in the first season, and variety Bonus IPRO was cultivated in subsequent seasons. In the last season (2019/20), a second season of maize (Zea mays L.), cultivar DKB 290 PRO3, was grown after soybeans. The spacing between row was 0.45 m for soybean and maize, and millet was sown as broadcast (20 kg ha−1). Soybean was inoculated in all cycles, using two recommended doses (2 × 100 mL) of Bradyrhizobium SEMIA 5079 and SEMIA 5080 at 6 × 10⁹ units of colony formation mL−1 as concentration. It stands out that combined application of Bradyrhizobium and mineral P fertilizer increases the grain yield of soybean, as the inoculant enhances the plant’s access to nitrogen (N) by biological N fixation and the P fertilizer enhances access to P [20].
At the establishment of both experiments, 6 t ha−1 of lime at 0–20 cm was applied and incorporated, according to the soil analysis interpretation and local recommendations [21]. In addition, potassium (K), as KCl, was applied with the following doses of K2O: 240 kg ha−1 in 2014/15; 160 kg ha−1 in 2015/16; 140 kg ha−1 in 2016/17; and 90 kg ha−1 year−1 in the following seasons up to 2019/20. The K fertilization was carried out on the surface before sowing, under the same conditions for all treatments. In maize crop, we added a total of 160 kg ha−1 of N (applied at V2 and V4 stages), according to local recommendations [21].

2.2. Treatments

2.2.1. First Experiment—Phosphate Management for Soil P Buildup

The phosphate fertilizer management for soil P buildup was evaluated during six consecutive years (2014/15 to 2019/20), and consisted of five combined modes of applying phosphate fertilizer (correction—phosphate recommendation to buildup soil P levels; maintenance—phosphate recommended for annual crop production): T1: full correction + maintenance applied at seed furrow (considered as a control treatment); T2: full correction incorporated by plowing (0–20 cm) + maintenance at seed furrow; T3: full correction at seed furrow + maintenance broadcasted in soil surface; T4: full correction + maintenance both broadcasted in the soil surface; T5: gradual correction throughout five years + maintenance both at seed furrow. The illustration of the treatments can be seen in Figure 1.
The experimental design was in randomized complete blocks with three replications, distributed in a plot size of 396 m2 (11 × 36 m). The sources of phosphate were simple superphosphate (SSP; 18% P2O5) for correction and 02-28-00 (N-P2O5-K2O) formulation for maintenance, except for T5, which always received 02-28-00 formulation. Doses applied annually are presented in Table 2 and were defined according to plant demand and local recommendations [21]. The total P2O5 applied was 834 kg ha−1 for all treatments throughout the six seasons. Table S1 shows the cost and benefit of applying this dose in all treatments (Supplementary Material). It should be noted that with SSP, calcium (16% Ca) and sulfur (10% S) were also applied, while with 02:28:00 formulation a small amount of N was applied. During the experiment, the soil was analyzed every year, and there was no difference in the Ca and S soil contents within the treatments (data not presented); a great amount of Ca was supplied via liming similarly for all treatments. In the case of N, soybean supplies N via biological fixation, and in maize N was applied according to the crop demand, which should not be a big issue, given the amount applied together with the P source.

2.2.2. Second Experiment—Response to P Doses

The P response curve experiment was carried out in a randomized complete blocks design, with factorial design 6 (A) × 2 (B). Six doses of P2O5 were allocated (0, 60, 120, 180, 240, 300 kg ha−1) in factor A, and in factor B the mode of P fertilizer application was used (broadcasted or at seed furrow). The phosphate doses were applied in the first three years of experiment (2014/15 to 2016/17). Therefore, the area received a total of 0, 180, 360, 540, 720, and 900 kg ha−1 of P2O5 in the first three seasons, with SSP as phosphate source. From the fourth to the sixth seasons, a standard dose of 84 kg ha−1 of P2O5 was used for all treatments by 02-28-00 formulation. Each plot size presented 540 m2 (18 × 30 m). Table S2 shows the cost and benefit of each dose applied (Supplementary Material).

2.3. Crop and Soil Analysis

For both experiments, grain yield was determined by harvesting soybean and maize useful area of each plot with a combine, converted to kg ha−1, and expressing yields at a 130 g kg−1 moisture content. Accumulated grain yield was obtained by the sum of yield of the six-year period.
After the soybean season in the 2016/17 season, and after the maize season in the 2019/20 season (three and six years after establishment), the soil was sampled from two layers (0–10 and 10–20 cm), with three subsamples per experimental unit, using a shovel. Soil samples were dried (55 °C) and sieved through 2 mm prior to chemical sequential P fractionation following the methodology proposed by Hedley et al. [16], with modifications by Santos [22]. At each step, 10 mL of extractant was added to 0.5 g soil in a 15 mL centrifuge tube (1:20 soil: solution ratio) and shaken by an end-over-end (vertical rotator, 60 rpm) shaker for 16 h.
This technique uses chemical extractants sequentially in the same sample to progressively remove the most available to the most stable fractions of inorganic (Pi) and organic P (Po). Thus, the pools determined sequentially were as follows: (i) labile pool, corresponding to the Pi extracted by anion exchange resin (PiAER) and the Pi and Po extracted by 0.5 mol L−1 NaHCO3 at pH 8.5 (PiBIC and PoBIC); (ii) moderately labile pool, corresponding to the Pi and Po extracted by 0.1 mol L−1 NaOH (PiHID-0.1 and PoHID-0.1), and Pi extracted by 1.0 mol L−1 HCl (PiHCl); and (iii) non-labile pool, corresponding to the Pi and Po extracted by 0.5 mol L−1 NaOH (PiHID-0.5 and PoHID-0.5), besides the remaining P obtained by residual digestion (Presidual) with H2SO4+H2O2 in the presence of saturated MgCl2. Total P (Pt) in the alkali extracts (NaHCO3, 0.1 and 0.5 mol L−1 NaOH) was determined by digestion with sulfuric acid (H2SO4) and ammonium persulfate in an autoclave at 121 °C. The content of P in each extract was measured by the colorimetric method of Murphy and Riley [23], and organic P in alkali extracts was obtained by the difference between Pt and Pi.

2.4. Data Analysis

The data were submitted to the test of normality of residues (Shapiro–Wilk) and homogeneity of variances (Bartlett test or Breusch–Pagan). Afterwards, the results were submitted to analysis of variance and, when significant (p < 0.05 or p < 0.10), the averages were compared using the Tukey test at 5 or 10% error probability (qualitative variables) and regression with evaluation of the predictive capacity of the proposed model (quantitative variable). Statistical analyses were performed in RStudio software and graphics in SigmaPlot software.

3. Results and Discussion

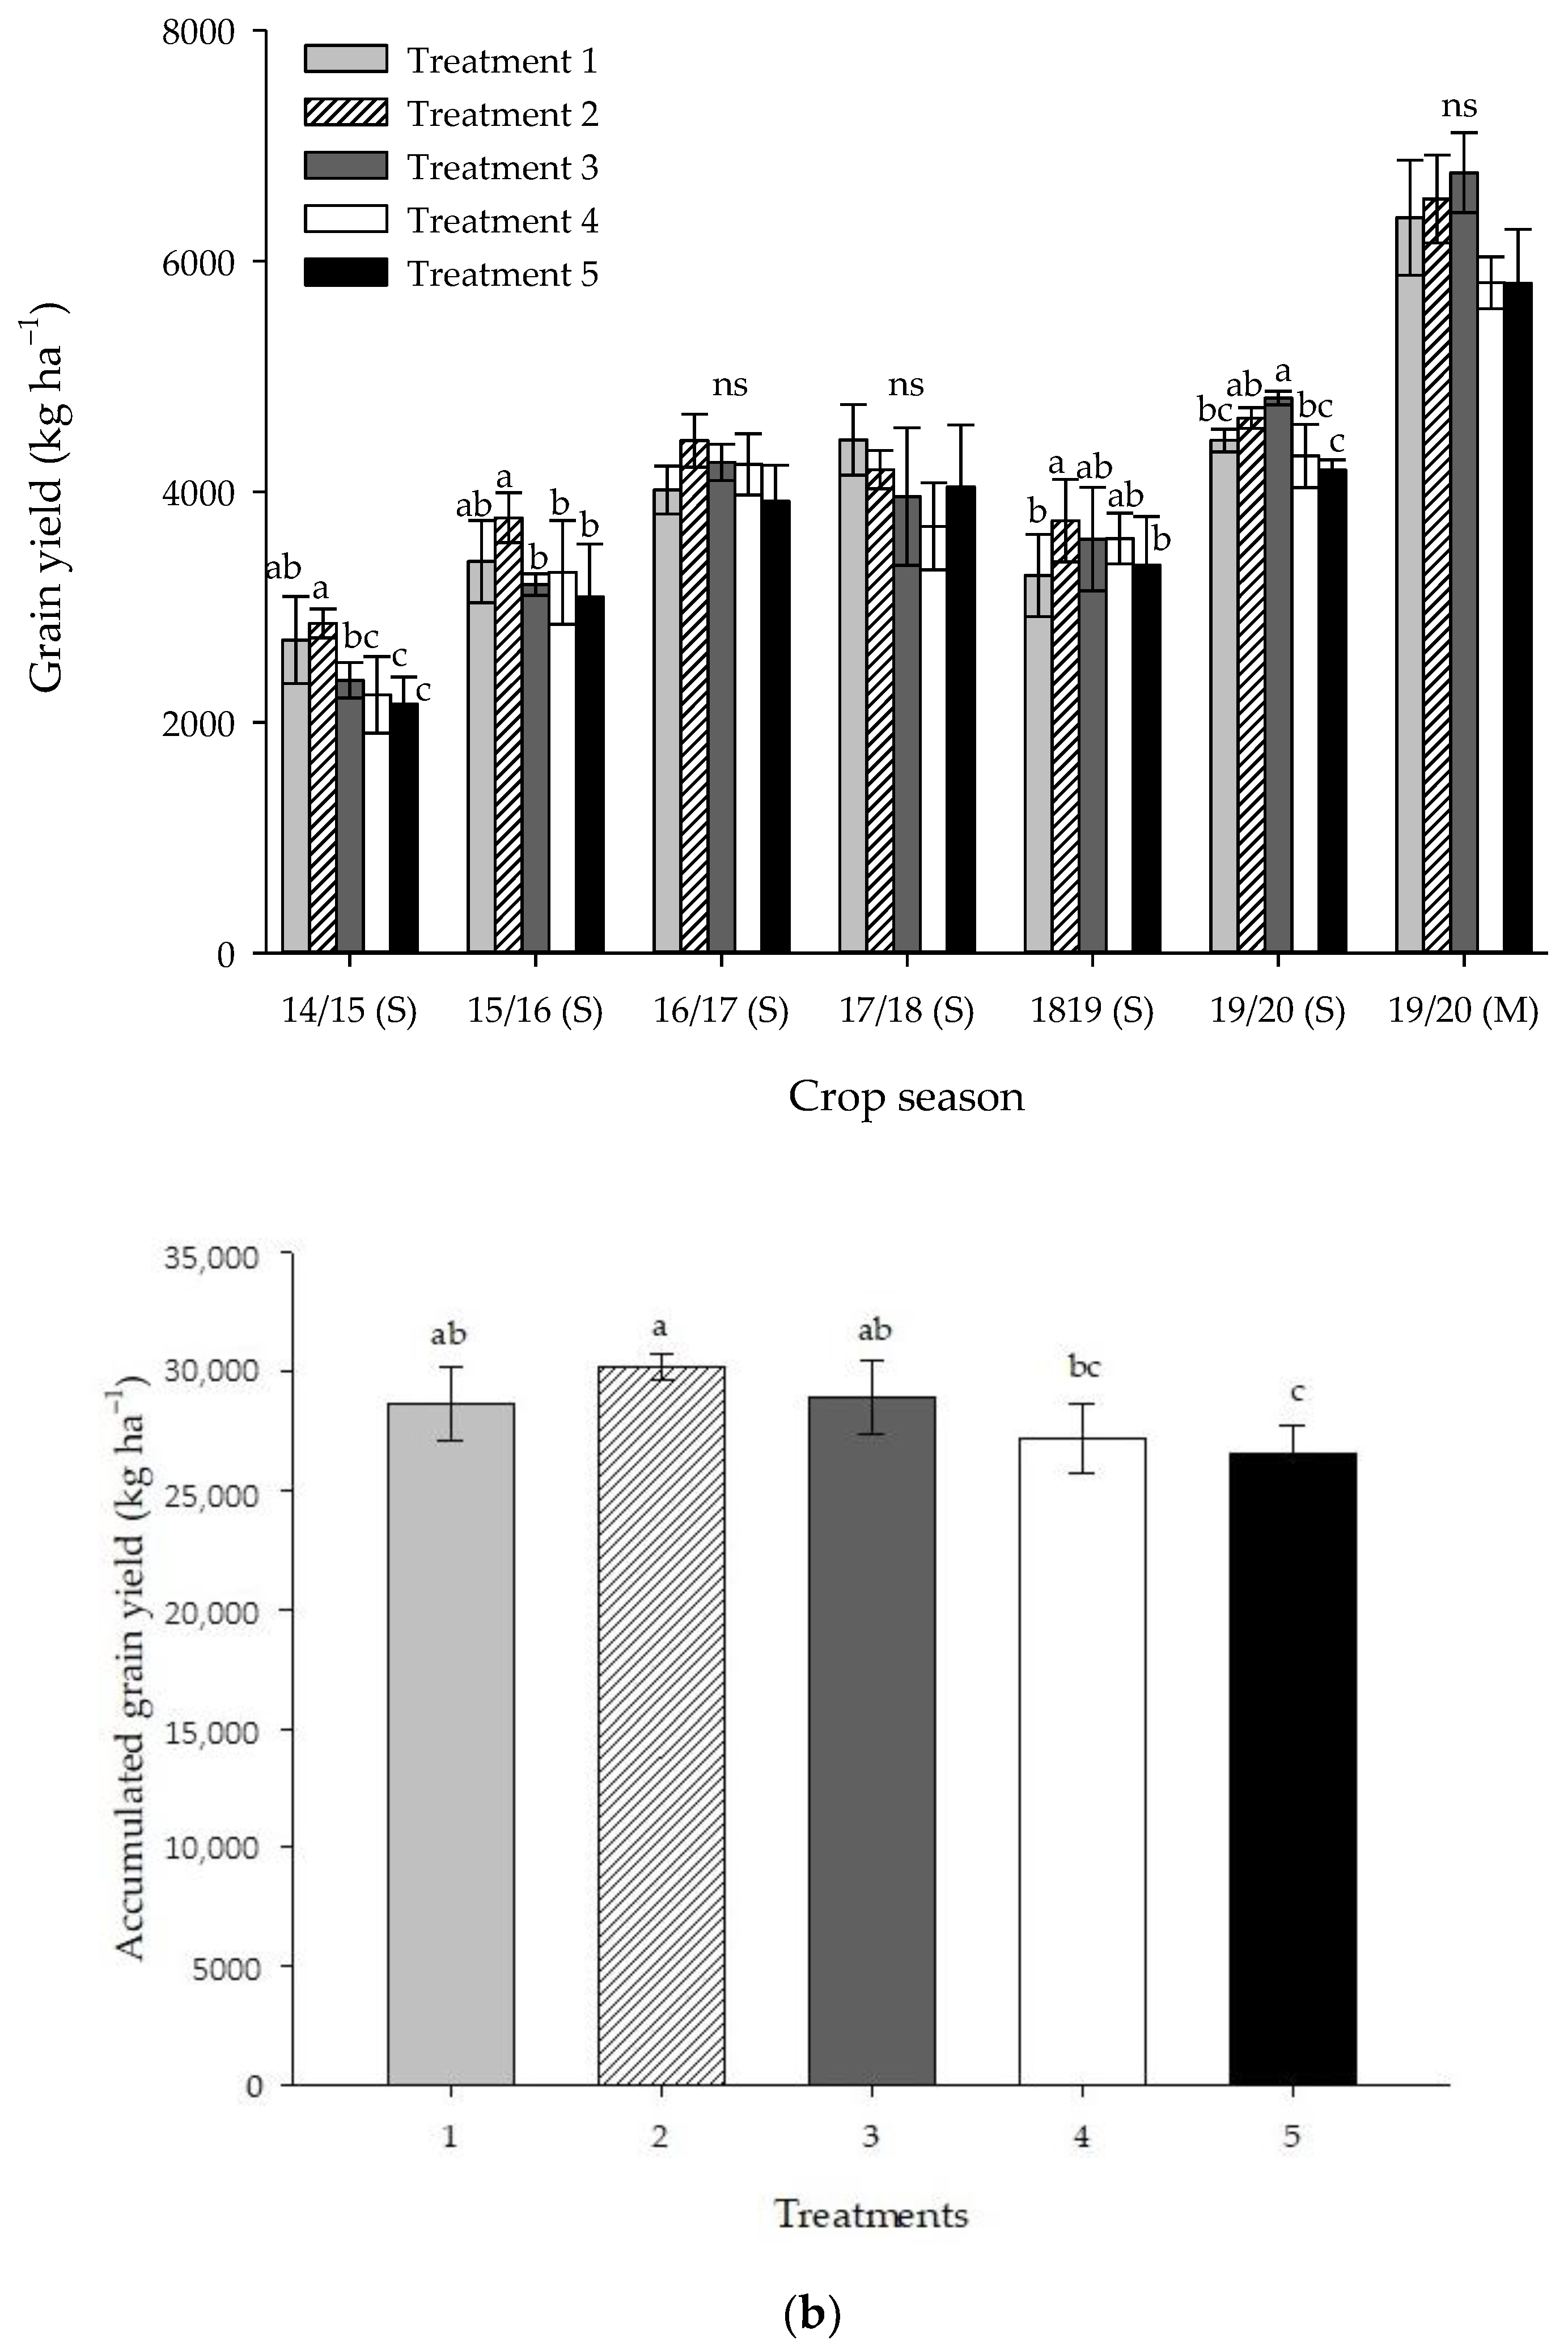
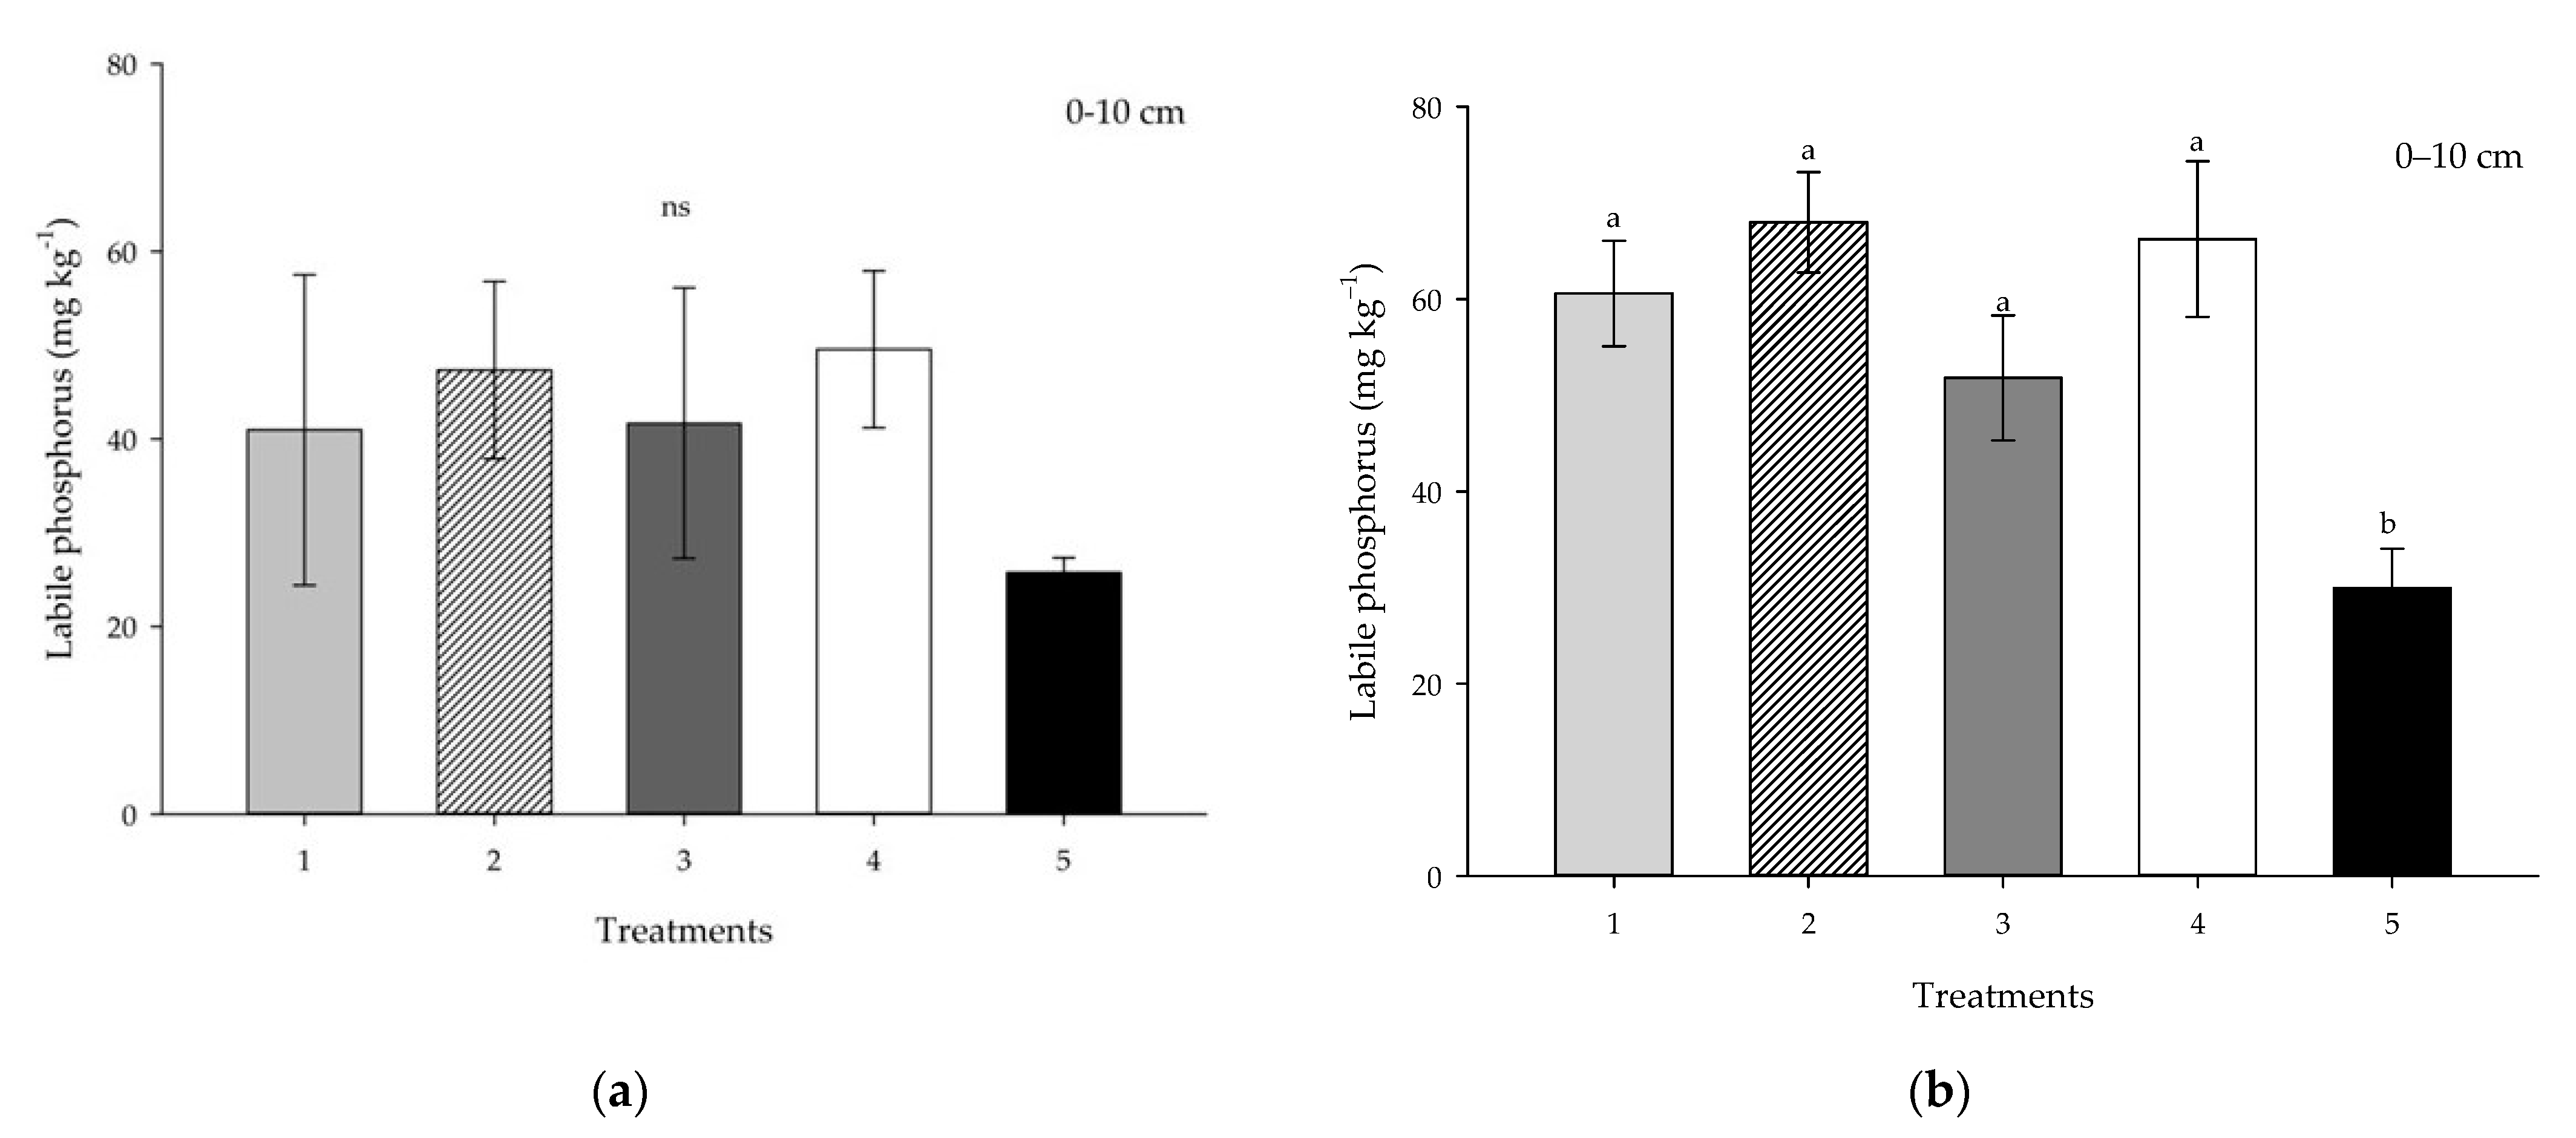
3.1. Phosphate Management for Soil P Buildup

The initial phosphate application for soil P buildup (correction) to a sufficient level for satisfactory crop development is mandatory in new cropping areas of Brazilian Cerrado [12]. The results of the applied P fertilizer full correction incorporated + P maintenance at seed furrow (T2) were the best for soybean grain yield in most seasons, although not significant in some cases. Consequently, the highest accumulated grain yield was under this treatment (Figure 2a,b). This management (T2) was considered the referenced one, as it is the most practiced by farmers in the region and is also referred to as the most practical and economical for opening of new cropping areas in the Cerrado region of Brazil [1,10,12]. After soil P buildup, the application of P for maintenance at seed furrow through periodic fertilization aims only to replace the P exported by harvesting [4,11], which is shown to be the most efficient way for better crop production.
The lowest grain yield was observed with gradual P correction applied at seed furrow (T5), evidencing the remarkable effect of soil P buildup in a single moment for better crop yield (Figure 2). Considering the accumulated grain yield, T2 resulted in 13.7% more grain yield compared to T5 (Figure 2b), with the extra cost of phosphate fertilizer being practically the same, so T2 resulted in higher cost benefit (Table S1), highlighting the importance of the common practiced management as a better option. Oliveira et al. [12] highlighted that the initial soil P correction promoted an early crop yield response, and they observed a consistent positive effect, which lasted throughout the entire duration of the experiment (16 years). It stands out that the initial P buildup had a residual accumulated effect over time, proved by T5 presenting lower grain yield response even after six years of cultivation (soybean 19/20), although the total P dose applied at this time was the same for all treatments (Figure 2a). Thus, this strategy should be avoided for soil P buildup in opening Cerrado areas. In addition, it should be noted that with full correction + maintenance P both broadcasted (T4), the yield was also smaller than the recommended management (T2), possible due to limited P access by the rooting system in the top surface layer where the fertilizer accumulated.
Treatments 1 and 3 resulted in intermediate grain yield (Figure 2). They both have the corrective fertilization at seed furrow in common. According to Sousa and Lobato [21], incorporation is more indicated for soil P buildup, to provide a greater volume of soil with good conditions for plant accessing P, water, and other nutrients for a more developed rooting system. In addition, this practice is indicated for P doses higher than 100 kg ha−1 of P2O5, and when smaller doses are used, the application at seed furrow should be recommended. The latter case is indicated for promoting better P use efficiency by plants.
Soil labile P was not significantly affected by distinct fertilizer P management in the 0–10 cm layer after three years of cultivation (Figure 3a); on the other hand, in the 0–20 cm layer, T2 resulted in higher labile P (Figure 3c), probably due to the mechanical P incorporation. After six consecutive years, some differences were observed in both layers (Figure 3b,d), which is explained by an early adsorption of phosphate ions from fertilizer with the surface of positively charged Fe and Al oxi-hydroxides in the previous seasons; over time a soil saturation of the adsorption sites reduced such interaction, maintaining more P available to plants in a cumulative effect [12]. Under the initial full P buildup dose, irrespective of the application mode (broadcasted or at seed furrow), there was an increase in labile P in the layer 0–10 cm (T1–T4; Figure 3a,b), evidencing the importance of management in Cerrado soils for increasing P availability, although not significant yet at three years’ evaluation in 0–10 cm layer. Broadcast P application, even incorporated uniformly at 0–20 cm or not (T2 and T4), reduced P-binding intensity to soil colloids in the top 10 cm over the time, gradually increasing the labile P fractions (Figure 3a,b), which was also observed by other authors [8,12,24].
Gradual P buildup at seed furrow (T5) resulted in lower labile P in the 0–10 cm layer after six years of application (Figure 3b). In this management, an amount of P greater than crop requirement (P extraction and exportation) was applied at seed furrow annually, aiming at the gradual P accumulation in the soil, potentially reaching the desired P availability after a few years [25]. However, although the full amount applied was the same after six years, the content of labile P in the soil was not. Possibly, the crop rows rarely overlapped perfectly for two or more crop seasons, so this application may have contributed to increasing P fixation into the soil components (1:1 clay and Fe oxi-hydroxides). Concentrating most P in specific rows/depths does not improve the overall labile P concentration [8,12].
High labile P contents were observed at 10–20 cm when the P buildup fertilization + P maintenance were performed both at seed furrow (T1) after six years (Figure 3d). Otherwise, when fully broadcasted (T4), the P accumulation was detected only on the top 10 cm layer (Figure 3b), but not at 10–20 cm (Figure 3d), which is also supported by literature [4,9,26]. This performance resulted in limited P access by plants, reducing the grain yield (Figure 2). Although broadcasting P fertilizer management has been a growing practice in Brazil more recently, due to operational purposes, which allows for the best timing at sowing, it has generated controversies regarding its efficiency due to the low soil P mobility, which is also related to the effect of prolonged droughts on P absorption [12]. Note that small grain yields were detected under this management (T4) for six consecutive years (Figure 2).

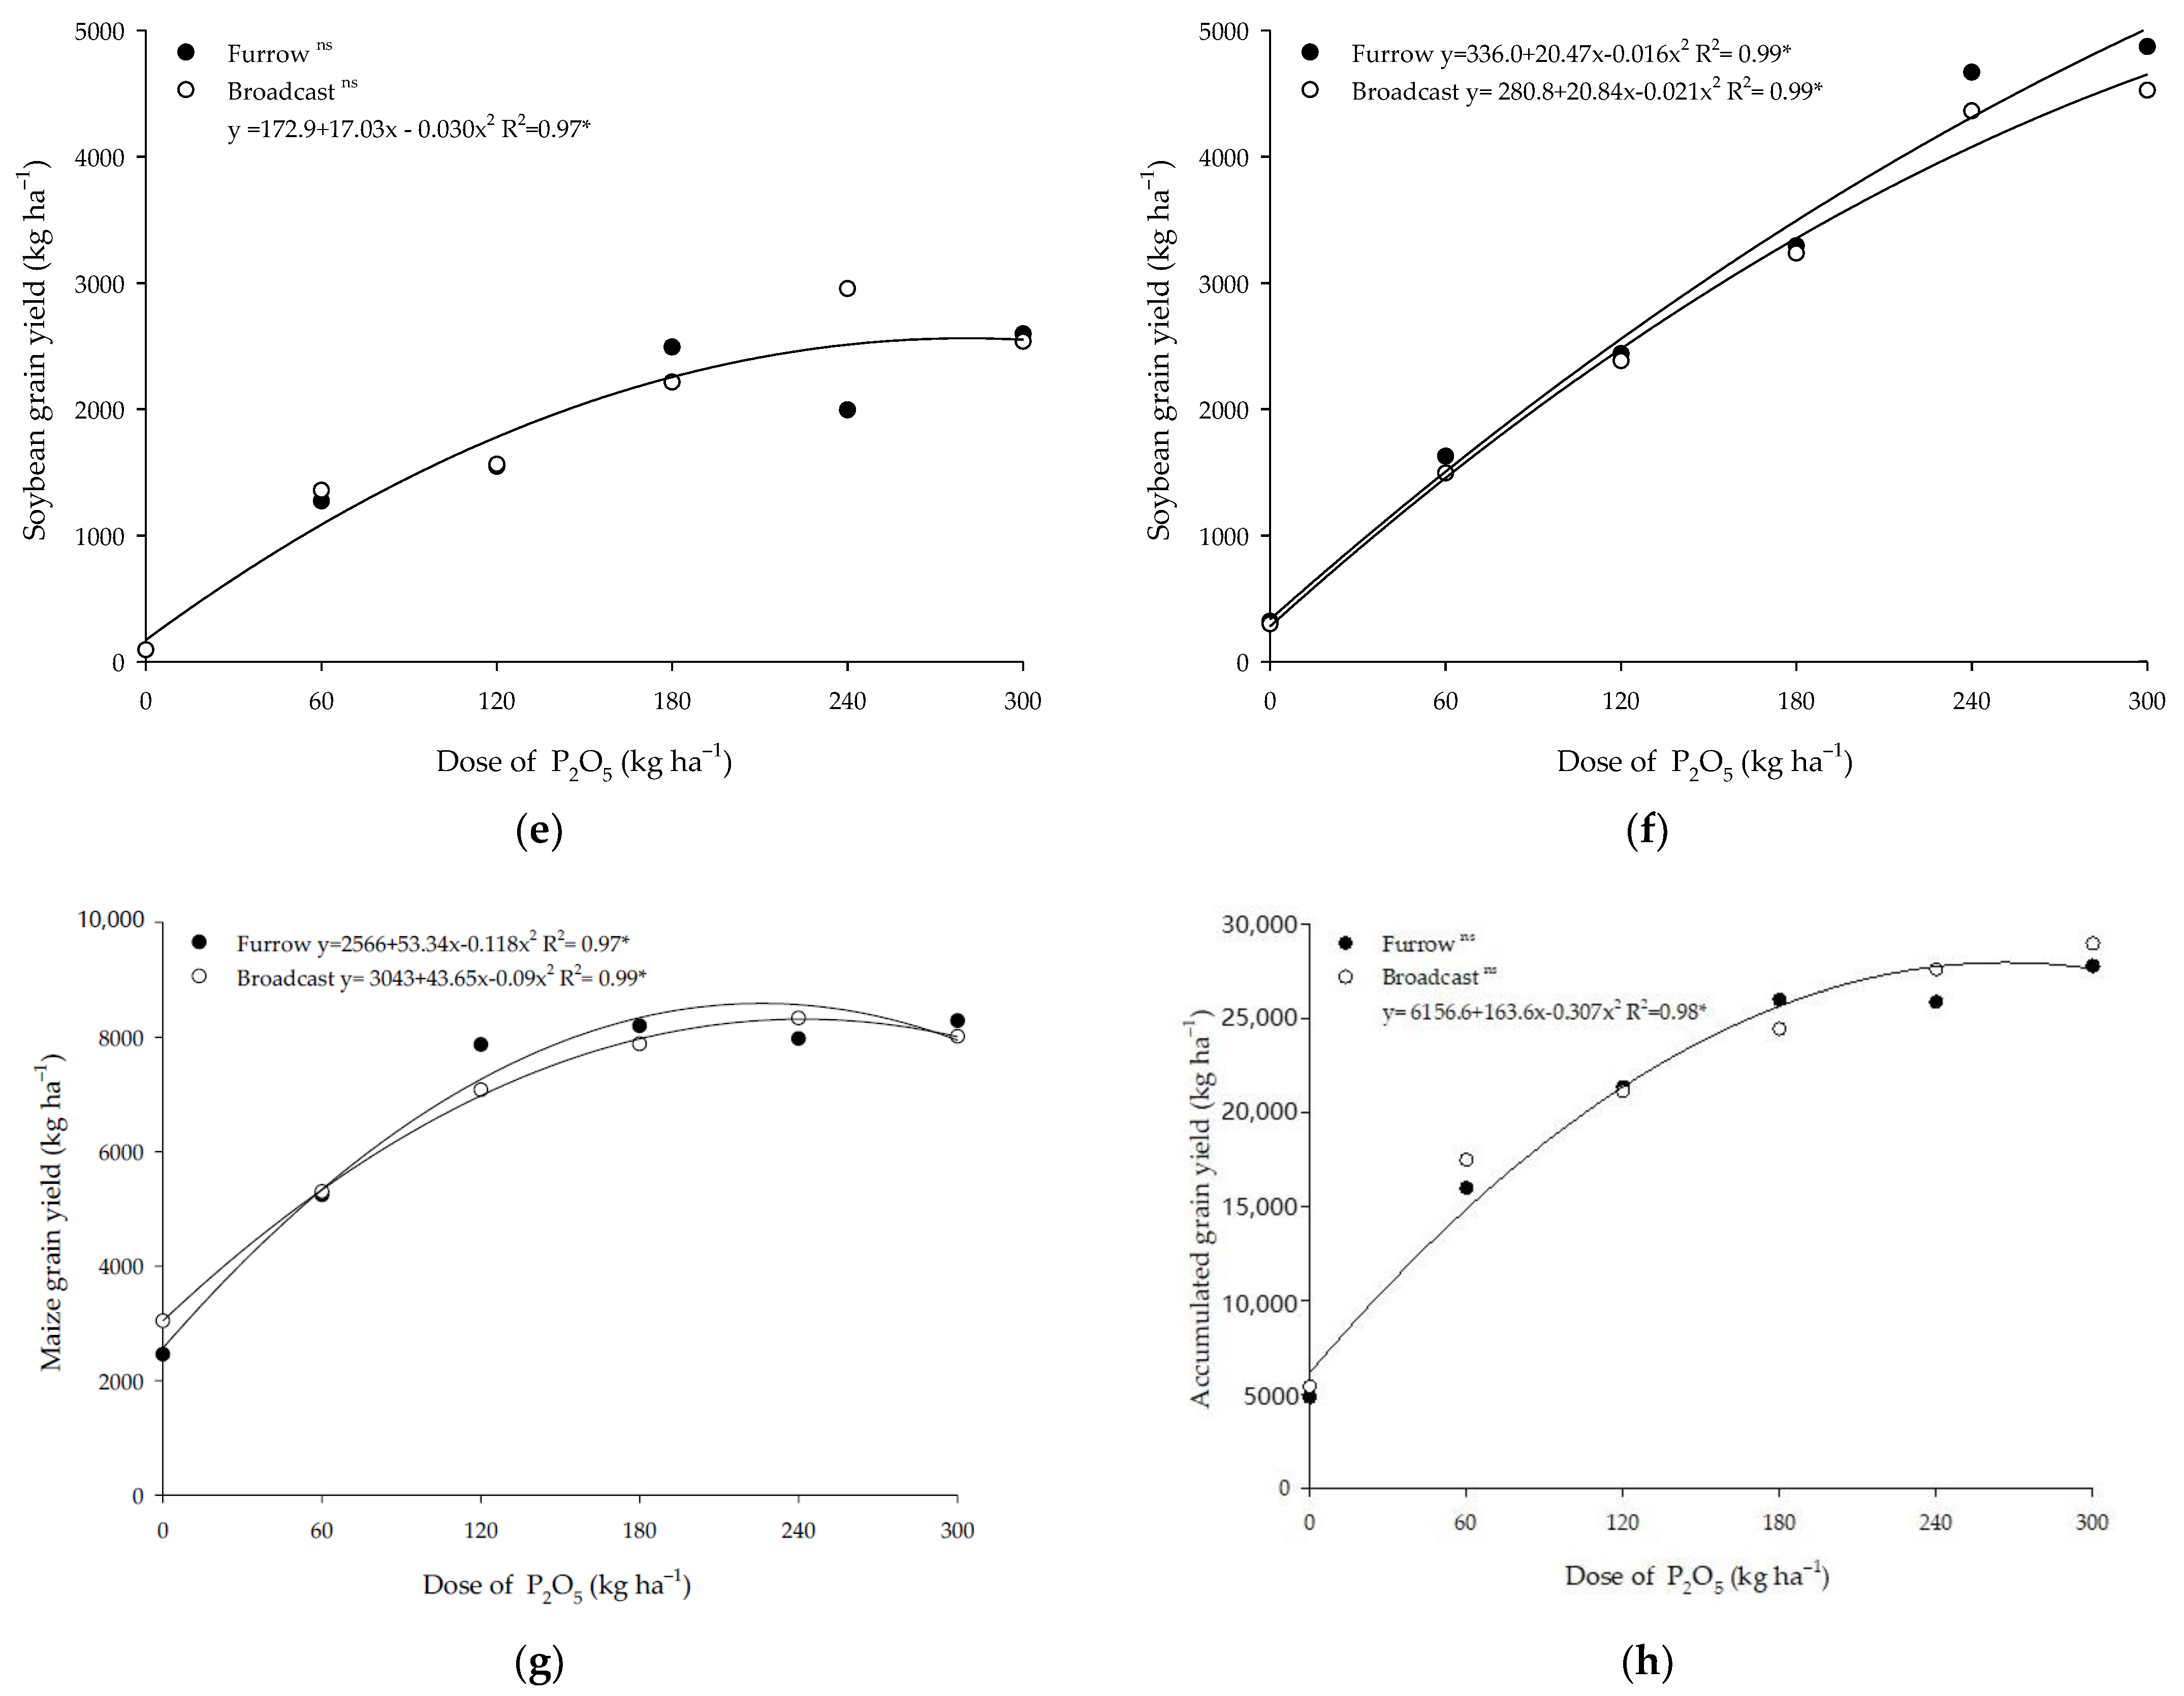
3.2. Phosphate Doses Response for Opening New Cultivated Areas

The increase in grain yield as function of P doses (P2O5) was applied and adjusted to a quadratic model for all evaluated seasons, regardless of application mode, seed furrow, or broadcasted (Figure 4). Except for the 2014/15 and 2019/20 soybean seasons, the estimated dose for the highest yield was nearly 250 kg ha−1 of P2O5. In the first season (2014/15), the dose for highest grain yield was very high (Figure 4a) due to the low original available P content in the soil (Table 1); in the 2019/20 season, the required dose for maximum yield was also higher, probably due to more P demand by plants (Figure 4f). As the dose of P increased, the cost of P fertilizer proportionally increased. However, it also increases the grain yield, which resulted in greater profit per hectare (Table S2) up to the maximum economical return dose.
When considering the accumulated production, maximum grain yield should be obtained under 266 kg ha−1 of P2O5, regardless of the application mode (Figure 4h). Similar results were reported by Moreira et al. [27] in an opening Cerrado area (268 kg ha−1 of P2O5), evaluating two seasons of soybean. Sousa and Lobato [28] observed the largest increments with P fertilizer doses between 60 and 280 kg ha−1 of P2O5. In addition, Fageria et al. [29] reported that the annual dose of 120 kg ha−1 of P2O5 was the most responsive for grain yield when broadcasted without incorporation, although the authors did not evaluate higher doses than that. Carvalho et al. [30] observed maximum grain yield (average of two crop seasons) of the common bean under 239 kg ha−1 of P2O5 in Mozambique (similar conditions of climate and soil as the Cerrado Region of Brazil). On the other hand, Mariussi et al. [31] verified that in soils with high fertility, soybean plants did not respond to P application (up to 280 kg ha−1 of P2O5). In sugarcane, corrective (150 kg ha−1 P2O5 broadcast and incorporated) and maintenance P (40 kg ha−1 P2O5 per year) fertilization should be always considered due to the higher yield response over the cultivation cycles [32].
After six seasons, the soil residual effect of phosphate doses applied annually during the first three years linearly increased all soil P fractions in both layers (0–10 and 10–20 cm), regardless of the application mode, at seed furrow or broadcasted (Figure 5). Similarly, Mahmood et al. [33] observed a linear increase in all P fractions after 12 years of annual P doses application (0, 50, 100, and 200 kg ha−1 of P2O5), which is expected, since the adsorption sites of P are initially saturated by the first applications and the latter P added trend to stay in more available forms, which was similarly observed in our results. The lack of response to the fertilizer application mode in soil P fractions is consistent with a lack of response in grain yield for most harvests (Figure 4), which is controversial to the response observed in the first experiment, where the maintenance P applied on seed furrow (T2) reported better yield results (Figure 2). However, better results are expected when smaller doses are applied closer to the seed furrow, which would not be true for higher doses. This may explain the similar crop responses to seed furrow or broadcasted. Oliveira et al. [9] also found no difference between application modes in the grain yield of soybean and maize, and highlighted that when the bulk soil volume already presents sufficient P levels, they may have no response to localized P applications.
The labile and moderately labile P fractions relative to the total P in the soil increased proportionally to the increase in P doses applied, which was more evident at 0–10 cm, but was also detected at 10–20 cm (Figure 5a–d and Figure 6). Considering the average of P application mode (seed furrow or broadcast), labile P (PiAER + PiBIC + PoBIC) represented 9.4 to 20.1% of the soil total P at 0–10 cm, and 9.6 to 12.3% at 10–20 cm, for doses from 0 to 300 kg ha−1 of P2O5, respectively. Moreover, the moderately labile P fraction (PiHID-0.1 + PoHID-0.1 + PHCl) represented 32.1 to 42.4% of the soil total P at 0–10 cm and 33.5 to 41.9% at 10–20 cm, which was also contrasted according to the doses from 0 to 300 kg ha−1 of P2O5, respectively. Those results are in accordance with Rodrigues et al. [3], in which the labile P represented <20% of total P and moderately labile varied from 27 to 36% in cultivated areas of Brazilian Cerrado. Otherwise, higher doses of P resulted in lower proportions of soil non-labile P fractions (PiHID-0.5 + PoHID-0.5 + Presidual) relative to the total P (Figure 5e,f). The non-labile P constituted the greatest proportion, representing 38.5 to 58.5% at 0–10 cm and 45.8 to 56.9% at 10–20 cm, with a small but significant increment according to increasing P fertilizer dose. Similarly, other authors [3,34,35] verified that non-labile P fractions constituted the largest fraction of the total P in the soil, representing, in general, more than 50% of the total P.
Thus, there is evidence that higher annual P doses resulted in more labile P fractions after six years due to the progressive saturation of the soil adsorption P sites, reducing the adsorption energy and, consequently, increasing the potential P desorption and its availability over the years [36]. Increasing the soil available P to adequate levels will promote better crop grain yield and consequently improve P use efficiency, which will push for rational use of P fertilizers for the coming cropping seasons, making this non-renewable resource more sustainable for our next generations.
The adequate phosphate fertilizer management is essential for improving the grain yield in new Cerrado areas. In this context, the importance of corrective P fertilization for obtaining higher grain yield and promoting adequate levels of labile P accumulation in the soil was evidenced, with rational doses promoting promising yield results. Otherwise, if the farmers are not aware of soil P buildup, there should be necessary high doses of annual P fertilizer application, being the most effective for grain yield. In this case, it was nearly 250 kg ha−1 of P2O5.

4. Conclusions

Phosphate fertilizer management has a direct influence on crop yields in new Cerrado areas. The best management observed so far is the corrective phosphate fertilization incorporated at 0–20 cm and the maintenance P at seed furrow, presenting the highest crop yield and more labile P in the soil.
Relative to crop responses on P fertilizer doses, when higher annual P doses were used during the first three years of cultivation the grain yield was substantially improved, with a maximum crop response of about 250 kg ha−1 of P2O5, irrespective of application mode, which also expressively improved the soil labile P fractions.
Soil P dynamics are complex in tropical regions, and understanding the adequate P fertilizer dose/source management is essential in expansion areas of Brazilian Cerrado. Our results show the importance of corrective phosphate fertilization for higher crop yield. In addition, when corrective P fertilization is performed, the application mode has little relevance in crop yield. These results provide an essential reference for orientating P management decisions in sustainable agricultural systems.
The application of high doses of P results in high P accumulation in the soil (called legacy P). Future research should evaluate the use of different plant species for recycling this legacy P accumulated over the years, reducing the dependance on external P inputs.

Supplementary Materials

The following supporting information can be downloaded at: https://www.mdpi.com/article/10.3390/agronomy13010158/s1, Table S1. Cost benefit in each treatment in six years of the first experiment–phosphate management for soil P buildup; Table S2. Cost benefit in each treatment in six years of second experiment–response to P doses.

Author Contributions

Planned and designed the research: M.J.H., V.P.V. and P.S.P.; Performed the experiments: M.J.H. and V.P.V.; Performed the laboratorial analysis: L.F.G., A.P.B.T. and M.M.M.; Analyzed the data: L.F.G. and P.S.P.; Wrote and revised the article: L.F.G., V.P.V., P.S.P., M.M.M. and P.S.P. All authors have read and agreed to the published version of the manuscript.

Funding

This research received no external funding.

Data Availability Statement

The datasets generated during and/or analyzed during the current study are available from the corresponding author on reasonable request.

Acknowledgments

All authors appreciate the collaboration of SLC Agrícola SA for the field technical assistance.

Conflicts of Interest

The authors declare no conflict of interest.

References

  1. Lopes, A.S.; Guilherme, G. A career perspective on soil management in the Cerrado region of Brazil. Adv. Agron. 2016, 137, 1–72. [Google Scholar] [CrossRef]
  2. Dias, L.C.P.; Pimenta, F.M.; Santos, A.B.; Costa, M.H.; Ladle, R.J. Patterns of land use, extensification, and intensification of Brazilian agriculture. Glob. Chang. Biol. 2016, 22, 2887–2903. [Google Scholar] [CrossRef]
  3. Rodrigues, M.; Pavinato, P.S.; Withers, P.J.A.; Teles, A.P.B.; Herrera, W.F.B. Legacy phosphorus and no tillage agriculture in tropical oxisols of the Brazilian savanna. Sci. Total Environ. 2016, 542, 1050–1061. [Google Scholar] [CrossRef]
  4. Nunes, R.S.; Sousa, D.M.G.; Goedert, W.J.; Oliveira, L.E.Z.; Pavinato, P.S.; Pinheiro, T.D. Distribution of soil phosphorus fractions as a function of long-term soil tillage and phosphate fertilization management. Front. Earth Sci. 2020, 8, 350. [Google Scholar] [CrossRef]
  5. Pavinato, P.S.; Rocha, G.C.; Cherubin, M.R.; Harris, I.; Jones, D.L.; Withers, P.J.A. Map of total phosphorus content in native soils of Brazil. Sci. Agric. 2021, 78, 1–5. [Google Scholar] [CrossRef]
  6. Elser, J.J.; Elser, T.J.; Carpenter, S.R.; Brock, W.A. Regime shift in fertilizer commodities indicates more turbulence ahead for food security. PLoS ONE 2014, 9, 1–7. [Google Scholar] [CrossRef] [Green Version]
  7. Pavinato, P.S.; Cherubin, M.R.; Soltangheisi, A.; Rocha, G.C.; Chadwick, D.R.; Jones, D.L. Revealing soil legacy phosphorus to promote sustainable agriculture in Brazil. Sci. Rep. 2020, 10, 15615. [Google Scholar] [CrossRef]
  8. Coelho, M.J.A.; Ruiz Diaz, D.; Hettiarachchi, G.M.; Dubou Hansel, F.; Pavinato, P.S. Soil phosphorus fractions and legacy in a corn-soybean rotation on Mollisols in Kansas, USA. Geoderma Reg. 2019, 18, e00228. [Google Scholar] [CrossRef]
  9. Oliveira, L.E.Z.; Nunes, R.S.; Figueiredo, C.C.; Rein, T.A. Spatial distribution of soil phosphorus fractions in a clayey Oxisol submitted to long-term phosphate fertilization strategies. Geoderma. 2022, 418, 11–12. [Google Scholar] [CrossRef]
  10. Lopes, A.S. Solos Sob “Cerrado”: Características, Propriedades e Manejo; Potafos: Piracicaba, Brasil, 1996. [Google Scholar]
  11. Kurihara, C.H.; Silva, W.M.; Dias, M.M.; Tsujigushi, B.P.; Silva, J.V.S. Gradual correction of phosphorus availability in the no-tillage system. Rev. Ceres 2016, 63, 256–264. [Google Scholar] [CrossRef]
  12. Oliveira, L.E.Z.; Sousa, D.M.G.; Figueiredo, C.C.; Nunes, R.S.; Malaquias, J.V. Long-term phosphate fertilization strategies evaluation in a Brazilian Oxisol. Agron. J. 2020, 112, 4303–4320. [Google Scholar] [CrossRef]
  13. Hansel, F.D.; Ruiz Diaz, D.A.; Amado, T.J.C.; Rosso, L.H.M. Deep banding increases phosphorus removal by soybean grown under no-tillage production systems. Agron. J. 2017, 109, 1091–1098. [Google Scholar] [CrossRef] [Green Version]
  14. Oliveira, L.E.Z.; Nunes, R.S.; Sousa, D.M.G.; Busato, J.G.; Figueiredo, C.C. Response of maize to different soil residual phosphorus conditions. Agron. J. 2019, 3, 3291–3300. [Google Scholar] [CrossRef]
  15. Meena, D.; Prajapat, M.; Meena, B.; Dotaniya, C.K.; Meena, M.D. Phosphorus management strategies in sustainable agricultural system. Biotica Res. Today 2022, 4, 338–340. [Google Scholar]
  16. Hedley, M.J.; Stewart, J.W.B.; Chauhan, B.S. Changes in inorganic and organic soil phosphorus fractions induced by cultivation practices and by laboratory incubations. Sci. Soc. Am. J. 1982, 46, 970–976. [Google Scholar] [CrossRef]
  17. Coelho, M.J.A.; Ruiz-Diaz, D.; Rodrigues, M.; Ono, F.B.; Kappes, C.; Zancanaro, L.; Pavinato, P.S. Soil phosphorus fate and its lability after a long-term phosphorus fertilizer strategy in Brazilian Oxisol. Arch. Agron. Soil Sci. 2021, 67, 1694–1707. [Google Scholar] [CrossRef]
  18. Santos, H.G.; Jacomine, P.K.T.; Anjos, L.H.C.; Oliveira, V.Á.; Lumbreras, J.F.; Coelho, M.R.; Almeida, J.A.; Araújo Filho, J.C.; Oliveira, J.B.; Cunha, T.J.F. Sistema Brasileiro de Classificação de Solos, 5th ed.; Embrapa Solos: Brasília, Brasil, 2018; 355p. [Google Scholar]
  19. Soil Survey Staff. Soil Taxonomy: A Basic System of Soil Classification for Making and Interpreting Soil Survey, 2nd ed; Natural Resources Conservation Service: Washington, DC, USA, 1999; 886p.
  20. Ulzen, J.; Abaidoo, R.C.; Ewusi-Mensah, N. On-farm evaluation and determination of sources of variability of soybean response to Bradyrhizobium inoculation and phosphorus fertilizer in northern Ghana. Agric. Ecosyst. Environ. 2018, 267, 23–32. [Google Scholar] [CrossRef]
  21. Sousa, D.M.G.; Lobato, E. Cerrado: Correção do solo e Adubação; Embrapa Informação Tecnológica: Brasília, Brasil, 2004; 416p. [Google Scholar]
  22. Santos, D.R. Dinâmica do fósforo em sistemas de manejo de solos. Doutorado, Doutor em Ciência do Solo, Universidade Federal do Rio Grande do Sul, Porto Alegre, Brasil, 2000. [Google Scholar]
  23. Murphy, J.; Riley, J.P. A modified single solution method for the determination of phosphate in natural waters. Anal. Chim. Acta 1962, 27, 31–36. [Google Scholar] [CrossRef]
  24. Barrow, N.J.; Barman, P.; Debnath, A. Three Residual Benefits of Applying Phosphate Fertilizer. Soil Sci. Soc. Am. J. 2018, 82, 1168–1176. [Google Scholar] [CrossRef]
  25. Kurihara, C.H.; Silva, W.M.; Tsujigushi, B.P.; Silva, J.V.S.; Dias, M.M. Adubação Fosfatada no Sistema Plantio Direto; Embrapa Agropecuária Oeste: Dourados, Brasil, 2014; pp. 1–4. [Google Scholar]
  26. Oliveira, L.E.Z.; Nunes, R.S.; Sousa, D.M.G.; Figueiredo, C.C. Dynamics of residual phosphorus forms under diferente tillage systems in a Brazilian Oxisol. Geoderma 2020, 367, 1–13. [Google Scholar] [CrossRef]
  27. Moreira, A.; Sfredo, G.J.; Moraes, L.A.C.; Fageria, N.K.; Moreira, A.; Sfredo, G.J.; Moraes, L.A.C.; Fageria, N.K. Agronomic efficiency of two types of lime and phosphate fertilizer sources in Brazilian Cerrado soils cultivated with soybean. Commun. Soil Sci. Plant Anal. 2014, 45, 2319–2330. [Google Scholar] [CrossRef]
  28. Sousa, D.M.G.; Lobato, E. Adubação Fosfatada em Solos da Região do Cerrado; Potafos: Piracicaba, Brasil, 2003; 16p. [Google Scholar]
  29. Fageria, N.K.; Moreira, A.; Castro, C. Response of soybean to phosphorus fertilization in Brazilian Oxisol. Commun. Soil Sci. Plant Anal. 2011, 42, 2716–2723. [Google Scholar] [CrossRef]
  30. Carvalho, M.C.S.; Nascente, A.S.; Ferreira, G.B.; Mutadiua, C.A.P.; Denardin, J.E. Phosphorus and potassium fertilization increase common bean grain yield in Mozambique. Rev. Bras. Eng. Agric. Ambient 2018, 22, 308–314. [Google Scholar] [CrossRef] [Green Version]
  31. Mariussi, L.M.; Liete, R.C.; Fretas, G.A.; Leite, R.C.; Santos, A.C.M.; Carneiro, J.S.S.; Silva, R.R. Phosphate fertilization on soils with improved fertility in the Brazilian Cerrado. Agron. Colomb. 2019, 37, 39–46. [Google Scholar] [CrossRef]
  32. Rein, T.A.; Santos Junior, J.D.G.; Sousa, D.M.G.; Carvalho, W.P.; Lemes, G.C. Corrective and maintenance phosphorus fertilization on sugarcane yield in Oxisols. PAB Pesqui. Agropecuária Bras. 2020, 56, 1–10. [Google Scholar] [CrossRef]
  33. Mahmood, M.; Yi, T.; Qingxia, M.; Waqas, A.; Sajid, M.; Xiaoli, H.; Zhaohui, W. Changes in phosphorus fractions and its availability status in relation to long term P fertilization in loess plateau of China. Agronomy 2020, 10, 1818. [Google Scholar] [CrossRef]
  34. Rodrigues, M.; Withers, P.J.A.; Soltangheisi, A.; Vargas, V.; Holzschuh, M.; Pavinato, P.S. Tillage systems and cover crops affecting soil phosphorus bioavailability in Brazilian Cerrado Oxisols. Soil Tillage Res. 2021, 205, 104770. [Google Scholar] [CrossRef]
  35. Rigon, J.P.; Crusciol, C.A.; Calonego, J.C.; Pavinato, P.S.; Azevedo, A.C.; Rosolem, C.A. Intensive crop rotations and residue quality increase soil phosphorus lability under long-term no-till in tropical soils. Soil Tillage Res. 2022, 223, 105446. [Google Scholar] [CrossRef]
  36. Abdala, D.B.; Ghosh, A.K.; Silva, I.R.; Novais, R.F.; Venegas, V.H.A. Phosphorus saturation of a tropical soil and related P leaching caused by poultry litter addition. Agric. Ecosyst. Environ. 2012, 162, 15–23. [Google Scholar] [CrossRef]
Figure 1. Illustration of the treatments of experiment 1, phosphate management for soil P buildup.
Agronomy 13 00158 g001
Figure 2. (a) Grain yield in each season; (b) Accumulated grain yield in six years of cultivation. S: soybean; M: maize; Treatment 1: full correction + maintenance at seed furrow; Treatment 2: full correction incorporated + maintenance at seed furrow; Treatment 3: full correction at seed furrow + maintenance broadcasted; Treatment 4: full correction + maintenance both broadcasted; Treatment 5: gradual correction + maintenance at seed furrow. Means followed by different letters differ by Tukey test at 10% error probability; ns: not significant. Error bars (±) indicate the standard deviations of 3 replicates.
Agronomy 13 00158 g002
Figure 3. Labile phosphorus in the soil after three (a,c) and six years (b,d) of the experiment establishment, at 0–10 and 10–20 cm layers. Treatment 1: full correction + maintenance at seed furrow; Treatment 2: full correction incorporated + maintenance at seed furrow; Treatment 3: full correction at seed furrow + maintenance on broadcast; Treatment 4: full correction + maintenance both broadcasted; Treatment 5: gradual correction + maintenance at seed furrow. Means followed by different letters differ by Tukey test at 5% probability; ns: not significant. Error bars (±) indicate the standard deviations of 3 replicates.
Agronomy 13 00158 g003aAgronomy 13 00158 g003b
Figure 4. Grain yield of soybean in each annual season during six consecutive years, 2014/15 (a), 2015/16 (b), 2016/17 (c), 2017/18 (d), 2018/19 (e), 2019/20 (f), maize in 2019/20 season (g), and accumulated grain yield of soybean + maize (h) as a function of phosphate doses at seed furrow or broadcast. *: significant at 5%; ns: not significant.
Agronomy 13 00158 g004aAgronomy 13 00158 g004b
Figure 5. (a,b) Labile P, (c,d) moderately labile P, (e,f) and non-labile P fractions at 0–10 and 10–20 cm soil layers, respectively, after six years of annual phosphate doses application at seed furrow or broadcasted. *: significant at 5%; ns: not significant.
Agronomy 13 00158 g005aAgronomy 13 00158 g005b
Figure 6. Relative contribution of labile, moderately labile, and non-labile P pools at 0–10 and 10–20 cm soil layers after six years of annual phosphate doses application at (a) broadcast and (b) seed furrow.
Agronomy 13 00158 g006
Table 1. Soil chemical and soil texture characterization at the experiments’ establishment in two top-soil layers (0–10 and 10–20 cm).
LayerpHH+AlCaMgKCEC 1P 2OM 3ClaySiltSand
(cm)CaCl2---------mmolc dm−3--------mg dm−3--------g kg−1-------
0–105.028.015.013.53.0159.58.016.540950541
10–204.528.013.09.01.3051.35.017.041611573
1 CEC: cation exchange capacity; 2 P—anion exchange resin; 3 OM: Soil organic matter.
Table 2. Doses of phosphate applied annually during the experiment.
P2O5 Application
(kg ha−1)
Year
2014/152015/162016/172017/182018/192019/20
T1–T4 (1)144.0 + 98.0 (2)90.0 + 98.0 (2)54.0 + 98.0 (2)84.0 (3)84.0 (3)84.0 (3)
T5 (4)157.0157.0157.0140.0140.084.0
(1) P source was simple superphosphate and 02:28:00 formulation. (2) The first dose is corrective and the second is maintenance during the first three years. (3) Corrective doses. (4) Corrective + maintenance, P source was 02-28-00 (N-P2O5-K2O) formulation. T1: full correction + maintenance at seed furrow; T2: full correction incorporated + maintenance at seed furrow; T3: full correction at seed furrow + maintenance broadcasted; T4: full correction + maintenance both broadcasted; T5: gradual correction + maintenance at seed furrow.
Disclaimer/Publisher’s Note: The statements, opinions and data contained in all publications are solely those of the individual author(s) and contributor(s) and not of MDPI and/or the editor(s). MDPI and/or the editor(s) disclaim responsibility for any injury to people or property resulting from any ideas, methods, instructions or products referred to in the content.

