1. Introduction
Photosynthesis is the essential process for plant growth, producing oxygen, and organic material [
1]. Chlorophyll (Chl) a and b are responsible for harvesting light and the conversion of light energy to stored chemical energy [
2]. The amount of solar radiation absorbed by a leaf is a function of photosynthetic pigment concentration. Hence, chlorophyll concentration is directly linked to the photosynthetic potential of a plant and to its primary production capacity [
3]. In addition, nitrogen is a necessary constituent of chlorophyll and many other proteins associated with leaf color, plant vigor, yield, and quality [
4].
Close relationships have been reported between leaf chlorophyll and nitrogen concentrations in a number of crops such as barley [
5], rice [
6], and wheat [
7]. Traditional measurements of chlorophyll concentration have involved spectrophotometric measures of chlorophyll in acetone [
8] or ethanol [
9]. Determination of nitrogen concentration is usually through the Kjeldahl method [
10]. These methodologies are direct and accurate, but are laborious, time-consuming, and destructive to leaves [
11]; therefore, the use of non-destructive techniques could be a useful tool because they are rapid and less expensive but are generally less accurate [
12].
In a recent review, leaf color charts, SPAD meters, and other digital chlorophyll meters such as the Hydro N tester and digital imaging (RGB) have been reported as adequate methodologies to establish relationships between N and chlorophyll concentrations in crops [
13]. This experiment was focused on the use of digital imaging (RGB).
Multi-spectral imaging technologies, used in satellites and drones, have provided novel methods for research in the agricultural sector [
14,
15]. Nevertheless, using the images from these devices requires several preprocessing steps and applying various algorithms which are often complex [
16,
17]. Out of the multi-spectral bands, the information provided by the red, green, and blue bands may suffice for conducting many studies. RGB (red–green–blue)-based image analysis has been applied in agriculture for various purposes such as weed identification [
18], quantification of turf grass color [
19], and quantitative analysis of variable physiological processes across leaf surfaces [
20]. This methodology has also been used to estimate chlorophyll concentration and nitrogen status in crops [
21]. Moreover, this is an instantaneous in situ measurement and is easily applicable for the cultivation of ornamental plants.
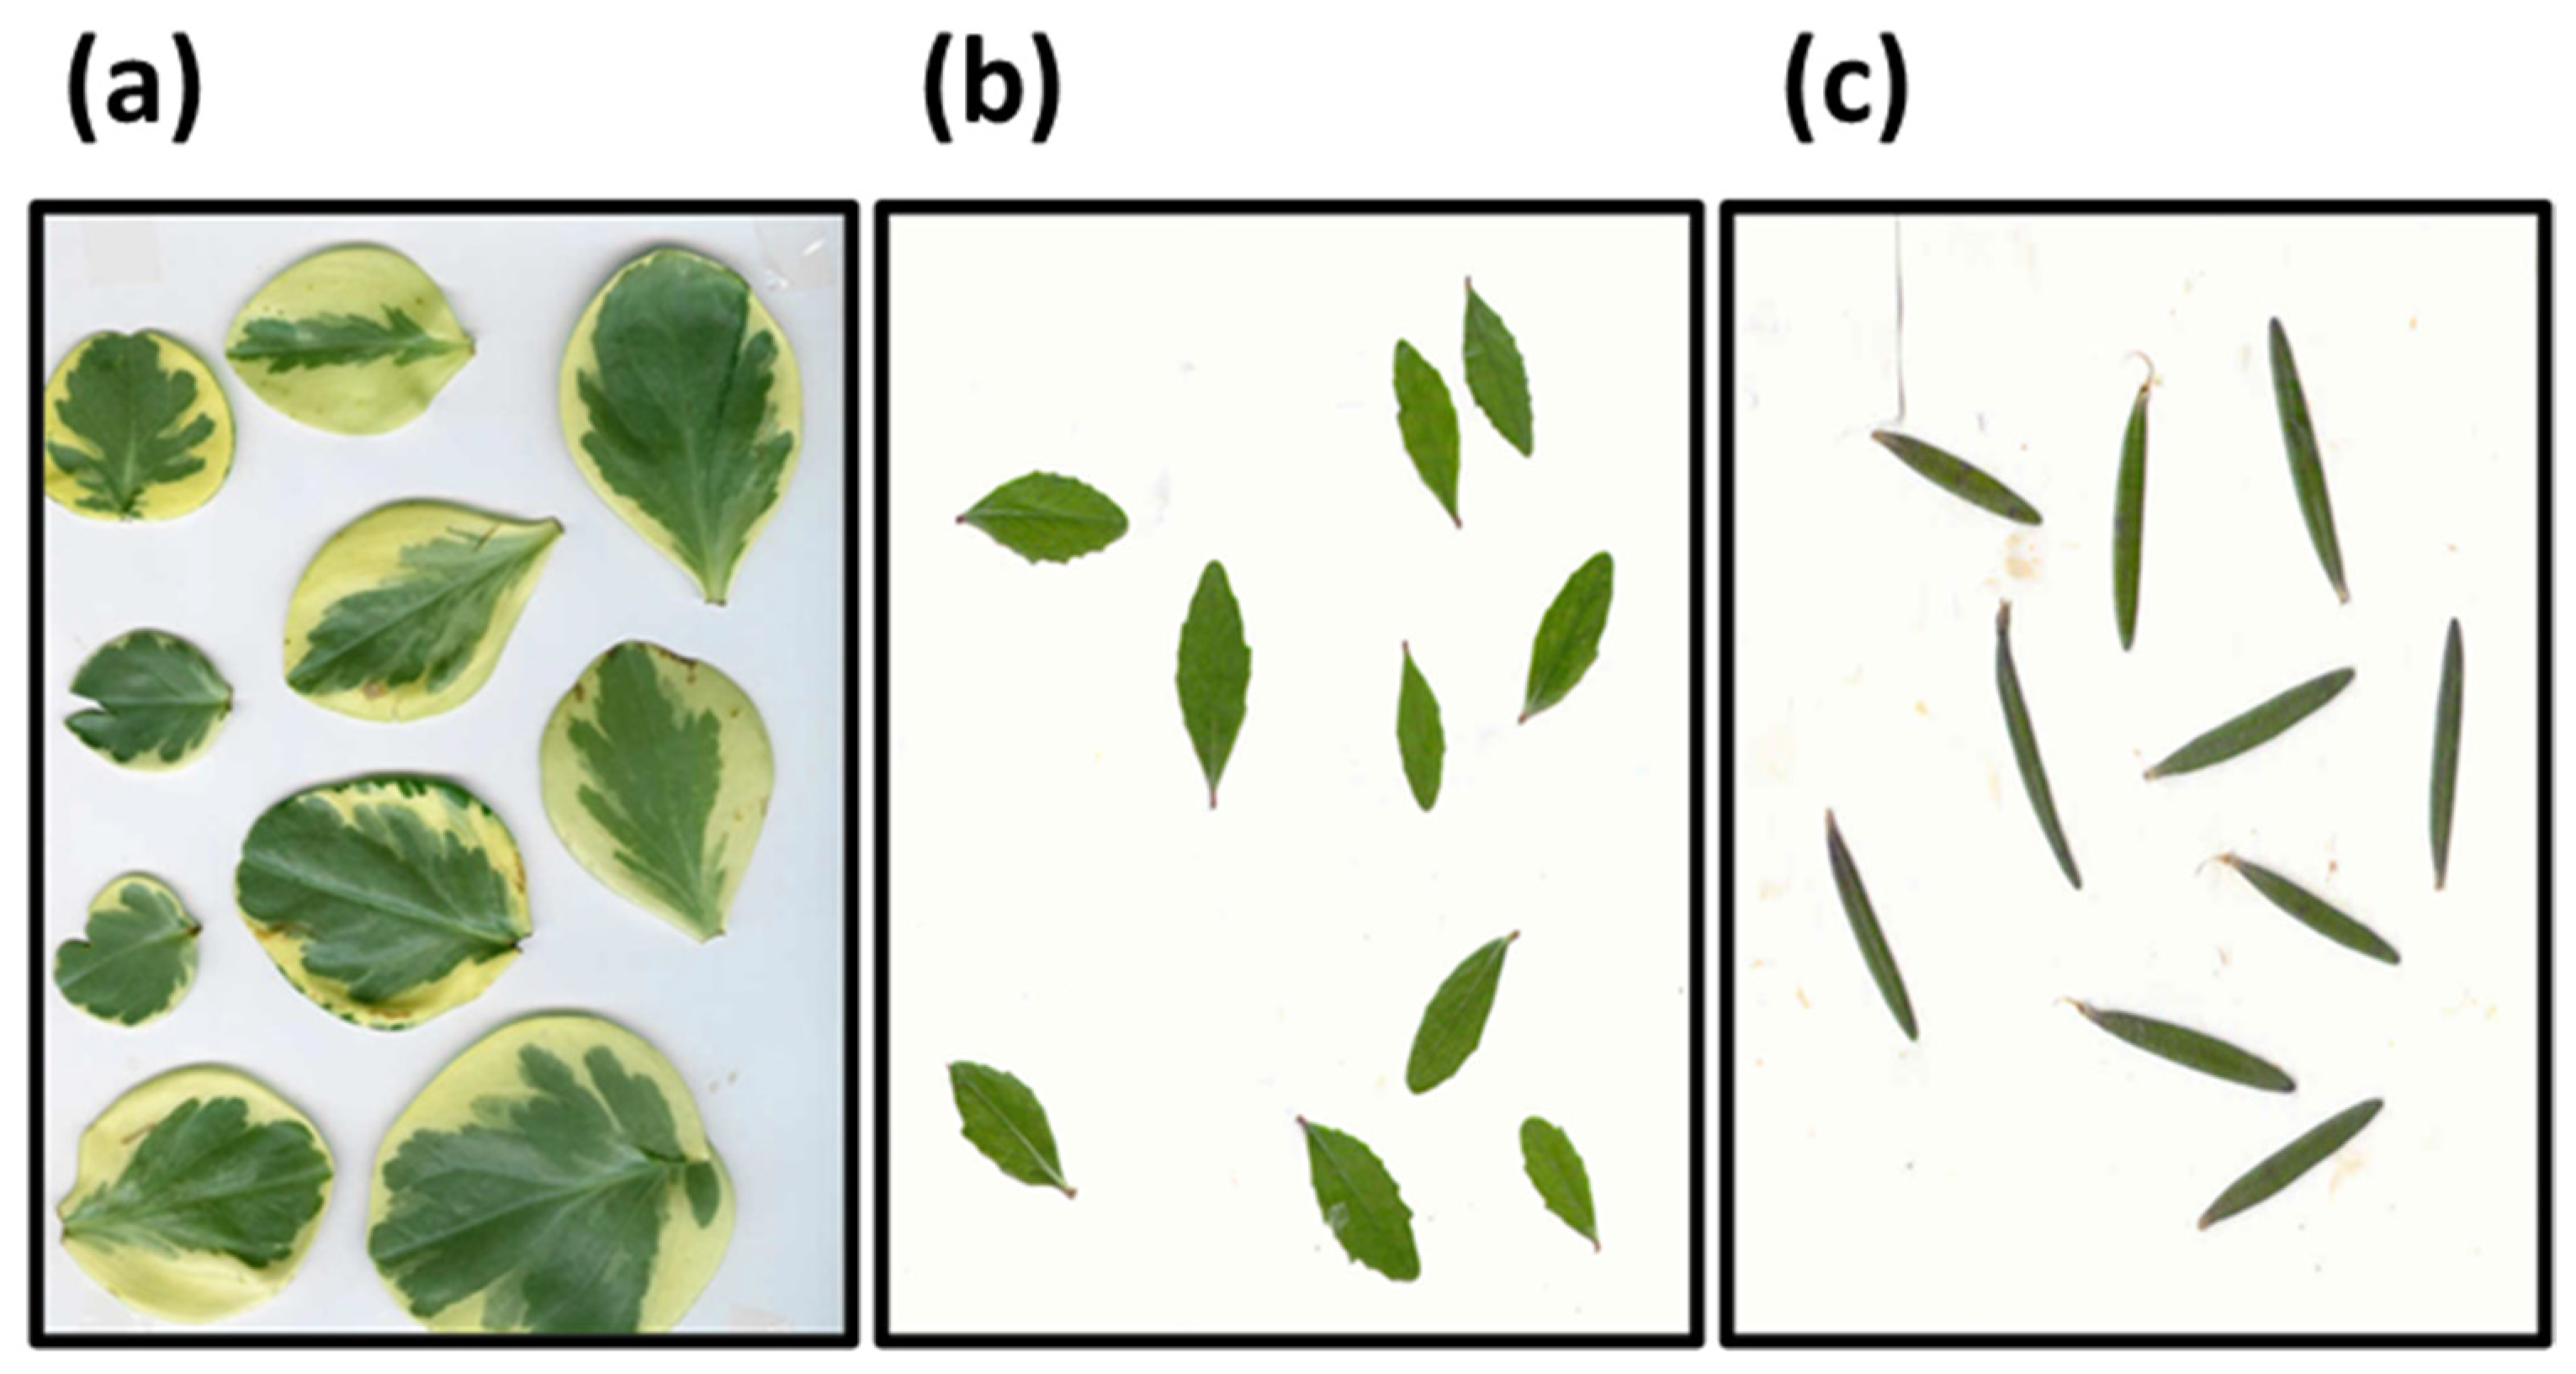
The economic importance of the production of potted plants, which has seen an increase on the south-eastern coast of Spain in recent years, indicates that it would be beneficial to develop a quick, non-destructive estimation of chlorophyll concentration and nitrogen status in order to better match fertilizer nitrogen applications with actual plant demand. Currently, local growers use visual color estimation to manage nitrogen fertigation resulting in a more intuitive than accurate N supply. Nevertheless, this estimation allows for correlation of the aesthetic value of ornamental plants via color (RGB) with the nitrogen and chlorophyll concentration in leaf, thus allowing for a more precise N supply. There are also no reference values regarding these relationships for the plants that were studied; therefore, the aim of this work was to establish correlations between the RGB values and chlorophyll and nitrogen concentrations in leaves in three ornamental potted plants.
4. Discussion
The relationships between the R, G, and B values with nitrogen and chlorophyll concentrations showed a number of species-specific trends. Baby rubber plants showed a positive correlation between the R and G values and nitrogen concentration and a negative correlation with chlorophyll concentration. The direct correlation between the R and G values and nitrogen concentration in our experiment disagrees with the results reported by Vibhute and Bodhe [
31] who found an inverse correlation (r values around −0.68) between these parameters in a vineyard in India. With respect to the correlation between the R and G values and chlorophyll concentration, in an experiment conducted on micropropagated potato plants grown in vitro with a medium of sucrose and agar, Yadav et al. [
26] reported that R and G were negatively correlated with the chlorophyll concentration measured by SPAD with an R
2 of 0.74 and 0.77, respectively. It is possible that the results reported here are due to a more stable light intensity compared to the measurements taken outside, where ambient light may affect the readings as reported Yuzhu et al. [
32].
The confetti tree showed different trends according to the RGB values studied. There were positive correlations for R and G values with chlorophyll concentration in this species, while the B values showed a negative correlation. Similarly, the R and G values have shown a positive correlation with chlorophyll concentration in an experiment conducted on Betel vine (
Piper betle), where the RGB values were measured via a scanner, and the chlorophyll concentrations were measured using a non-invasive approach (atLEAF meter) [
33]. The negative correlation between B and chlorophyll concentration in confetti tree plants was not in line with the findings reported by Rigon et al. [
34] who found a direct relationship between the B values and the chlorophyll concentration in the leaves of soybean. With respect to the relationship between the RGB values and the nitrogen concentration, the values of G in the confetti tree showed a negative correlation and the values of B showed a positive correlation. Different results were reported by other researchers such as Auearunyawat et al. [
35] who established a direct correlation between the G values and N concentration in sugarcane leaves and Mercado-Luna et al. [
36] who developed a method of taking images of tomato leaves grown in a greenhouse showing an inverse correlation between B values and N concentration. These opposite results between the G and B values with N concentration in our experiment could be due to image processing calibration errors as reported by Bielinis et al. [
37].
Rosemary plants presented a positive correlation between RGB values and nitrogen and chlorophyll concentrations. The direct correlation between the chlorophyll concentration measured with a chlorophyll meter and the values of RGB obtained through image processing (RGB values) has been reported in some crops such as betel vine (
Piper betle) [
38] and
Eucalyptus dunii [
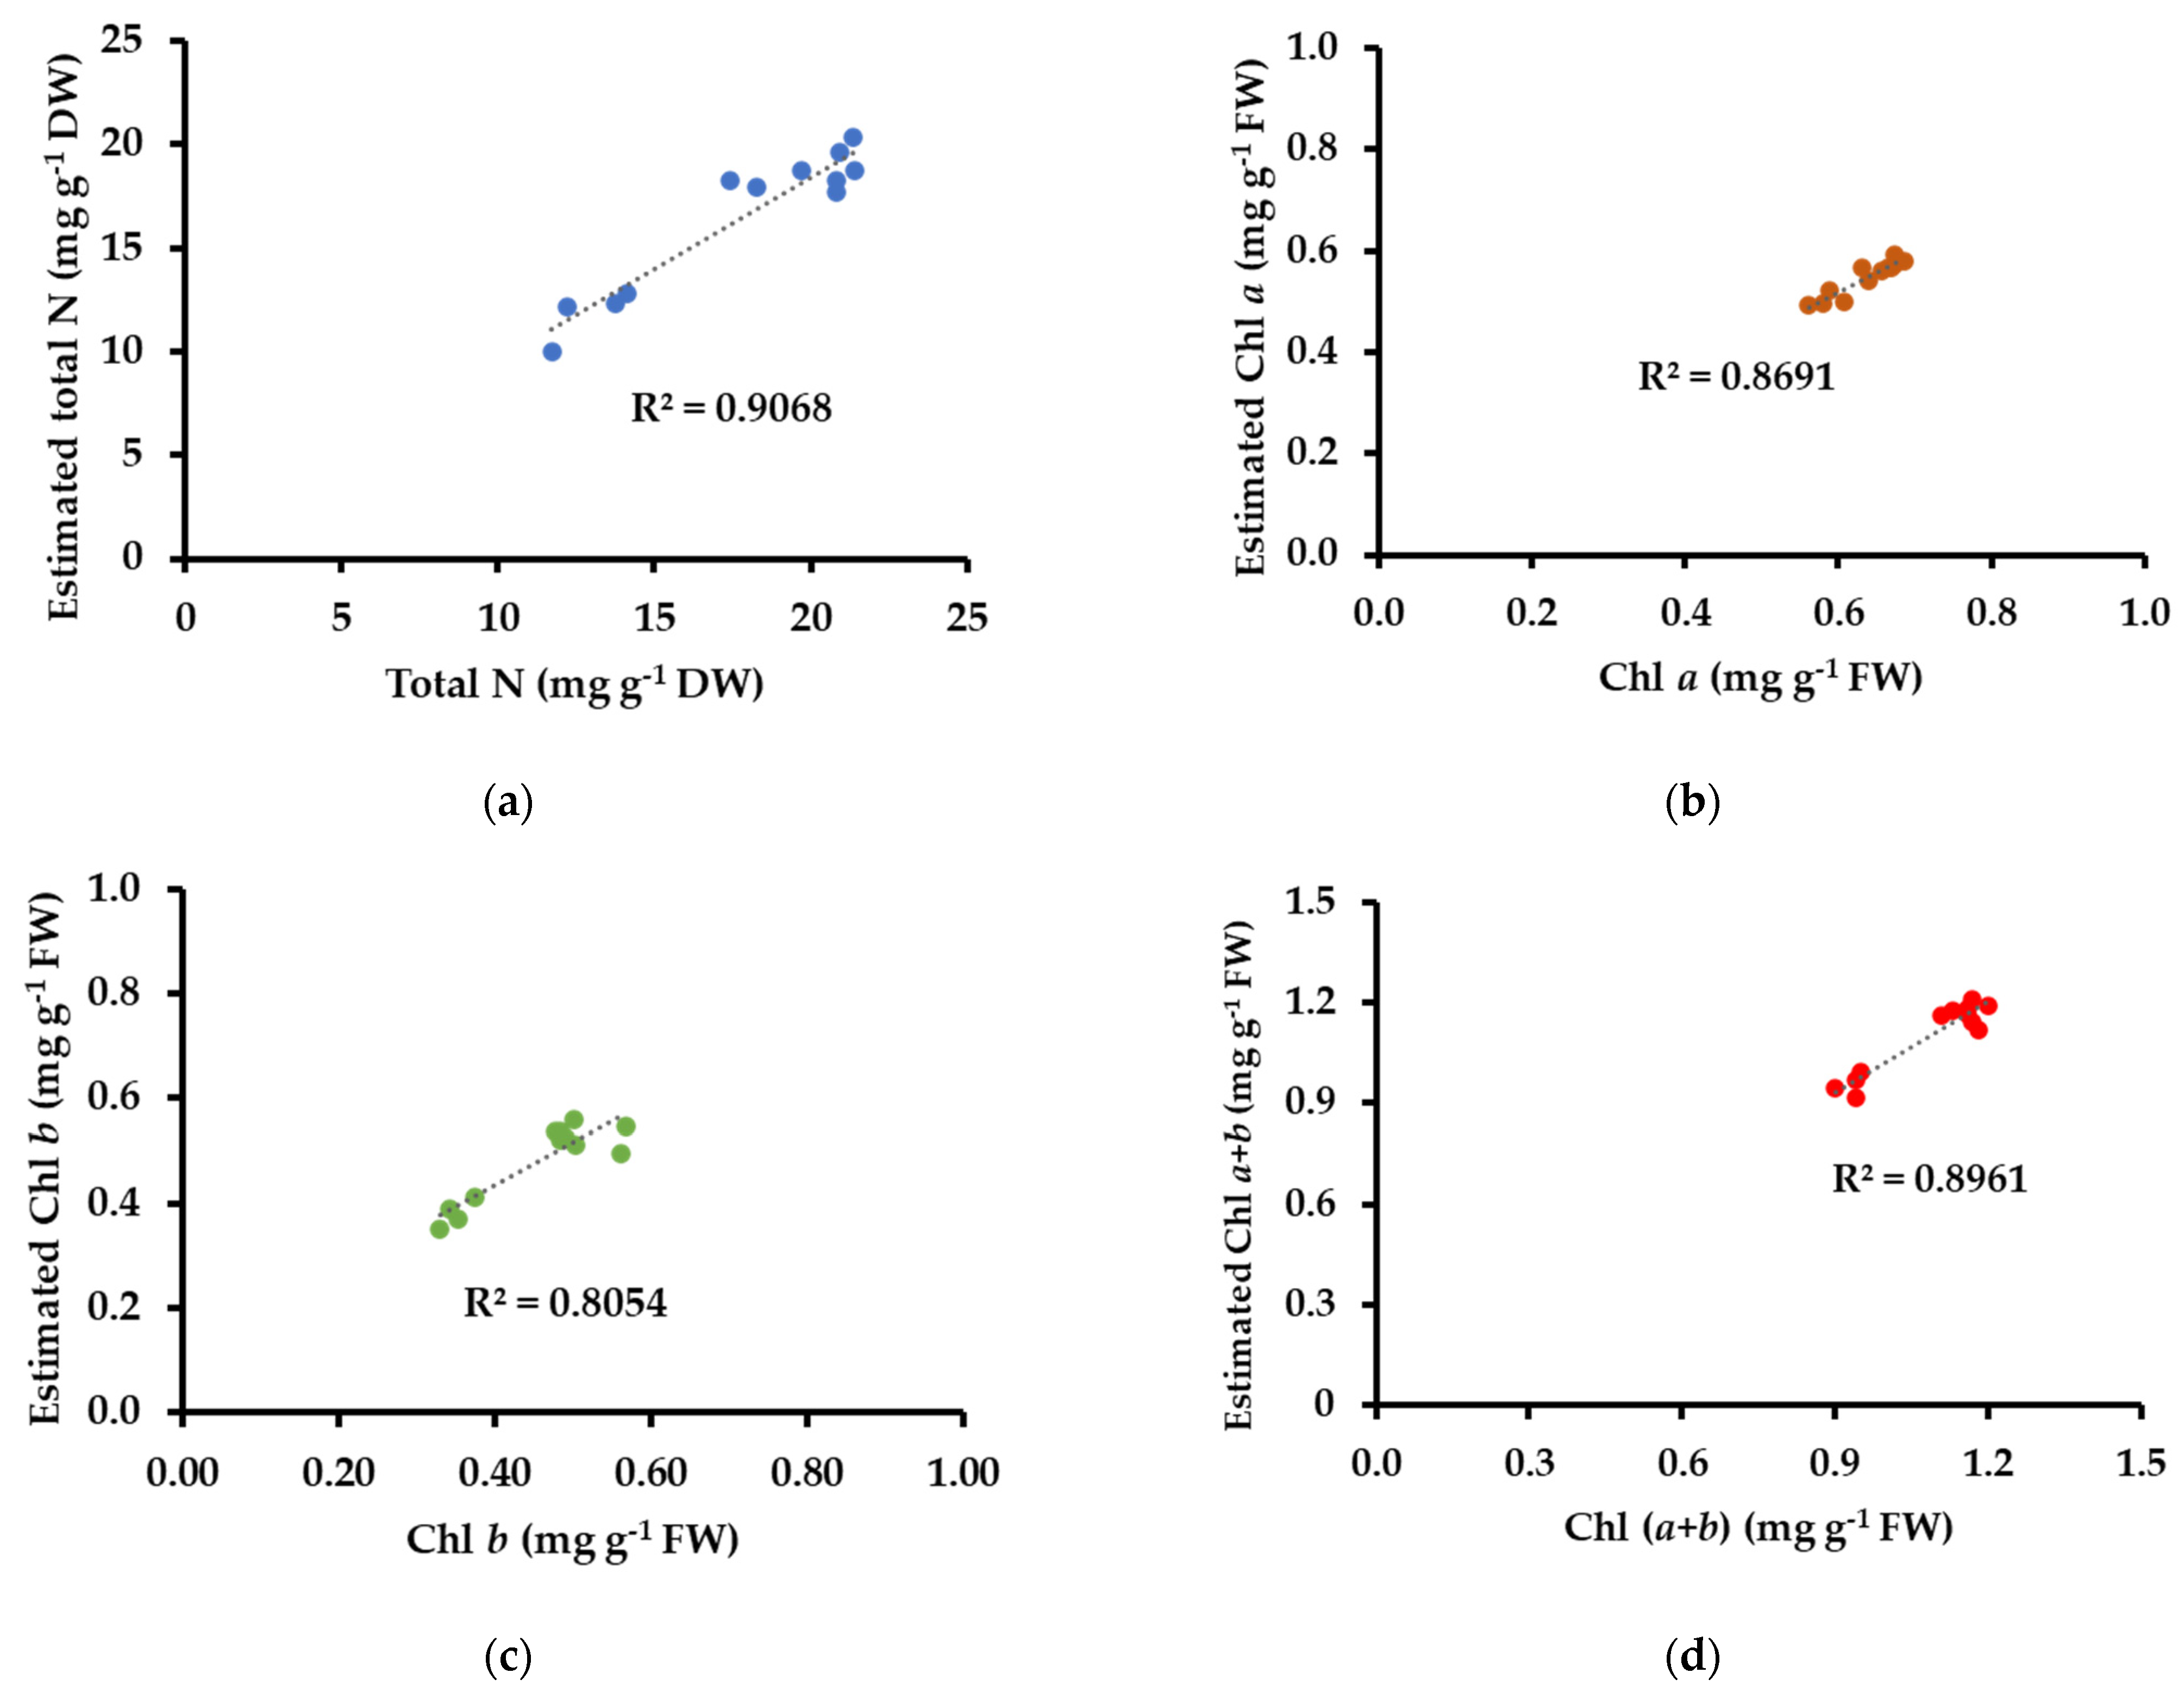
39]. The relationship between the N concentration and RGB values showed a positive correlation in rosemary (R
2~0.90), which agreed with the results obtained by Rorie et al. [
40] who also reported a positive correlation between both factors (R
2~0.80) in sweet corn growing in containers supplied with a mixture of vermiculite, perlite, and peat moss. The results obtained in the rosemary plants in this experiment indicate the feasibility of using digital images as an adequate tool to determine the nitrogen and photosynthetic status of these species.
As far as normalized values of RGB (rgb) are concerned, there were different trends according to the species studied. The performance of RGB to rgb in all species in our experiment reduced the correlation with chlorophyll and N concentrations. On the contrary, Yadav et al. [
26] reported a better correlation between the normalized values of RGB (rgb) and chlorophyll concentration in micropropagated potato plants. Different trends of rgb values with chlorophyll concentration between species may be related to the nonuniform distribution of chlorophyll in leaves as an effect of the clustered structural organization of chlorophyll molecules in chloroplasts, chloroplasts in cells, and cells in leaves [
41]. Different trends of rgb values with N concentration between the species may be related to the different values of nitrogen concentration in the leaves of each species.
Baby rubber plants showed a positive correlation between r and nitrogen concentration and a negative correlation with pigment concentration, while g and b showed no relationship. The direct correlation between the r values and the N concentration in baby rubber plants was in line with the findings reported by Tewari et al. [
42] who reported the same trend in rice. On the other hand, Hu et al. [
43] reported an inverse correlation between the r values and the chlorophyll concentration in barley cultivars, which was similar to the results for baby rubber plants reported here.
The confetti tree plants only correlated with the g and b values. With respect to g, there was a negative correlation with nitrogen concentration and a positive correlation with pigment concentration. In the case of b values, the trend was the opposite. This relationship between the g and b values and nitrogen concentration was also reported by Treder et al. [
44] who conducted an experiment with two-year-old ‘Ligol’ apple trees (
Malus domestica Borkh.) grown in 12 L containers filled with a 3:1 mixture of peat and coconut. They determined that there was an inverse correlation between the g values and N concentration and a direct correlation between the b values and N concentration. With respect to the relationship between the g and b values and the pigment concentrations, our results in confetti tree plants disagree with the findings of Gupta et al. [
45] and Hu et al. [
43] who reported an inverse correlation between the g values and chlorophyll concentration and a direct correlation between the b values and chlorophyll concentration in micropropagated potato plants and barley cultivars, respectively.
The rosemary plants were negatively correlated for the g values and nitrogen and pigment concentrations. Similarly, in an experiment conducted on pepper plants, Yuzhu et al. [
32] investigated the relationship between nitrogen status and color images (RGB values) and reported that the normalized value of g showed a negative correlation with nitrogen concentration. The inverse correlation between the chlorophyll concentration and the g values was also reported in an experiment conducted on potato plantlets regenerated in vitro from nodal cuttings grown in a medium with sucrose and agar [
45].
Concerning the vegetation indices (GMR and GDR), the baby rubber and confetti tree plants showed a negative correlation between both of the parameters and the N concentration and a positive correlation with the pigment concentration, while for the rosemary plants, there was no relationship between these parameters.
The negative correlation between the vegetation indices (GMR and GDR) and the nitrogen concentration was not in line with the findings of other researchers. For instance, Wang et al. [
21] reported a direct correlation between GDR and N concentration and no relationship between GMR and N concentration in rice. In an experiment also conducted on rice, Saberioon et al. [
46] determined no clear correlation between GDR and GMR with the N concentration in the leaves.
The positive correlation between the vegetation indices (GMR and GDR) and the pigment concentration has also been reported by other researchers. Adamsen et al. [
47] observed a direct correlation between GDR and SPAD values, and GDR efficiently responded to the changes in leaf chlorophyll concentrations. Moreover, Ali et al. [
13] also established that GDR was positively correlated with chlorophyll concentration in tomato and lettuce plants. Finally, Vesali et al. [
27] reported a direct correlation between chlorophyll concentrations and GMR in corn leaves.
With respect to VI, the baby rubber and confetti tree plants showed a positive correlation with pigment concentrations, but for nitrogen concentration, there were two trends: a positive correlation for baby rubber plants and a negative correlation for confetti tree plants. The direct correlation between VI and pigment concentration agreed with the results obtained by Wang et al. [
48] who reported the same trend in rice. On the other hand, the lack of correlation in VI green in rosemary plants agreed with the conclusion reported by Rigon et al. [
34] explaining that the lower values of the VI green index could be due to this index mainly being used for images taken above the vegetation covering multiple plants and not being used in studies with individual plants.


