Abstract
Maize silage is fundamental for high milk production in dairy farming. The incorporation of new genetic diversity into temperate maize germplasm has the potential to improve adapted cultivars, and it could be especially useful for improving the nutrition of silage varieties. The goal of this study is to assess the potential for lines from the Germplasm Enhancement of Maize (GEM) project to compete with commercial silage hybrids when crossed with elite temperate-adapted testers. We examined 35 GEM-derived hybrids along with five commercial checks in seven environments across three years in trials that were arranged in randomized complete block designs. Hybrids were compared based on their potential for conversion into animal productivity units: milk yield per hectare (Milk ha−1) and milk yield per ton of silage (Milk t−1). Broad phenotypic variation was observed for both traits, and the broad-sense heritability of Milk ha−1 and Milk t−1 were 0.24 and 0.31, respectively. Five out of six hybrids in the top 15%, based on a multi-trait stability index, were GEM-derived hybrids. The large proportions of phenotypic variance attributed to genotype by environment interactions (GEI) for quality traits suggests that local adaptation should be leveraged for silage breeding that make use of GEM-derived materials.
1. Introduction
Maize (Zea mays L.) silage is a crucial diet component in ruminant production systems, essential for milk and meat production [1,2,3], general health, and productivity of dairy cattle [4]. In most areas where winter months are severe enough to limit the growth of forage crops all year around, farmers rely on ensiling to conserve forage on a large scale. In ruminant production, cattle satisfy between 40% and 90% of their feed requirements with forages [5]. The predominant component of mixed forage rations is often maize silage. For lactating cows in intensive production systems, maize silage comprises between 250 and 750 g kg−1 of dietary feed intake [3,6]. The popularity of maize as a fodder crop can be attributed to its high forage yields, its low harvest costs, its minimal production risks, and the flexibility to choose between harvesting for grain or for silage during the season, which reduces economic risk [7].
We discuss two challenges for the improvement of silage varieties that have resulted in lagging rates of genetic gain: the narrow genetic base of elite maize germplasm and the lack of appropriate tools to measure silage variety performance. We propose the introduction of exotic germplasm as a potential solution and discuss appropriate tools and metrics for quantifying variety competitiveness.
1.1. Rates of Genetic Gain Have Been Lower for Silage Yield Than for Grain Yield
The productivity of maize varieties selected for grain yield has been improved continually since modern breeding and management strategies became common in the 1930s [8], but there has not been a corresponding increase in forage yield and quality [6,9]. This is due in part to the lack of focus on silage breeding until late 1980s [8,10,11], improvements in the measurement and prediction of quality traits, and the development of models relating hybrid yields and animal productivity [2,3,12].
Between 1930 and 1998, forage yields increased at the rate of 1.4% per year, while grain yields increased at the rate of 2.4% per year [13]. In an experiment that included 36 maize cultivars representing the varieties grown during that time period, Lauer et al. (2001), showed that since 1930, maize forage dry matter (DM) yield has increased at a rate of 0.128 to 0.164 Mg ha−1 per year; forage neutral detergent fibers (NDF) concentration has decreased from 0.825 to 0.948 g kg−1 per year, and forage in vitro digestibility (IVD) has increased 0.538 to 0.612 g kg−1 per year. The authors found that crude protein (CP) did not significantly change during that time period, although other groups have reported a small but continuous decrease [10,14,15]. The increase in forage quality could have been far greater if more about quality traits beyond total starch content had been known and implemented into breeding programs [12,13,16].
1.2. Different Trait Requirements
Improving silage varieties involves improving both their production potential and their quality, which translates to the enzymatic digestibility of biomass [2]. The energy component (mostly from the grain fraction) is the primary contributor of calories to the daily ration, but since the whole biomass is consumed in a forage mix, quality requirements differ from maize bred for grain yield. Important considerations for silage maize are high energy content, high digestibility, and high intake potential. Therefore, concentrations of starch, NDF, acid detergent fibers (ADF), fat, and CP are of primary concern when it comes to determining the quality of the hybrid [10,17,18].
1.3. What Are the Appropriate Units for Measuring Silage Quality and Yield?
In comparing maize silage hybrids, monitoring and measuring their performance in units of animal productivity is preferable to comparing just their compositional properties. While the variability among maize hybrids for CP, ADF, NDF, starch, IVD and NDF digestibility is relatively narrow [8], these small differences can amount to large potential differences in predicted animal performance. In Wisconsin, one of the U.S. states with the greatest dairy and silage production [15,17], the range between the highest and lowest yielding hybrid for milk per ton of biomass measured on a dry matter basis (Milk Mg−1, in further text: Milk t−1, for liters of milk produced by the model cow being fed with one metric ton of silage biomass) was 275 kg t−1, and the range for milk yield per hectare (Milk ha−1, for liters of milk produced by the model cow per hectare of silage crop) was 14,700 kg ha−1 [8].
Schwab et al. [3] successfully managed to express silage quality and silage productivity indices in animal productivity units. Their MILK2006 model uses biomass compositional properties and yield to predict Milk t−1 and Milk ha−1 as the most adequate criterion that is currently available for comparing silage hybrids. Animal productivity units were used in our analysis to make recommendations that are relevant not only for the dairy industry, but also for the plant breeding community. The productivity estimates provides a more comprehensive picture of the tested hybrids and capture more information than individual quality components.
1.4. What Are the Appropriate Tools for Identifying Competitive Silage Hybrids?
The performance of a genotype depends on the additive effect of the genotype, the environment, and genotype by environment interactions (GEI), which quantify the differential responses of genotypes to each environment [15,19,20]. The optimal genotype exhibits high yields while showing low variability between the environments and consistent yields over time [21]. This makes precise determination of GEI vital for correct recommendations of genotypes across environments in multi-environment trials (METs). Stability leveraged upon productiveness had not traditionally been used in silage maize breeding and has rarely been used in a systemic manner in plant breeding programs in the past.
In previous years, the Additive Main Effect and Multiplicative Interaction (AMMI) model was widely used to assess the GEI of complex traits [22,23,24]. It obtains estimates by applying singular value decomposition (SVD) to the residuals of a two-way ANOVA to capture patterns in the interactions in the trial data. Its ability to identify systemic variation contained in the interaction effect makes it one of the most popular tools for assessing the GEI of complex traits [21,25,26,27,28].
The AMMI approach has a few important drawbacks: the interpretation of AMMI is based on biplots that account only for GEI patterns present in the first interaction principal component axes (IPCAs). The GEI patterns of complex traits, including silage quality traits, are distributed along multiple IPCAs. The first two IPCAs may explain only a part of the useful variation, which can cause inaccurate or biased recommendations based on AMMI.
In order to incorporate stability into the breeding goals in a comprehensive manner while avoiding the limitations of traditional methods, we used a Weighted Average of Absolute Scores (WAASB) index [27]. The WAASB index uses all estimated IPCA that can contain GEI patterns to quantify the stability. The WAASBY index, a superiority index, allowed us to weight performance (Y–a predicted value of a trait) and stability (WAASB index) by comparing the rescaled values of the trait in question and the WAASB index. We used a Multi-trait Stability Index (MTSI) that allows for simultaneous interpretation of results across several traits by considering their mean performance and stability with different weights, and therefore, enables a broader use of the results for diverse breeding goals.
1.5. The Bottleneck for Silage MAIZE Improvement
Despite consistent increases over decades in total yield, the relative rate of yield gain for three major cereal crops—wheat, rice and maize—has decreased or plateaued over time [29]. This is, in part, due to the narrow genetic base of elite germplasm in major crops, which is a result of intensive modern breeding practices that exploit only a fraction of the available biodiversity [30]. Exploitation of a very narrow genetic base and overuse of elite materials for major crops carries a risk of losing genetic variability necessary for continued improvement in yield and forage quality, adaptation to changing or stressful environments, and more efficient nutrient utilization [30,31,32].
Despite different (though partially overlapping) trait requirements, most of silage maize hybrids stem from the same narrow elite background as other field maize [12,30,33], and therefore suffer from the same bottleneck effect [33]. There is relatively little genetic variation for silage quality traits in existing conventional maize hybrids [3,10,34,35,36,37].
1.6. Can Exotic Germplasm Be the Solution?
When discussing exotic germplasm, we refer to maize varieties that are unadapted to the target environment. Exotic varieties may carry high levels of genetic diversity that can be leveraged for improving valuable traits [33,38]. Beneficial genes from exotic germplasm have already proven successful in breeding programs resulting in commercialization of productive or resistant varieties [39], as in the case of the SUB1 gene in rice, the TY-1 gene in tomatoes, and late blight R genes in potatoes [31,40,41]. For maize in particular, exotic-derived maize lines have the potential to be a useful source of alleles for silage breeding even though certain attributes that are common in exotic lines, such as excessive height, biomass production, and lateness, may be undesirable for grain breeding [42,43,44,45] The large-scale, multi-institutional, public–private Latin American Maize Project (LAMP) [46,47] and its successor, the Germplasm Enhancement of Maize (GEM) Project, were founded specifically to fast-track the incorporation of exotic germplasm into public and private breeding programs [48,49].
Usefulness of genetic resources can be identified based on phenotypic evaluation of the potential donors or their progeny when crossed with elite material, with or without the use of molecular information [27,28,30,50]. In this study, we characterized the progeny of the exotic-derived lines crossed by elite testers to assess the potential of the exotic-derived germplasm to contribute to breeding for maize silage quality and yield.
1.7. The Aims of the Study
The aims of this study were to (i) examine the potential of exotic-derived germplasm to improve silage maize characteristics, (ii) quantify the GEI for silage traits in a GEM-derived population, and (iii) determine whether GEM-derived hybrids have a competitive advantage over commercial hybrids in animal productivity units. We have shown that exotic-derived maize lines originating from the GEM Project can produce silage hybrids that are competitive with proven, high-yielding commercial silage hybrids when crossed with elite testers. New information on the GEM lines obtained in this experiment has important implications for silage maize breeding and provides a clear direction for further efforts to incorporate exotic germplasm into temperate elite backgrounds. The incorporation of exotic germplasm could be a key step for solving the bottleneck problem in elite maize breeding, bringing the potential to cope with increasing nutritional and market requirements.
2. Materials and Methods
2.1. Field Evaluation
Of the evaluated hybrids, 35 were crosses of GEM releases from the non-stiff stalk heterotic group (GEMN) and GEM releases from the stiff stalk heterotic group (GEMS) with one of four testers from the opposite heterotic group. The 5 remaining hybrids were industry standard checks (Table 1, Supplementary Table S1). Two out of four testers had expired Plant Variety Protection Certificates (ex-PVPs) and the other two testers were parents of high-yielding public hybrids.

Table 1.
Tested hybrids with their parent lines.
All evaluated germplasm was grown in three locations in 2019, 2020, and 2021, with the exception of 2019, when evaluated hybrids were planted in only one location. This made seven environments in total (Table S2). The chosen locations—Rimski Sancevi, Srbobran and Lukicevo—are representative of weather and soil conditions of Vojvodina, the Pannonian region of the Republic of Serbia.
The experiment was planted in a randomized complete block design (RCBD) with two replicates. Plots consisted of two rows, 6.5 m long and 0.75 m apart, planted at 19 cm in-row distance. All trials were fertilized according to recommendations for soil properties. All location–year combinations and corresponding planting and harvest dates are listed in Supplementary Table S2.
Forage moisture and kernel milkline were assessed to provide an estimate of plant development; at approximately 300 to 400 g kg−1 DM, plots were harvested using a one row, tractor mounted forage chopper (John Deere 5090E) and measured for biomass yield. From each plot, one kg subsample was collected for subsequent moisture and quality measurements. Samples were dried for seven days at 55 °C to calculate DM concentrations. Since no logging damage was observed during the experiment, standability and logging scoring was not conducted.
2.2. Laboratory Procedures
Dried samples were grounded in a hammer mill, passed through 1-mm screen, and, using standard NIRS procedures [51], scanned with a NIRSystems 6500 near infrared reflectance spectrophotometer (FOSS NIRSystems Inc., Silver Spring, MD, USA) at West Madison Agricultural Research Station, University of Wisconsin-Madison, WI, US. Quality traits NDF, ADF, IVD, CP, and starch, expressed as a percentage of dry matter (DM) content, were measured for use as inputs for the MILK2006 model, which was developed by Shaver et al. [5] at the University of Wisconsin-Madison.
2.3. MILK2006 Model
The MILK2006 model estimates two silage performance indices: Milk Mg−1, which represents milk yield per ton DM of a specific hybrid fed to a reference cow with a body mass of 612.35 kg, and Milk ha−1 which is the milk yield per hectare of a specific hybrid. The model uses a modification of the summative energy equation [52,53] where CP, fat, NDF, starch, and sugar plus organic acid fractions are included with their corresponding total tract digestibility coefficients as constants. The sample lab measure of NDF digestibility (NDFD) was used for the NDF digestibility coefficient. Dry matter intake was estimated using the NDF and NDFD values assuming a reference cow consuming a 300 g kg−1 NDF. According to National Research Council Nutrient Requirements of Dairy Cattle [54], the intake of energy from maize silage was converted to expected Milk Mg−1. Milk ha−1 was calculated using Milk Mg−1 and field-measured dry matter yield.
2.4. Statistical Procedures
Extreme outliers beyond five standard deviations from the mean of each trait were removed from the data set. Plots with less than 75% of the target plant count, plots that fell out of range of 25% to 45% dry matter content at the time of harvest, and plots with less than 10 t ha−1 dry matter yield were removed, eliminating erroneous datapoints that may have been generated during the process of harvest and/or subsequent sample processing. After removing the outliers, there were 503 observables from 26 variables in the dataset.
Data collected from each environment (year–location combination) were analyzed according to the RCBD design. All phenotypic data were analyzed using R [55] package metan version 1.13.0 [27,28,56] based on the mixed-effect model:
where is an 𝑛 = [] × 1 vector response variable 𝐲 = [𝑦111, 𝑦112, …, 𝑦𝑔𝑒𝑏], with 𝑒 and 𝑏 being the number of environments and blocks per environment, respectively, 𝛃 is an (𝑒𝑏) × 1 vector of fixed effects 𝛃 = [μ + γ11, γ12,…, γ𝑒𝑏], is an 𝑚 = [𝑔 + 𝑔𝑒] × 1 vector of random effects = [α1, α2,…, α𝑔, (ατ)11, (ατ)12,…, (ατ)𝑔𝑒], is an 𝑛 × (𝑒𝑏) design matrix of 0 s and 1 s relating y to 𝛃, is an 𝑛 × 𝑚 design matrix of 0 s and 1 s relating y to u, and is an 𝑛 × 1 vector of random errors 𝛆 = [𝑦111, 𝑦112, …, 𝑦𝑔𝑒𝑏].
We used a Wald test on mixed models for determining the significance of the genotype effect. Environment, GEI, and reps nested within environments were considered random factors, while genotypes are treated as fixed effects. For variance component analysis, all factors defined in the model were considered to be random. Variance components were obtained by restricted maximum likelihood using the expectation-maximization algorithm [55], and their significance was tested by a likelihood ratio test (LRT) using a two-tailed test with one degree of freedom as implemented in the metan version 1.13.0 [27,28,56] package.
Heritability on a hybrid-mean basis ( was computed as follows:
where , , and are the variances related to genotypes, genotype × environment interaction, and residuals, respectively; e and b are the number of environments and blocks per environment, respectively. These procedures were performed using a set of functions from the metan version 1.13.0 R package [27,28,56].
Accuracy, , was calculated as
Genotype-environment correlation, , was estimated by
Genotypic coefficient of variation () and the residual coefficient of variation (), estimated by
and
ratio was obtained as the ratio between genotypic and residual coefficient of variation.
We used best linear unbiased prediction (BLUP) [27,28,57,58,59] to estimate yield and biomass quality traits for the hybrid combinations in the experiment (Table 1). Pearson correlations between the traits were calculated based on BLUP values for each of the traits.
WAASB, or Weighted Average of Absolute Scores index, is calculated from SVD (singular value decomposition) of the BLUP matrix for the GEI effects from the mixed model as:
where is the weighted average of absolute scores of the ith genotype (or environment); is the score of the ith genotype (or environment) in the kth and is the amount of the variance explained by the kth .
To report the mean performance and stability (MPE) at the same time for individual traits, we used the index [28], computed as follows:
where is the superiority index for the ith hybrid; 𝑟𝑌𝑖 and 𝑟𝑊𝑖 are the rescaled values (0–100) for the response trait () and the stability (), respectively, where is the weighted average of absolute scores from the singular value decomposition (SVD) of the matrix of BLUPs for the GEI effect (𝑔𝑒), described in Equation (1); and are the weights for mean performance () and stability (), computed by waasb() function from R package metan [27,28] with the values of ranging between 100 − .
Multi-trait stability analysis that considered both stability and performance for multiple traits was calculated based on ideotype–genotype Euclidean distance using scores estimated through exploratory factor analysis [56]
To report the mean performance and stability (MPE) of multiple traits together, (multi-trait stability index) [56] was calculated as follows:
where is the multi-trait stability index for the ith hybrid; is the score of the ith hybrid in the jth factor (i = 1, 2, ..., g; j = 1, 2, ..., f), with g and f being the number of hybrids and factors, respectively; and is the jth score of the ideotype. The scores were obtained in a factor analysis performed in the two-way table containing the WAASBY values for hybrids and traits.
MTSI score represents the distance of each genotype from the idiotype—the ideal genotype that has the highest WAASBY value for all traits considered. Genotypes with lower MTSI are closer to the ideotype. The selection intensity (SI) was 15%, resulting in the selection of the 6 best-performing hybrids.
3. Results
3.1. Quality Traits in Population of GEM-Line–Elite Tester Hybrid Combinations
The means and other descriptive statistics for tested genotypes from the whole experiment, on a percentage of dry matter basis, are presented in Table 2. All traits were normally distributed based on the visual examination (Supplementary Figure S1), and their respective residuals were normally distributed. The models were well fitted (Supplementary Figure S1) and the genotype effect was significant for each trait (Supplementary Tables S3 and S6). The Milk ha−1 and Milk t−1 traits exhibited low to moderate heritability (Table 3), as expected for complex traits.
Table 2.
General descriptive statistics for the dataset.
Table 3.
Genetic parameters of quality traits.
3.1.1. Correlations between the Traits
Correlations between the observed traits are reported in Figure 1. Both NDF and ADF show high negative correlations with IVD (r = −0.85 and r = −0.86, respectively; p < 0.05) and starch content (r = −0.84 and r = −0.74, respectively), consistent with previous studies [38]. NDF and ADF were less corelated with Milk t−1 (r = −0.66 and r = −0.56, respectively; p < 0.05) than with IVD (Figure 1).
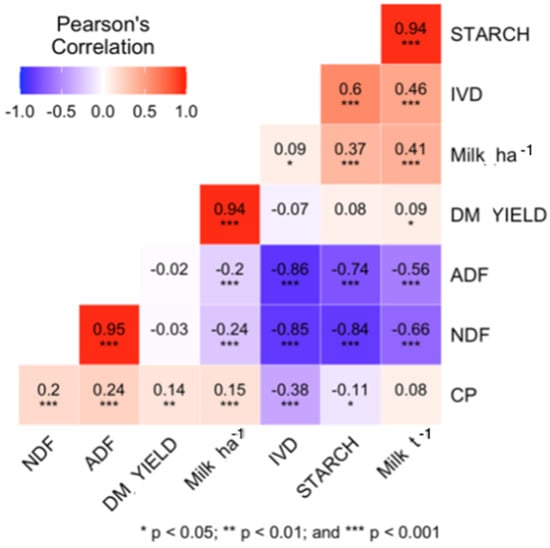
Figure 1.
Pearson’s correlation coefficient plot of the quality traits in the dataset; Milk ha−1 is yield of milk per ton of silage dry matter in kg Mg−1; Milk ha−1 is yield of milk per ha of maize silage crop; DM_YIELD is the genotype dry matter yield per ha.
3.1.2. Variance Components
The genotype effect was significant for all traits (Supplementary Table S4). The traits under the greatest genetic control were Milk ha−1 and starch content, which accounted for 31.24% and 30.7% of observed variance, respectively. Genotype accounted for 24.25% of phenotypic variance for Milk ha−1, while the contributions of genetic variance for NDF, ADF, and crude protein content were smaller: 18.9%, 14.62%, and only 3.17%, respectively (Supplementary Table S4; Figure 2).
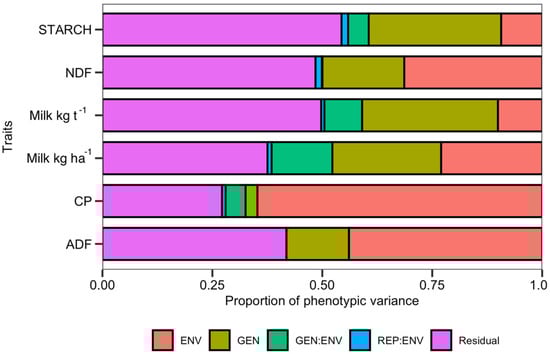
Figure 2.
Distribution of variance components per trait.
The environment term was significant (p < 0.01) for each trait, explaining 23.70% of variance for Milk ha−1 and 10.04% of variance for Milk t−1 (Supplementary Table S4; Figure 2). Environment explained the 65.08% of the observed variance for crude protein, 43.67% of variance for ADF, and 31.21% of variance for NDF. GEI was significant, variance for Milk ha−1 and Milk t−1, explaining 13.46% and 8.68% of the observed variance.
Environment was responsible for just 10.04% of the variance for Milk t−1 and 9.26% of the variance for starch (Supplementary Table S4), making Milk t−1 and starch content relatively stable across different environments. This is also demonstrated on the GE Heatmap for Milk ha−1 and Milk t−1 (Supplementary Figure S2).
3.2. Performance Comparisons
Hybrid combinations of GEM lines with elite testers were competitive with leading industry hybrids for both Milk ha−1 and Milk t−1 (Figure 3, Supplementary Figure S3). A set of five GEM-derived hybrids (GEMS-0185 × PHN82, GEMS-0206 × PHN82, GEMS-0219 × PHN82, GEMS-0250 × 67/91-3, GEMN-0246 × PHHB9) outperformed the highest-ranking industry standard for Milk t−1. The highest-ranking genotype for Milk ha−1 was P0725, a Pioneer hybrid, followed in close succession by other GEM hybrid crosses: GEMN-0246 × PHHB9, GEMS-0185 × PHN82, NS6043, GEMN-0249 × PHHB9, GEMN-0193 × PHHB9 (Supplementary Figure S3, Figure 3). Hybrid performance is shown on the Milk ha−1 vs. Milk t−1 plane (Figure 3).
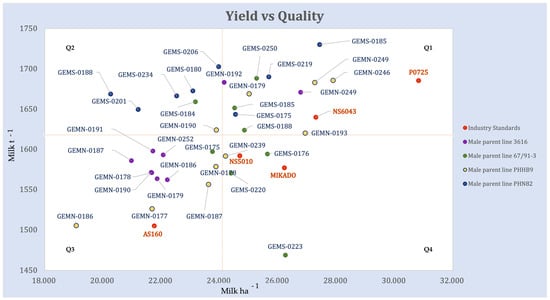
Figure 3.
Genotype BLUP values plotted on a Milk ha−1 vs. Milk t−1 plane, which groups genotypes into four distinct quadrants. The dot color represents the male parent of the hybrid. Horizontal and vertical lines represent the grand means for Milk ha−1 and Milk t−1. Commercial check hybrids in the experiment are labeled by green dots.
The dashed horizontal and vertical Milk ha−1 and Milk t−1 lines divide the plot into quadrants. All genotypes with Milk ha−1 greater than the mean could be considered good candidates for silage maize. The best candidates, however, are the ones in the upper right quadrant, Q1. Those are the genotypes with high quality biomass and high yield, which makes them highly desirable. There are 11 GEM-line hybrids and two industry checks (hybrids P0725 and NS6043) populating this quadrant. Genotypes in Q4, show above average Milk ha−1, but the quality of the biomass is lower.
Hybrids in the Q3 quadrant are of lower-than-average quality and yield. Therefore, they would not be the right choice for the tested environments. Only one commercial check is in the third quadrant, AS160. Genotypes in the Q2 quadrant are high biomass quality genotypes, but they have low biomass yield and therefore tend to have below average milk yield per hectare.
Understanding the Contribution of the Parent Lines through Yield–Quality Dynamics
The prevalent tester line in the upper two quadrants of Figure 3 is PHN82; hybrids with it as parent line all yielded above the average Milk t−1 in the experiment. Genotypes GEMS-0175 × PHN82, GEMS-0185 × PHN82 and GEMS-0219 × PHN82 yielded above average Milk ha−1 as well (upper right quadrant Q1). Three genotypes with PHN82 as a parent, GEMS-0219 × PHN82, GEMS-0185 × PHN82 and GEMS-0206 × PHN82, have the highest Milk t−1 for the entire experiment, outperforming the highest ranked commercial hybrid, Pioneer P7025. All but two (GEMN-0192 × 3616 and GEMN-0249 × 3616) hybrids with tester 3616 as a parent are grouped in Q3, the low-yielding and low quality quadrant.
With respect to the GEM parents, GEMS-0185 and GEMN-0249 both produced a hybrid in the upper right quadrant (Figure 3) when crossed with both testers from the opposite heterotic group. Hybrids with GEM lines GEMN-0178, GEMN-186 and GEMN-187 crossed by either of two testers from opposite heterotic group fell in the lower left quadrant of low-quality and low-yield.
3.3. Simultaneous Selection for Productivity and Stability in Silage Maize
The five most stable genotypes for Milk ha−1 are GEMN-0179 × 3616, GEMN-0178 × 3616, GEMN-0191 × 3616, GEMN-0187 × 3616 and GEMS-0234 × PHN82 (Supplementary Table S8). Stability is beneficial only when considered together with productivity for the target trait, however. Among the five hybrids with the highest Milk ha−1 (Supplementary Figure S3), only two are in the top five when stability is weighed against productivity at a 50:50 ratio: P0275 Pioneer hybrid and GEMS-0185 × PHN82 (Supplementary Figure S5). The only genotype that appeared in the top five for both Milk t−1 and WAASBY Milk t−1 was GEMS-0219 × PHN82 (Supplementary Figures S3, S5 and S9).
The WAASB × Y biplot (Figure 4) allows the classification of genotypes into four different categories for joint interpretation of productivity and stability using all estimated IPCA axes to identify the stability in a bi-dimensional plot. The genotypes or environments in quadrant I can be considered unstable genotypes or environments with high discrimination ability and productivity below the grand mean. In quadrant II are high-yielding unstable genotypes, which may be good candidates to investigate for specific environmental adaptations. Genotypes in quadrant III have low productivity but can be considered stable (the lower the WAASB, the more stable the genotype). Quadrant IV is the target quadrant, with highly productive, broadly adapted, and stable genotypes.
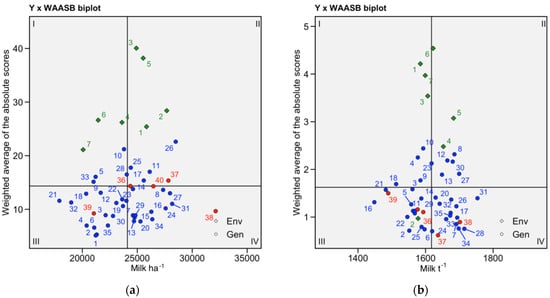
Figure 4.
(a) Milk ha−1 WAASBxY plot.; (b) Milk t−1 WAASBxY plot; highlighted in red are industry standards. Environments are represented by greed rhomboids.
Industry checks inhabit the stable part of the graph (Figure 4a) with the exception of NS6043. Only one industry hybrid, AS160, yields below the average Milk ha−1 yield for the experiment. All industry hybrids are stable, but only two have Milk t−1 yields greater than the mean for the experiment (Figure 4b). All but two hybrids in quadrant IV yield more Milk t−1 than the industry standard NS6043, which is one of two checks in the quadrant (Figure 4b). For breeding programs that have to balance stability and productivity depending on their target environment and market demands, we identified a cluster of GEM-derived hybrids that have consistently high ranking across the productivity vs. stability scenarios (Supplementary Figures S6–S8).
3.4. Simultaneous Selection for Milk ha−1 and Milk t−1 Mean Performance and Stability
To build on the Milk ha−1 vs. Milk t−1 analysis by adding the stability criterion, Multi-trait stability analysis was performed targeting Milk ha−1 and Milk t−1 at 15% selection intensity. The selected genotypes based on MTSI were Pioneer hybrid P0725 and five hybrid crosses of exotic-derived GEM lines (Figure 5). The selected genotypes yielded 13.56% more Milk ha−1 than the mean of the population and 4.48% more Milk t−1 than the mean of the total population (Supplementary Table S10), which did not come at the cost of stability. The mean Milk ha−1 WAASBY index of the selected genotypes was 34.87% higher than the mean of the total population, while the mean Milk t−1 WAASBY index of selected genotypes was 36.75% higher than the mean of the total population (Supplementary Table S11).
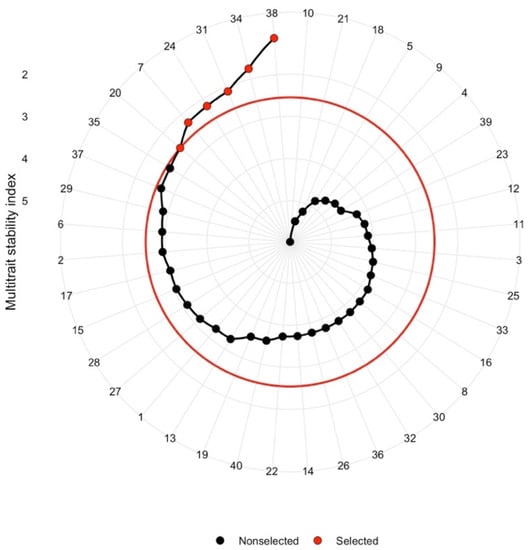
Figure 5.
MTSI indices of tested genotypes based on Milk ha−1 and Milk t−1 jointly considered with stability of the traits; selected genotypes at 15% selection intensity are marked in red.
4. Discussion
4.1. Quality Traits in A Population of GEM-Line–Elite Tester Hybrids
Mean dry matter yield, starch, and crude protein content were consistent with the results reported in [38], while mean ADF and NDF content were lower than the values reported as representative of silage hybrid production across China [38]. In commercially available mid-season silage hybrids, the range is 14.5–22.9 t ha−1, 31–37% and 6.8–8.3% for Dry Matter Yield, starch and crude protein content, respectively [60,61]. This suggests that the GEM-derived hybrids are of high quality based on ADF and NDF. Seed companies scarcely publish the characteristics of their silage hybrids in absolute numbers regarding animal productivity. In most cases, the relative comparisons between hybrids on the market are reported, in a combination of subjective quality parameters, and now, long-time used fiber content, based on the company’s trials. The reasons for this might be many, from novelty of the method to liability concerns, but the fact remains that the public relies on research like this, from public institutes and universities to get the exact data on productivity of hybrids. The productivity in Milk ha−1 and Milk t−1 of industrial checks used in this experiment has not been previously reported. The Milk ha−1 and Milk t−1 traits exhibited low to moderate heritability (Table 3), as expected for complex traits.
4.1.1. Correlations between the Traits
Observed correlations between the traits are in concordance with existing literature [3,36,62] and expected from the biological nature of the traits. High positive correlations between NDF and ADF (more than 0.95 at p < 0.001) have previously been described in literature [62], and the observed negative correlation between NDF and starch (−0.84 at p < 0.001) was more negative than reported by [34,36,62]: 0.78 and 0.71, respectively (Figure 1).
The low correlation coefficient between CP and other traits, consistent with other findings discussed below, is mainly due to the small fraction that CP comprises in the total DM. The negative correlation between protein and starch content, as reported here (Figure 1), is common for grain and whole-plant silage [10,14,37]. Maize is not a high protein crop: in the daily rations of dairy cattle, protein content is usually supplemented. Protein content has therefore never been a priority trait in maize breeding, and there has been little or no improvement with regards to the protein content over the decades [63]. In fact, protein content in grain, as well as in stover, has been decreasing since 1930s [14], which is likely an effect of indirect selection in breeding for starch fraction, smaller tassels, reduction of the number of barren plants, and the stay-green effect [10,14,15].
The high positive correlation (r > 0.94; p < 0.05) between starch content and Milk t−1 (Figure 1) shows the influence of starch content on the caloric density of the silage, which contributes to easier digestion of the biomass [3,64] and thereby Milk t−1. The starch fraction is not the only factor affecting silage quality, though; silage quality is also impacted by stover quality. Frey et al. (2004) [10] observed that Wisconsin Quality Synthetic maize populations ranked high for milk yield determined by MILK2000 [3] due to their high stover quality (biomass where the ears were removed), even though they were handicapped by lower starch concentrations.
The NDF and ADF may be less corelated with Milk t−1 (−0.66 and −0.56, respectively; p < 0.05) than with IVD [38] (Figure 1), in part because the other factors that influence the quality of the biomass might mitigate the negative influence of high NDF and ADF.
4.1.2. Variance Components
The variance component data, along with the genetic parameters of the population, are indicative of the breeding potential of the tested population (Supplementary Table S4). The most genetically controlled characteristics were Milk t−1, starch content and Milk ha−1, accounting for 31.24%, 30.7% and 24.25% of observed variance respectively. The genotype-attributed phenotypic variance for NDF, ADF and crude protein content was smaller: 18.9%, 14.62% and only 3.17% respectively (Supplementary Table S4; Figure 2). This is an encouraging result from the perspective of breeding for silage quality parameters and a persuasive argument in favor of monitoring the animal productivity units, Milk ha−1 and Milk t−1, rather than for individual components of biomass, as will be discussed below.
Genotype by environment interaction explained 13.46% and 8.68% of the observed variance for the Milk ha−1 and Milk t−1 traits, figures which are close to the 15.9% of grain yield variance attributed to genotype by environment interactions by others [15,37,65,66]. By careful classification of the environments, genotype by environment interactions for silage quality could be exploited to optimize the choice of test environments and allocate breeding program resources most efficiently. This has been demonstrated by others [15,37,65,66] for maize traits exhibiting similar behavior.
High levels of residual variance for Milk t−1 and starch content, 49.43% and 54.03%, respectively (Figure 2; Supplementary Table S4), indicate that there might be additional factors acting on the variables that could not be accounted for in the model.
4.2. Performance Comparisons
The GEM line–elite tester hybrids were competitive with the leading industry hybrids for both Milk ha−1 and Milk t−1 (Figure 3, Supplementary Figure S3): a set of five GEM-derived hybrids outperformed the highest-ranking industry standard for Milk t−1, Pioneer hybrid P0725. This industry standard was the highest-ranking genotype for Milk ha−1, but a series of GEM-derived hybrids were competitive (Supplementary Figure S3, Figure 3). Figure 3 is a particularly useful way to compare the hybrid combinations; eleven GEM-line hybrid combinations and two industry checks (hybrids P0725 and NS6043) have high biomass quality and high yield, which makes them desirable. The only commercial check in the bottom left quadrant Q3, lower-than-average quality and yield that would not be the right choice for the tested environments is AS160. This hybrid had been released 12 years ago and has since been pulled from the market (Supplementary Table S1).
4.2.1. Understanding the Contribution of the Parent Lines through Yield–Quality Dynamics–Tester Lines
Frey et al. [10] noted that in order to fully realize the increase in silage quality of inbred lines in subsequent selection cycles, it is important to identify and testcross high-quality lines to one genetically distinct, complementary heterotic group.
We used Figure 3 to understand the contribution of the tester lines. Elite tester line PHN82 seems to be the most promising for crossing with GEM-derived lines in breeding for silage properties. Hybrids with tester line PHN82 as a parent all yielded above the average Milk t−1 in the experiment (Figure 3), and three of those hybrids yielded above average Milk ha−1, as well. Furthermore, three hybrids with PHN82 as a parent line have the highest Milk t−1 for the entire experiment, outperforming the highest ranked commercial hybrid - Pioneer P7025. On the other hand, all but two hybrids with tester line 3616 as a parent were low-yielding and of low quality (Figure 3).
4.2.2. Understanding the Contribution of the Parent Lines through Yield–Quality Dynamics–GEM-Derived Lines
It is worth noting that GEMS-0185 and GEMN-0249 both produced high-quality, high-yielding hybrids (Figure 3) when crossed with both testers from the opposite heterotic group. Hybrids with GEM lines GEMN-0178, GEMN-186, and GEMN-187 as parents crossed by either of two testers from opposite heterotic group were low-quality, low-yielding hybrids, and they should be considered with caution in future breeding for maize silage.
4.3. Simultaneous Selection for Productivity and Stability in Silage Maize
When identifying superior genotypes, making judgements based on their productivity is only beneficial if the stability of the target trait is also considered. Among the five hybrids that stood out as ranking highest for Milk ha−1 (Supplementary Figure S3), only two were in the top five when stability was weighed against productivity at 50:50 ratio: P0275 Pioneer hybrid and GEMS-0185 × PHN82 (Supplementary Figure S5). Only one genotype appeared in the top 5 both for the BLUP Milk t−1 and WAASBY Milk t−1: GEMS-0219 × PHN82 (Supplementary Figures S3, S5 and S9), highlighting the importance of including the stability analysis according to the breeding goals.
Breeding programs have different objectives and therefore prioritize productivity and stability differently. With this in mind, we provided WAASBY rankings for a spectrum of productivity vs. stability scenarios (Supplementary Figures S6–S8) for breeding programs that have to balance stability against productivity depending on their target environment and market demands. We were able to identify a cluster of GEM-derived hybrids that have consistently high rankings across the productivity vs. stability scenarios.
We used WAASB × Y biplots (Figure 4) to classify genotypes for joint interpretation of productivity and stability. All GEM-derived hybrids in quadrant IV can be considered highly productive, broadly adapted, and stable genotypes. Unsurprisingly, industry checks inhabit the stable part of the graph, quadrants III and IV (Figure 4a), with the exception of NS6043. Only one industry hybrid, AS160, yields below the average Milk ha−1 yield for the experiment. As already discussed, this hybrid was withdrawn from the market in 2020 (Supplementary Table S1). P0725 is in the most favorable place in quadrant IV. All industry hybrids are stable for Milk t−1, but only two yielded more than the mean Milk t−1 yield for the experiment (Figure 4b). This might be a consequence of the long-term breeding for silage maize that was done just on the basis of biomass and, in later years, also on lignin or ADF content [6,13]. It was only in recent years that breeding for silage quality started considering digestibility as one of the crucial traits to monitor and select from the breeding populations. All the checks from this experiment, although proven at the market for many years, represent silage hybrids of previous generation, when breeding was done predominantly on the basis of biomass.
The WAASB × Y biplots (Figure 4) characterized the environments in terms of their suitability for MET trials for silage maize. Environments 4, and 7 are in quadrant I, so they are unstable and low-yielding. Environments 6 and 7 belong to year 2021, which had very unfavorable weather conditions (Supplementary Table S2). This is reflected in yield results (Supplementary Table S7). Environment 2 is the only one characterized as having low productivity and low discrimination ability, which makes it not suitable for breeding efforts for Milk t−1 (Figure 4a). All other environments are in quadrant II, so they are productive and highly discriminatory. The quadrant II environments are good for the purposes of plant breeding experiments. Environments had limited discriminatory power for Milk t−1 (Figure 4b), which could be explained by the fact that Milk t−1, as a trait, is less reactive to changes in environmental conditions (Figure 2). Environment accounts for just 10.04% of Milk t−1 variance in the data, while environment accounts for 23.7% of the observed Milk ha−1 variance (Supplementary Table S4, Figure 2).
4.4. Simultaneous Selection for Milk ha−1 and Milk t−1 Mean Performance and Stability
Multi-trait stability analysis targeting Milk ha−1 and Milk t−1 identified five hybrid crosses of exotic-derived GEM lines along with Pioneer hybrid P0725 (Figure 5) as the best hybrids at 15% selection intensity. Selecting those hybrids would unlock 13.56% and 4.48% increases in Milk ha−1 and Milk t−1 yield, along with the gain in stability, compared to the beginning population.
It is worth noting that only two of the selected hybrids would have been identified as desirable by looking at their ranking for the traditionally assessed silage traits: NDF and ADF (Supplementary Figure S4b). That approach would have also neglected yield per hectare of the crop as well as stability across the environments. Somewhat better results could have been achieved by making a heuristic guess based on starch content only (Supplementary Figure S4b, Table S5), due to the relatively high correlation between the Milk t−1 and starch content (Figure 1). In addition to ignoring yield per hectare and stability, this approach could have a serious drawback in that it ignores the influence of the fiber component of the stover (maize biomass without the ears) and the potential penalty to the palatability of the silage. As shown by Frey et al. [10] in the Wisconsin Quality Synthetic maize populations, and by other research [17,67], genotypes that lack high starch concentrations can still deliver superior milk yields if they have high stover quality. Regardless, this hypothesis deserves further examination in feeding trials.
5. Conclusions
The population of GEM-derived hybrid crosses showed broad variability for compositional properties and dry matter yield. The heritability of Milk ha−1 and Milk t−1 were 0.24 and 0.31, respectively, which indicates the potential for improvement of the tested population. GEM-derived hybrids are competitive with industry standards when both traits and their respective stabilities are considered in the analysis: out of the top 15% of genotypes according to the Multi-trait stability index, five out of six were hybrid crosses between exotic-derived GEM lines with temperate-adapted elite lines. The large proportion of GEI variance for quality traits suggests that local adaptations should be leveraged in silage breeding that makes use of exotic, GEM-derived materials.
Supplementary Materials
The following are available online at https://www.mdpi.com/article/10.3390/agronomy13010243/s1, Figure S1: (a) Random effect Milk ha−1 model fit; (b) Random effect Milk t−1 model fit; (c) Random effect Milk NDF model fit; (d) Random effect ADF model fit; (e) Random effect Crude Protein content model fit; (f) Random effect Starch content model fit; Figure S2: Milk ha−1 and Milk t−1 Genotype-environment heatmaps; Figure S3: Ranked Milk ha−1 and Milk t−1 BLUP values; Figure S4: (a) Genotypes ranked for NDF BLUP values versus ADF BLUP values; (b) Genotypes ranked for Milk t−1 BLUP values versus starch fraction BLUP values; Figure S5: (a) Genotypes ranked for Milk ha−1 WAASBY index with equal weights on productivity:stability scale (b) Genotypes ranked for Milk t−1 WAASBY index with equal weights on productivity:stability scale; Figure S6: (a) Genotypes ranked for Milk ha−1 WAASBY index with 65:35 weights on productivity:stability scale; (b) Genotypes ranked for Milk t−1 WAASBY index with 65:35 weights on productivity:stability scale; highlighted in green are the industry standards; Figure S7: Heatmap of WAASB/Milk ha−1 yield ratio scenarios; Figure S8: Heatmap of WAASB/Milk t−1 yield ratio scenarios; Table S1: Industry standards; Table S2: List of location-year combinations with corresponding planting and harvest dates; Table S3: LRT test for all-random model of each tested trait; Table S4: Distribution of variance components per trait; Table S5: BLUP values of each trait; Table S6: AMMI significance table; Table S7: Environments ranked for Milk ha−1 BLUP values; Table S8: The WAASB and WAASBY Milk ha−1 values of genotypes with their rankings; Table S9: The WAASB and WAASBY Milk t−1 values of genotypes with their rankings; Table S10: Differentials between the means of selected genotypes and the total population; Table S11: Differentials for stability (WAASB) and combined performance and stability (WAASBY) between the selected 15% of the genotypes and the total population.
Author Contributions
Conceptualization: M.P. and N.d.L.; methodology: D.S. and B.M.; investigation, validation, visualization and formal analysis: M.P.; writing—original draft preparation, M.P.; writing—review and editing, D.C.L., A.P. and N.d.L.; supervision: B.M. and N.d.L. Authorship is limited to those who have contributed substantially to the work reported. All authors have read and agreed to the published version of the manuscript.
Funding
In-field experiments were funded by Ministry of Education, Science and Technological Development of the Republic of Serbia, grant TR-31073; laboratory analysis and subsequent work on data curation, consolidation and analysis of the results conducted at University of Wisconsin-Madison were supported by Fulbright Visiting Researcher Program 2021 of the U.S. Department of State’s Bureau of Educational and Cultural Affairs.
Data Availability Statement
The data presented in this study are available in Supplementary material section.
Acknowledgments
We would like to express my deepest gratitude to Fulbright Program of the U.S. Department of State and their staff for doing more than funding the part of the research conducted in the U.S. for doing the impossible to overcome the logistic and regulatory obstacles in the year when research-related travel was frozen world-wide due to COVID pandemic. I had the pleasure of working along Marina Borsecnik, Dustin Eilert, Dylan Shoemaker, Martin Costa and Jose Ignacio Varela at de Leon lab, whose assistance, knowledge and friendship have been a gift.
Conflicts of Interest
The authors declare no conflict of interest. The funders had no role in the design of the study; in the collection, analyses, or interpretation of data; in the writing of the manuscript, or in the decision to publish the results.
References
- Ball, D.; Collins, M.; Lacefield, G.; Martin, N.; Mertens, D.; Olson, K.; Putnam, D.; Undersander, D.; Wolf, M. Understanding Forage Quality; The American Forage and Grassland Council, the National Forage Testing Association: Park Ridge, IL, USA, 2010. [Google Scholar]
- Lopez-Malvar, A.; Malvar, R.A.; Butron, A.; Revilla, P.; Pereira-Crespo, S.; Santiago, R. Genetic Dissection for Maize Forage Digestibility Traits in a Multi-Parent Advanced Generation Intercross (MAGIC) Population. Agronomy 2021, 11, 104. [Google Scholar] [CrossRef]
- Schwab, E.C.; Shaver, R.D.; Lauer, J.G.; Coors, J.G. Estimating Silage Energy Value and Milk Yield to Rank Corn Hybrids. Anim. Feed Sci. Technol. 2003, 109, 1–18. [Google Scholar] [CrossRef]
- Jung, H.G.; Allen, M.S. Characteristics of Plant Cell Walls Affecting Intake and Digestibility of Forages by Ruminants. J. Anim. Sci. 1995, 73, 2774–2790. [Google Scholar] [CrossRef] [PubMed]
- Shaver, R. Evaluating Corn Silage Quality For Dairy Cattle; USDA NRCS CIG Program, 2606 West Pioneer: Puyallup, WA, USA, 2007. [Google Scholar]
- Ferraretto, L.F.; Shaver, R.D.; Luck, B.D. Silage Review: Recent Advances and Future Technologies for Whole-Plant and Fractionated Corn Silage Harvesting. J. Dairy Sci. 2018, 101, 3937–3951. [Google Scholar] [CrossRef] [PubMed]
- Oba, M.; Allen, M.S. Evaluation of the Importance of the Digestibility of Neutral Detergent Fiber from Forage: Effects on Dry Matter Intake and Milk Yield of Dairy Cows. J. Dairy Sci. 1999, 82, 589–596. [Google Scholar] [CrossRef] [PubMed]
- Lauer, J.G. Breeding and Managing the Ideal Corn Silage Hybrid: A Retrospective and Direction For Progress. In Proceedings of the 2011 Western Alfalfa & Forage Conference, Las Vegas, NV, USA, 11–13 December 2011. [Google Scholar]
- Ferreira, G.; Alfonso, M.; Depino, S.; Alessandri, E. Effect of Planting Density on Nutritional Quality of Green-Chopped Corn for Silage 1. J. Dairy Sci. 2014, 97, 5918–5921. [Google Scholar] [CrossRef] [PubMed]
- Frey, T.J.; Coors, J.G.; Shaver, R.D.; Lauer, J.G.; Eilert, D.T.; Flannery, P.J. Selection for Silage Quality in the Wisconsin Quality Synthetic and Related Maize Populations. Crop Sci. 2004, 44, 1200–1208. [Google Scholar] [CrossRef]
- Lauer, J.; Agronomist, C. The “Normal” Pattern of Corn Forage and Grain Development. In Proceedings, 2011 Western Alfalfa & Forage Conference, Las Vegas, NV, USA, UC Cooperative Extension; Plant Sciences Department, University of California: Davis, CA, USA, 2019. [Google Scholar]
- Barrière, Y.; Alber, D.; Dolstra, O.; Lapierre, C.; Motto, M.; Ordas, A.; van Waes, J.; Vlasminkel, L.; Welcker, C.; Monod, J.P. Past and Prospects of Forage Maize Breeding in Europe. II. History, Germplasm Evolution and Correlative Agronomic Changes. Maydica 2006, 51, 435–449. [Google Scholar]
- Lauer, J.G.; Coors, J.G.; Flannery, P.J. Forage Yield and Quality of Corn Cultivars Developed in Different Eras. Crop Sci. 2001, 41, 1449–1455. [Google Scholar] [CrossRef]
- Duvick, D.N.; Cassman, K.G. Post–Green Revolution Trends in Yield Potential of Temperate Maize in the North-Central United States. Crop Sci. 1999, 39, 1622–1630. [Google Scholar] [CrossRef]
- Falcon, C.M.; Kaeppler, S.M.; Spalding, E.P.; Miller, N.D.; Haase, N.; AlKhalifah, N.; Bohn, M.; Buckler, E.S.; Campbell, D.A.; Ciampitti, I.; et al. Relative Utility of Agronomic, Phenological, and Morphological Traits for Assessing Genotype-by-Environment Interaction in Maize Inbreds. Crop Sci. 2020, 60, 62–81. [Google Scholar] [CrossRef]
- Barrière, Y.; Argillier, O.; Barrière, Y.; Brown-midrib, O.A.; Sciences, E.D.P. Brown-Midrib Genes of Maize: A Review To Cite This Version: HAL Id: Hal-00885517 Brown-Midrib Genes of Maize. Agronomie 1993, 13, 865–876. [Google Scholar] [CrossRef]
- Hansey, C.N.; Lorenz, A.J.; de Leon, N. Cell Wall Composition and Ruminant Digestibility of Various Maize Tissues Across Development. BioEnergy Res. 2010, 3, 28–37. [Google Scholar] [CrossRef]
- Hansey, C.N.; Johnson, J.M.; Sekhon, R.S.; Kaeppler, S.M.; de Leon, N. Genetic Diversity of a Maize Association Population with Restricted Phenology. Crop Sci. 2011, 51, 704–715. [Google Scholar] [CrossRef]
- Epinat-Le Signor, C.; Dousse, S.; Lorgeou, J.; Denis, J.B.; Bonhomme, R.; Carolo, P.; Charcosset, A. Interpretation of Genotype X Environment Interactions for Early Maize Hybrids over 12 Years. Crop Sci. 2001, 41, 663–669. [Google Scholar] [CrossRef]
- Li, Z.; Coffey, L.; Garfin, J.; Miller, N.D.; White, M.R.; Spalding, E.P.; de Leon, N.; Kaeppler, S.M.; Schnable, P.S.; Springer, N.M.; et al. Genotype-by-Environment Interactions Affecting Heterosis in Maize. bioRxiv PLoS ONE 2017, 13, e0191321. [Google Scholar] [CrossRef]
- Yan, W.; Kang, M.S.; Ma, B.; Woods, S.; Cornelius, P.L. GGE Biplot vs. AMMI Analysis of Genotype-by-Environment Data. Crop Sci. 2007, 47, 643–655. [Google Scholar] [CrossRef]
- Canizares, G.L.L.; Gonçalves, H.C.; Costa, C.; Rodrigues, L.; de Menezes, J.J.L.; Gomes, H.F.B.; Marques, R.O.; Branco, R.H. Use of High Moisture Corn Silage Replacing Dry Corn on Intake, Apparent Digestibility, Production and Composition of Milk of Dairy Goats. Rev. Bras. De Zootec. 2011, 40, 860–865. [Google Scholar] [CrossRef]
- Gauch, H.G. A Simple Protocol for AMMI Analysis of Yield Trials. Crop Sci. 2013, 53, 1860–1869. [Google Scholar] [CrossRef]
- Nataraj, V.; Bhartiya, A.; Singh, C.P.; Devi, H.N.; Deshmukh, M.P.; Verghese, P.; Singh, K.; Mehtre, S.P.; Kumari, V.; Maranna, S.; et al. WAASB-Based Stability Analysis and Simultaneous Selection for Grain Yield and Early Maturity in Soybean. Agron. J. 2021, 113, 3089–3099. [Google Scholar] [CrossRef]
- Branković-Radojčic, D.; Babić, V.; Girek, Z.; Tivanović, T.; Radojčić, A.; Filipović, M.; Srdić, J. Evaluation of Maize Grain Yield and Yield Stability by AMMI Analysis. Genetika 2018, 50, 1067–1080. [Google Scholar] [CrossRef]
- Crossa, J.; de Los Campos, G.; Pérez, P.; Gianola, D.; Burgueño, J.; Araus, J.L.; Makumbi, D.; Singh, R.P.; Dreisigacker, S.; Yan, J.; et al. Prediction of Genetic Values of Quantitative Traits in Plant Breeding Using Pedigree and Molecular Markers. Genetics 2010, 186, 713–724. [Google Scholar] [CrossRef] [PubMed]
- Olivoto, T.; Lúcio, A.D.C.; da Silva, J.A.G.; Marchioro, V.S.; de Souza, V.Q.; Jost, E. Mean Performance and Stability in Multi-Environment Trials I: Combining Features of AMMI and BLUP Techniques. Agron. J. 2019, 111, 2949–2960. [Google Scholar] [CrossRef]
- Olivoto, T.; Lúcio, A.D.C.; da Silva, J.A.G.; Sari, B.G.; Diel, M.I. Mean Performance and Stability in Multi-Environment Trials II: Selection Based on Multiple Traits. Agron. J. 2019, 111, 2961–2969. [Google Scholar] [CrossRef]
- Grassini, P.; Eskridge, K.M.; Cassman, K.G. Distinguishing between Yield Advances and Yield Plateaus in Historical Crop Production Trends. Nat. Commun. 2013, 4, 2918. [Google Scholar] [CrossRef]
- Wang, C.; Hu, S.; Gardner, C.; Lübberstedt, T. Emerging Avenues for Utilization of Exotic Germplasm. Trends Plant Sci. 2017, 22, 624–637. [Google Scholar] [CrossRef]
- McCouch, S.; Baute, G.J.; Bradeen, J.; Bramel, P.; Bretting, P.K.; Buckler, E.; Burke, J.M.; Charest, D.; Cloutier, S.; Cole, G.; et al. Feeding the Future. Nature 2013, 499, 23–24. [Google Scholar] [CrossRef]
- Moreta, D.E.; Mathur, P.N.; van Zonneveld, M.; Amaya, K.; Arango, J.; Selvaraj, M.G.; Dedicova, B. Current Issues in Cereal Crop Biodiversity. Adv. Biochem. Eng. Biotechnol. 2013, 147, 1–35. [Google Scholar] [CrossRef]
- Nelson, P.T.; Goodman, M.M. Evaluation of Elite Exotic Maize Inbreds for Use in Temperate Breeding. Crop Sci. 2008, 48, 85–92. [Google Scholar] [CrossRef]
- Aboagye, I.A.; Baron, V.S.; Oba, M.; Guyader, J.; Beauchemin, K.A. In Vitro Degradation and Methane Production of Short-Season Corn Hybrids Harvested before or after a Light Frost. Can. J. Anim. Sci. 2019, 99, 741–753. [Google Scholar] [CrossRef]
- Darby, H.M.; Lauer, J.G. Harvest Date and Hybrid Influence on Corn Forage Yield, Quality, and Preservation. Agron. J. 1999, 94, 559–566. [Google Scholar] [CrossRef]
- Guyader, J.; Baron, V.S.; Beauchemin, K.A. Corn Forage Yield and Quality for Silage in Short Growing Season Areas of the Canadian Prairies. Agronomy 2018, 8, 164. [Google Scholar] [CrossRef]
- Zhao, M.; Feng, Y.; Shi, Y.; Shen, H.; Hu, H.; Luo, Y.; Xu, L.; Kang, J.; Xing, A.; Wang, S.; et al. Yield and Quality Properties of Silage Maize and Their Influencing Factors in China. Sci. China Life Sci. 2022, 65, 1655–1666. [Google Scholar] [CrossRef] [PubMed]
- Romay, M.C.; Millard, M.J.; Glaubitz, J.C.; Peiffer, J.A.; Swarts, K.L.; Casstevens, T.M.; Elshire, R.J.; Acharya, C.B.; Mitchell, S.E.; Flint-Garcia, S.A.; et al. Comprehensive Genotyping of the USA National Maize Inbred Seed Bank. Genome Biol. 2013, 14, R55. [Google Scholar] [CrossRef] [PubMed]
- The Nagoya Protocol on Access and Benefit-sharing The Nagoya Protocol on Access and Benefit-Sharing; Secretariat of the Convention on Biological Diversity United Nations Environmental Programme: Montreal, QC, Canada, 2022; ISBN 92-9225-306-9.
- Bailey-Serres, J.; Fukao, T.; Ronald, P.; Ismail, A.; Heuer, S.; Mackill, D. Submergence Tolerant Rice: SUB1’s Journey from Landrace to Modern Cultivar. Rice 2010, 3, 138–147. [Google Scholar] [CrossRef]
- Haverkort, A.J.; Boonekamp, P.M.; Hutten, R.; Jacobsen, E.; Lotz, L.A.P.; Kessel, G.J.T.; Vossen, J.H.; Visser, R.G.F. Durable Late Blight Resistance in Potato Through Dynamic Varieties Obtained by Cisgenesis: Scientific and Societal Advances in the DuRPh Project. Potato Res. 2016, 59, 35–66. [Google Scholar] [CrossRef]
- Goodman, M.M. Broadening the Genetic Diversity in Maize Breeding By Use Of. In The Genetics and Exploitation of Heterosis in Crops; Pandey, J.G.C.S., Ed.; American Society of Agronomy, Inc.; Crop Science Society of America, Inc.: Madison, WI, USA, 1999; pp. 139–148. [Google Scholar] [CrossRef]
- Holley, R.N.; Goodman, M.M. Yield Potential of Tropical Hybrid Maize Derivatives. Crop Sci. 1988, 28, 213–218. [Google Scholar] [CrossRef]
- Kim, S.K.; Efron, Y.; Khadr, F.; Fajemisin, J.; Lee, M.H. Registration of 16 Maize-Streak Virus Resistant Tropical Maize Parental Inbred Lines. Crop Sci. 1987, 27, 824–825. [Google Scholar] [CrossRef]
- Uhr, D.V.; Goodman, M.M. Temperate Maize Inbreds Derived from Tropical Germplasm: I. Testcross Yield Trials. Crop Sci. 1995, 35, 779–784. [Google Scholar] [CrossRef]
- Balint-Kurti, P.J.; Blanco, M.; Millard, M.; Duvick, S.; Holland, J.; Clements, M.; Holley, R.; Carson, M.L.; Goodman, M.M. Registration of 20 GEM Maize Breeding Germplasm Lines Adapted to the Southern USA. Crop Sci. 2006, 46, 996–998. [Google Scholar] [CrossRef]
- Salhuana, W.S.; Sevilla, R.; Jesus; Eberhart, S.A. 1931- Final Report, Latin American Maize Project. 1997. Available online: https://agris.fao.org/agris-search/search.do?recordID=US201300031773 (accessed on 18 November 2022).
- Carena, M.J.; Pollak, L.; Salhuana, W.; Denuc, M. Development of Unique and Novel Lines for Early-Maturing Hybrids: Moving GEM Germplasm Northward and Westward. Euphytica 2009, 170, 87–97. [Google Scholar] [CrossRef]
- GEM Germplasm Releases and Key Traits. Available online: https://web.archive.org/web/20181130231700/http://www.public.iastate.edu/~usda-gem/Official_Documents/GEM_Germplasm_Releases.htm (accessed on 23 June 2021).
- Coffman, S.M.; Hufford, M.B.; Andorf, C.M.; Lubberstedt, T. Haplotype Structure in Commercial Maize Breeding Programs in Relation to Key Founder Lines. Theor. Appl. Genet. 2020, 133, 547–562. [Google Scholar] [CrossRef] [PubMed]
- Shenk, J.S.; Westerhaus, M.O. The Application of near Infrared Reflectance Spectroscopy (NIRS) to Forage Analysis. Forage Qual. Eval. Util. 2015, 406–449. [Google Scholar] [CrossRef]
- Weiss, W.P.; Tebbe, A.W. Estimating Digestible Energy Values of Feeds and Diets and Integrating Those Values into Net Energy Systems. Transl. Anim. Sci. 2019, 3, 953. [Google Scholar] [CrossRef] [PubMed]
- Weiss, W.P.; Conrad, H.R.; St.Pierre, N.R. A Theoretically-Based Model for Predicting Total Digestible Nutrient Values of Forages and Concentrates. Anim. Feed Sci. Technol. 1992, 39, 95–110. [Google Scholar] [CrossRef]
- Charmley, E. Towards Improved Silage Quality—A Review. Can. J. Anim. Sci. 2011, 81, 157–168. [Google Scholar] [CrossRef]
- R: The R Project for Statistical Computing. Available online: https://www.r-project.org/ (accessed on 18 November 2022).
- Olivoto, T.; Nardino, M.; Meira, D.; Meier, C.; Follmann, D.N.; de Souza, V.Q.; Konflanz, V.A.; Baretta, D. Multi-Trait Selection for Mean Performance and Stability in Maize. Agron. J. 2021, 113, 3968–3974. [Google Scholar] [CrossRef]
- Henderson, C.R. Best Linear Unbiased Estimation and Prediction under a Selection Model. Biometrics 1975, 31, 423. [Google Scholar] [CrossRef]
- Snedecor, G.W.; George, W.; Cochran, W.G.; William, G. Statistical Methods; Iowa State University Press: Ames, IA, USA, 1967; p. 593. [Google Scholar]
- Piepho, H.P. Best Linear Unbiased Prediction (BLUP) for Regional Yield Trials: A Comparison to Additive Main Effects and Multiplicative Interaction (AMMI) Analysis. Theor. Appl. Genet. 1994, 89, 647–654. [Google Scholar] [CrossRef]
- 2021 Results: PA Commercial Grain and Silage Hybrid Corn Tests Report. Available online: https://extension.psu.edu/2021-results-pa-commercial-grain-and-silage-hybrid-corn-tests-report (accessed on 8 January 2023).
- Thomas, E.D.; Mandebvu, P.; Ballard, C.S.; Sniffen, C.J.; Carter, M.P.; Beck, J. Comparison of Corn Silage Hybrids for Yield, Nutrient Composition, In Vitro Digestibility, and Milk Yield by Dairy Cows. J. Dairy Sci. 2001, 84, 2217–2226. [Google Scholar] [CrossRef]
- Melchinger, A.E.; Utz, F.H.; Bay, A.; Mirdita, V.; Ludewig, U. Silage Yield and Quality Traits in Elite Maize Hybrids and Their Relationship to Elemental Concentrations in Juvenile Plants. Plant Breed. 2016, 135, 55–62. [Google Scholar] [CrossRef]
- Thiex, N.J.; Manson, H.; Anderson, S.; Persson, J.-Å.; Collaborators; Anderson, S.; Bogren, E.; Bolek, G.; Budde, D.; Ellis, C.; et al. Determination of Crude Protein in Animal Feed, Forage, Grain, and Oilseeds by Using Block Digestion with a Copper Catalyst and Steam Distillation into Boric Acid: Collaborative Study. J. AOAC Int. 2002, 85, 309–317. [Google Scholar] [CrossRef]
- Gutierrez-Gaitan, M.A.; Cortez-Mendoza, H.; Wathika, E.N.; Gardner, C.O.; Oyervides-Garcia, M.; Hallauer, A.R.; Darrah, L.L. Testcross Evaluation of Mexican Maize Populations1. Crop Sci. 1986, 26, 99–104. [Google Scholar] [CrossRef]
- Fan, X.M.; Kang, M.S.; Chen, H.; Zhang, Y.; Tan, J.; Xu, C. Yield Stability of Maize Hybrids Evaluated in Multi-Environment Trials in Yunnan, China. Agron. J. 2007, 99, 220–228. [Google Scholar] [CrossRef]
- Yuksel, K.; Seyfi, T. Ceri Sait Nonparametric Stability Analysis of Yield Performances in Oat (Avena sativa L.) Genotypes Across Environments. Asian J. Plant Sci. 2003, 2, 286–289. [Google Scholar] [CrossRef]
- Miller, N.D.; Haase, N.J.; Lee, J.; Kaeppler, S.M.; de Leon, N.; Spalding, E.P. A Robust, High-Throughput Method for Computing Maize Ear, Cob, and Kernel Attributes Automatically from Images. Plant J. 2017, 89, 169–178. [Google Scholar] [CrossRef] [PubMed]


Disclaimer/Publisher’s Note: The statements, opinions and data contained in all publications are solely those of the individual author(s) and contributor(s) and not of MDPI and/or the editor(s). MDPI and/or the editor(s) disclaim responsibility for any injury to people or property resulting from any ideas, methods, instructions or products referred to in the content. |
© 2023 by the authors. Licensee MDPI, Basel, Switzerland. This article is an open access article distributed under the terms and conditions of the Creative Commons Attribution (CC BY) license (https://creativecommons.org/licenses/by/4.0/).