Article

Variety and Sowing Date Affect Seed Yield and Chemical Composition of Linseed Grown under Organic Production System in a Semiarid Mediterranean Environment

Department of Agriculture, Food and Environment (DAFE), University of Pisa, 56124 Pisa, Italy
*
Author to whom correspondence should be addressed.
Agronomy 2023, 13(1), 45; https://doi.org/10.3390/agronomy13010045
Submission received: 16 November 2022 / Revised: 16 December 2022 / Accepted: 20 December 2022 / Published: 22 December 2022

Abstract

:
The use of suitable species and varieties in organic cropping systems is essential for improving resource use efficiency, biodiversity, and agroecosystem resilience. Within the SIC-OLEAT project, a 2-year field trial was carried out in two contrasting environments of Central Italy, with the aim to hypothesize a production path for linseed inclusion within organic farming. The effects of location, genotype and sowing date on crop phenology, agronomic performances, and qualitative traits were evaluated. Generally, linseed showed good agronomic traits that make it suitable to be introduced in organic systems. Autumn sowing coupled with milder and wetter conditions seemed to be more favorable for linseed cultivation, allowing a higher seed yield (2.1 vs. 1.3 Mg ha−1) and oil content (47.2 vs. 45.2%). From multivariate analysis, the superior genotypes were Kaolin > Szafir > Galaad, and among these Kaolin had the highest production stability. On the contrary, Libra was the lowest performing one and the most unstable. These findings underline the importance of a site-specific approach for choosing the most suitable variety, since both sowing date and location are meteoclimatic-related factors. Definitively, our results demonstrated that linseed might be a valuable autumn alternative for organic cropping system diversification, contributing to the local production of vegetable oils and proteins.

1. Introduction

European cropping systems are often characterized by short rotations or even monocropping, leading to environmental issues such as soil degradation, water eutrophication, and air pollution including greenhouse gas emissions, which contribute to climate change and biodiversity loss [1,2,3]. A transition in Europe to biodiversity-based cropping systems relying more on ecosystem services, along with the development of local and short value chains, is a major path to face the challenges of balancing production with environmental preservation [4]. The diversification of cropping systems, with species and varieties suited to the specificities of the cultivation environment, is a key action to confer flexibility to agricultural rotations, increasing within-field biodiversity, improving soil health, helping to stabilize yields and, ultimately, to guarantee farming profitability and supporting more diversified agrifood systems at large [5,6]. Multipurpose oilseed crops can represent a reasonable choice to help farmers in increasing cropping system reliability, due to low input requirements and high stress tolerance [7,8,9]. At the same time, these crops can offer new market opportunities to European farmers and support the development of a bio-based economy and sustainable farming system designed in the EU. New/rediscovered/multipurpose oilseed crops include linseed (Linum usitatissimus L.), safflower (Carthamus tinctorius L.), hemp (Cannabis sativa L.), Ethiopian rape (Brassica carinata A. Brown),camelina (Camelina sativa (L.) Crantz), and others.
Aside from the centuries-old utilization mainly as fiber crop and paint component [10], nowadays linseed is gaining the attention of both scientific and industrial audiences in view of its unique fatty acid composition, agronomic advantages, provision of new rotation options, and the ability to be grown on lands where commodity crops are not currently economically viable [11]. Linseed is a valuable source of vegetable oil, which can be used as functional food or converted to biofuels and other biobased products through various chemical transformations [12,13,14]. Linseed oil has an interesting lipid-fraction composition with high concentration of polyunsaturated fatty acids (PUFAs), mainly represented by α-linolinic acid (ALA) [15]. ALA is considered, also at a legislative level, as an important constituent for a healthy diet, being included in the list of permitted health claims according to the Commission Regulation (EU) n.432/2012 as: “ALA contributes to the maintenance of normal blood cholesterol levels”. In addition to the PUFA content, other molecules contained in linseed, such as lignans and tocopherols, have been shown to have anti-inflammatory and antioxidant properties [16]. Linseed oil and linseed by-products such as seedcake, can be further used as feed raw material, for obtaining functional foods derived both from monogastric and polygastric animals [17,18], which, in addition to the health value, constitute an important market niche that can economically enhance the organic farming sector [19]. In the 2010–2020 period, the main linseed producers worldwide were Canada, Kazakhstan, and the Russian Federation [20], due to cooler climates more suited to flax cultivation; on the contrary, in Southern European countries characterized by a Mediterranean climate, linseed still represents a crop with marginal spread, in favor of herbaceous oilseed crops for which the production-tradition and agronomic practices are well consolidated, such as sunflower (Helianthus annuus L.), rapeseed (Brassica napus L.) and soy (Glycine max (L.) Merr). The lesser linseed spread probably depends on its lower intrinsic productivity compared to the other above-mentioned crops as well as to its environmental needs (i.e., water availability and mild temperatures during flowering and seed filling) especially when accomplished as spring crop [21,22].
In Tuscan cropping systems, with particular reference to the organic ones, the crop species choice often falls on rainfed winter cereals or spring rainfed crops such as sunflower. In this context linseed could represent a promising winter or spring crop to be introduce in organic systems, due to its low input requirements. However, a site-specific assessment of crop suitability/adaptability is needed, as linseed can be sensitive to late-spring cold or to high temperature and drought occurring during flowering and seed filling, causing a significant reduction in seed yield and quality [23].
The study, carried out within the SIC-OLEAT project, aimed to assess the adaptability of different linseed varieties—as vegetable oil and protein sources—to the pedoclimatic conditions of the Tuscany region (Central Italy) and to organic production systems, through a site-specific approach. Consequently, a 2-year field trial was carried out in two contrasting environments, representative of the northern and southern coastal areas, respectively, comparing five commercial linseed varieties in autumn and spring sowing with the aim to hypothesize a production path for the inclusion of this new crop within organic rainfed cropping systems. The effects of the environment, genotype and sowing date (autumn and spring) on the crop phenology, agronomic performances, seed and oil production, fatty acid composition, and protein content have been evaluated.

2. Materials and Methods

2.1. Experimental Setup and Plant Material

Field-plot trials were conducted in the 2020 and 2021 growing seasons at the Experimental Center of DAFE, located in the lower Arno River plain (San Piero a Grado—SPG, Pisa province, 43°40′29″, 10°18′47″) in northern Tuscany, and at the Tuscany Region Agricultural Center (TeReTo), located at Alberese (ALB, Grosseto province, 42°41′38″, 10°08′29″), in southern Tuscany.
In each site, five commercial linseed varieties (Galaad, Libra, Sideral, Szafir, Kaolin) were compared in spring and autumn sowings within an organic system. Among the tested varieties, Galaad and Sideral were winter varieties, while the other ones were “alternative” types, suitable for both autumn and spring sowing. The spring sowing was accomplished in the 2020 growing season (7 April and 13 February 2020, in SPG and ALB, respectively) and the plants closed their cycle in the summer of the same year (on 20 July 2020 and 26 June 2020 at SPG and ALB, respectively). The autumn sowings were performed in the autumn 2020 (10 October and 11 November 2020, in SPG and ALB, respectively) and the crops were ready to be harvested in the summer of 2021 (30 June 2021 and 21 June 2021 at SPG and ALB, respectively).
Winter wheat (Triticum turgidum L. subsp. durum (Desf.) Husn.) preceded the linseed, assuming a rainfed cereal-based cropping system. In each site and for each sowing date, plots of the different genotypes were arranged in a randomized complete block design with four replications with sowing time and cultivar as variability factors. The plot area was 18 m2 (6 × 3 m) and a seed rate of 45 kg ha−1 was adopted, with a raw-spacing of 15 cm. Commercial organic fertilizer (2.8% N; 2,5% P2O5; 3% K2O) was applied in each plot at the rate of 700 kg ha−1. Weed management was performed manually and no insect or pathogen attack was observed.
In both sites, soil physical and chemical properties were evaluated at a 30 cm depth at the beginning of each trial. Soil total nitrogen was evaluated using the macro-Kjeldahl digestion procedure [24]. Soil organic carbon was determined using the modified Walkley–Black wet combustion method, then soil organic matter was estimated by multiplying soil organic carbon concentration by 1.724 [25]. According to USDA soil texture classes, in both locations sandy loam soils were used for spring sowings, while autumn sowings were realized in loamy soils, both at SPG and ALB. In both locations and sowing dates, soils were characterized by a medium level of total nitrogen and average organic matter content (Table 1). Soil texture differences observed in ALB were due to the different fields used for experimentation, pointing out the high soil variability that characterizes the Tuscan territory [26].
Daily meteorological data (rainfall and temperature), of both growing seasons and long-term period (30 years) trends were obtained via automatic meteorological stations located near each experimental site. The long-term data record was then used for the computation of the standardized precipitation–evapotranspiration index (SPEI) on a 3 (SPEI_3) and 6 (SPEI_6) months basis, as proposed by Vicente-Serrano et al. [27]. SPEI, being calculated using both rainfall and temperature, is considered more reliable compared to other indexes for the assessment of the extent and duration of drought periods [28], even in the climatic conditions present in Central Italy [29]. Furthermore, SPEI index could assume a not-negligible importance in assessing whether the observed meteorological data reflect the normal weather pattern of the area or an extraordinary weather condition. Afterwards, the reference crop evapotranspiration (ET0) for each site and each growing season, was obtained by the Hargreaves–Saemani formula in the form reported by Allen et al. [30].

2.2. Plant Sampling and Measurements

For each genotype and along the two growing seasons, dates of emergence, stem elongation, flowering, and seed maturity (harvest) were recorded according to Smith and Froment [31].
Cycle length was calculated as the number of days from sowing to harvest and the accumulated growing degree days (GDD) were calculated for each growing season considering a 5 °C Tbase.
When the seeds had fully ripened (seed moisture < 12%, BBCH 89), the plants were manually harvested on a sampling area of 1 m2 in the inner part of each plot, collecting all aboveground biomass. Harvests were performed on 20 July 2020 and 26 June 2020 for spring crops at SPG and ALB, respectively, and on 30 June 2021 and 21 June 2021 for autumn crops at SPG and ALB. Within the collected biomass, sub-samples of 15 plants were randomly selected, and, plant density, plant height, number of primary branches, number of fertile and sterile capsules and yield components were measured. Afterwards, all plants were separated by the different organs (seeds, capsules, straw) using a fixed-point trasher for fresh and dry weight determinations. Dry weights were measured after oven-drying (60 °C) to constant weight. Thousand seed weight (TSW) was assessed according to ISTA [32], and dry matter harvest index (HI) was calculated as the dry seed yield/total above-ground dry biomass × 100.

2.3. Oil and Protein Content and Fatty Acid Composition

Oil and protein percentages were obtained using a FOSS-NIRS DA1659 analyser (FOSS, Hillerød, Denmark).
Fatty acid composition was determined by gas chromatography of free and bound fatty acids following their conversion into fatty acid methyl-esters, according to Tavarini et al. [33]. Fatty acid methyl-esters were obtained by pouring 0.2 g of finely ground sample and 3 mL of 10% methanolic solution into 20 mL vials and mixed for 60 s. An amount of 0.5 mg of internal standard (nonadecanoic acid) was added to the mix. After 8 h, 1 mL of hexane were poured into the vial and the mixed for 1 min. The mix was then centrifuged for 10 min at 5000 rpm to separate the layers and the hexane fraction was injected to gas-chromatographic analysis, using a GC2010 Shimadzu gas chromatograph (Shimadzu, Columbia, MD, USA) equipped with a flame-ionization detector and a high-polar fused-silica capillary column (Chrompack CP-Sil88 Varian, 152 Middleburg, Netherlands). Hydrogen was used as carrier gas at 1 mL min−1 flow. The injector temperature was set at 270 °C and the detector temperature was set at 300 °C. Individual fatty acid methyl-esters were identified by comparison with a standard mixture of a 52-component fatty acids methyl-esters mix (Nu-Chek Prep Inc., Elysian, MN, USA).

2.4. Statistical Analysis

Results were subjected to 3-way ANOVA (Genotype × Sowing Date × Location), and means were compared by Tukey’s HSD test when the ANOVA F-test was significant at the 0.05 probability level. Pearson’s correlation coefficients were estimated to determine the relationship between all traits analysed. For statistical analysis, CO-STAT cohort V6.201 (2002) was used. An additional statistical analysis was carried out to evaluate the significant interaction between genotype and environment (G × E) for seed yield to define the varieties characterized by more yield stability across environments. To explain the G × E interaction, the multivariate analysis was performed graphically based on the AMMI and GGE biplot using R studio (a simplified version of R statistical software) developed by the R Core Team. The metan package, an open-source R package designed to provide an efficient and reproducible workflow for the analysis of MET (multi-environment trials) data, was used. A stable version of metan is available on CRAN (https://CRAN.R-project.org/package=metan; accessed on 10 December 2022). A GUI package of R studio was used for GGE biplots while the agricolae package was used for AMMI, involving two concepts, the biplot concepts and the GGE concept [34]. The GGE biplots and AMMI are graphical images to exemplify G × E interaction and genotype ranking based on mean and stability. The graph generated is based on multi-environment evaluation (which-won-where pattern), genotype evaluation (ranking genotype and mean versus stability), and tested environment raking (discriminative versus representative). The biplots were based on singular-value partitioning (SVP) = 1, transformed (transform = 0), environment-centered (G + GE, centering = 2), and standard deviation-standardized (scaling = 0).

3. Results

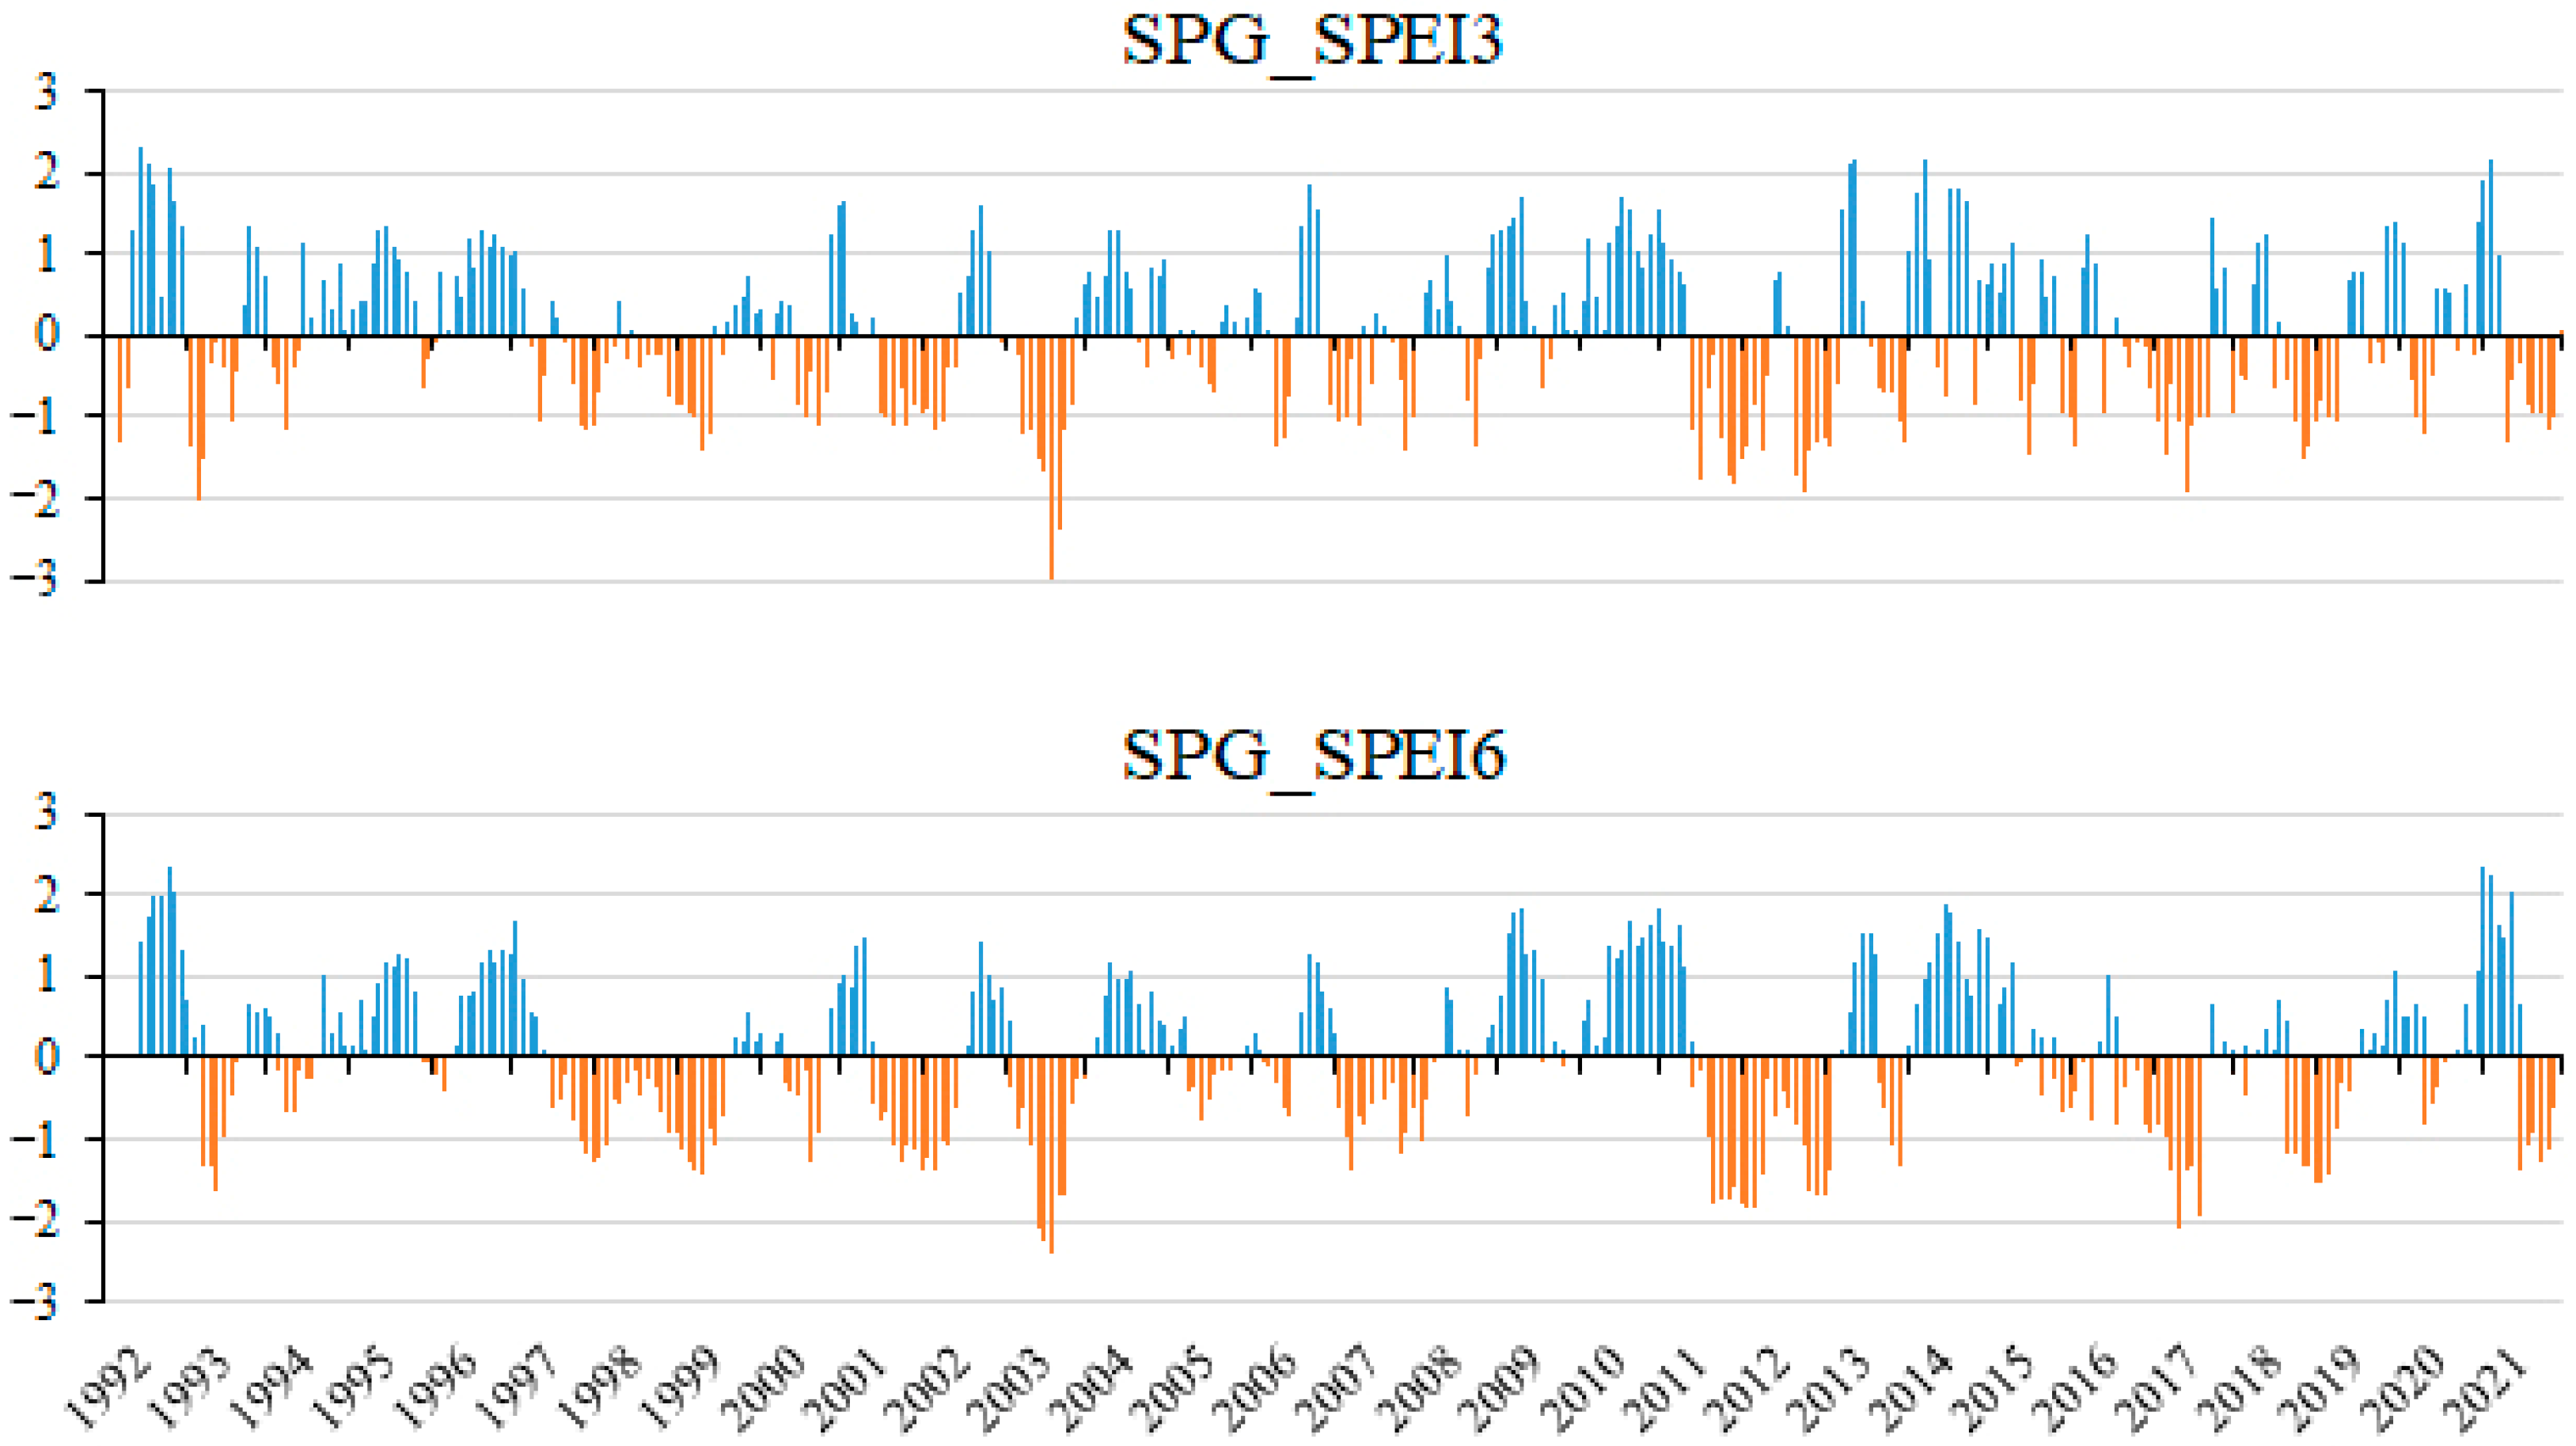
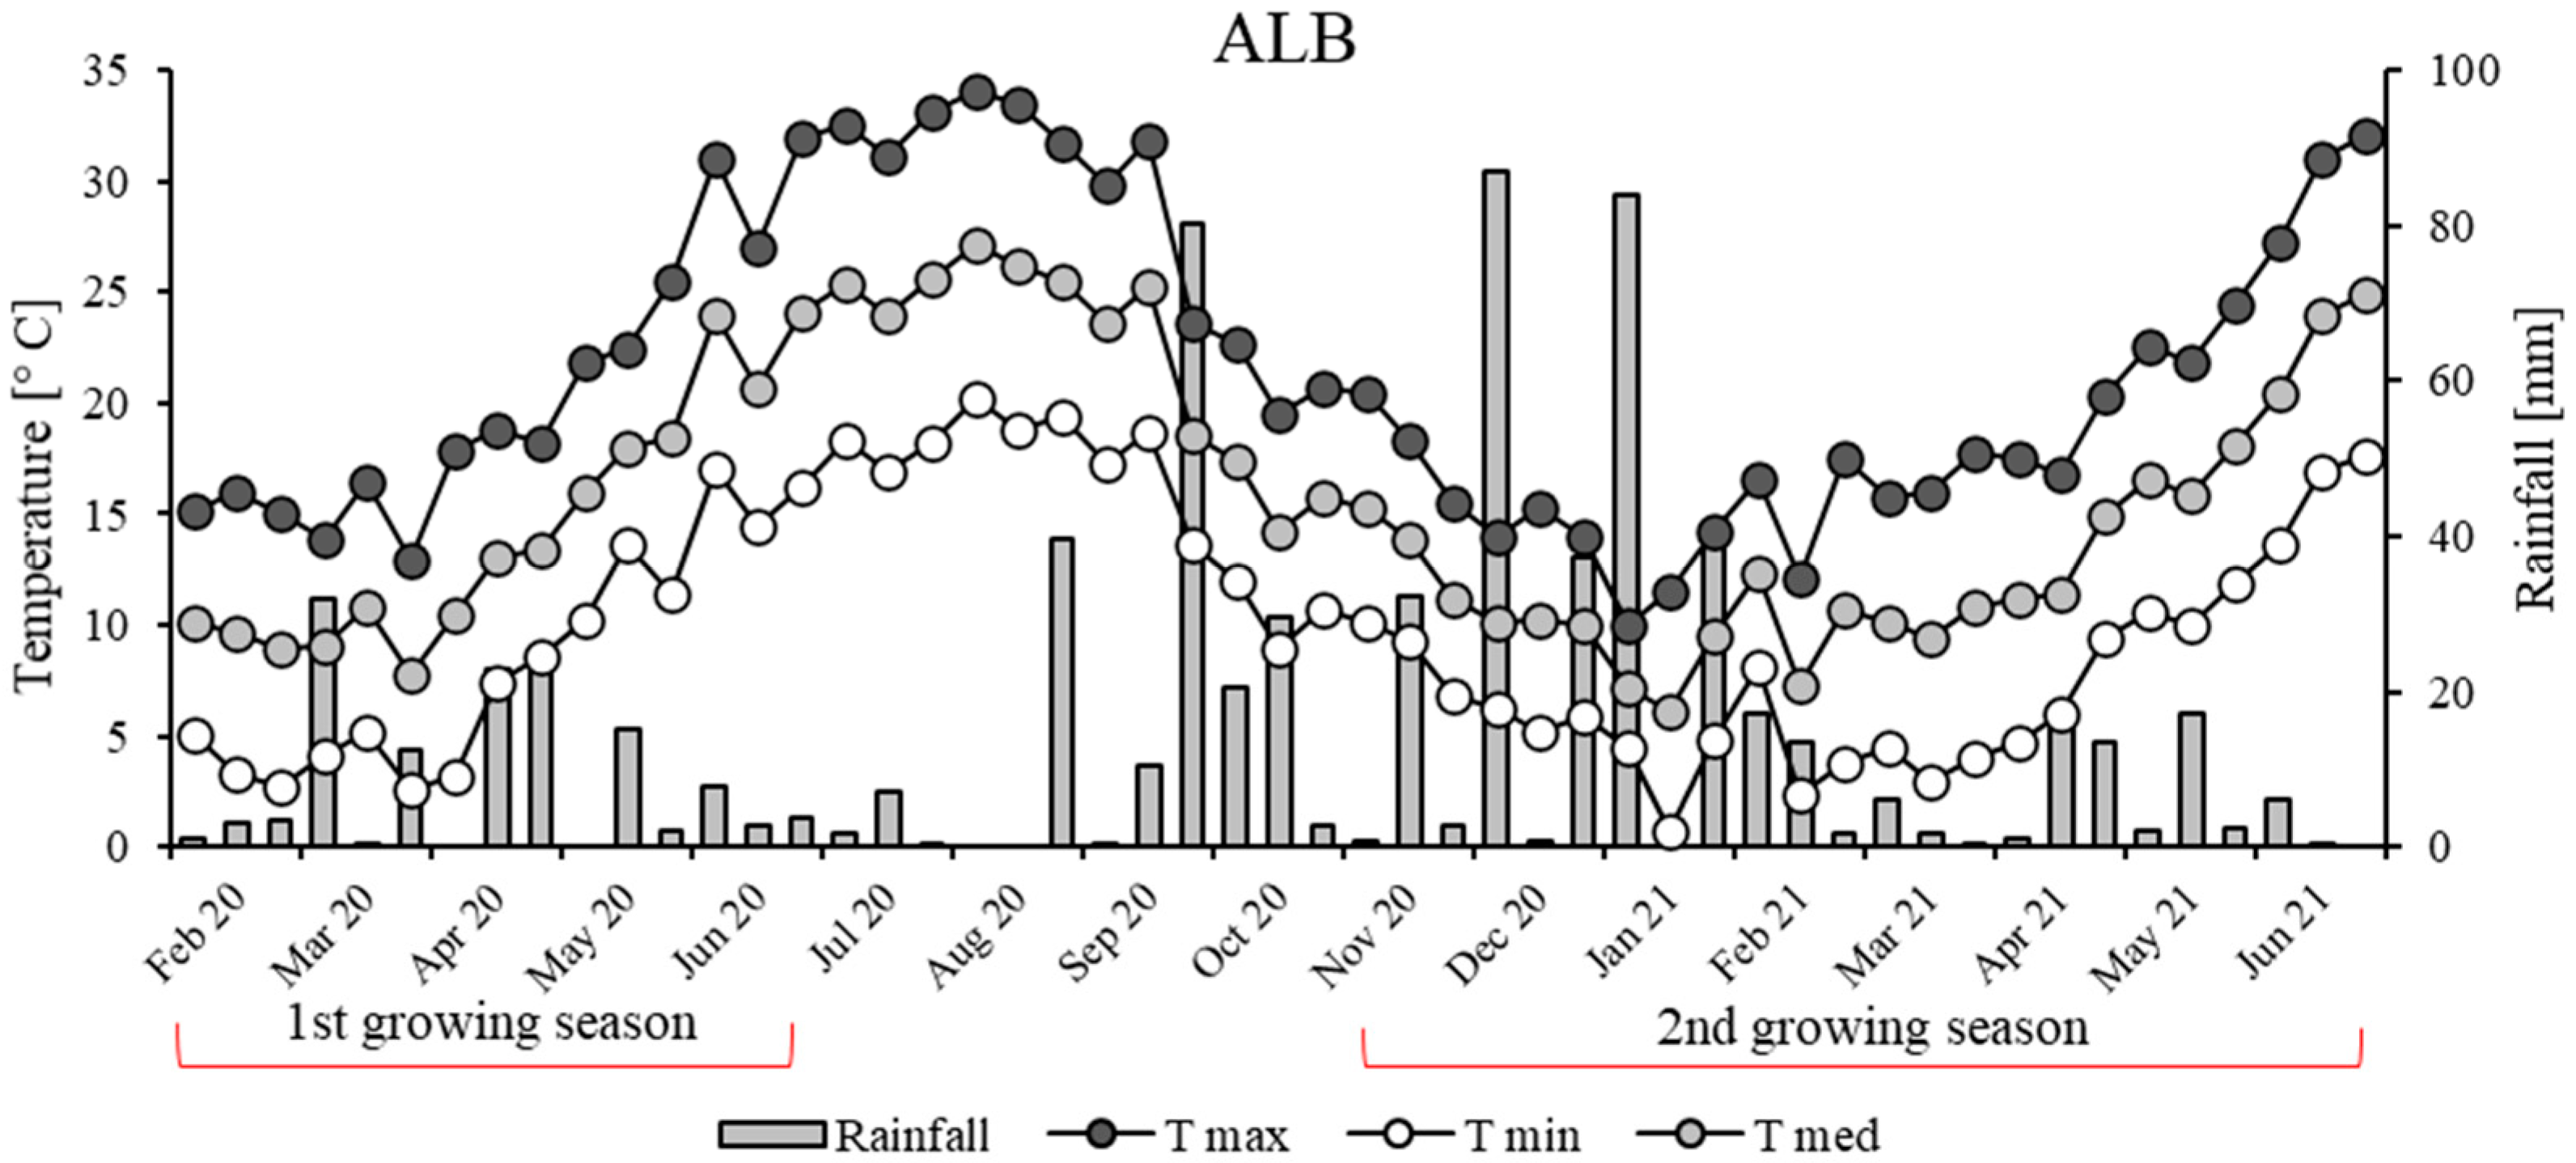
3.1. Weather Conditions and Crop Phenology

In both sites, the long-term rainfall pattern was similar, with precipitation mainly concentrated during the October-February period, but on average, higher annual cumulative rainfall was measured at SPG (890 mm), compared to ALB (685 mm). Long-term average temperature almost overlaps among sites; however, ALB had a wider temperature range, with lower average minimum (−1.1 °C on annual base) and higher average maximum temperature (+1.9 °C on annual base) compared to SPG.
Wider temperature range was also observed at ALB during the two growing seasons, in the first one (February 2020–July 2020), Tmax and Tmin were, respectively, +2.2 °C and −2.1 °C compared to SPG, while in the second season (October 2020–June 2021) Tmax and Tmin at ALB were +2.1 °C and −1.2 °C compared to SPG. During both growing seasons, cumulative rainfall was higher at SPG compared to ALB, as reported in Figure 1 and Figure 2.
In both locations, the lowest value of SPEI_3 was reached in April 2021 (−1.1 ALB and −1.3 SPG), while for both SPG and ALB, SPEI_6 values lower than −1.0 were never observed (Figure 3 and Figure 4). However, negative values slightly below −1.0 are very frequent in long-term SPEI_3 and SPEI_6 index calculations, so the computed values should be considered in line with the typical meteorological fluctuations of both experimental sites. This suggests that during the two-year trial, there were no periods of extraordinary drought compared to the normal weather condition trend, and the drought level could be considered as the one normally present in the areas. Differences between SPG and ALB, on the absolute values of meteorological drought-related factors (lack of rainfalls and high temperatures), are therefore to be considered those normally present between the two experimental sites. Conversely, positive values of SPEI_6 (+2.3; +2.2) and SPEI_3 (+1.9; +2.2) calculated at SPG in January and February 2021, indicate how the rainfall that occurred in the winter 2020–2021 was exceptional, among the highest on record for the previous 30 years.
As expected, linseed varieties showed a shorter growth cycle, from sowing to harvest, when sown in spring compared to the autumn sowing, with an average spring cycle length of 100 and 135 days in SPG and ALB, respectively, and 219 and 223 days for the autumn cycle, in SPG and ALB, respectively (Table 2). At SPG, little difference was detected for the GDD accumulated from sowing to harvest between the two sowing dates (1377 vs. 1463 GDD for spring and autumn sowing, respectively), while more consistent variations have been observed at ALB (1245 vs. 1656 GDD, for spring and autumn sowing, respectively). Regarding varieties, Galaad was the earlier one in both sites, starting flowering after having accumulated 549 and 471 GDD in the spring sowing, at SPG and ALB, respectively, and 727 and 713 GDD in the autumn sowing, at SPG and ALB, respectively. On the other hand, Sideral was characterized by a longer vegetative cycle, in comparison with the other cultivars, in the autumn sowing in both cultivation sites, requiring more days and GDD for flowering (Table 2).
The cumulative rainfall from sowing to harvest differed between the two sowing dates and between the two cultivation sites. Considering the cultivation site, linseed varieties grown in ALB received 34% and 52% less rain than those grown at SPG, in spring and autumn sowing, respectively. At ALB, a strong variation of rain distribution between the vegetative and reproductive phase was observed for both sowing dates, with lower amounts of rainfall between the start of flowering and seed maturity (Table 2). This developmental stage was also characterized by high ET0 levels. On the contrary, very similar values were observed at SPG in both vegetative and reproductive phase, except for rainfall distribution in the autumn sowing.

3.2. Yield and Yields Components

In Table 3 and Table 4, F-test results of the effect of location (L), sowing date (SD), genotype (G), and their reciprocal interactions on biometric characteristics, seed yield, yield components and qualitative traits (protein and oil content) are reported. A significant interaction among location, sowing date and genotype was observed for plant height, plant density, number of stems per plant, harvest index, and thousand seed weight. On the contrary, LxSD interaction significantly affected all the analyzed parameters, except given for oil content (Table 3 and Table 4). Similarly, significant effects of genotype, sowing date, and location were found. Only the percentage of sterile capsules, oil content and protein content did not vary with the time of sowing, and plant height was the same in both locations (Table 3 and Table 4).
Plant height was mainly determined by sowing date, as taller plants were obtained adopting autumn sowing compared to spring sowing in both locations (+7.4 cm at SPG and +18.3 cm at ALB) (Table 5). Besides sowing date, plant height was also determined on a genetic basis, with higher values reached on average by Libra, Szafir and Kaolin (+13.5%) compared to Galaad and Sideral (Table 3). Plant height results positively correlated with the number of seeds per capsule, seed yield and crop residues, and negatively correlated with the number of stems per plant, HI, and protein content (Table 6).
At SPG, plants density at maturity was lower during the autumn sowing compared to the spring sowing (−27.5%), while an opposite trend was observed at ALB, where autumn sowing increased the number of plants with almost +177 plants per m2, compared to the spring sowing (Table 5). However, a clear effect of genotype on this parameter was found, with higher plant density registered for Sideral and Kaolin (Table 3). Plant density was positively correlated with sterile capsule percentage and negatively correlated to number of capsules per stem, and oil content (Table 6).
Regarding the number of stems per plant, no differences were observed among locations with autumn sowing, while with spring sowing, an increase in the number of produced stems was observed at SPG (+17.2%) (Table 5). Little difference among genotypes was highlighted, besides a significant increase (+31%) in the number of stems plant−1 produced by Sideral compared to the other varieties (Table 3). No significant correlations have been found among the number of stems per plant and the other investigated parameters (Table 6).
No differences between sowing dates were observed at ALB regarding the number of capsules, with an average value of 9.3 capsule plant−1, while at SPG, the autumn sowing led to an increase of capsules per plant, with the highest values in plants sown in autumn (Table 5). The number of capsules per plant was strongly dependent on genotype, with the highest values reached by Libra and Szafir, followed by the other varieties (Table 3). As expected, the number of capsules plant−1 was positively correlated with seed yield, TSW, and oil content, while a negative correlation was observed with the percentage of sterile capsules and protein content (Table 6).
With spring sowing, sterile capsules were higher at SPG (+4.3%), while with autumn sowing, the percentage of sterile capsules was significantly higher (+14.0%) at ALB compared to SPG (Table 5). This parameter was also genotype-related, with highest percentage of sterile capsules observed in Szafir, while the lowest values were reached by Galaad and Libra (Table 3). No correlation was observed among sterile capsules and the other parameters (Table 6).
The number of seeds per capsule did not vary at SPG depending on sowing date, while at ALB autumn sowing increased this parameter by +79.7% (Table 5). The number of seeds per capsule turned out to be directly correlated with seed yield and crop residues, while a negative correlation was found with HI and protein content (Table 6).
A longer cycle (autumn sowing) increased seed yield in both locations, with higher improvement observed at ALB (+175%) compared to SPG (+37%) (Table 7). As a general trend, the highest yield (2.4 t ha−1) was reached at SPG with autumn sowing. Regarding genotype, in both locations, Libra reached the lowest seeds yield, while no differences among the other four varieties was observed (Table 3). However, for Galaad (−55.9%), Sideral (−45.0%) and Szafir (−31.1%) seeds yield at ALB was significantly lower compared to SPG. Conversely, Kaolin showed the highest grain yield in both locations with no statistically significant differences among ALB and SPG. Seed yield showed a positive correlation with crop residues and TSW and a negative correlation with protein content (Table 6).
Similarly to that observed for seed yield, crop residues reached the highest value in autumn-sown crops in both environments (Table 7). Adopting spring sowing, linseed produced +2 Mg ha−1 of residues on a dry matter basis at SPG in comparison with ALB. The lowest amount of crop residues was produced by Galaad, which was found to be significantly different only from Sideral and Kaolin (Table 4). As expected, crop residues were negatively correlated with HI (Table 6). A negative correlation was also found with protein content. According to the trend observed for the seed yield and crop residues, the harvest index significantly decreased with autumn sowing in both locations (Table 7), with a steeper drop (−11.2%) at ALB compared to SPG (−3.3%). On average, Galaad, Szafir, and Kaolin showed the highest HI according to their higher seed production (Table 4). However, a substantial difference was observed in Galaad due to the cultivation site (41.1 vs. 32.0 at SPG and ALB, respectively).
Galaad reached on average the highest values of TSW (Table 4); at SPG this variety showed the highest TSW in both sowing dates (8.0 and 9.0 g in spring and autumn sowing, respectively) while, at ALB comparable values were recorded also for Szafir and Kaolin in spring sowing (7.0 g and 6.8 g, respectively, vs. 7.1 g of Galaad), and for Szafir in autumn sowing (Szafir = 7.9 g; Galaad = 8.0 g). Sideral achieved the lowest TSW in both sowing dates and locations. TSW increased on average with autumn sowing (+16.8% at SPG, +10.7% at ALB) and was higher at SPG compared to ALB (+3.4% with spring sowing, +9.7% with autumn sowing) (Table 7). Moreover, the correlation analysis revealed a negative correlation between TSW and protein content (Table 6).
In spring-sown linseed varieties, oil content did not vary between the two environments, while a significant increase in oil content was recorded at SPG by adopting an autumn sowing (+2.3% at SPG compared to ALB) (Table 7). Higher oil concentration was obtained by Libra and Kaolin, while Sideral expressed the lowest value (Table 4). No differences among sowing dates were highlighted, while, as expected, a negative correlation between oil content and protein content was detected (Table 6). At ALB, a slight increase (+1.4%) of seed protein content was found, while sowing date did not influence this parameter (Table 4). Once again, the genotype played an important role in defining the protein content, with the highest value in the seeds of Sideral and the lowest in Kaolin (Table 4).

3.3. Additive Main Effects and Multiplicative Interaction Analysis: AMMI1 and AMMI2

Figure 5a shows the additive main effects and multiplicative interaction among five genotype and four environments for the grain yield trait. Each environment is given by sowing date–location combination, and they are expressed as SPG_2020 (spring sowing at SPG), SPG_2021 (autumn sowing at SPG), ALB_2020 (spring sowing at ALB) and ALB_2021 (autumn sowing at ALB). In AMMI1, the biplot abscissa and ordinate indicated the first principal component (PC1) term and the trait’s significant influence, respectively. Based on genotype mean and interaction with the environment, among the tested genotype, Libra is the lowest-producing variety and the most unstable, even in the most suitable environmental conditions for ALB when sown in spring. Sideral also appeared to be a low-performing variety and, together with Szafir, had the least G × E interaction, their PC1 scores being adjacent to the zero lines of the biplot (Figure 5a). The superior genotypes were Kaolin > Szafir > Galaad. Kaolin and Szafir were more adapted to the specific environment of ALB when sown in autumn (ALB_2021) while Galaad was better suited to the conditions of SPG by adopting a spring sowing (SPG_2020).
The AMMI2 biplot (PC1 and PC2; Figure 5b) provides summarized information about genotype x environment interaction: genotypes positioned near the origin had the least interaction, and the genotypes positioned near to the axis had more general stability. Furthermore, any genotypes that are close to each location have specific stability in that environment. In terms of grain yield, our results showed great interaction between genotypes and locations. The presence of a genotype at one of the vertices of the polygon in a sector where the environment markers fall, suggested that this genotype provided a higher seed yield and performed better in that environment. Consequently, our results suggested that Kaolin was suited and more stable for ALB in autumn sowing (ALB_2021); Sideral for SPG_2021; Galaad for SPG_2020, and Libra for ALB_2020. The Szafir genotype placed within the polygon was less respective to the environment than the corner genotypes.

3.4. Genotype Plus Genotype-vs.-Environment Interaction Analysis: GGE Biplot

Our results show the GGE-biplot model in Figure 6a discriminating four environments (sowing date–location combination) with a clear separation in the upper and lower right quadrants, respectively (ALB_2020 and ALB_2021; SPG_2020 and SPG_2021). In Figure 6b, the genotype ranking biplot for the assessment of the best and ideal genotype is reported. Kaolin can be noted as the best leading genotype due to its nearness to the arrowhead in the circle for the seed yield produced. The GGE biplot pattern of ‘mean vs. stability’ analysis was also performed (Figure 6c). The ‘mean vs. stability’ helps to simplify the genotype assessment based on the mean performance and stability under a wide range of environments. Line one consists of a single arrow that points towards greater mean grain yield. In our investigation, the ‘mean vs. stability’ pattern revealed 92.22% for seed yield of G + G × E variation. The arrow sign on the abscissa line directs the ranking of genotypes in increasing order, with a greater value of the productive trait evaluated (Libra > Sideral > Galaad > Szafir > Kaolin). Additionally, the determination of a best-suited environment is crucial for a successful introduction of a new crop variety within a specific cropping system. The two features ‘discriminativeness’ (the ability of an environment to distinguish genotype) and ‘representativeness’ (the ability of an environment to represent all other evaluated environments) mean the idealness of the tested environments. In our study, Figure 6d illustrates the ‘discriminativeness vs. representativeness’, underlining that environment is better than another, but both ALB and SPG in spring (2020) and autumn (2021) gave satisfactory productive results.

3.5. Seed Oil Composition

In Table 8, F-test results of the effects of location (L), sowing date (SD), genotype (G), and their reciprocal interaction on seed oil composition are reported. All the three variability factors and their reciprocal interactions significantly affected the main fatty acid (FA) profile of linseed oil. Linseed oil is characterized by a high degree of unsaturation, with polyunsaturated fatty acids (PUFAs) accounting for about 70%. Among PUFAs, the predominant FAs are represented by α-linolenic (C18:3) and linoleic (C18:2) acids, which represent 56% and 15% of total FAs, respectively. Monounsaturated fatty acids (MUFAs) are around 20%, almost exclusively represented by oleic acid (C18:1), while saturated fatty acids (SFAs) account for 7%, made up mainly of palmitic acid (C16:0). Taking into account the effect of cultivation site, the environmental conditions of SPG favored the accumulation of α-linolenic acid and increased PUFA levels, while seeds obtained by linseed grown at ALB showed the highest levels of MUFA, SFA, oleic acid and linoleic acid (Table 8). According to these profiles, the omega 6 to omega 3 ratio significantly decreased at SPG. These results underlined the key role played by the environmental conditions in defining the FAs profile of linseed oil. Similarly, sowing date also strongly affected the fatty acid composition and oil quality. In general, spring sowing increased the content of the α--linolenic and oleic acids, and, consequently, PUFAs and MUFAs levels as well as PUFAs to SFAs ratio. Accordingly, the lowest omega 6/omega 3 ratio was reached by adopting this sowing time. Finally, genotypic characteristics confirmed to be one of the main factors influencing the FA profile of linseed oil. Among the tested varieties, Libra exhibited simultaneously the highest C18:3 content (61.2% of total FA), PUFA levels (74.5%) as well as PUFAs/SFAs ratio (12.3), but the lowest omega 6/omega 3 ratio. Conversely, an opposite profile was observed for Galaad, which showed the highest levels of C18:1 (22.2%), C18:2 (17.8%), MUFAs (22.3%) and omega 6/omega 3 ratio (0.40), and the lowest content of C18:3 (51.7%). Interestingly, Sazfir was characterized by the highest content of monounsaturated palmitic (8.3%) and heptadecanoic (0.11%) acids.

4. Discussion

Mediterranean cropping systems are mainly based on cereals, often grown in monoculture. Therefore, for increasing crop diversification and cropping system sustainability, organic farmers are looking for alternative crops suited to specific pedoclimatic conditions to introduce in their traditional rotations. So, this study aimed to provide local references about the introduction of linseed under organic management in central Italy, as a suitable and innovative crop, comparing two different environments, five varieties and two sowing dates. As a general trend, the tested linseed varieties demonstrated a good adaptability to both the pedoclimatic conditions of the two contrasting environments (SPG and ALB) and the organic farming system, as confirmed by the good seed and biomass yield, and oil content and quality. However, significant differences in terms of morphological, biometric and yield parameters were detected between the two locations, between the two sowing dates and among varieties, confirming that environmental conditions and agronomic practices can significantly influence linseed performances.
In our study, autumn linseed completed its growing cycle in 226 days, accumulating 1560 GDD (as mean values across locations and varieties); on the other hand, the spring crop required 118 days from sowing to harvest, with a thermal request of 1311 GDD. These findings are in line with those observed by Tavarini et al. [33] who compared two linseed varieties in spring sowing. Čeh et al. [35], in spring experimental trials carried out in four different locations in Slovenia, observed a similar cycle length, ranging from 96 to 120 days depending on location. These authors found that high temperatures and water shortages shortened the growing cycle of the tested linseed varieties. Also, the genetic characteristics were involved in defining the timing and duration of each phenological phase, together with the corresponding growing degree days. In both locations, Galaad was the earlier variety, while Sideral required more days and GDD for flowering. These observations can be extremely useful in the proper variety choice in function of the climatic conditions of a specific environment, preferring early cultivars in environments characterized by high temperatures and very little water availability in the late spring/summer period. It is known as this is a critical period able to significantly influence the duration of seed filling and the translocation of photoassimilates to the seeds, affecting, in turn, seed yield and quality.
Regarding biometric characteristics, no correlation between plant height and plant density was observed, although an increase in the number of plants per unit area generally leads to taller plants due to an increased intraspecific competition for light as reported by Kurtenbach et al. [36]. In any case, shorter plants were obtained in spring sowings for the shorter growing cycle as compared to autumn sowings. Plant height, moving upwards the plants centre of mass, could increase lodging damage [37], so in a windy climatic context, the choice of a small-size genotype might be a determining factor. Our findings are partially in contrast with those reported by Gajardo et al. [38], which suggested that smaller plants with limited vegetative biomass are more efficient in photoassimilate translocation, increasing yield components and seed yield. Conversely, we observed that short genotypes selected for seeds production, such as those used in the present study, if subjected to agronomic practices that favour their vegetative development, such as early sowing, can strongly increase their production level. Moreover, despite the great phenotypic plasticity of linseed, with a great ability to respond to changed spacing, compensating for low plant populations through extensive branching [33,39], our findings showed no significant correlation between plant density and number of stems per plant. On the contrary, plant density negatively affected the number of capsule plant−1 according to Benaragama et al. [40]. Lower plants density at SPG in autumn sowing was probably due to the exceptional rainfall which occurred in the 2020–2021 autumn/winter season, which may have caused a significant degree of plant losses in the first development stages. As already discussed, cumulative rainfall at ALB from December 2020 to January 2021 was considerably lower compared to SPG, so the same decline in plant density was not observed. Although to the best of our knowledge no studies on linseed resistance to waterlogging are available, our findings suggested that linseed had some degree of resistance to waterlogging, and that this resistance varied across genotypes. Despite plant density of autumn crop being lower at SPG in comparison to ALB, the highest seed yield was recorded at SPG, confirming that linseed, if no other limiting factors are present, is widely able to compensate the lack of plant m−2 with other yields components [41]. The number of stems per plant was strongly dependent on genotype, as previously observed by Kalinina and Lyakh [42] and, together with plant height, is linked with crop interspecific competition for resources [43]. In our study, the negative correlation found together with the genotype-effect involved in the determination of these parameters, can indicate different “strategies” among linseed varieties, for optimal ground cover.
In the Mediterranean climate, it has been observed that linseed was very efficient in photosynthates assimilation, with a high increase in biomass post-anthesis [44], which differs to other species where post-anthesis biomass accumulation can be substantially reduced during grain filling [45]. In any case, the presence of stressor factors after the onset of flowering can negatively affect linseed yields and yield components [46]. In our experiment, water stress was indirectly measured through ET0 computation that indicates the magnitude of the environmental evapotranspiration demand in the two locations, which is particularly important from full flowering to seed maturity. The high evapotranspiration rate in the southern area of Tuscany (ALB) may have been a determining factor in significantly reducing linseed yields at ALB, especially during the first year with spring sowing, when the field trial was carried out on a soil with a predominant sandy component (Table 1) In addition to the water-stress, in the first year the low number of capsules per plant and the high abortion percentage were probably due to a late frost event which occurred on April 8th: at ALB Tmin reached lower values (−3.1 °C) compared to SPG (0 °C). When this event occurred, the tested linseed varieties at ALB had already started flowering, excluding Sideral, which was between 55–57 BBCH phenological stages. At SPG, the earlier-flowering variety (Galaad) started flowering three days later (11th April), and the other varieties began flowering between the 15th and 25th April. This suggests that linseed is particularly sensible to frost events (with Tmin < 0 °C) at the beginning of full flowering, with consequent significant and negative effects on important yield components such as the number of capsules and their abortion rate, determining, in turn, a strong reduction in seed yield. Despite the high rusticity and adaptability of linseed to various environments, these findings disclose the important influence of seasonal variation on the different responses of linseed to cultivation site and sowing date due to temperature patterns and to amount and distribution of rainfall. A great variability of seed yield was in fact observed between the two locations as well as between the two sowing dates. The highest seed yield reached at SPG, both in spring and autumn sowing (1.7 and 2.4 Mg ha−1, for spring and autumn-crop, respectively), could be ascribed to milder temperatures which may have alleviated the occurrence of abiotic stress during the critical reproductive phase. These observations confirmed previous reports [41,47], which found low rainfall and high temperatures during the seed-filling period negatively influence seed yield, accelerating maturity, reducing seed size (TSW) and oil content [48]. In addition, in the second year (with autumn sowing) the prolonged vegetative development registered at SPG could have increased the remobilization of photosynthates during the seed-filling stage as confirmed by the highest TSW. Interestingly, linseed’s response to organic farming was very satisfactory, reaching yields consistent to those obtained adopting conventional and/or integrated farming techniques, in similar [33,41,49,50] and different environments across Europe [35,51,52,53]. Among varieties, Kaolin was the most productive with a seed yield of 1.9 Mg ha−1, averaging the yield across environments and sowing dates as confirmed by AMMI ang GGE biplot analyses. Also crop residues were significantly affected by the variability factors considered here, following a similar trend observed for seed yield, with the highest value achieved at SPG in autumn sowing. As observed by Tavarini et al. [49], the C/N ratio of linseed above-ground residues varied from 60 to 100, with a potential nitrogen return to the soil ranging from 20 to 47 kg ha−1 per year, depending on growing season, environment, and genotype. All these characteristics are important since the incorporation of crop residues in the soil with tillage, can promote the soil organic matter storage for the subsequent crops in the rotation, although via slow mineralization due the C/N value. Furthermore, location, sowing date and genotype played a key role also in defining harvest index (HI). The observed HI values were consistent with those reported in the literature ranging from 30–34% [49,54]. Our findings point out that HI generally increased with delayed sowing (37.4 vs. 29.8%, in spring and autumn, respectively), despite the lowest seed yield reached in spring-sown crops. This was probably due to the differences in seed and biomass production between the two sowing dates: linseed varieties sown in autumn accumulated larger biomass, thanks to a longer season, but probably translocated less photosynthates to the seeds. Seed oil content and composition represent very important traits in order to evaluate the possibility of the successful introduction of this crop in traditional farming rotations. In addition, the increasing demand of organic vegetable oils and proteins represents a further strength of linseed. In linseed, as in other oilseed crops, climatic conditions and genotypic characteristics are the main factors that influence the oil content and FA profile. Generally, high temperatures during flowering and seed ripening determine a reduction in oil accumulation within the seeds, as evidenced by lower content at ALB in comparison to SPG. An opposite trend was instead observed for the protein content and a negative correlation was found between these two parameters: the higher the oil content, the lower the protein amount [55,56]. Similarly to that observed for oil content, stressor conditions affected the activity of the enzymes responsible for the metabolism of the polyunsaturated fatty acids (PUFAs), decreasing their content with high temperatures and low water availability, with a concomitant increase in MUFA biosynthesis, which is coherent with the observations of Fofana et al. [57]. According to this phenomenon, the oil obtained from SPG cultivation was characterized by higher levels of PUFAs and lower levels of MUFAs. On the contrary, the behavior observed for the two sowing dates was not very clear, with the higher PUFA values and lower MUFAs values recorded in crops sown in spring. Depending on the cultivation site, our results showed an oil content between 47.2% (SPG) and 45.2% (ALB), and PUFAs between 72% (SPG) and 70% (ALB), close to or higher than those previously reported in Mediterranean areas [33,49]. It is known that the FA profile is strongly related to genetic characteristics [58]; in the present study a great variability among the tested varieties was observed, confirming this statement. Alfa-linolenic acid was the most abundant FA in all the varieties, but Libra exhibited the highest level (around 61%). At the same time, this variety had the lowest oleic acid content and, consequently, the lowest MUFAs and major levels of PUFAs. Thanks to the high level of alfa-linolenic acid and PUFAs, linseed oil is characterized by a very high nutritional quality, being an important source of omega 3 fatty acids, with a balanced omega 6/omega 3 ratio. Besides the possibility to use linseed oil as functional food for humans, its chemical composition makes this oil suitable for obtaining a wide range of biobased products.

5. Conclusions

Although a remarkable variability was observed depending on genotype, sowing date and location, linseed showed good agronomic traits that make it suitable to be introduced in the tested environment, contributing to the local production of organic vegetable oils and proteins. In general, autumn sowing coupled with milder and wetter conditions, such as those observed at SPG, seemed to be more favorable for linseed cultivation. Early sowing, in fact, can allow to the crop to escape the drought stress at flowering stage, to which this species is very sensitive. The possibility to organically cultivate linseed as an autumn crop in Mediterranean areas is particularly important due to the limited number of autumn/winter crop options for organic farmers. Crop diversification is one of the pillars of organic agriculture, particularly effective in reducing weed and disease pressure and promoting yields and their stability. From AMMI and GGE multivariate analyses, Kaolin seemed to have the highest production stability, among the tested varieties, while Libra, despite a good oil content and quality, seemed to have poor adaptation to the test areas. Aside from different development length, both “sowing date” and “location” are meteoclimatic-related factors, and the presence of interaction among these with the factor “genotype” reinforces the need for a site-specific approach for choosing the most suitable variety for each pedoclimatic context.

Author Contributions

Conceptualization, L.G.A. and S.T.; Methodology, L.G.A. and S.T.; Formal analysis, A.R., C.C. and S.T.; Investigation, L.G.A. and S.T.; Resources, L.G.A. Data curation, S.T., C.C. and A.R.; Writing—original draft preparation, A.R., S.T. and L.G.A.; Writing—review and editing, A.R., C.C., S.T. and L.G.A.; Visualization A.R. and S.T.; Supervision, L.G.A.; Project administration, L.G.A.; Funding acquisition, L.G.A. and S.T. All authors have read and agreed to the published version of the manuscript.

Funding

This research was funded by the project PIF-SOLEAT—submeasure 16.2 “SIC_OLEAT—Sistemi di Innovazione Colturale per le Oleaginose Toscane” funded by PSR 2014–2020 Regione Toscana.

Data Availability Statement

The data presented in this study are available on request from the corresponding author.

Acknowledgments

The authors wish to express their gratitude to Lara Foschi for her technical assistance.

Conflicts of Interest

The authors declare no conflict of interest. The funders had no role in the design of the study; in the collection, analyses, or interpretation of data; in the writing of the manuscript, or in the decision to publish the results.

References

  1. Yang, T.; Siddique, K.H.M.; Liu, K. Cropping systems in agriculture and their impact on soil health—A review. Global Ecol. Conserv. 2020, 23, e01118. [Google Scholar] [CrossRef]
  2. Sanz-Cobena, A.; Lassaletta, L.; Aguilera, E.; del Prado, A.; Garnier, J.; Billen, G.; Iglesias, A.; Sánchez, B.; Guardia, G.; Abalos, D.; et al. Strategies for greenhouse gas emissions mitigation in Mediterranean agriculture: A review. Agric. Ecosyst. Environ. 2017, 238, 5–24. [Google Scholar] [CrossRef] [Green Version]
  3. Kehoe, L.; Romero-Muñoz, A.; Polaina, E.; Estes, L.; Kreft, H.; Kuemmerle, T. Biodiversity at risk under future cropland expansion and intensification. Nat. Ecol. Evol. 2017, 1, 1129–1135. [Google Scholar] [CrossRef] [PubMed]
  4. Mazzocchi, C.; Orsi, L.; Ferrazzi, G.; Corsi, S. The dimension of agricultural diversification: A spatial analysis of Italian municipalities. Rural Sociol. 2020, 85, 316–345. [Google Scholar] [CrossRef]
  5. Messéan, A.; Viguier, L.; Paresys, L.; Aubertot, J.-N.; Canali, S.; Iannetta, P.; Justes, E.; Karley, A.; Keillor, B.; Kemper, L.; et al. Enabling crop diversification to support transitions towards more sustainable European agrifood systems. Front. Agric. Sci. Eng. 2021, 8, 474–480. [Google Scholar] [CrossRef]
  6. Vanino, S.; Di Bene, C.; Piccini, C.; Fila, G.; Pennelli, B.; Zornoza, R.; Sanchez-Navarro, V.; Álvaro-Fuentes, J.; Hüppi, R.; Six, J.; et al. A comprehensive assessment of diversified cropping systems on agro-environmental sustainability in three Mediterranean long-term field experiments. Eur. J. Agron. 2022, 140, 126598. [Google Scholar] [CrossRef]
  7. Chehade, L.A.; Angelini, L.G.; Tavarini, S. Genotype and seasonal variation affect yield and oil quality of safflower (Carthamus tinctorius L.) under Mediterranean conditions. Agronomy 2022, 12, 122. [Google Scholar] [CrossRef]
  8. Hussain, M.I.; Lyra, D.-A.; Farooq, M.; Nikoloudakis, N.; Khalid, N. Salt and drought stresses in safflower: A review. Agron. Sustain. Dev. 2016, 36, 1–31. [Google Scholar] [CrossRef] [Green Version]
  9. Von Cossel, M.; Lewandowski, I.; Elbersen, B.; Staritsky, I.; Van Eupen, M.; Iqbal, Y.; Mantel, S.; Scordia, D.; Testa, G.; Cosentino, S.L.; et al. Marginal agricultural land low-input systems for biomass production. Energies 2019, 12, 3123. [Google Scholar] [CrossRef] [Green Version]
  10. Karg, S. New research on the cultural history of the useful plant Linum usitatissimum L. (Flax), a resource for food and textiles for 8000 Years. Veg. Hist. Archaeobot. 2012, 21, 79. [Google Scholar] [CrossRef]
  11. Angelini, L.G.; Tavarini, S.; Antichi, D.; Foschi, L.; Mazzoncini, M. On-farm evaluation of seed yield and oil quality of linseed (Linum usitatissimum L.) in inland areas of Tuscany, central Italy. Ital. J. Agron. 2016, 11, 199–202. [Google Scholar] [CrossRef] [Green Version]
  12. Campos, J.R.; Severino, P.; Ferreira, C.S.; Zielinska, A.; Santini, A.; Souto, S.B.; Souto, E.B. Linseed essential oil—Source of lipids as active ingredients for pharmaceuticals and nutraceuticals. Curr. Med. Chem. 2019, 26, 4537–4558. [Google Scholar] [CrossRef] [PubMed] [Green Version]
  13. Mazzon, E.; Guigues, P.; Habas, J. Biobased structural epoxy foams derived from plant-oil: Formulation, manufacturing and characterization. Ind. Crops Prod. 2020, 144, 111994. [Google Scholar] [CrossRef]
  14. Baroncini, E.A.; Yadav, S.K.; Palmese, G.R.; Stanzione, J.F. Recent advances in bio-based epoxy resins and bio-based epoxy agents. J. Appl. Polym. Sci. 2016, 133. [Google Scholar] [CrossRef] [Green Version]
  15. Xie, Y.; Yan, Z.; Niu, Z.; Coulter, J.A.; Niu, J.; Zhang, J.; Wang, B.; Yan, B.; Zhao, W.; Wang, L. Yield, Oil content, and fatty acid profile of flax (Linum usitatissimum L.) as affected by phosphorus rate and seeding rate. Ind. Crops Prod. 2020, 145, 112087. [Google Scholar] [CrossRef]
  16. Kajla, P.; Sharma, A.; Sood, D.R. Flaxseed—A potential functional food source. J. Food Sci. Technol. 2015, 52, 1857–1871. [Google Scholar] [CrossRef] [Green Version]
  17. Vlaicu, P.A.; Panaite, T.D.; Turcu, R.P. Enriching laying hens eggs by feeding diets with different fatty acid composition and antioxidants. Sci. Rep. 2021, 11, 20707. [Google Scholar] [CrossRef]
  18. Vargas-Bello-Pérez, E.; Darabighane, B.; Miccoli, F.E.; Gómez-Cortés, P.; Gonzalez-Ronquillo, M.; Mele, M. Effect of dietary vegetable sources rich in unsaturated fatty acids on milk production, composition, and cheese fatty acid profile in sheep: A meta-analysis. Front. Vet. Sci. 2021, 8, 641364. [Google Scholar] [CrossRef]
  19. Migliore, G.; Rizzo, G.; Bonanno, A.; Dudinskaya, E.C.; Tóth, J.; Schifani, G. Functional food characteristics in organic food products—the perspectives of Italian consumers on organic eggs enriched with Omega-3 polyunsaturated fatty acids. Org. Agric. 2022, 12, 149–161. [Google Scholar] [CrossRef]
  20. FAOSTAT. Available online: https://www.fao.org/faostat/en/#data/QCL (accessed on 30 September 2022).
  21. Anastasiu, A.E.; Chira, N.A.; Banu, I.; Ionescu, N.; Stan, R.; Rosca, S.I. Oil productivity of seven Romanian linseed varieties as affected by weather conditions. Ind. Crops Prod. 2016, 86, 219–230. [Google Scholar] [CrossRef]
  22. Green, A.G. Effect of temperature during seed maturation on the oil composition of low-linolenic genotypes of flax. Crop Sci. 1986, 26, 961–965. [Google Scholar] [CrossRef]
  23. Cross, R.H.; McKay, S.A.B.; McHughen, A.G.; Bonham-Smith, P.C. Heat-stress effects on reproduction and seed set in Linum usitatissimum L. (Flax). Plant Cell Environ. 2003, 26, 1013–1020. [Google Scholar] [CrossRef]
  24. Bremner, J.M.; Mulvaney, C.S. Nitrogen-total. In Methods of Soil Analysis, Part 2: Chemical and Microbiological Properties; Page, A.L., Miller, R.H., Keeney, D., Eds.; American Society of Agronomy, Inc.; Soil Science Society of America, Inc.: Madison, WI, USA, 1982; pp. 595–624. [Google Scholar]
  25. Nelson, D.W.; Sommers, L.E. Total carbon. In Methods of Soil Analysis: Part 2 Chemical and Microbiological Properties, 2nd ed.; Page, A.L., Miller, R.H., Keeney, D.R., Eds.; American Society of Agronomy Inc.; Soil Science Society of America, Inc.: Madison, WI, USA, 1982; pp. 539–579. [Google Scholar]
  26. Gardin, L.; Chiesi, M.; Fibbi, L.; Maselli, F. Mapping soil organic carbon in Tuscany through the statistical combination of ground observations with ancillary and remote sensing data. Geoderma 2021, 404, 115386. [Google Scholar] [CrossRef]
  27. Vicente-Serrano, S.M.; Beguería, S.; López-Moreno, J.I. A multiscalar drought index sensitive to global warming: The Standardized Precipitation Evapotranspiration Index. J. Clim. 2010, 23, 1696–1718. [Google Scholar] [CrossRef] [Green Version]
  28. Peña-Gallardo, M.; Martín Vicente-Serrano, S.; Domínguez-Castro, F.; Beguería, S. The impact of drought on the productivity of two rainfed crops in Spain. Nat. Hazards Earth Syst. Sci. 2019, 19, 1215–1234. [Google Scholar] [CrossRef] [Green Version]
  29. Vergni, L.; Vinci, A.; Todisco, F. Effectiveness of the new standardized deficit distance index and other meteorological indices in the assessment of agricultural drought impacts in Central Italy. J. Hydrol. 2021, 603, 126986. [Google Scholar] [CrossRef]
  30. Allen, R.G.; Pereira, L.S.; Raes, D.; Smith, M. Crop Evapotranspiration—Guidelines for Computing Crop Water Requirements; United Nations Food and Agriculture Organization, Irrigation and Drain: Rome, Italy, 1998. [Google Scholar]
  31. Smith, J.M.; Froment, M.A. A growth stage key for winter linseed (Linum usitatissimum). Ann. Appl. Biol. 1998, 133, 297–306. [Google Scholar] [CrossRef]
  32. International Rules for Seed Testing; ISTA: Wallisellen, Switzerland, 2004; ISBN 3-906549-38-0.
  33. Tavarini, S.; Castagna, A.; Conte, G.; Foschi, L.; Sanmartin, C.; Incrocci, L.; Ranieri, A.; Serra, A.; Angelini, L.G. Evaluation of Chemical Composition of Two Linseed Varieties as Sources of Health-Beneficial Substances. Molecules 2019, 24, 3729. [Google Scholar] [CrossRef] [Green Version]
  34. Yan, W.; Kang, M.S.; Ma, B.; Woods, S.; Cornelius, P.L. GGE biplot vs. AMMI analysis of genotype-by-environment data. Crop Sci. 2007, 47, 643–653. [Google Scholar] [CrossRef] [Green Version]
  35. Čeh, B.; Štraus, S.; Hladnik, A.; Kušar, A. Impact of linseed variety, location and production year on seed yield, oil content and its composition. Agronomy 2020, 10, 1770. [Google Scholar] [CrossRef]
  36. Kurtenbach, M.E.; Johnson, E.N.; Gulden, R.H.; Duguid, S.; Dyck, M.F.; Willenborg, C.J. Integrating cultural practices with herbicides augments weed management in flax. Agron. J. 2019, 111, 1904–1912. [Google Scholar] [CrossRef]
  37. Dey, P.; Mahapatra, B.S.; Pramanick, B.; Pyne, S.; Pandit, P. Optimization of seed rate and nutrient management levels can reduce lodging damage and improve yield, quality and energetics of subtropical flax. Biomass Bioenergy 2022, 157, 106355. [Google Scholar] [CrossRef]
  38. Gajardo, H.A.; Quian, R.; Soto-Cerda, B. Agronomic and quality assessment of linseed advanced breeding lines varying in seed mucilage content and their use for food and feed. Crop Sci. 2017, 57, 2979–2990. [Google Scholar] [CrossRef]
  39. Hassan, F.U.; Leitch, M.H. Influence of seeding density on contents and uptake of N, P and K in linseed (Linum usitatissimum L.). J. Agron. Crop Sci. 2000, 185, 193–199. [Google Scholar] [CrossRef]
  40. Benaragama, D.I.; Johnson, E.N.; Gulden, R.H.; Willenborg, C.J. Integrated agronomy for high yield and stable flax production in Canada. Agron. J. 2022, 114, 2230–2242. [Google Scholar] [CrossRef]
  41. Casa, R.; Russell, G.; Lo Cascio, B.; Rossini, F. Environmental effects on linseed (Linum usitatissimum L.) yield and growth of flax at different stand densities. Eur. J. Agron. 1999, 11, 267–278. [Google Scholar] [CrossRef]
  42. Kalinina, E.Y.; Lyakh, V.A. Combining ability according to the traits of stem branching and plant height in linseed lines. Cytol. Genet. 2011, 45, 293–297. [Google Scholar] [CrossRef]
  43. Korres, N.E.; Froud-Williams, R.J. Effects of winter wheat cultivars and seed rate on the biological characteristics of naturally occurring weed flora. Weed Res. 2002, 42, 417–428. [Google Scholar] [CrossRef]
  44. Sulas, L.; Re, G.A.; Sanna, F.; Bullitta, S.; Piluzza, G. Fatty acid composition and antioxidant capacity in linseed grown as forage in Mediterranean environment. Ital. J. Agron. 2019, 14, 50–58. [Google Scholar] [CrossRef] [Green Version]
  45. Ercoli, L.; Arduini, I.; Mariotti, M.; Masoni, A. Post-anthesis dry matter and nitrogen dynamics in durum wheat as affected by nitrogen and temperature during grain filling. Cereal Res. Commun. 2010, 38, 294–303. [Google Scholar] [CrossRef]
  46. Hocking, P.J.; Pinkerton, A. Response of growth and yield components of linseed to the onset or relief of nitrogen stress at several stages of crop development. Field Crops Res. 1991, 27, 83–102. [Google Scholar] [CrossRef]
  47. Dordas, C.A. Variation of physiological determinants of yield in linseed in response to nitrogen fertilization. Ind. Crops Prod. 2010, 31, 455–465. [Google Scholar] [CrossRef]
  48. Luhs, W.; Friedt, W. Major oil crops. In Designer Oil Crops: Breeding, Processing and Biotechnology; Murphy, D.J., Ed.; VCH Press: Weinheim, Germany, 1994; pp. 5–71. [Google Scholar]
  49. Tavarini, S.; Angelini, L.G.; Casadei, N.; Spugnoli, P.; Lazzeri, L. Agronomical evaluation and chemical characterization of Linum usitatissimum L. as oilseed crop for bio-based products in two environments of Central and Nothern Italy. Ital. J. Agron. 2016, 11, 122–132. [Google Scholar] [CrossRef] [Green Version]
  50. D’Antuono, L.F.; Rossini, F. Yield potential and ecophysiological traits of the Altamurano linseed (Linum usitatissimum L.), a landrace of southern Italy. Genet. Resour. Crop Evol. 2006, 53, 65–75. [Google Scholar] [CrossRef]
  51. Diepenbrock, W.A.; Leon, J.; Clasen, K. Yielding ability and yield stability of linseed in Central Europe. Agron. J. 1995, 87, 84–88. [Google Scholar] [CrossRef]
  52. Dordas, C.A. Nitrogen nutrition index and its relationship to N use efficiency in linseed. Eur. J. Agron. 2011, 34, 124–132. [Google Scholar] [CrossRef]
  53. Klein, J.; Zikeli, S.; Claupen, W.; Gruber, S. Linseed (Linum usitatissimum) as an oil crop in organic farming: Abiotic impacts on seed ingredients and yield. Org. Agric. 2017, 7, 1–19. [Google Scholar] [CrossRef]
  54. Berti, M.; Fischer, S.; Wilckens, R.; Hevia, F.; Johnson, B. Adaptation and genotype × environment interaction of flaxseed (Linum usitatissimum L.) genotypes in South Central Chile. Chil. J. Agric. Res. 2010, 70, 345–356. [Google Scholar]
  55. Bhatty, R.S.; Cherdkiatgumchai, P. Compositional analysis of laboratory- prepared and commercial samples of linseed meal and of hull isolated from flax. J. Am. Oil Chem. Soc. 1990, 67, 79–84. [Google Scholar] [CrossRef]
  56. Saastamoinen, M.; Pihlava, J.M.; Eurola, M.; Klemola, A.; Jauhiainen, L.; Hietaniemi, V. Yield, SDG lignan, cadmium, lead, oil and protein contents of linseed (Linum usitatissimum L.) cultivated in trials and at different farm conditions in the southwestern part of Finland. Agric. Food Sci. 2013, 22, 296–306. [Google Scholar] [CrossRef] [Green Version]
  57. Fofana, B.; Cloutier, S.; Duguid, S.; Ching, J.; Rampitsch, C.G. Gene expression of stearoyl-ACP desaturase and Δ12 fatty acid desaturase 2 is modulated during seed development of flax (Linum usitatissimum). Lipids 2006, 41, 705–712. [Google Scholar] [CrossRef] [PubMed]
  58. Ataii, E.; Mirlohi, A.; Sabzalian, M.R.; Goli, S.A.H.; Sadri, N.; Sharif-Moghaddam, N.; Gheysari, M. Genetic variability of seed yield and oil nutritional attributes in linseed dominated by biennial variation. Crop Pasture Sci. 2021, 72, 443–457. [Google Scholar] [CrossRef]
Figure 1. Monthly rainfall and mean, minimum, and maximum temperatures for the entire trial period at Alberese (ALB), Grosseto.
Agronomy 13 00045 g001
Figure 2. Monthly rainfall and mean, minimum, and maximum temperatures for the entire trial period at San Piero a Grado (SPG), Pisa.
Agronomy 13 00045 g002
Figure 3. Long-term standardized precipitation-evapotranspiration index (SPEI) calculated at SPG on 3- and 6-month basis. For each year, blue and red bars represent, respectively, monthly positive and negative SPEI values.
Agronomy 13 00045 g003
Figure 4. Long term standardized precipitation-evapotranspiration index (SPEI) calculated at ALB on 3- and 6-month basis. For each year, blue and red bars represent, respectively, monthly positive and negative SPEI values.
Agronomy 13 00045 g004
Figure 5. AMMI1 (a) and AMMI2 biplot (b) analysis for genotype by environment (G × E) interaction in multilocation variety trials for the seed yield trait and ‘which-won-where polygon view’ of the genotypes and environments.
Agronomy 13 00045 g005
Figure 6. Comprehensive examination of genotypes and environments. GGE Biplot visualization (a); ranking genotypes (b) within environments and representativeness of test environments; (c) comparison of genotype with the ‘ideal’ genotype for both mean and yield stability; (d) comparison of environments based on both discriminating ability and representativeness of the target environment.
Agronomy 13 00045 g006
Table 1. Physical and chemical characteristics of the soil at the experimental sites (0–0.3 m).
SPG—SpringSPG–AutumnALB—SpringALB–Autumn
Sand (%)55.450.982.548.1
Silt (%)32.238.02.435.3
Clay (%)12.411.115.216.6
pH8.08.28.07.9
Total Nitrogen (‰)1.11.21.00.8
Organic matter (%)1.92.91.71.1
Available phosphorus (mg kg−1) 8.95.89.328.4
Electrical conductivity (meq 100−1g)6.510.039.313.7
Table 2. Duration, growing degree days (GDD), cumulative rainfall (mm) and ET0 (mm) evaluated during vegetative (V—from sowing to beginning of flowering) and reproductive (R—from beginning of flowering to maturity) cycles of five linseed varieties in spring (2020) and autumn (2021) sowings.
SPGALB
Duration (Days)GDD (°C d)Rainfall (mm)ET0 (mm)Duration (Days)GDD (°C d)Rainfall (mm)ET0 (mm)
VRVRVRVRVRVRVRVR
Spring sowing
Galaad4949549782989615720383524717749731211270
Libra57406596591029119316483524717749731211270
Sideral56426436881039118817287485157309731229252
Szafir56496438101039118820487485157309731229252
Kaolin56476438101039118819587485157309731229252
Mean ± SD55 ± 345 ± 4627 ± 44750 ± 71102 ± 292 ± 2183 ± 15188 ± 1885 ± 250 ± 2497 ± 24748 ± 2497 ± 031 ± 0222 ± 10259 ± 10
Autumn sowing
Galaad152617276406971011961921418171394332460202352
Libra15668755788728702052281447973292432460209345
Sideral16654821668729692351841685589476235430285269
Szafir16256789664729692221881477675390332460218336
Kaolin15861768694729692102001447973292432460209345
Mean ± SD159 ± 560 ± 5772 ± 35691 ± 58722 ± 1476 ± 14214 ± 15198 ± 18149 ± 1174 ± 11765 ± 74891 ± 74330 ± 1354 ± 13225 ± 34329 ± 34
Table 3. Main effects of location (L), sowing date (SD) and genotype (G) and their interaction on linseed plant height, plant density, number of stems per plant, number of capsules per stem, sterile capsule percentage, and number of seeds per capsule. Data refer to mean values ± standard deviation.
Plant Height (cm)Plant Density (n. m−2)Stems
(n. plant−1)
Capsule
(n. stem−1)
Sterile
Capsules (%)
Seeds
(n. capsule−1)
SPG59.2 ± 7.9 a341.3 ± 118.9 b1.3 ± 0.2 a18.4 ± 9.5 a9.7 ± 6.6 b4.0 ± 0.7 b
ALB58.7 ± 10.3 a432.0 ± 164.9 a1.1 ± 0.1 b9.3 ± 2.5 b14.5 ± 5.9 a4.4 ± 1.5 a
Spring52.6 ± 6.5 b369.6 ± 100.6 b1.3 ± 0.2 a10.0 ± 3.1 b12.4 ± 5.2 a3.6 ± 0.9 b
Autumn65.4 ± 6.4 a403.7 ± 186.6 a1.1 ± 0.1 b17.6 ± 10.0 a11.8 ± 8.0 a4.8 ± 1.1 a
Galaad54.3 ± 6.0 b324.8 ± 79.4 c1.2 ± 0.2 b12.8 ± 7.5 b10.2 ± 5.1 b4.4 ± 0.8 a
Libra62.5 ± 8.5 a276.0 ± 98.0 c1.1 ± 0.1 bc16.7 ± 11.4 a10.8 ± 7.3 b4.5 ± 1.5 a
Sideral54.8 ± 9.7 b542.5 ± 162.5 a1.3 ± 0.3 a10.1 ± 6.0 b12.6 ± 6.6 ab3.8 ± 1.2 b
Szafir63.6 ± 10.1 a326.0 ± 98.8 c1.2 ± 0.1 bc16.7 ± 8.6 a15.2 ± 7.3 a4.1 ± 1.2 ab
Kaolin59.8 ± 7.3 a463.9 ± 114.2 b1.1 ± 0.1 c12.9 ± 5.6 b11.7 ± 6.6 ab4.2 ± 1.1 ab
Ln.s.*************
SD**********n.s.***
G*****************
L × SD******************
L × Gn.s.n.s.******n.s.***
SD × G*******n.s.*n.s.
L × SD × G*******n.s.n.s.n.s.
Means followed by the same letter are not significantly different at p ≤ 0.05 based on Tukey’s HSD test. *** significant at p ≤ 0.001 level; ** significant at p ≤ 0.01; * significant at p ≤ 0.05 level; n.s., not significant.
Table 4. Main effects of location (L), sowing date (SD) and genotype (G) and their interaction on linseed seed yield, vegetative biomass, harvest index (HI), thousand seed weight (TSW), oil and protein concentrations. Data refer to mean values ± standard deviation.
Seed Yield
(Mg ha−1)
Crop Residues
(Mg ha−1)
HI
(%)
TSW
(g)
Oil Content
(g/100 g)
Crude Protein Content
(g/100 g)
SPG2.1 ± 0.6 a4.0 ± 1.4 a34.6 ± 5.0 a7.3 ± 1.0 a47.2 ± 1.0 a21.2 ± 1.0 b
ALB1.3 ± 0.7 b3.1 ± 2.2 b32.6 ± 6.7 b6.0 ± 0.8 b45.2 ± 1.4 b22.6 ± 1.5 a
Spring1.2 ± 0.6 b2.1 ± 1.2 b37.4 ± 4.2 a6.6 ± 0.7 b46.5 ± 1.7 a22.6 ± 1.4 a
Autumn2.1 ± 0.5 a5.0 ± 1.1 a29.8 ± 4.9 b7.5 ± 0.9 a46.6 ± 2.6 a21.3 ± 1.3 a
Galaad1.7 ± 0.8 a3.1 ± 1.6 b36.6 ± 7.2 a8.0 ± 0.7 a46.1 ± 1.2 b22.0 ± 1.2 abc
Libra1.3 ± 0.6 b3.2 ± 1.8 ab31.5 ± 4.6 b6.5 ± 0.6 d49.0 ± 0.9. a21.6 ± 1.1 bc
Sideral1.6 ± 0.8 ab4.0 ± 2.3 a30.4 ± 4.9 b6.0 ± 0.4 e43.6 ± 1.2 c23.3 ± 1.1 a
Szafir1.7 ± 0.7 a3.5 ± 1.7 ab34.5 ± 5.4 a7.5 ± 0.6 b46.3 ± 1.0 b22.1 ± 1.1 ab
Kaolin1.9 ± 0.7 a3.9 ± 2.0 a35.1 ± 5.6 a7.4 ± 0.6 c47.9 ± 1.2 a20.6 ± 1.2 c
L******************
SD************n.s.n.s.
G*****************
L × SD***************n.s.
L × G**n.s.******n.s.n.s.
SD × Gn.s.n.s.n.s.*n.s.n.s.
L × DS × Gn.s.n.s.***n.s.n.s.
Means followed by the same letter are not significantly different at p ≤ 0.05 based on Tukey’s HSD test. *** significant at p ≤ 0.001 level; ** significant at p ≤ 0.01; * significant at p ≤ 0.05 level; n.s., not significant.
Table 5. Interaction effects of location (SPG and ALB) and sowing date (S: spring; A: autumn) on linseed plant height, plant density, number of stems per plant, number of capsules per stem, sterile capsule percentage and number of seeds per capsule. Data refer to mean values ± standard deviation.
LocationSowing DatePlant Height (cm)Plant Density (n. m−2)Stems
(n. plant−1)
Capsule (n. stem−1)Sterile
Capsules (%)
Seeds
(n. Capsule−1)
SPGSpring55.5 ± 7.7 c395.6 ± 100.6 b1.4 ± 0.3 a10.8 ± 3.7 b14.6 ± 5.4 b4.0 ± 0.8 b
Autumn62.9 ± 6.3 b286.9 ± 112.5 d1.1 ± 0.1 c26.0 ± 7.1 a4.7 ± 3.1 d4.1 ± 0.5 b
ALBSpring49.6 ± 3.2 d343.5 ± 96.0 c1.2 ± 0.1 b9.3 ± 2.4 b10.3 ± 4.1 c3.1 ± 0.7 c
Autumn67.9 ± 5.5 a520.5 ± 173.5 a1.0 ± 0.0 c9.3 ± 2.6 b18.8 ± 4.2 a5.6 ± 0.9 a
Means followed by the same letter are not significantly different at p ≤ 0.05 based on Tukey’s HSD test.
Table 6. Pearson’s correlation coefficients and their statistical significance among studied parameters among pairs of variables related to the expression of growth, yield, and qualitative traits in five linseed genotypes under two sowing dates and cultivated in two different locations.
Plant
Height
Plant
Density
Stems per PlantCapsules per PlantSterile CapsulesSeeds per CapsuleSeed YieldCrop
Residues
HITSWOil
Content
Protein
Content
Plant height10.07−0.580.370.250.690.550.77−0.710.340.18−0.50
ns**nsns**********nsns*
Plant density 10.04−0.570.590.210.100.33−0.430.35−0.630.16
ns****nsnsnsnsns**Ns
Stems per plant 1−0.33−0.03−0.28−0.17−0.340.39−0.41−0.200.18
nsnsnsnsnsnsnsnsns
Capsules per plant 1−0.64−0.060.530.37−0.010.530.49−0.46
**ns*nsns***
Sterile capsules 10.32−0.110.12−0.40−0.24−0.440.20
nsnsnsnsnsnsns
Seeds per capsule 10.470.61−0.520.290.05−0.49
****nsns*
Seed yield 10.86−0.280.620.13−0.76
***ns**ns***
Crop residues 1−0.720.38−0.05−0.58
***nsns**
HI 10.110.250.08
nsnsns
TSW 10.30−0.58
ns**
Oil content 1−0.67
**
Protein content 1
*** significant at p ≤ 0.001 level; ** significant at p ≤ 0.01; * significant at p ≤ 0.05 level; n.s., not significant
Table 7. Interaction effects of location (SPG and ALB) and sowing date (spring and autumn) on seed yield, vegetative biomass, harvest index (HI), thousand seed weight (TSW), oil and protein concentrations of linseed. Data refer to mean values ± standard deviation.
LocationSowing DateSeed Yield (Mg ha−1)Crop Residues (Mg ha−1)HI
(%)
TSW
(g)
Oil Content (g 100 g−1)Crude Protein
Content (g 100 g−1)
SPGSpring1.7 ± 0.4 b3.1 ± 0.7 b36.2 ± 4.5 b6.8 ± 0.8 c46.6 ± 1.7 b21.6 ± 0.9 a
Autumn2.4 ± 0.5 a5.0 ± 1.2 a32.9 ± 4.9 c7.9 ± 0.8 a47.8 ± 2.0 a20.8 ± 1.1 a
ALBSpring0.7 ± 0.3 c1.0 ± 0.3 c38.6 ± 3.5 a6.5 ± 0.6 d46.4 ± 1.9 b23.5 ± 1.1 a
Autumn1.9 ± 0.4 b5.1 ± 1.0 a26.7 ± 2.1 d7.2 ± 0.8 b45.4 ± 2.0 c21.8 ± 1.4 a
Means followed by the same letter are not significantly different at p ≤ 0.05 based on Tukey’s HSD test.
Table 8. Fatty acids composition (% of total FA) in linseed in response to location (L), sowing date (SD) and genotype (G). Data refer to mean values.
C16:0C16:1C17:0C18:1C18:2C18:3SFAMUFAPUFAPUFA/SFAn6/n3
LocationSPG6.35 b0.14 0.08418.46 b13.85 b58.37 a6.50 b18.60 b72.31 a11.21 0.24 b
ALB6.80 a0.130.08521.11 a16.80 a52.94 b6.95 a21.25 a69.74 b10.940.37 a
Sowing dateSpring6.16 b0.130.067 b20.14 a13.88 b57.94 a6.33 b20.27 a71.82 a11.39 a0.24 b
Autumn6.95 a0.130.099 a19.45 b16.73 a53.59 b7.08 a19.61 b70.31 b10.79 b0.36 a
GenotypeGalaad6.13 bc0.13 b0.076 b22.20 a17.75 a51.65 e6.24 c22.34 a69.40 c11.22 b0.40 a
Libra5.88 c0.09 c0.083 b17.05 d13.32 c61.17 a6.10 c17.15 d74.49 a12.31 a0.22 d
Sideral6.25 bc0.11 bc0.079 b20.46 b13.19 c57.53 b6.46 b20.58 b70.72 b11.01 b0.23 c
Szafir8.25 a0.21 a0.108 a18.76 c17.96 a52.42 d8.40 a18.99 c70.39 bc9.81 c0.40 a
Kaolin6.38 b0.11 bc0.076 b20.41 b14.64 b55.50 c6.43 b20.54 b70.15 bc11.02 b0.26 b
Variability factorsL**n.s.n.s.*****************n.s.***
SD***n.s.**********************
G*********************************
L × SD*********************************
L × G*********************************
SD × G*********************************
L × SD × G*********************************
Means followed by the same letter are not significantly different at p ≤ 0.05 based on Tukey’s HSD test. *** significant at p ≤ 0.001 level; ** significant at p ≤ 0.01; * significant at p ≤ 0.05 level; n.s., not significant.
Disclaimer/Publisher’s Note: The statements, opinions and data contained in all publications are solely those of the individual author(s) and contributor(s) and not of MDPI and/or the editor(s). MDPI and/or the editor(s) disclaim responsibility for any injury to people or property resulting from any ideas, methods, instructions or products referred to in the content.

