Article

Soil Strength and Structural Stability Are Mediated by Soil Organic Matter Composition in Agricultural Expansion Areas of the Brazilian Cerrado Biome

by
Jorge L. Locatelli
1,*,
Renato P. de Lima
1,
Rafael S. Santos
1,
Maurício R. Cherubin
1,
Rachel E. Creamer
2 and
Carlos E. P. Cerri
1
1
Department of Soil Science, Luiz de Queiroz College of Agriculture, University of São Paulo, Piracicaba 13418-900, Brazil
2
Soil Biology Group, Wageningen University, 6708 WG Wageningen, The Netherlands
*
Author to whom correspondence should be addressed.
Agronomy 2023, 13(1), 71; https://doi.org/10.3390/agronomy13010071
Submission received: 3 December 2022 / Revised: 21 December 2022 / Accepted: 22 December 2022 / Published: 25 December 2022

Abstract

:
A growing demand for resources has led to the expansion of agricultural areas worldwide. However, land conversion associated with poor soil management might lead to soil physical degradation. We investigated the effects of land conversion on soil physical properties in the Brazilian Cerrado region, under native Cerrado vegetation (NV)—pasture (PA) and NV—cropland (CL) conversion scenarios. Soil physical properties related to compaction, pore size distribution, and structure stability were assessed up to a 30 cm depth. Additionally, carbon levels of soil organic matter fractions (particulate and mineral-associated organic matter) were determined. Our results indicate that the compaction process equivalently reduced the soil porosity in PA and CL. However, soil penetration resistance was higher in PA (~2.5 MPa) than in CL (~1.5 MPa), as well as the stable mean weight diameter of soil aggregates. The highest total and labile organic carbon levels were observed in CL, while the lowest levels of total and labile organic carbon occurred in PA (smaller than in CL). These results suggest that the higher structural stability found in PA was mediated by the predominance of stabilized carbon (a decrease in the proportion of soil labile carbon), causing the gaining of soil strength under negligible soil volume variation (in comparison with CL). Our results suggest that the reduction in the soil porosity by compaction due to PA and CL uses can equivalently reduce macropore space and soil hydraulic functioning, and that soil carbon quality alterations (i.e., labile vs. stabilized fractions) are responsible for the gain in soil strength in long-term degraded PA areas. Future research should focus on understanding the magnitude in which soil organic matter controls soil physical attributes, such as soil strength in these expansion areas, and whether this gain in soil strength limits plant development and compromises productivity in the long term.

1. Introduction

Food production has greatly increased with the global population growth, leading to the intensification and expansion of agriculture in the world [1]. Despite having increased the global supply of resources (e.g., food, feed, fiber, and bioenergy), land conversion and intensification of agricultural areas have been widely reported as the main causes of soil impoverishment and biodiversity loss, undermining the capacity of the ecosystems to provide its services [2,3,4,5].
In Brazil, land-use change (LUC) and agricultural expansion have been recently observed in a region known as Matopiba, located in the Cerrado biome, the northeast region of the country. The Matopiba has ~73 million ha (more than Italy and Germany’s combined area), of which 22% is covered by pasturelands and annual crops [6]. The region contributes to ~10% of Brazil’s grain production (~240 million tons [7]) and comprises ~8% of the cattle herd of the country (~218 million [8]). Despite the large agricultural advancement in this region over the last few decades, less than 35% of the Matopiba area is classified as suitable to support intensive agriculture, which raises concerns about the risk of environmental degradation as agriculture progresses [9,10].
The high temperature and short rainy season in combination with the high sand content, low nutrient supply, and water retention of soils are the main limiting factors for crop production in the region [11,12]. The combination of soil’s natural fragility with intensive traffic machines in cropland (CL) areas, characterized by large-scale production, mechanized cultivation, and poor management of pastures (PA; e.g., overgrazing, low or no fertilization amendment) may increase soil degradation processes, jeopardizing soil functions and land productivity over time [11,12,13]. Soil compaction associated with the reduction in soil structural stability is among the major factors that lead to soil physical degradation in these areas [14,15,16]. In addition to limiting proper plant development, these changes may lead to other degradation processes, such as soil erosion, nutrient loss, soil organic matter (SOM) depletion, and soil strength gain [17,18,19,20].
Soil organic matter losses, for instance, may severely contribute to increased soil physical degradation, once the SOM has a close relationship with soil physical quality [20,21]. Several studies have shown that SOM has a special role in preventing soil compaction and soil penetration resistance increase [22,23]. Zhang et al. [24] found that SOM contributes to reducing the negative effects caused by machinery traffic on soil physical properties by increasing soil resilience. More specifically, Pesch et al. [25] and Startsev et al. [26] suggested that SOM distribution in different fractions (e.g., particulate and mineral-associated organic matter) may also affect soil penetration resistance and soil structural stability. Additionally, Dexter et al. [27] suggested that carbon (C) bonds are responsible for the gain of soil strength under negligible soil bulk density variation in a time-dependent process called the “age-hardening” phenomenon. At the field scale, this process was observed by Horn et al. [22], Moraes et al. [23,28], and Cavalcanti et al. [29].
Since most agricultural advancement in the Matopiba occurred during the last 20 years, comprehensive assessments of soil physical changes induced by LUC and soil management are still scarce. Based on that, we measured the extent to which the LUC from native vegetation (NV; Cerrado biome) to CL and extensive PA affects key soil physical indicators. Our hypothesis was that both PA and CL systems led to negative alterations in soil physical indicators in relation to NV, but the absence of soil disturbance and the increasing stability of C in the soil in PA can confer structural stability, which in turn, can increase soil strength, such as soil penetration resistance.

2. Materials and Methods

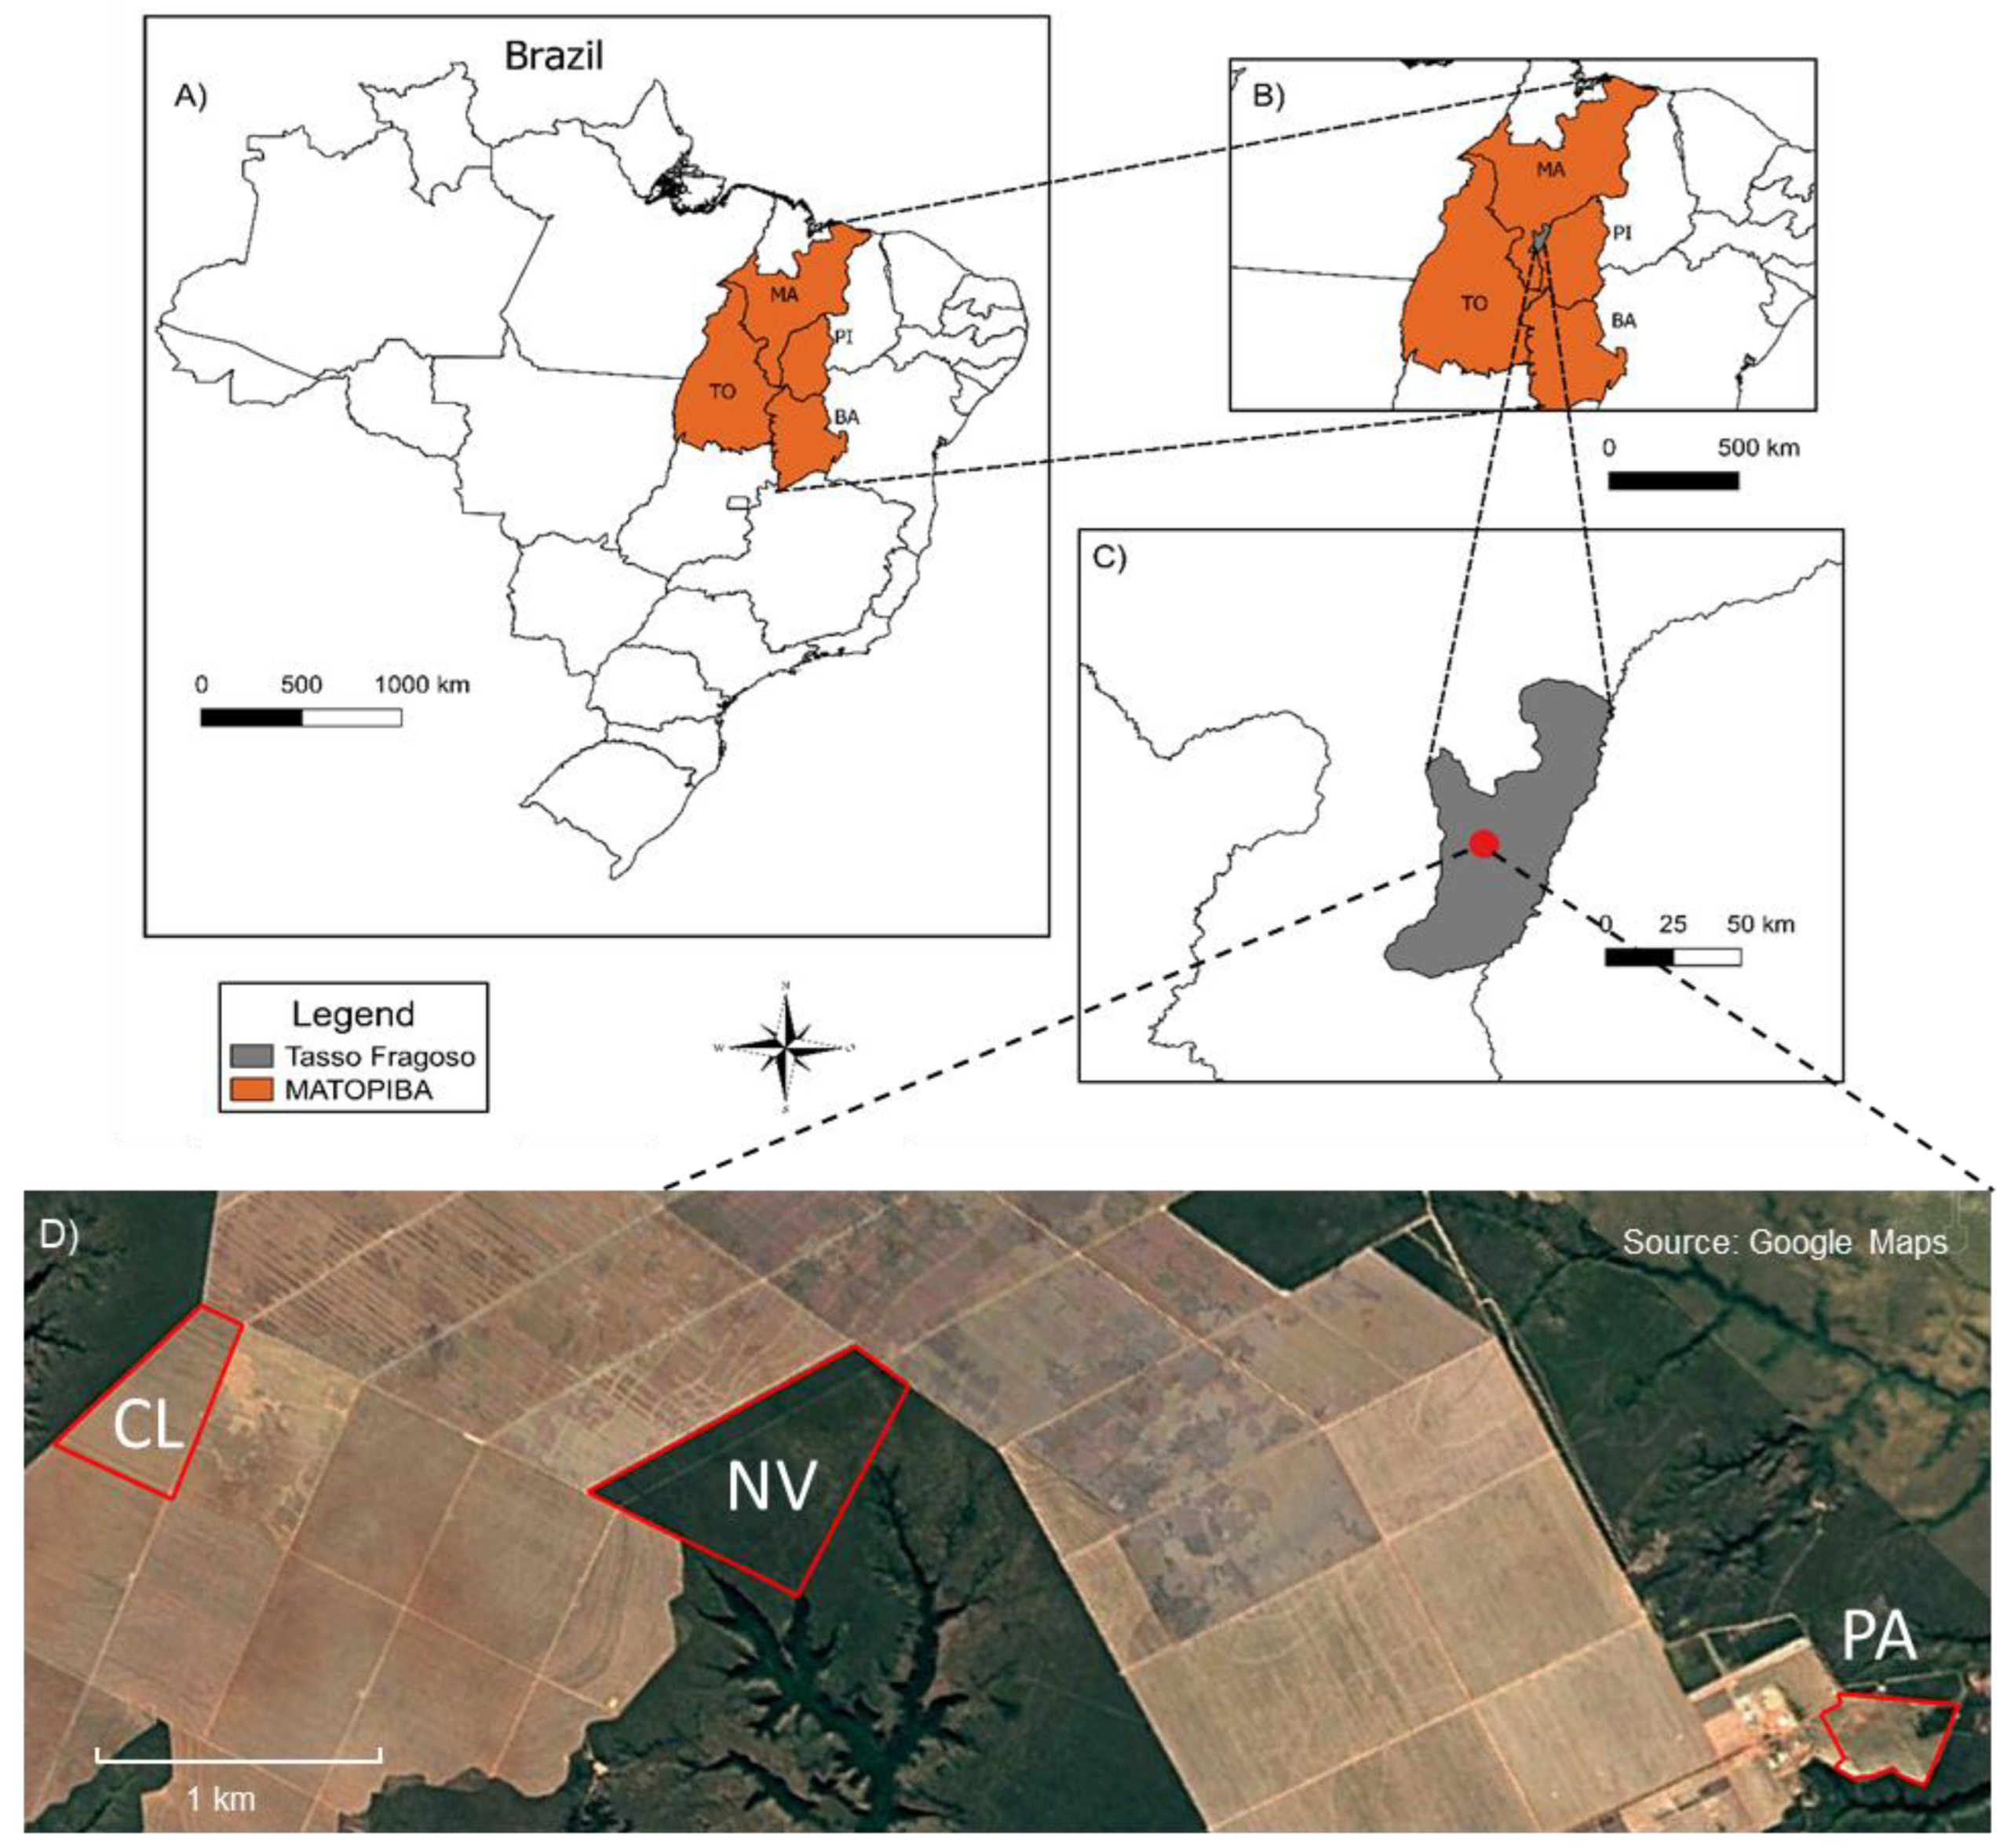
2.1. Study Site Characteristics

The study was performed in the county of Tasso Fragoso, the state of Maranhão (8°31′ S, 46°04′ W; an elevation of 560 m above sea level; Figure 1). The climate of the region is classified as tropical (Aw—Köppen’s classification; Alvares et al. [30], presenting a mean annual temperature and precipitation of 27.2 °C and 1300 mm, respectively). The soil in the study sites is classified as a Typic Haplustox according to US Taxonomy [31] and as Haplic Ferralsol according to the World Reference Base [32], with hematite, kaolinite, gibbsite, and goethite predominating in the clay fraction (Figure S1).
Three different land uses, i.e., CL, PA, and NV, were sampled in adjacent areas (Figure 1) using a chronosequence approach. The selected CL site was converted from NV in 2009 (10 years of cultivation) and was cultivated in a successional system of soybean (Glycine max L. Merr) + millet (Pennisetum glaucum L.) and used as a cover crop. The PA area was converted from NV in 2000 (19 years) and was implemented by local grass species (i.e., tropical grasses from the Urochloa genus). The PA area was intensively grazed by cattle and sheep and supports ~1 animal unit ha−1 (450 kg) in a full year. Both sites were managed in a no-tillage system.
The chronosequence approach was used because no long-term field experiments are available in the region. The study sites were carefully selected based on their use and management history and previous soil chemical and physical analysis. So, all soil assessment was performed under similar conditions, e.g., similar climate (adjacent areas; Figure 1), soil characteristics (Table 1; Figure S1), slope, and drainage (same elevation and position in the terrain). Additionally, the selected sites represent common LUC situations in the Matopiba region, i.e., conversion from NV to CL and from NV to PA [33]. Further details from the sampled areas are presented in Table 1 and Locatelli et al. [34].

2.2. Soil Sampling and Laboratory Analyses

Soil sampling was conducted in November 2019, at the beginning of the rainy season. Each area (NV, CL, and PA) was sampled using a regular grid with nine points distributed 50 m apart from each other [36]. The disturbed samples were obtained using a Dutch auger, at the depths of 0–5, 5–10, 10–20, and 20–30 cm, totaling 108 samples (3 land uses × 4 depths × 9 replicates). In addition, we selected the three diagonal points of the grid and we opened small trenches (40 × 40 × 40 cm), which were used to obtain undisturbed samples. The undisturbed samples were obtained in two ways: (i) by using Kopecky’s rings (5 × 5 cm, height × diameter) and (ii) soil blocks (10 × 5 × 10 cm). Undisturbed samples were taken at the same depths as the disturbed ones (i.e., 0–5, 5–10, 10–20, and 20–30 cm), totaling 36 samples (3 land uses × 4 depths × 3 replicates).
The disturbed samples were air-dried and sieved (<2 mm), and plant debris and roots were handpicked and removed. Soil particle-size fractions (sand, silt, and clay) were measured by the hydrometer method [37], and soil particle density was measured using a gas pycnometer [38]. Soil available phosphorus (P) (Mehlich-1), pHH2O (1:2.5 v v−1), and base saturation were determined and calculated following Teixeira et al. [39]. Additionally, subsamples were taken to perform a physical fractionation of SOM into mineral-associated organic matter (i.e., stabilized C) and particulate organic matter (i.e., labile C), following the procedure described by Cambardella et al. [40] and Locatelli et al. [34]. Both SOM fractions were weighed and ground (<0.149 mm) for C determination using an elemental analyzer (Leco CN-TruSpec®, St. Joseph, MI, USA) and then we determined the proportion of C present in each one of these fractions (i.e., stabilized and labile fractions). Further details about SOM fractionation can be found in Locatelli et al. [34].
Undisturbed soil rings were used to measure saturated hydraulic conductivity (Ks) by the constant-head method, which was calculated according to Equation (1) [41]:
Ks = (Q × L)/(A × H × t)
where Ks is in cm h−1, Q is the leachate volume, presented in cm3, L is the height of the soil block, presented in cm, A is the area of the cylinder, in cm2, H is the height of the water column, in cm, and t is the time, in h.
Subsequently, the soil rings were re-saturated, and using a tension table, were exposed to matric potentials of −6 and −10 kPa. Once the equilibrium was reached, the samples were weighed to determine water content at field capacity (θFC; −10 kPa), and then the soil penetration resistance at field capacity SPRFC was measured in a bench-top penetrometer (Brookfield CT3 Texture Analyzer).
Soil total porosity (TP) was assessed using particle density and BD values (Equation (2)). Microporosity (MiP), although not presented here, was used to determine macroporosity (MaP) values, and was assessed by the volumetric water content at the −6 kPa potential (Equation (3), i.e., pores < 50 µm according to Embrapa [39]. Macroporosity was assessed by subtracting the MiP from the TP (Equation (4)) and field capacity (θFC) was determined by the volumetric water content at the −10 kPa potential [42] (Equation (5)):
TP = (PD − BD)/P
MiP = θ(−6kPa)
MaP = TP − MiP
θFC = θ(−10kPa)
where TP, MaP, and MiP are in m3, m−3, BD, and PD (particle density) and are presented in Mg m−3, θ−6kPa is the volumetric water content at −6 kPa, and θ−10kPa is the volumetric water content at −10 kPa.
Lastly, soil cores were oven-dried at 105 °C until constant weight. Bulk density was assessed from the weight of the dried soil cores and the volume of the rings. Soil aggregate stability was obtained following the procedure described by Elliot [43] (the wet sieving method), where three sieves with openings of 53, 250, and 2000 µm were used. The proportion of stable aggregates from each fraction and the mean weight diameter of aggregates were calculated according to Equation (6):
MWD = i 1 n xi   wi
where MWD represents the mean weight diameter of soil aggregates, n represents the number of aggregate classes, xi is the mean diameter of each size class, and wi is the proportion of the total sample weight in the correspondent size fraction.
Data homogeneity and normality were checked by the O’Neill–Mathews and Shapiro–Wilk tests (p > 0.05), respectively, and an ANOVA (p < 0.05) was applied to test the significance between the treatments in each assessed depth. Tukey’s test (p < 0.05) was used to compare the means of the treatments when the ANOVA test was significant. Statistical tests were conducted using R software and figures were constructed using Origin software (Origin, Version 2019, OriginLab Corporation, Northampton, MA, USA).

3. Results and Discussion

The land conversion from NV to CL and PA-induced soil compaction is indicated by the increase in BD and SPRFC values (Figure 2a,b). Pasture and CL led to an average increase of ~23% in soil BD compared to NV (1.18 Mg m−3) within a 30 cm depth (Figure 2a). However, negligible differences were found between CL and PA uses for BD, where differences were limited to the 0–5 cm layer (1.50 Mg m−3 in PA vs. 1.31 Mg m−3 in CL). The most significant changes were found for SPRFC in PA, where values as high as 2.9 MPa were observed, and they were higher than in CL (p < 0.05; Figure 2b). An increase in soil compaction is the first indication of soil physical quality depletion, as it might affect water and nutrient uptake by plants [44]. In Brazil, extensive poorly-managed pasturelands are, in general, neglected in terms of soil fertilization and grazing management [45], and are frequently combined with soil compaction induced by animal trampling [15,46]. Similarly, the increase in soil compaction observed in CL is mostly caused by intense and non-controlled machinery traffic [47,48]. This is particularly increased when operations are performed under critical soil moisture, which favors soil compressibility and increases the risk of soil compaction [49].
The compaction process in CL and PA led to changes in pore size distribution (Figure 3a,b). On average (the 0–30 cm layer), TP decreased by ~17% in CL and PA compared to NV (0.56 m3 m−3; p < 0.001; Figure 3a). This is mainly related to the decrease in MaP, whose value was reduced by ~59% after LUC (PA and CL average; the 0–30 cm layer; Figure 3b). However, following the trends observed, soil BD, TP, and MaP values decreased equally in CL and PA (p > 0.05). The decrease in MaP led to values close to the critical limit (0.10 m3 m−3) for having proper air diffusion [50] in PA and CL, possibly affecting soil aeration [51]. In addition to reducing root growth [50], it might lead to anoxic conditions that can induce the occurrence of denitrification and methanogenesis processes [52], contributing to greenhouse gas emissions (e.g., N2O and CH4) in the atmosphere.
The compaction process induced by LUC also affected soil water conductivity in the soil-saturated condition (Figure 3d). At the 0–10 cm layer, the saturated hydraulic conductivity (Ks) decreased by ~92% in CL and PA compared to NV (~47 cm h−1; p < 0.001). This decrease in Ks is commonly found after LUC to CL and PA systems subject to compaction processes [15,16,53]. Additionally, these results corroborate with Dionizio and Costa [54], who found a decrease in saturated hydraulic conductivity from ~20 cm h−1 in NV to ~5 cm h−1 in CL and PA areas after LUC in the Matopiba region. In CL, the decrease in soil aggregate stability (as discussed later) possibly contributed to this result. The decrease in large aggregate occurrence reduces soil pore continuity, thus affecting Ks [55]. The decline in Ks might enhance soil vulnerability to other degradative processes, such as runoff, soil erosion, and consequently, C and nutrient losses [56,57].
While an increase in C content was observed in the upmost soil layer in CL (26 g kg−1) compared to NV (21 g kg−1 of C), C content in PA was reduced to 17 g kg−1 (Figure 4a; p < 0.001). However, both land uses had a decrease in C levels by ~20% compared to NV below a 20 cm depth. The decrease in C levels in PA is likely associated with the low biomass addition promoted by degraded pastures, which may not be enough to keep the pristine soil C levels [34]. Contrarily, the gain in C levels at the upmost layer (0–5 cm) under CL is probably due to the high biomass accumulation in the upmost soil layers under no-tillage systems and the absence of soil disturbance, which reduces SOM exposure to microbial decomposition [34,58,59].
Interestingly, total C levels did not affect soil structural stability. Despite C levels having increased in CL, the MWD of aggregates was reduced by 58% in the 0–30 cm layer compared to the NV (2.46 mm; Figure 4a–c). Similarly, PA showed MWD values as high as in NV use, although soil C content was significantly reduced (compared to NV; Figure 4a–c). In CL, the loss of structural stability may be associated with the intensive use of the area. Even though the soil is managed in a no-till system, a large number of mechanical operations (e.g., fertilization, sowing, and harvesting) can induce changes in soil structure affecting the stability of aggregates [60]. In contrast, the maintenance of high MWD levels in PA may be the reason for the substantial and significant increase in SPRFC (Figure 2b), which is likely associated with the higher proportion of stabilized soil C (i.e., a higher stabilized labile C proportion or low content of labile C; Figure 4b).
Soil organic C stabilization is known as one of the processes that act as cementing agents of individual soil particles, inducing stability to the formed soil aggregates. Dexter et al. [27] suggested that physically, this stabilization induces a gain in soil strength, in a time-dependent process named the “age-hardening” phenomenon. Our data shows that the PA area was subjected to 19 successive years without soil tillage perturbation, whereas CL had an annual soil disturbance due to machinery traffic and soil seeding. The absence of soil disturbance in PA avoided the breakdown of connecting bonds among particles. Logically, NV is also an area with stabilized organic matter and no soil disturbance, but PA has an additional physical component responsible for the gain in soil cohesion, which is compaction. Compaction and organic C stabilization appear to be an important physical combination for gaining soil strength, as also reported by Horn [22] and Moraes [28]. This hypothesis is supported by the fact that soil compaction (i.e., BD) occurred at the same proportions in CL and PA uses (the 5–20 cm layer; Figure 2a), while SPRFC was significantly higher in PA compared to CL (Figure 2b).
Although we observed a slight tendency of increase in soil water content at field capacity in CL (Figure 3c) (possibly due to the increase in total C levels in the upmost layers [61]; the lack of statistical differences (p > 0.05) between CL and PA indicates that the high values observed for SPRFC under PA may be due to soil C cementing effect (the age-hardening phenomenon) [22,27]. In CL, in addition to the mechanical disturbance induced by sowing and other operations, the maintenance of the labile C fraction (Figure 4b) at high levels (constant C income) may have contributed to reducing soil strength.
Despite the gain in soil strength, as indicated by the increase in SPRFC values in PA, it must be highlighted that it does not necessarily mean that root growth is being constrained since pore space is not being reduced compared to CL use. Furthermore, White and Kirkergaard [62] showed that root growth may occur through low resistance zones or biopores in the soil profile. This indicates that other aspects may control the critical limits for root growth and future research should be carried out to verify whether the observed SPRFC values are detrimental or not to proper root development. Finally, we acknowledge that given the specificities of the present study (i.e., sampling design and the number of areas assessed), one should take care before extending the information presented here to the entire Matopiba region. We sustain that the presented results are conclusive for the measured conditions, as all the precautions were taken to avoid any bias when selecting the studied areas. Nevertheless, there is a need for developing additional studies covering multiple sites and environmental/management conditions of the region to better understand the SOM effects on soil physical attributes (e.g., soil strength) in LUC scenarios.

4. Conclusions

The results presented here confirmed the hypothesis that both cropland (CL) and pasture (PA) lead to soil physical quality depletion compared to native vegetation (NV), but the absence of soil disturbance associated with the increasing stability of C in the soil in PA can confer structural stability and soil strength gain. The compaction process induced by CL and PA expansion led to reduced soil pore space and saturated hydraulic conductivity, which markedly reduced soil physical quality. However, PA expansion showed the most interesting results, where a significant gain of soil strength was observed compared to CL under negligible bulk density and porosity variations. We concluded that the absence of soil disturbance and the predominance of stabilized C in PA (i.e., reduction in soil C labile fraction) in the long-term was the main factor for the increase in aggregation and soil strength, in a process induced by organic C-particle bond cementation, called the “age-hardening” phenomenon. These results indicate that changes in SOM fractions (C lability) appeared to influence soil physical quality more than total C variations. Our results suggest that the reduction in soil porosity by compaction due to PA and CL uses can equivalently reduce macropore space and soil hydraulic functioning, but the gain in soil strength in long-term degraded PA areas should be investigated to verify whether the soil penetration resistance values are being detrimental or not to proper plant development over Brazilian Cerrado expansion areas.

Supplementary Materials

The following supporting information can be downloaded at https://www.mdpi.com/article/10.3390/agronomy13010071/s1, Figure S1: X-ray diffraction patterns of the clay fraction from a Typic Haplustox under cropland (CL), pasture (PA), and native vegetation (NV) in the Matopiba region. Kt: kaolinite, Gb: gibbsite; Gt: goethite, and Hm: hematite.

Author Contributions

Conceptualization, J.L.L., R.P.d.L. and C.E.P.C.; methodology, J.L.L. and R.S.S.; formal analysis, J.L.L. and R.P.d.L.; investigation, J.L.L., R.P.d.L. and C.E.P.C.; resources, C.E.P.C.; data curation, J.L.L.; writing—original draft preparation, J.L.L.; writing—review and editing, R.P.d.L., R.S.S., M.R.C., R.E.C. and C.E.P.C.; visualization, J.L.L.; supervision, C.E.P.C.; project administration, C.E.P.C.; funding acquisition, C.E.P.C. All authors have read and agreed to the published version of the manuscript.

Funding

This research was funded by the National Council for Scientific and Technological Development (CNPq) and the São Paulo Research Foundation (FAPESP).

Data Availability Statement

The data presented in this study are part of the Master’s thesis of the first author and are openly available in [Digital Library USP] at [https://doi.org/10.11606/D.11.2021.tde-05082021-093656 (accessed on 25 August 2021)].

Acknowledgments

J.L.L. and R.S.S. thank the National Council for Scientific and Technological Development (CNPq) and the São Paulo Research Foundation (FAPESP) for the research grants (processes 134256/2019-0, 2019/27378-0 and 2019/17576-9). The authors gratefully thank the SLC Agrícola, which provided the areas and field support for the development of the study.

Conflicts of Interest

The authors declare no conflict of interest.

References

  1. Dias, L.C.P.; Pimenta, F.M.; Santos, A.B.; Costa, M.H.; Ladle, R.J. Patterns of Land Use, Extensification, and Intensification of Brazilian Agriculture. Glob. Chang. Biol. 2016, 22, 2887–2903. [Google Scholar] [CrossRef] [PubMed]
  2. Foley, J.A.; DeFries, R.; Asner, G.P.; Barford, C.; Bonan, G.; Carpenter, S.R.; Stuart Chapin, F.; Coe, M.T.; Daily, G.C.; Gibbs, H.K.; et al. Global Consequences of Land Use. Science 2005, 309, 570–574. [Google Scholar] [CrossRef] [PubMed] [Green Version]
  3. Sanderman, J.; Hengl, T.; Fiske, G.J. Soil Carbon Debt of 12,000 Years of Human Land Use. Proc. Natl. Acad. Sci. USA 2017, 114, 9575–9580. [Google Scholar] [CrossRef] [PubMed] [Green Version]
  4. Newbold, T.; Hudson, L.N.; Hill, S.L.L.; Contu, S.; Lysenko, I.; Senior, R.A.; Börger, L.; Bennett, D.J.; Choimes, A.; Collen, B.; et al. Global Effects of Land Use on Local Terrestrial Biodiversity. Nature 2015, 520, 45–50. [Google Scholar] [CrossRef] [Green Version]
  5. Podmanicky, L.; Balázs, K.; Belényesi, M.; Centeri, C.; Kristóf, D.; Kohlheb, N. Modelling Soil Quality Changes in Europe. An Impact Assessment of Land Use Change on Soil Quality in Europe. Ecol. Indic. 2011, 11, 4–15. [Google Scholar] [CrossRef]
  6. Vieira, R.M.d.S.P.; Tomasella, J.; Barbosa, A.A.; Polizel, S.P.; Ometto, J.P.H.B.; Santos, F.C.; Ferreira, Y.d.C.; de Toledo, P.M. Land Degradation Mapping in the MATOPIBA Region (Brazil) Using Remote Sensing Data and Decision-Tree Analysis. Sci. Total Environ. 2021, 782, 146900. [Google Scholar] [CrossRef]
  7. Companhia Nacional de Abastecimento. Décimo Segundo Levantamento/Setembro 2019; CONAB: Brasilia, Brazil, 2019; Volume 2019.
  8. IBGE (Brazilian Institute of Geography and Statistics). Efetivo Dos Rebanhos, Por Tipo de Rebanho. Available online: https://sidra.ibge.gov.br/tabela/3939 (accessed on 4 December 2021).
  9. Bolfe, É.L.; Victória, D.C.; Contini, E.; Silva, G.B.; Araujo, L.S.; Gomes, D. MATOPIBA Em Crescimento Agrícola. Rev. Polít. Agríc. 2016, 1, 38–62. [Google Scholar]
  10. Lumbreras, J.F.; Carvalho Filho, A.; Motta, P.E.F.; Barros, A.H.C.; Aglio, M.L.D.; Dart, R.D.O.; da Silveira, H.L.F.; Quartaroli, C.F.; Almeida, R.E.M.; Freitas, P.L. Aptidão Agrícola Das Terras Do Matopiba. Documentos 2015, 179, 49. [Google Scholar]
  11. Santos, H.G.; Carvalho Junior, W.; Dart, R.O.; Aglio, M.L.D.; Sousa, J.S.; Pares, J.G.; Fontana, A. O Novo Mapa de Solos Do Brasil: Legenda Atualizada; Embrapa Solos: Rio de Janeiro, Brazil, 2011. [Google Scholar]
  12. Donagemma, G.K.; de Freitas, P.L.; Balieiro, F.d.C.; Fontana, A.; Spera, S.T.; Lumbreras, J.F.; Viana, J.H.M.; Filho, J.C.d.A.; dos Santos, F.C.; de Albuquerque, M.R.; et al. Characterization, Agricultural Potential, and Perspectives for the Management of Light Soils in Brazil. Pesqui Agropecu Bras. 2016, 51, 1003–1020. [Google Scholar] [CrossRef] [Green Version]
  13. Lal, R. Restoring Soil Quality to Mitigate Soil Degradation. Sustainability 2015, 7, 5875–5895. [Google Scholar] [CrossRef] [Green Version]
  14. Green, V.S.; Stott, D.E.; Cruz, J.C.; Curi, N. Tillage Impacts on Soil Biological Activity and Aggregation in a Brazilian Cerrado Oxisol. Soil Tillage Res. 2007, 92, 114–121. [Google Scholar] [CrossRef]
  15. Cherubin, M.R.; Karlen, D.L.; Franco, A.L.C.; Tormena, C.A.; Cerri, C.E.P.; Davies, C.A.; Cerri, C.C. Soil Physical Quality Response to Sugarcane Expansion in Brazil. Geoderma 2016, 267, 156–168. [Google Scholar] [CrossRef]
  16. Hunke, P.; Roller, R.; Zeilhofer, P.; Schröder, B.; Mueller, E.N. Soil Changes under Different Land-Uses in the Cerrado of Mato Grosso, Brazil. Geoderma Reg. 2015, 4, 31–43. [Google Scholar] [CrossRef]
  17. Grecchi, R.C.; Gwyn, Q.H.J.; Bénié, G.B.; Formaggio, A.R.; Fahl, F.C. Land Use and Land Cover Changes in the Brazilian Cerrado: A Multidisciplinary Approach to Assess the Impacts of Agricultural Expansion. Appl. Geogr. 2014, 55, 300–312. [Google Scholar] [CrossRef]
  18. Hunke, P.; Mueller, E.N.; Schröder, B.; Zeilhofer, P. The Brazilian Cerrado: Assessment of Water and Soil Degradation in Catchments under Intensive Agricultural Use. Ecohydrology 2015, 8, 1154–1180. [Google Scholar] [CrossRef]
  19. Cunha, E.R.; Bacani, V.M.; Panachuki, E. Modeling Soil Erosion Using RUSLE and GIS in a Watershed Occupied by Rural Settlement in the Brazilian Cerrado. Nat. Hazards 2017, 85, 851–868. [Google Scholar] [CrossRef]
  20. Yost, J.L.; Hartemink, A.E. Soil Organic Carbon in Sandy Soils: A Review, 1st ed.; Elsevier Inc.: Amsterdam, The Netherlands, 2019. [Google Scholar]
  21. Huang, J.; Hartemink, A.E. Soil and Environmental Issues in Sandy Soils. Earth Sci. Rev. 2020, 208, 103295. [Google Scholar] [CrossRef]
  22. Horn, R. Time Dependence of Soil Mechanical Properties and Pore Functions for Arable Soils. Soil Sci. Soc. Am. J. 2004, 68, 1131–1137. [Google Scholar] [CrossRef]
  23. De Moraes, M.T.; da Luz, F.B.; Debiasi, H.; Franchini, J.C.; da Silva, V.R. Soil Load Support Capacity Increases with Time without Soil Mobilization as a Result of Age-Hardening Phenomenon. Soil Tillage Res. 2019, 186, 128–134. [Google Scholar] [CrossRef] [Green Version]
  24. Zhang, B.; Horn, R.; Hallett, P.D. Mechanical Resilience of Degraded Soil Amended with Organic Matter. Soil Sci. Soc. Am. J. 2005, 69, 864–871. [Google Scholar] [CrossRef]
  25. Pesch, C.; Lamandé, M.; de Jonge, L.W.; Norgaard, T.; Greve, M.H.; Moldrup, P. Compression and Rebound Characteristics of Agricultural Sandy Pasture Soils from South Greenland. Geoderma 2020, 380, 114608. [Google Scholar] [CrossRef]
  26. Startsev, V.; Khaydapova, D.; Degteva, S.; Dymov, A. Soils on the Southern Border of the Cryolithozone of European Part of Russia (the Subpolar Urals) and Their Soil Organic Matter Fractions and Rheological Behavior. Geoderma 2020, 361, 114006. [Google Scholar] [CrossRef]
  27. Dexter, A.R.; Horn, R.; Kemper, W.D. Two Mechanisms for Age-hardening of Soil. J. Soil Sci. 1988, 39, 163–175. [Google Scholar] [CrossRef]
  28. Moraes, M.T.; Debiasi, H.; Carlesso, R.; Franchini, J.C.; da Silva, V.R.; da Luz, F.B. Age-Hardening Phenomena in an Oxisol from the Subtropical Region of Brazil. Soil Tillage Res. 2017, 170, 27–37. [Google Scholar] [CrossRef]
  29. Cavalcanti, R.Q.; Rolim, M.M.; de Lima, R.P.; Tavares, U.E.; Pedrosa, E.M.R.; Cherubin, M.R. Soil Physical Changes Induced by Sugarcane Cultivation in the Atlantic Forest Biome, Northeastern Brazil. Geoderma 2020, 370, 114353. [Google Scholar] [CrossRef]
  30. Alvares, C.A.; Stape, J.L.; Sentelhas, P.C.; de Moraes Gonçalves, J.L.; Sparovek, G. Köppen’s Climate Classification Map for Brazil. Meteorol. Z. 2013, 22, 711–728. [Google Scholar] [CrossRef]
  31. Soil Survey Staff. Keys to Soil Taxonomy, 12th ed.; USDA—Natural Resources Conservation Service: Washington, DC, USA, 2014; ISBN 0926487221.
  32. Food and Agriculture Organization of the United Nations. World Reference Base for Soil Resources 2014: International Soil Classification System for Naming Soils and Creating Legends for Soil Maps; FAO: Rome, Italy, 2015; ISBN 9789251083697. [Google Scholar]
  33. Zalles, V.; Hansen, M.C.; Potapov, P.V.; Stehman, S.V.; Tyukavina, A.; Pickens, A.; Song, X.P.; Adusei, B.; Okpa, C.; Aguilar, R.; et al. Near Doubling of Brazil’s Intensive Row Crop Area since 2000. Proc. Natl. Acad. Sci. USA 2019, 116, 428–435. [Google Scholar] [CrossRef] [Green Version]
  34. Locatelli, J.L.; Santos, R.S.; Cherubin, M.R.; Cerri, C.E.P. Changes in Soil Organic Matter Fractions Induced by Cropland and Pasture Expansion in Brazil’ s New Agricultural Frontier. Geoderma Reg. 2022, 28, e00474. [Google Scholar] [CrossRef]
  35. Ribeiro, L.F.; Tabarelli, M. A Structural Gradient in Cerrado Vegetation of Brazil: Changes in Woody Plant Density, Species Richness, Life History and Plant Composition. J. Trop. Ecol. 2002, 18, 775–794. [Google Scholar] [CrossRef]
  36. Cerri, C.E.P.; Galdos, M.V.; Carvalho, J.L.N.; Feigl, B.J.; Cerri, C.C. Quantifying Soil Carbon Stocks and Greenhouse Gas Fluxes in the Sugarcane Agrosystem: Point of View. Sci. Agric. 2013, 70, 361–368. [Google Scholar] [CrossRef]
  37. Gee, G.W.; Or, D. Particle-Size Analysis. In Methods of Soil Analysis: Physical Methods; Dane, J.H., Toop, G.C., Eds.; Soil Science Society of America: Madison, WI, USA, 2002; pp. 255–293. [Google Scholar]
  38. Flint, A.L.; Flint, L.E. Particle Density. In Methods of Soil Analysis; Dane, J.H., Topp, G.C., Eds.; Soil Science Society of America: Madison, WI, USA, 2002; pp. 504–505. [Google Scholar]
  39. Teixeira, P.C.; Donagemma, G.K.; Fontana, A.; Teixeira, W.G. (Eds.) Manual de Métodos de Análise de Solo, 3rd ed.; Embrapa Solos: Rio de Janeiro, Brazi, 2017; ISBN 9788570357717. [Google Scholar]
  40. Cambardella, C.A.; Elliott, E.T. Particulate Soil Organic-Matter Changes across a Grassland Cultivation Sequence. Soil Sci. Soc. Am. J. 1992, 56, 777–783. [Google Scholar] [CrossRef]
  41. Klute, A. Laboratory Measurement of Hydraulic Conductivity of Saturated Soil. In Methods of Soil Analysis: Part 1; Soil Science Society of America: Madison, WI, USA, 1965. [Google Scholar]
  42. Asgarzadeh, H.; Mosaddeghi, M.R.; Nikbakht, A.M. SAWCal: A User-Friendly Program for Calculating Soil Available Water Quantities and Physical Quality Indices. Comput. Electron. Agric. 2014, 109, 86–93. [Google Scholar] [CrossRef]
  43. Elliot, E.T. Aggregate Structure and Carbon, Nitrogen, and Phosphorus in Native and Cultivated Soils. Soil Sci. Soc. Am. J. 1986, 50, 627–633. [Google Scholar] [CrossRef]
  44. Schnepf, A.; Leitner, D.; Klepsch, S. Modeling Phosphorus Uptake by a Growing and Exuding Root System. Vadose Zone J. 2012, 11, vzj2012.0001. [Google Scholar] [CrossRef]
  45. Valle Júnior RF, d.o.; Siqueira, H.E.; Valera, C.A.; Oliveira, C.F.; Sanches Fernandes, L.F.; Moura, J.P.; Pacheco, F.A.L. Diagnosis of Degraded Pastures Using an Improved NDVI-Based Remote Sensing Approach: An Application to the Environmental Protection Area of Uberaba River Basin (Minas Gerais, Brazil). Remote Sens. Appl. 2019, 14, 20–33. [Google Scholar] [CrossRef]
  46. Azarnivand, H.; Farajollahi, A.; Bandak, E.; Pouzesh, H. Assessment of the Effects of Overgrazing on the Soil Physical Characteristic and Vegetation Cover Changes in Rangelands of Hosainabad in Kurdistan Province, Iran. J. Rangel. Sci. 2010, 1, 95–102. [Google Scholar]
  47. Hamza, M.A.; Anderson, W.K. Soil Compaction in Cropping Systems: A Review of the Nature, Causes and Possible Solutions. Soil Tillage Res. 2005, 82, 121–145. [Google Scholar] [CrossRef]
  48. Lima, R.P.; Keller, T.; Giarola, N.B.F.; Tormena, C.A.; Silva, A.R.D.; Rolim, M.M. Measurements and Simulations of Compaction Effects on the Least Limiting Water Range of a No-till Oxisol. Soil Res. 2019, 58, 62–72. [Google Scholar] [CrossRef]
  49. Reichert, J.M.; Mentges, M.I.; Rodrigues, M.F.; Cavalli, J.P.; Awe, G.O.; Mentges, L.R. Compressibility and Elasticity of Subtropical No-till Soils Varying in Granulometry Organic Matter, Bulk Density and Moisture. Catena 2018, 165, 345–357. [Google Scholar] [CrossRef]
  50. Reynolds, W.D.; Bowman, B.T.; Drury, C.F.; Tan, C.S.; Lu, X. Indicators of Good Soil Physical Quality: Density and Storage Parameters. Geoderma 2002, 110, 131–146. [Google Scholar] [CrossRef]
  51. Sattolo, T.M.S.; Pereira, L.M.; Otto, R.; Francisco, E.; Duarte, A.P.; Kappes, C.; Prochnow, L.I.; Cherubin, M.R. Effects of Land Use, Tillage Management, and Crop Diversification on Soil Physical Quality in Cerrado Agricultural Systems. Soil Sci. Soc. Am. J. 2021, 85, 1799–1813. [Google Scholar] [CrossRef]
  52. Tullberg, J.; Antille, D.L.; Bluett, C.; Eberhard, J.; Scheer, C. Controlled Traffic Farming Effects on Soil Emissions of Nitrous Oxide and Methane. Soil Tillage Res. 2018, 176, 18–25. [Google Scholar] [CrossRef]
  53. Batista, P.H.D.; de Almeida, G.L.P.; de Lima, R.P.; Pandorfi, H.; da Silva, M.V.; Rolim, M.M. Impact of Short-Term Grazing on Physical Properties of Planosols in Northeastern Brazil. Geoderma Reg. 2019, 19, e00234. [Google Scholar] [CrossRef]
  54. Dionizio, E.A.; Costa, M.H. Influence of Land Use and Land Cover on Hydraulic and Physical Soil Properties at the Cerrado Agricultural Frontier. Agriculture 2019, 9, 24. [Google Scholar] [CrossRef] [Green Version]
  55. Karami, A.; Homaee, M.; Afzalinia, S.; Ruhipour, H.; Basirat, S. Organic Resource Management: Impacts on Soil Aggregate Stability and Other Soil Physico-Chemical Properties. Agric. Ecosyst. Environ. 2012, 148, 22–28. [Google Scholar] [CrossRef]
  56. Gomes, L.; Simões, S.J.C.; Dalla Nora, E.L.; de Sousa-Neto, E.R.; Forti, M.C.; Ometto, J.P.H.B. Agricultural Expansion in the Brazilian Cerrado: Increased Soil and Nutrient Losses and Decreased Agricultural Productivity. Land 2019, 8, 12. [Google Scholar] [CrossRef] [Green Version]
  57. Falcão, K.D.S.; Panachuki, E.; Monteiro, F.D.N.; da Silva Menezes, R.; Rodrigues, D.B.B.; Sone, J.S.; Oliveira, P.T.S. Surface Runoff and Soil Erosion in a Natural Regeneration Area of the Brazilian Cerrado. Int. Soil Water Conserv. Res. 2020, 8, 124–130. [Google Scholar] [CrossRef]
  58. Bayer, C.; Martin-Neto, L.; Mielniczuk, J.; Pavinato, A.; Dieckow, J. Carbon Sequestration in Two Brazilian Cerrado Soils under No-Till. Soil Tillage Res. 2006, 86, 237–245. [Google Scholar] [CrossRef]
  59. Diekow, J.; Mielniczuk, J.; Knicker, H.; Bayer, C.; Dick, D.P.; Kögel-Knabner, I. Carbon and Nitrogen Stocks in Physical Fractions of a Subtropical Acrisol as Influenced by Long-Term No-till Cropping Systems and N Fertilisation. Plant Soil 2005, 268, 319–328. [Google Scholar] [CrossRef]
  60. Theisen, G.; Bastiaans, L. Low Disturbance Seeding Suppresses Weeds in No-tillage Soyabean. Weed Res. 2015, 55, 598–608. [Google Scholar] [CrossRef]
  61. Bagnall, A.D.K.; Morgan, C.L.S.; Mac Bean, G.; Liptzin, D.; Shannon, B.; Cope, M.; Greub, K.L.H.; Rieke, E.L.; Norris, C.E.; Paul, W.; et al. Selecting Soil Hydraulic Properties as Indicators of Soil Health: Measurement Response to Management and Site Characteristics. Soil Sci. Soc. Am. J. 2022, 86, 1206–1226. [Google Scholar] [CrossRef]
  62. White, R.G.; Kirkegaard, J.A. The Distribution and Abundance of Wheat Roots in a Dense, Structured Subsoil—Implications for Water Uptake. Plant Cell Environ. 2010, 33, 133–148. [Google Scholar] [CrossRef] [PubMed]
Figure 1. Location of the Matopiba region (A). County of Tasso Fragoso, Maranhão state (B). Assessed area location (red marker) (C). Field distribution of the sampled areas (D).
Agronomy 13 00071 g001
Figure 2. (a) Bulk density and (b) soil penetration resistance at field capacity at 0–5, 5–10, 10–20, and 20–30 cm soil layers under cropland (CL), pasture (PA), and native vegetation (NV) areas. * Means followed by the same letter within the same soil layer are equal to Tukey’s test (p < 0.05). Vertical bars represent the standard deviation of the mean.
Agronomy 13 00071 g002
Figure 3. (a) Total porosity, (b) macroporosity, (c) water content at field capacity (C), and (d) saturated hydraulic conductivity at 0–5, 5–10, 10–20, and 20–30 cm soil layers under cropland (CL), pasture (PA), and native vegetation (NV) areas. The dashed line indicates possible limiting values for proper root growth for macroporosity [50]. * Means followed by the same letter within the same soil layer are equal to Tukey’s test (p < 0.05). Vertical bars represent the standard deviation of the mean.
Agronomy 13 00071 g003
Figure 4. (a) Soil organic carbon content, carbon distribution at labile (particulate organic matter) and stabilized (mineral associated organic matter) fractions of soil organic matter (b [34]), and mean weight diameter of soil aggregates (c) under cropland (CL), pasture (PA), and native vegetation (NV) areas. * Mean followed by the same letter within the same soil layer is equal to Tukey’s test (p < 0.05). Vertical bars represent the standard deviation of the mean.
Agronomy 13 00071 g004
Table 1. Land-use change, management history, and soil characterization for native vegetation (NV), pasture (PA), and cropland (CL) sites [34].
Land-UseSoil LayerClaySiltSandPD apHH2OP bBS cLand-Use Change and Site History
cmg kg−1mg m−3 mg dm−3%
NV0–5371455842.714.22.3312.78Remnant of Cerrado sensu stricto vegetation—composed of several species of trees and grasses sparsely distributed, without the formation of a continuous covering canopy. The trees have an average height that varies between 3 and 6 m [35].
5–10374365902.704.32.008.98
10–20396285762.724.21.628.84
20–30420495302.734.31.4427.43
PA0–5348276252.684.339.1244.29An area extending over ~90 ha was converted from NV to PA in 2000. At the conversion time, NV was burned, removed, and soil was prepared by plowing and disking. The pasture was implemented by local grass species (i.e., tropical grasses from Urochloa genus). Soil fertility management was carried out exclusively with lime applications to reduce soil acidity. The area was intensively grazed by sheep and cattle and supports ~1 animal unit ha−1 (450 kg) in a full year. At the sampling moment, the area had clear signals of degradation (e.g., the presence of weeds and a low forage cover).
5–10345206362.694.533.0238.49
10–20344246352.704.420.5136.76
20–30375505772.724.426.6835.89
CL0–5272247052.664.955.3659.16An area extending over ~200 ha was converted from NV to CL under a no-tillage system in 2009. Before CL implementation, NV was burned, removed, and the soil was prepared by plowing and disking. Soil acidity was corrected by the application of 1.6 Mg ha−1 of dolomitic lime and additional doses were applied following soil analysis and recommendations. The area has been cultivated in a successional system of soybean (Glycine max L. Merr) + millet (Pennisetum glaucum L.) and used as a cover crop. Fertilization was carried out annually at an average rate of 100 kg ha−1 of K2O (potassium chloride) and 90 kg ha−1 of P2O5 (simple superphosphate). The soybean’s mean yield since the implementation is 3300 kg ha−1.
5–10298126902.704.642.3634.10
10–20307176762.714.614.5434.04
20–30337186452.744.44.7219.85
a Particle density. b Available phosphorus extracted by the Mehlich-1 solution. c Base saturation on cation exchange capacity.
Disclaimer/Publisher’s Note: The statements, opinions and data contained in all publications are solely those of the individual author(s) and contributor(s) and not of MDPI and/or the editor(s). MDPI and/or the editor(s) disclaim responsibility for any injury to people or property resulting from any ideas, methods, instructions or products referred to in the content.

