
Reconstructing the Invasive History and Potential Distribution Prediction of Amaranthus palmeri in China

Abstract
:1. Introduction
2. Materials and Methods
2.1. Data Process
- (1)
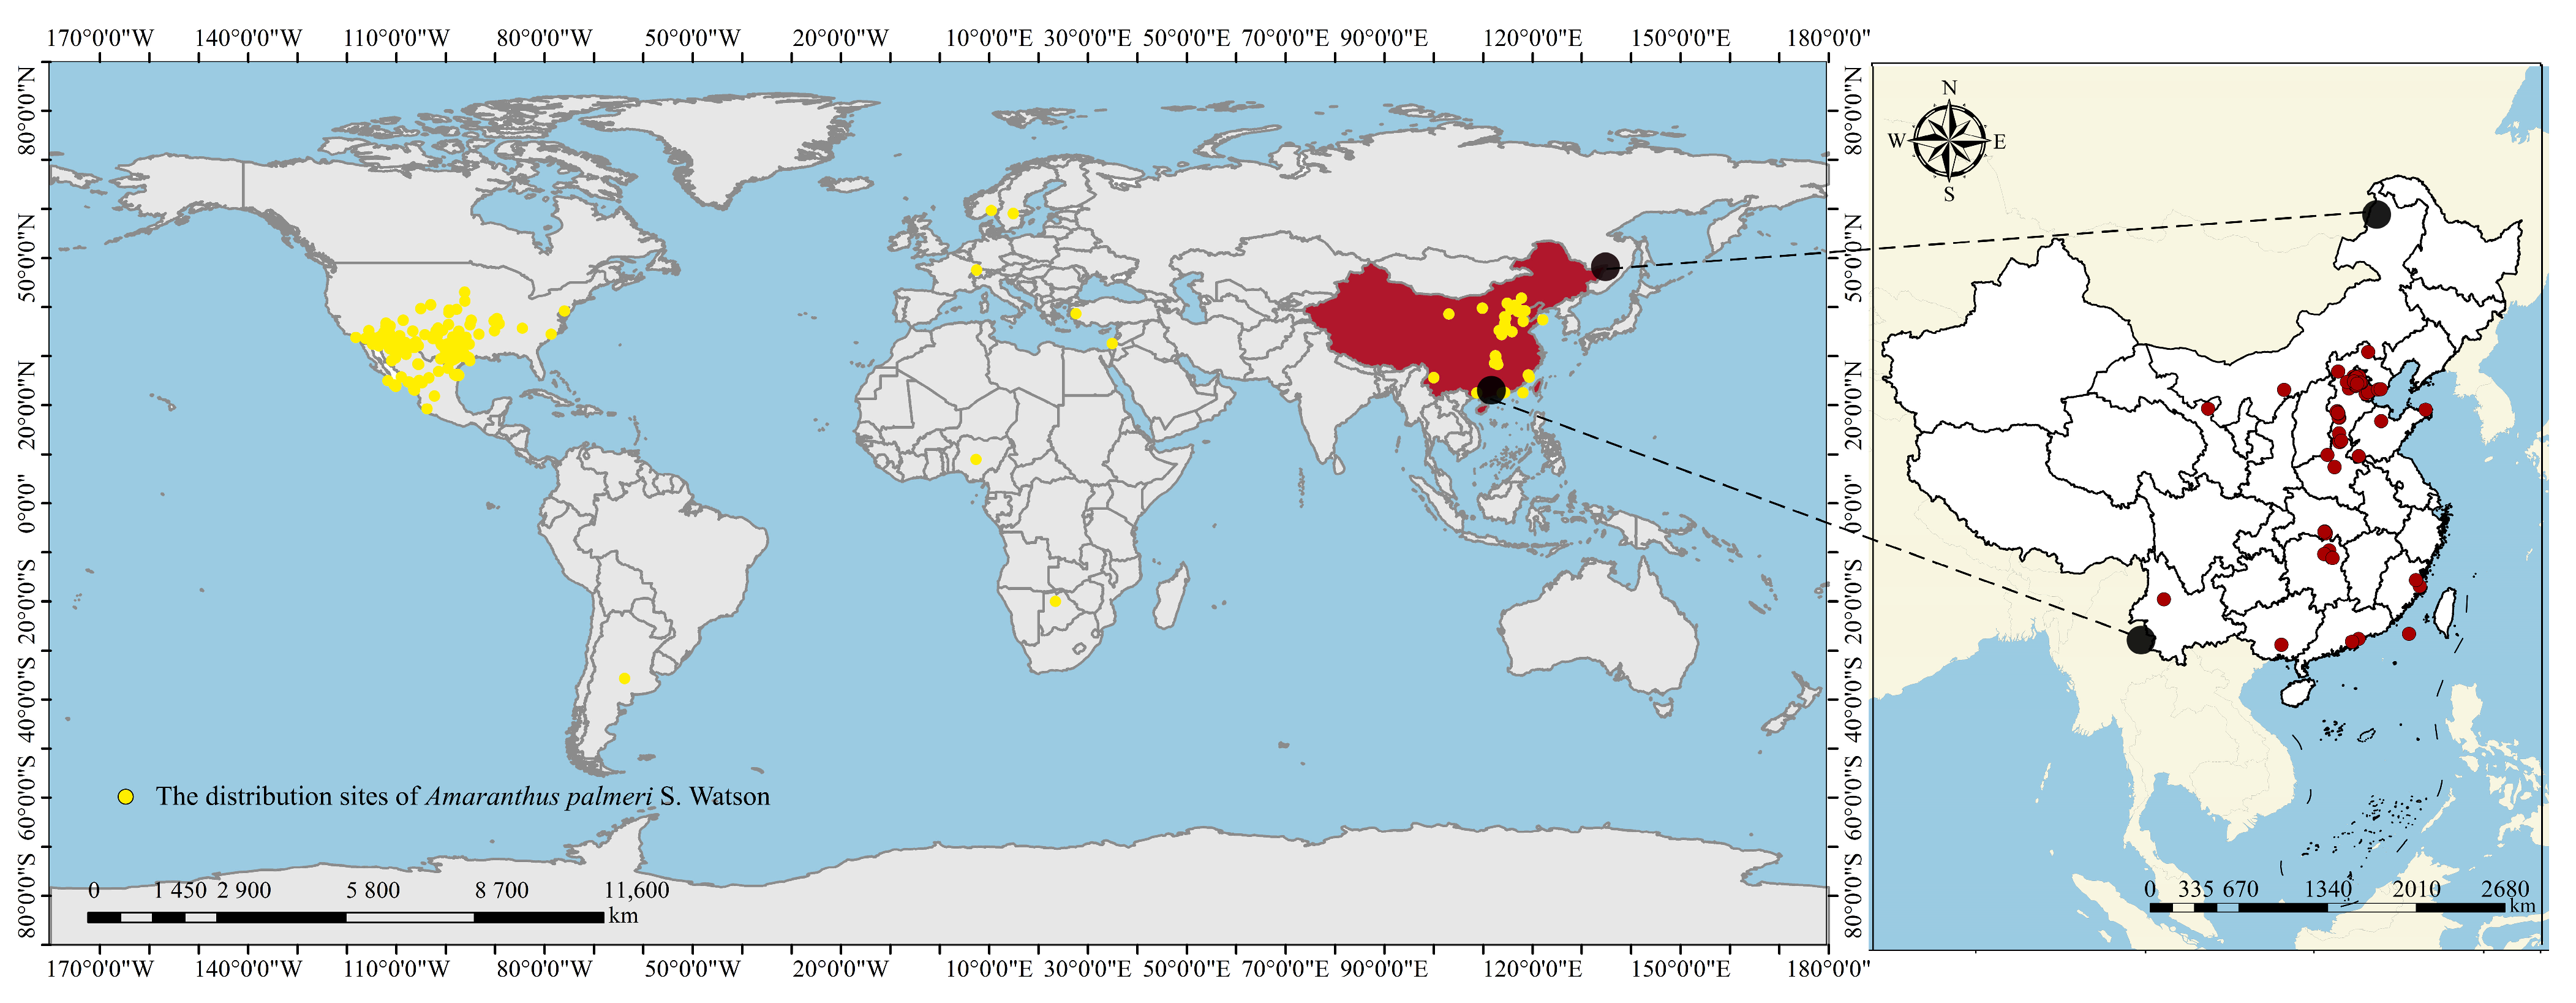
- Occurrence records
- (2)
- Environmental variables
2.2. Invasive Historical Reconstruction of Amaranthus palmeri
2.3. Construction, Optimization, and Evaluation of Models
2.4. Visualisation of Distribution Trends
3. Results
3.1. Model Performance
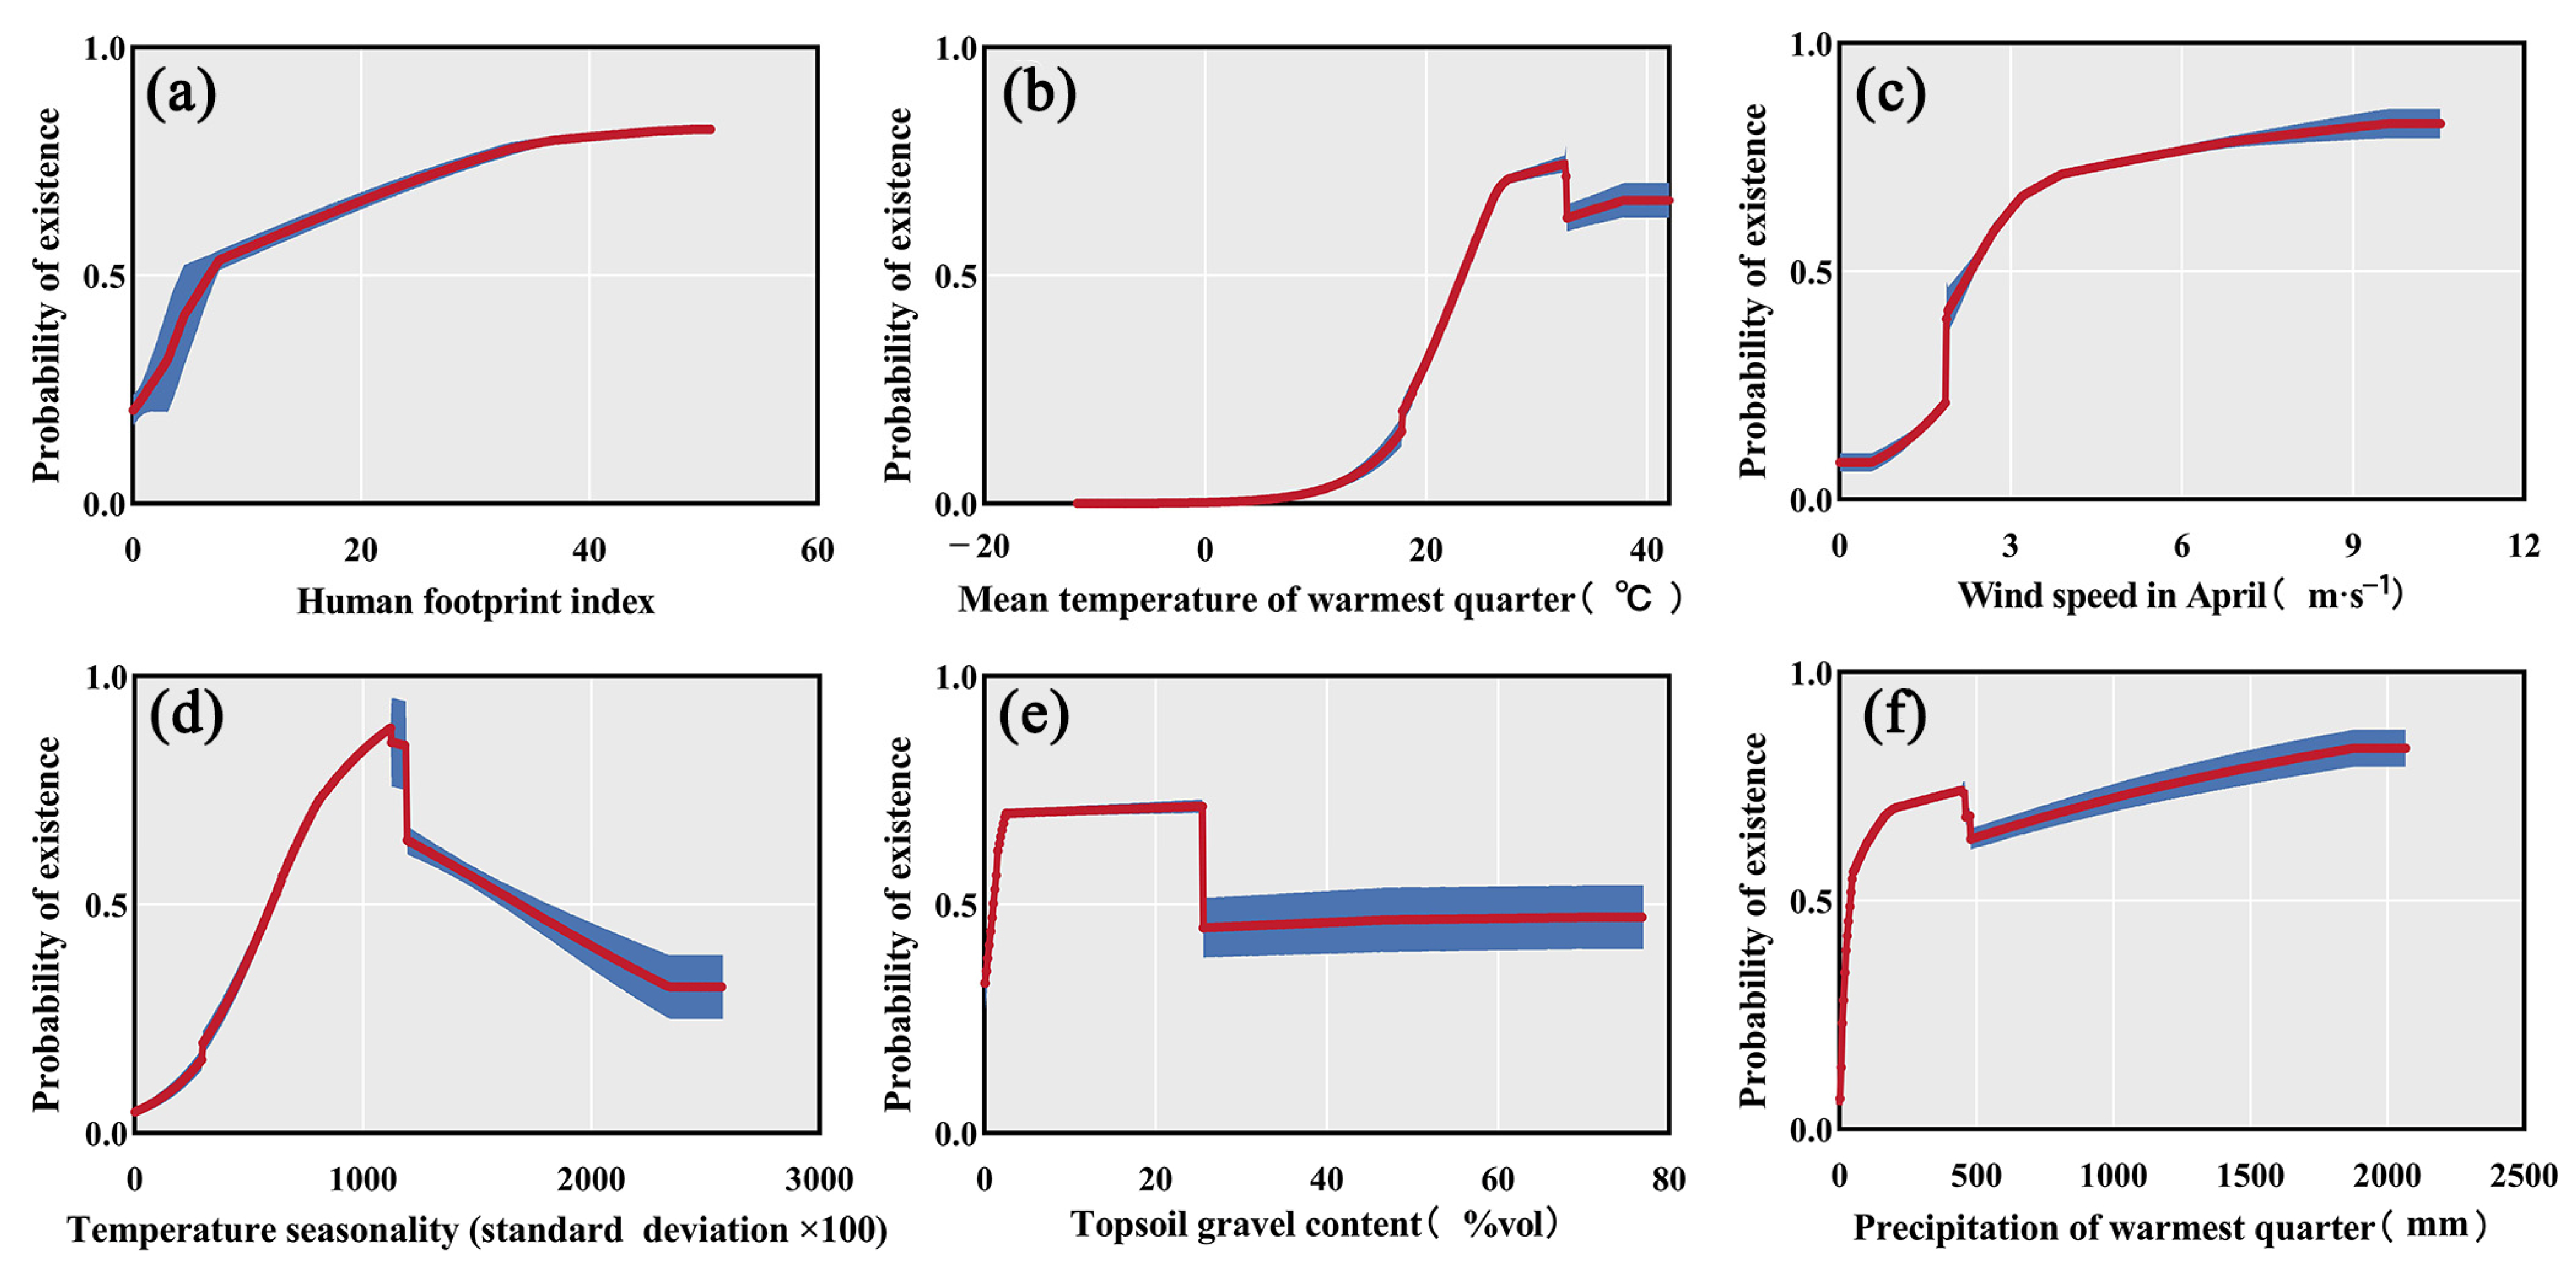
3.2. Contribution of Key Environmental Factors
3.3. Historical Spread Dynamics of Amaranthus palmeri in China
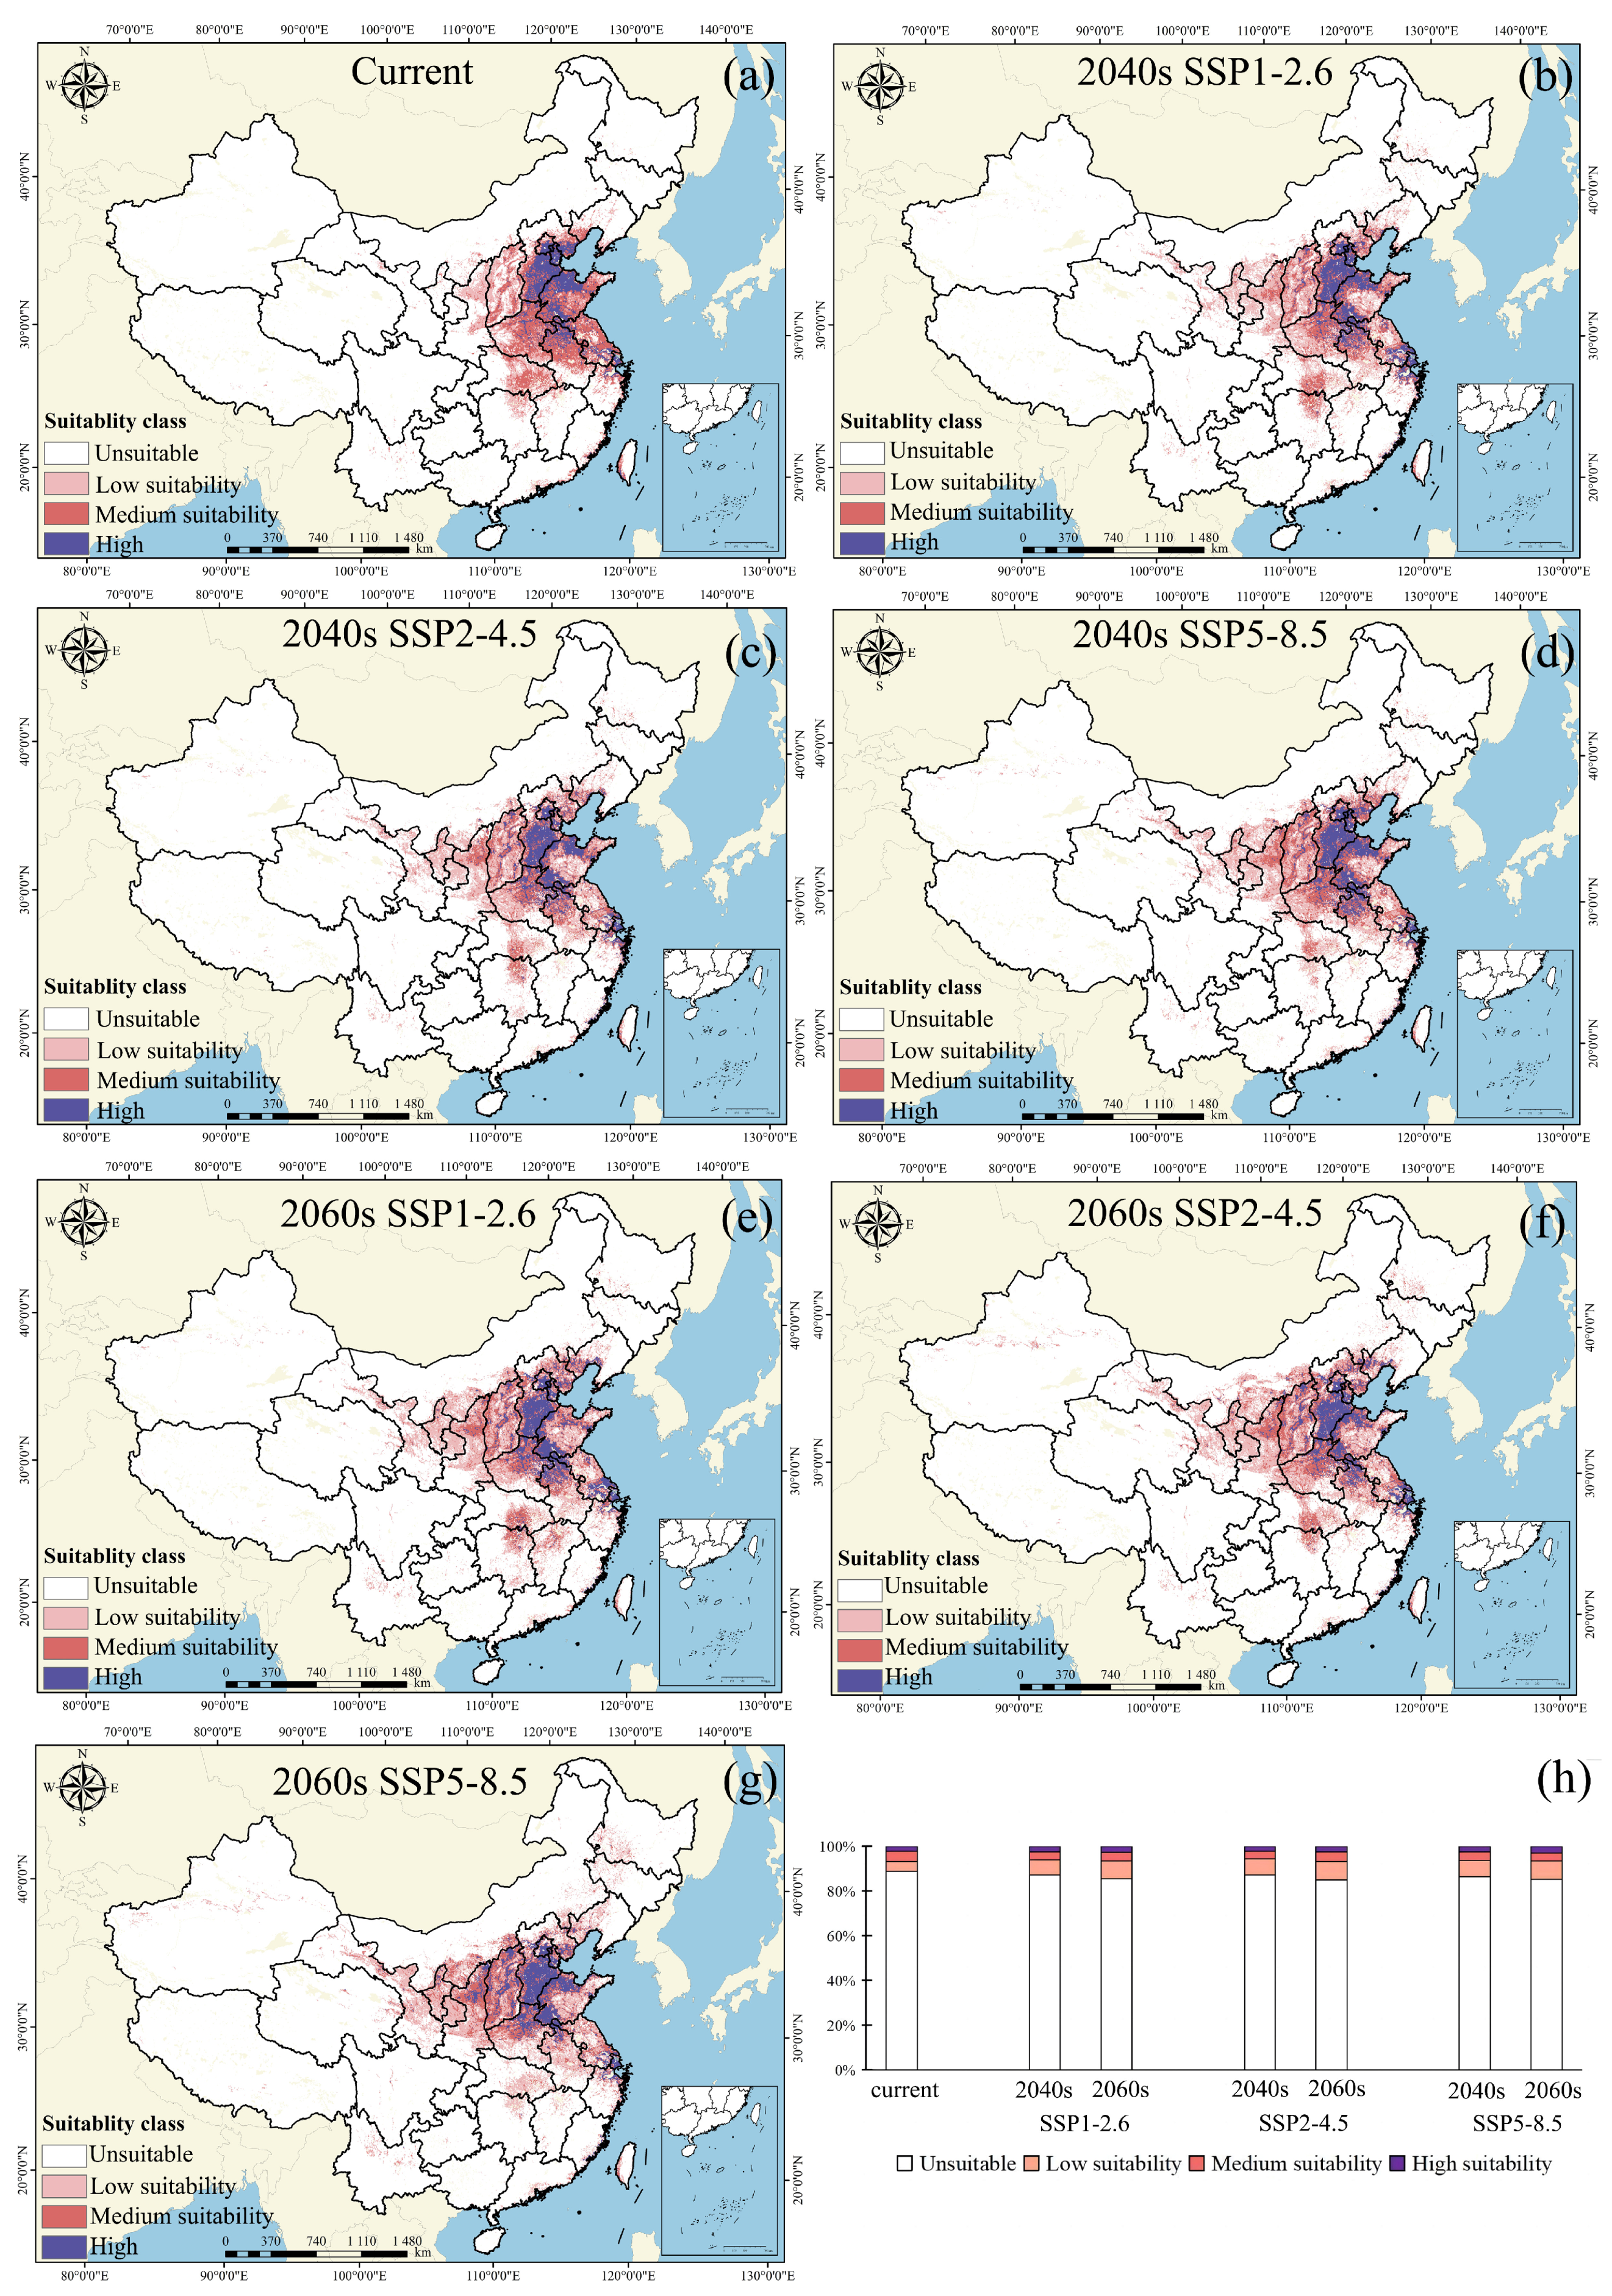
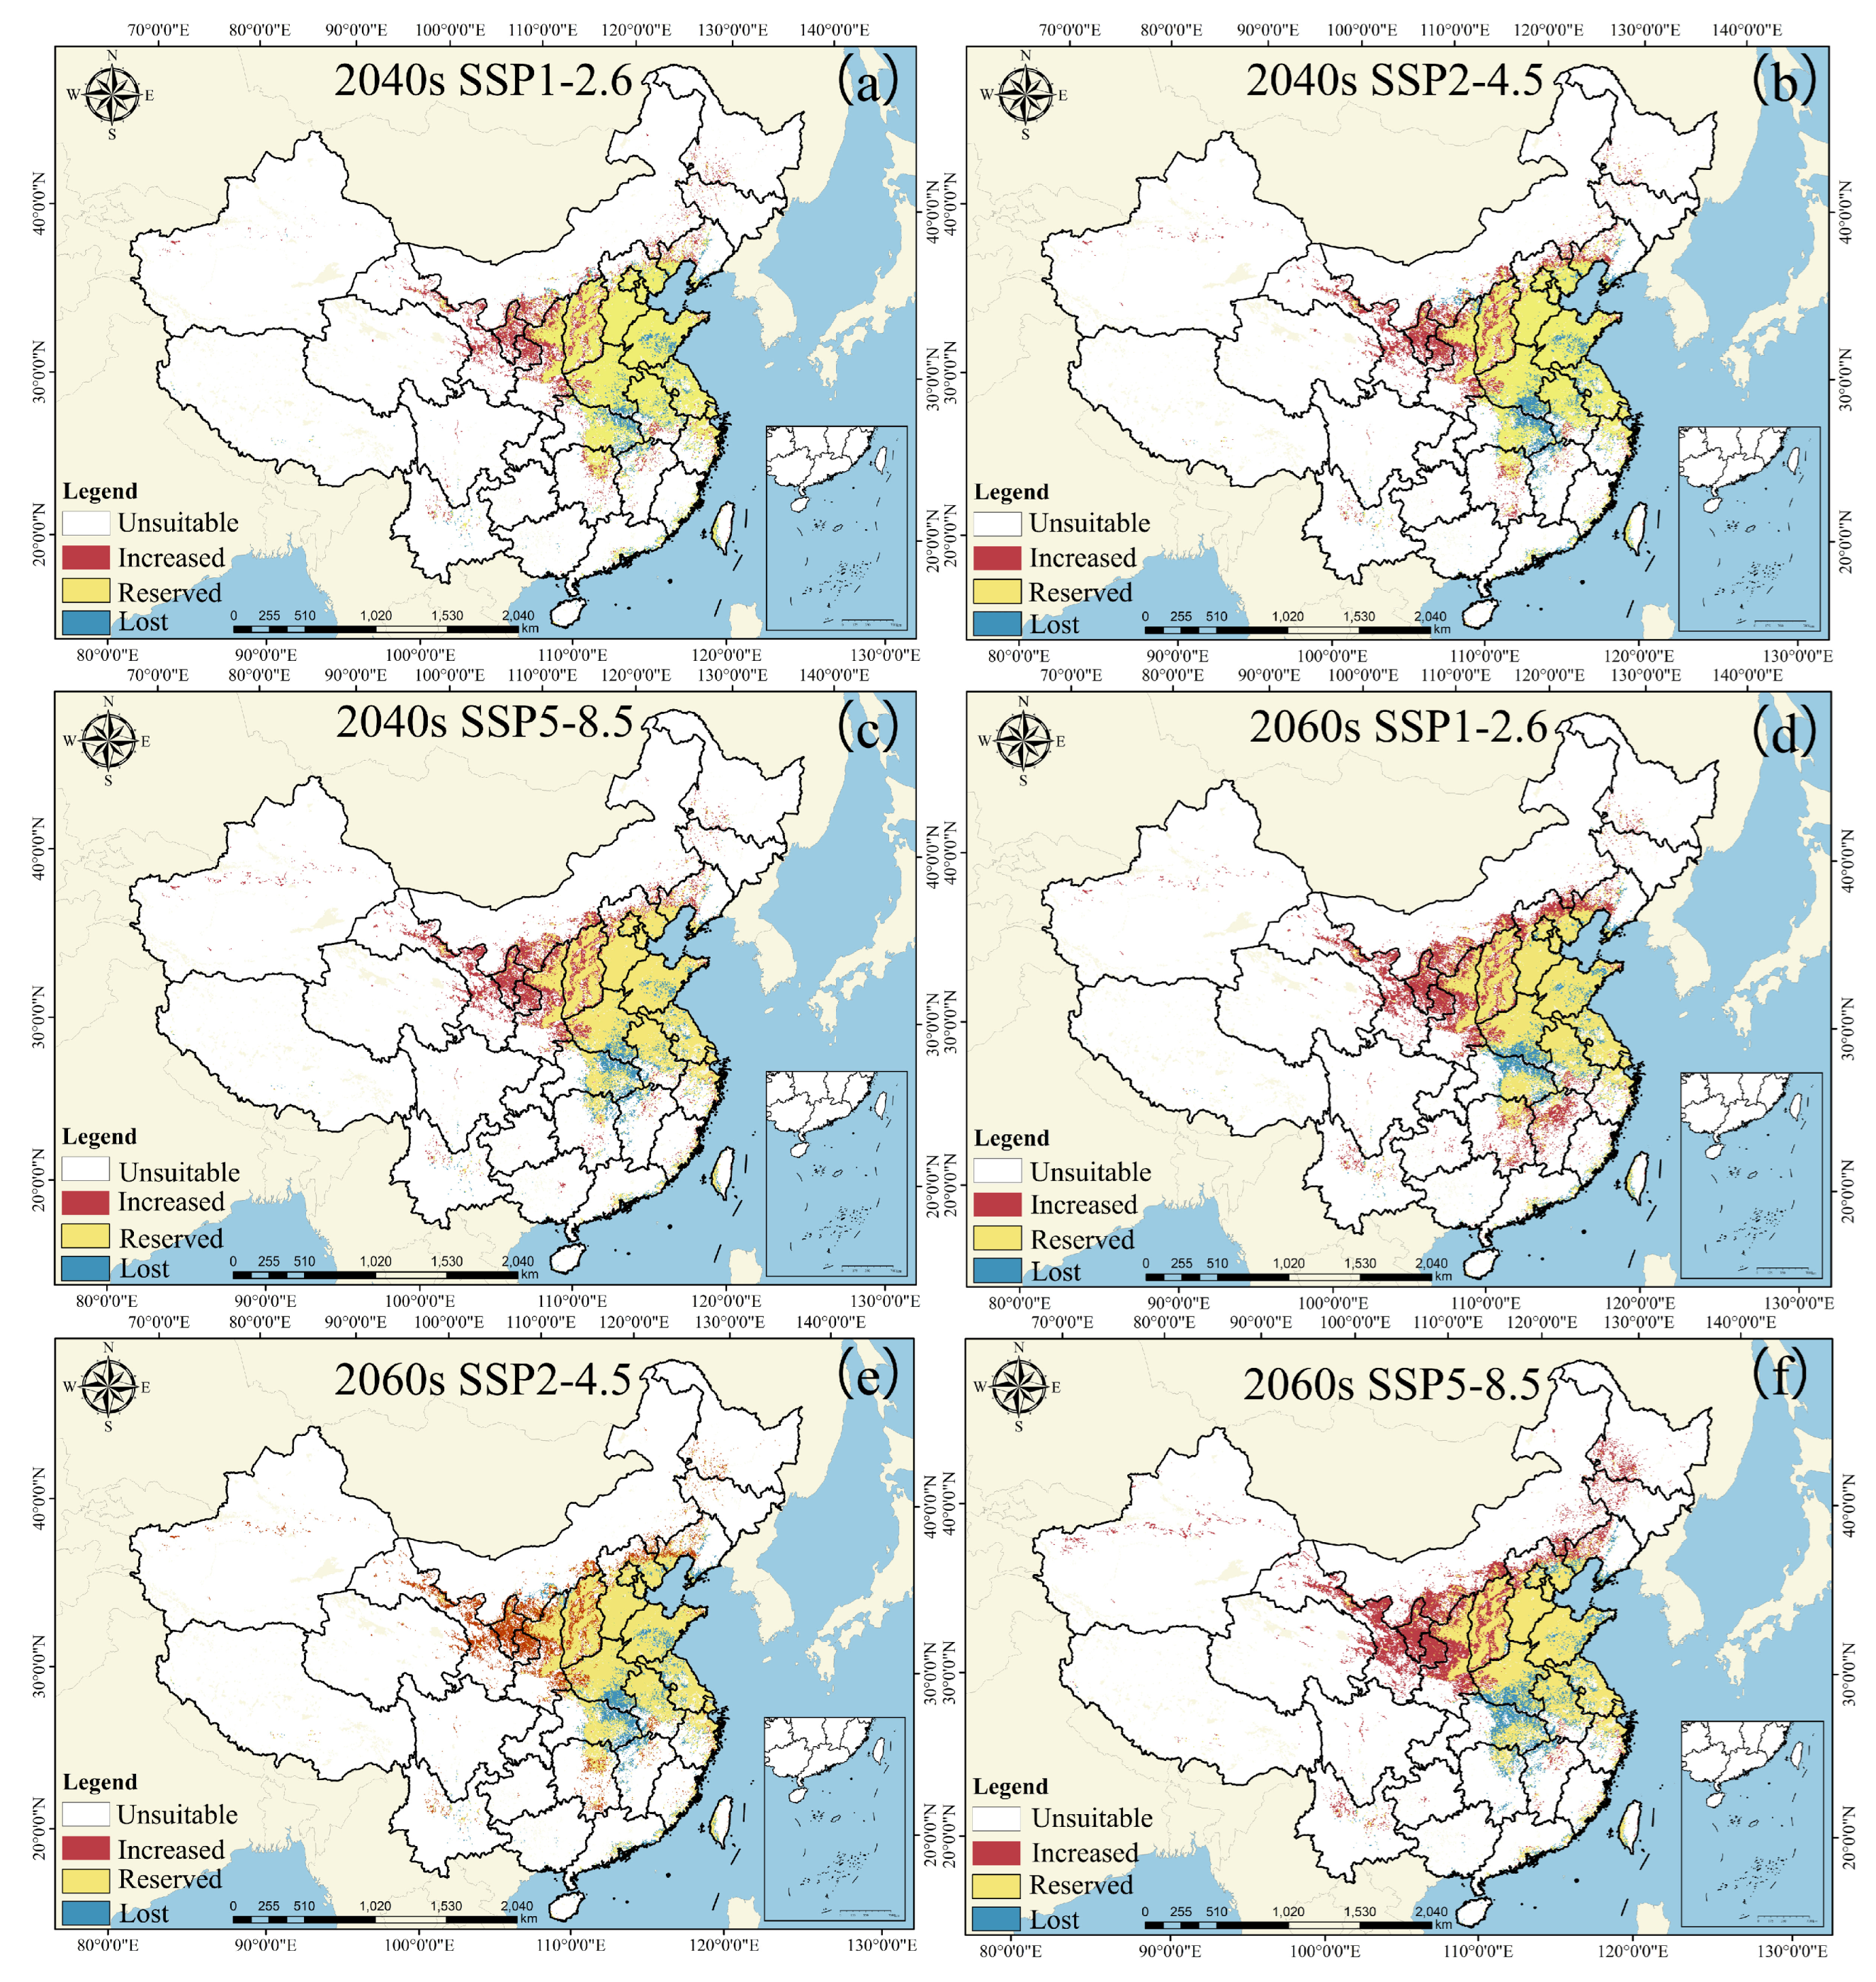
3.4. Potential Geographical Distributions of Amaranthus palmeri in China
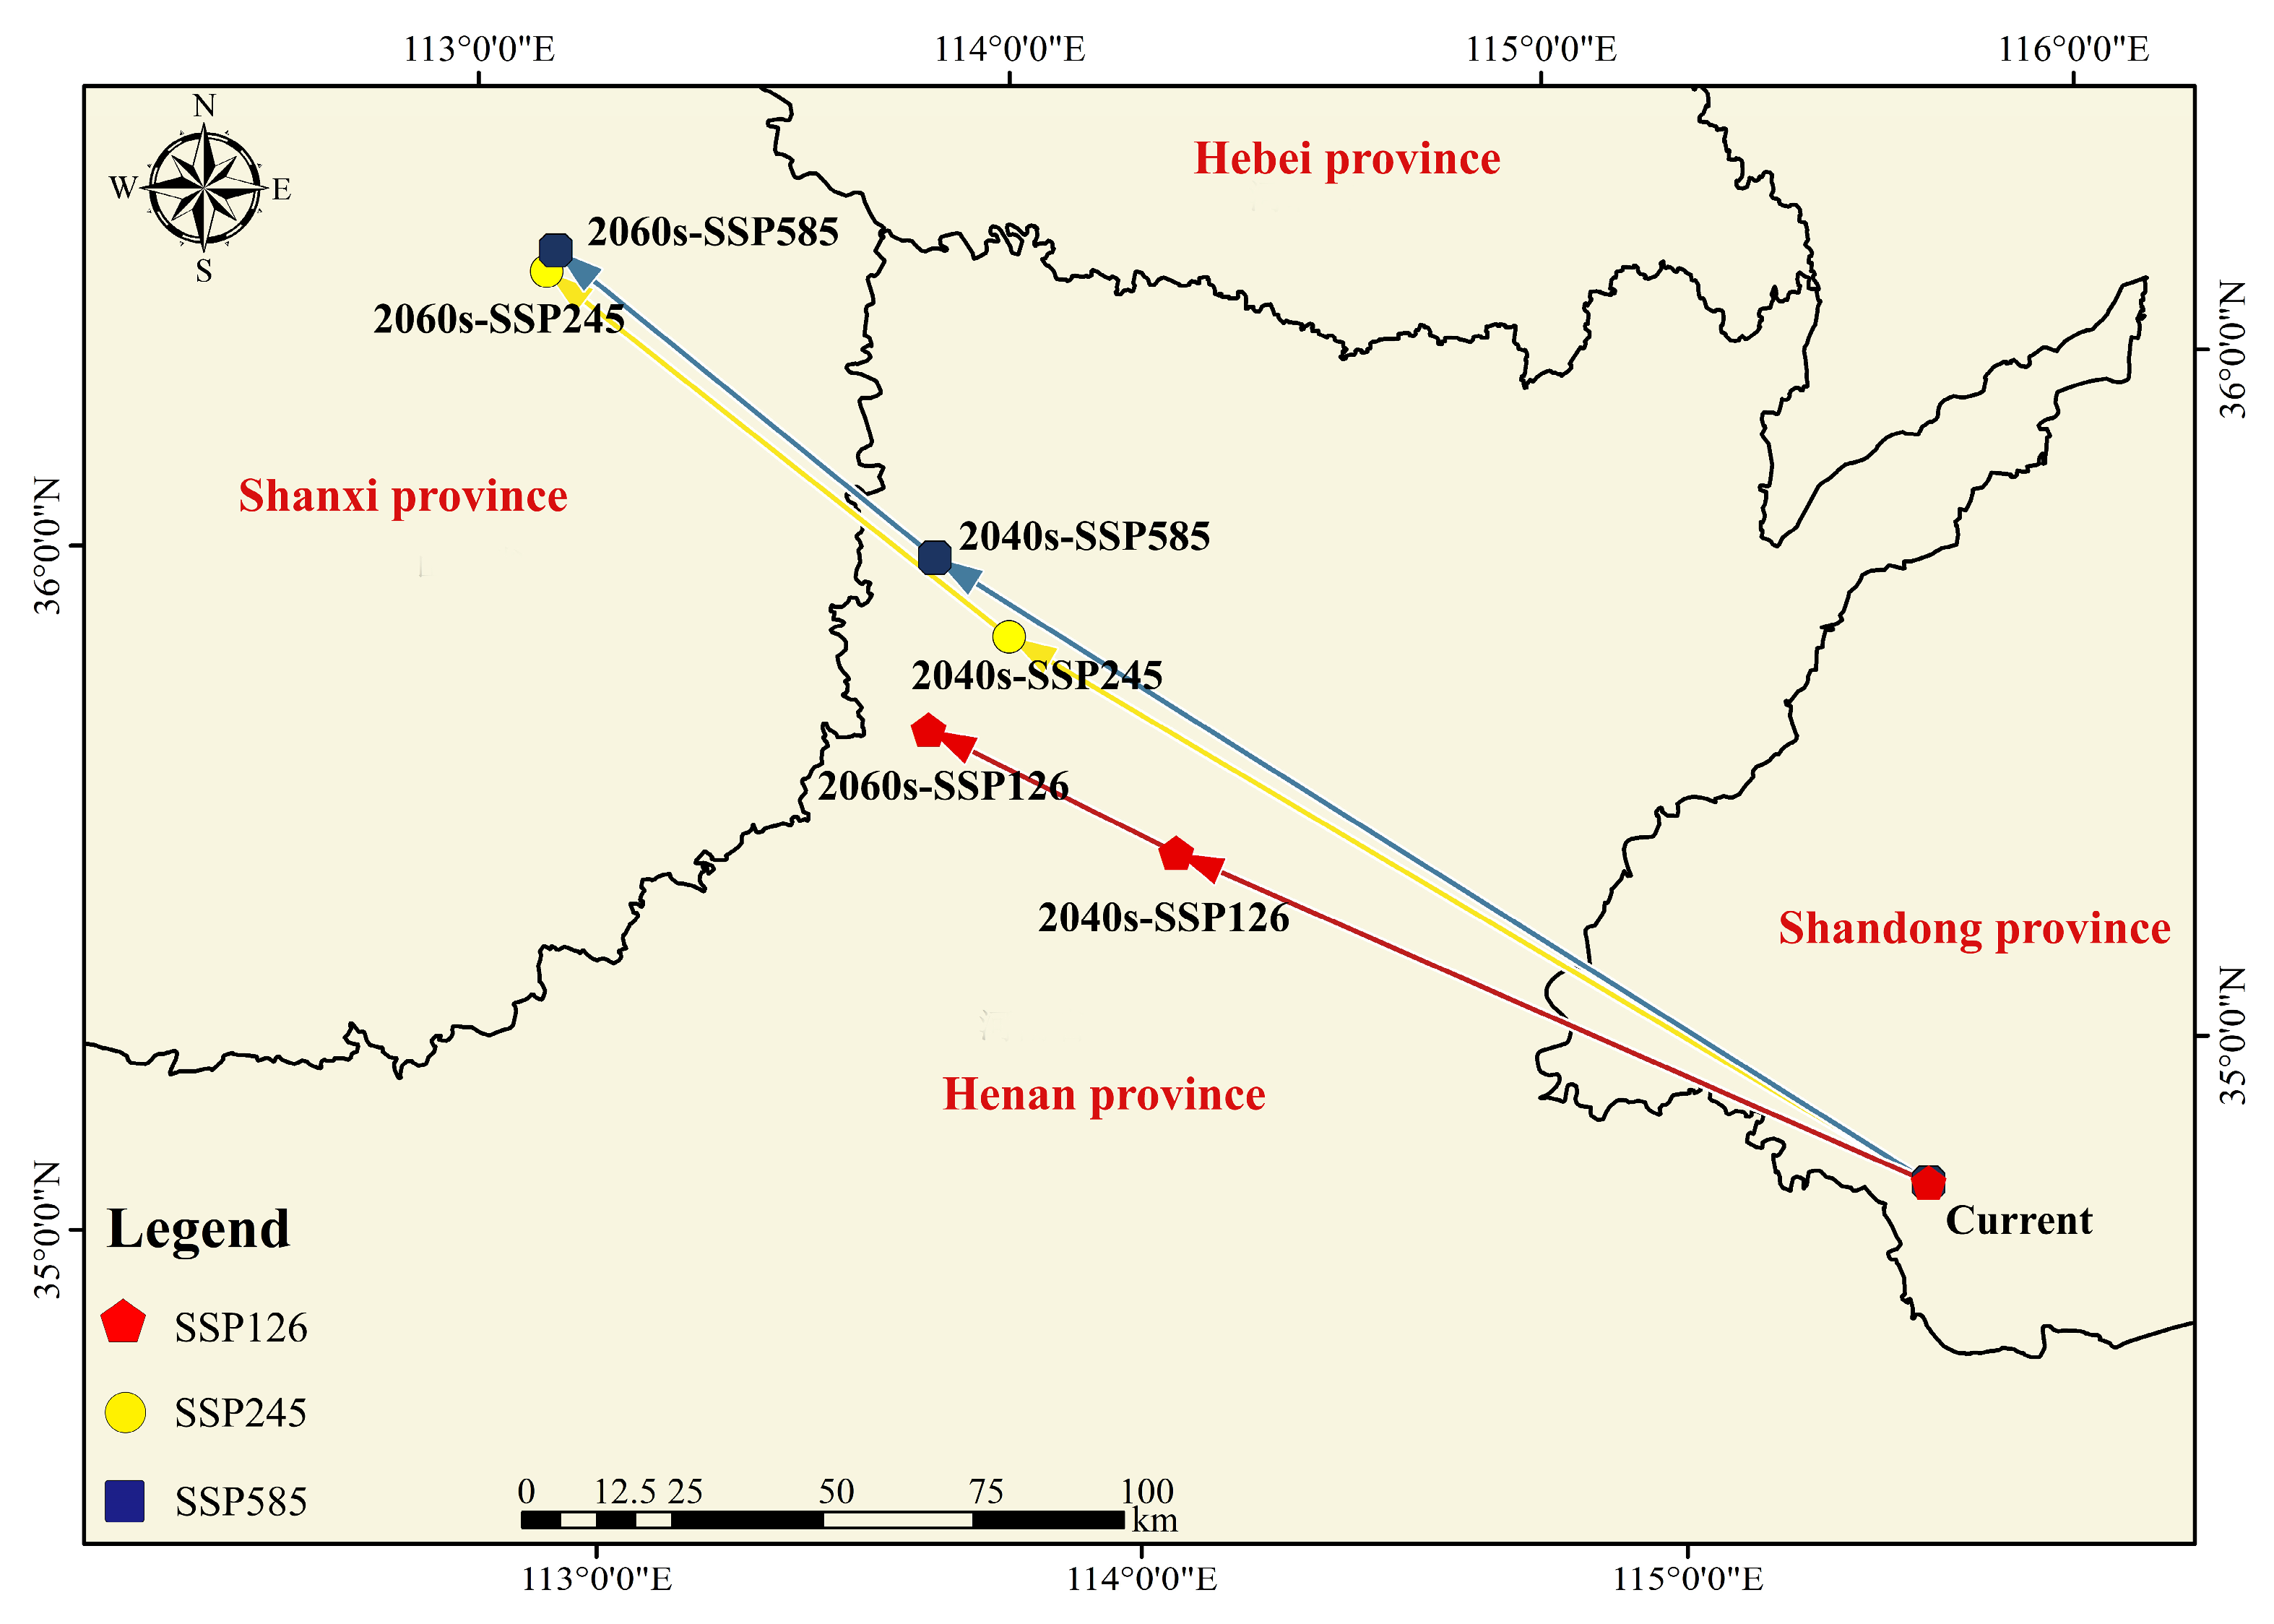
3.5. The Centroid Distribution Transfer of Amaranthus palmeri under Different Climatic Scenarios
4. Discussion
4.1. Invasive Historical Reconstruction and Key Driver
4.2. Potential Geographical Distributions under Climate Change
4.3. Prevention and Control of Amaranthus palmeri in China
4.4. Research Significance and Prospect
5. Conclusions
Supplementary Materials
Author Contributions
Funding
Data Availability Statement
Conflicts of Interest
References
- Sherpa, S.; Despres, L. The evolutionary dynamics of biological invasions: A multi-approach perspective. Evol. Appl. 2021, 14, 1463–1484. [Google Scholar] [CrossRef]
- Diagne, C.; Leroy, B.; Vaissiere, A.C.; Gozlan, R.E.; Roiz, D.; Jaric, I.; Salles, J.M.; Bradshaw, C.J.A.; Courchamp, F. High and rising economic costs of biological invasions worldwide. Nature 2021, 592, 571–576. [Google Scholar] [CrossRef]
- Diagne, C.; Leroy, B.; Gozlan, R.E.; Vaissiere, A.C.; Assailly, C.; Nuninger, L.; Roiz, D.; Jourdain, F.; Jaric, I.; Courchamp, F. InvaCost, a public database of the economic costs of biological invasions worldwide. Sci. Data 2020, 7, 277. [Google Scholar] [CrossRef] [PubMed]
- Pysek, P.; Richardson, D.M.; Gadgil, A.; Liverman, D.M. Invasive Species, Environmental Change and Management, and Health. Annu. Rev. Environ. Resour. 2010, 35, 25–55. [Google Scholar] [CrossRef]
- Buchadas, A.; Vaz, A.S.; Honrado, J.P.; Alagador, D.; Bastos, R.; Cabral, J.A.; Santos, M.; Vicente, J.R. Dynamic models in research and management of biological invasions. J. Environ. Manag. 2017, 196, 594–606. [Google Scholar] [CrossRef] [PubMed]
- Barco-Antonanzas, M.; Gil-Monreal, M.; Eceiza, M.V.; Royuela, M.; Zabalza, A. Primary metabolism in an Amaranthus palmeri population with multiple resistance to glyphosate and pyrithiobac herbicides. Plant. Sci. 2022, 318, 111212. [Google Scholar] [CrossRef] [PubMed]
- Bobadilla, L.K.; Baek, Y.; Tranel, P.J. Comparative transcriptomic analysis of male and females in the dioecious weeds Amaranthus palmeri and Amaranthus tuberculatus. BMC Plant Biol. 2023, 23, 339. [Google Scholar] [CrossRef]
- Matzrafi, M.; Herrmann, I.; Nansen, C.; Kliper, T.; Zait, Y.; Ignat, T.; Siso, D.; Rubin, B.; Karnieli, A.; Eizenberg, H. Hyperspectral Technologies for Assessing Seed Germination and Trifloxysulfuron-methyl Response in Amaranthus palmeri (Palmer Amaranth). Front. Plant Sci. 2017, 8, 474. [Google Scholar] [CrossRef]
- Cao, J.J.; Wu, Q.M.; Wan, F.H.; Guo, J.Y.; Wang, R. Reliable and rapid identification of glyphosate-resistance in the invasive weed Amaranthus palmeri in China. Pest Manag. Sci. 2022, 78, 2173–2182. [Google Scholar] [CrossRef]
- Singh, V.; Dou, T.Y.; Krimmer, M.; Singh, S.; Humpal, D.; Payne, W.Z.; Sanchez, L.; Voronine, D.V.; Prosvirin, A.; Scully, M.; et al. Raman Spectroscopy Can Distinguish Glyphosate-Susceptible and -Resistant Palmer Amaranth (Amaranthus palmeri). Front. Plant Sci. 2021, 12, 657963. [Google Scholar] [CrossRef]
- Mesgaran, M.B.; Matzrafi, M.; Ohadi, S. Sex dimorphism in dioecious Palmer amaranth (Amaranthus palmeri) in response to water stress. Planta 2021, 254, 17. [Google Scholar] [CrossRef] [PubMed]
- Gaines, T.A.; Ward, S.M.; Bukun, B.; Preston, C.; Leach, J.E.; Westra, P. Interspecific hybridization transfers a previously unknown glyphosate resistance mechanism in Amaranthus species. Evol. Appl. 2012, 5, 29–38. [Google Scholar] [CrossRef] [PubMed]
- Montgomery, J.S.; Giacomini, D.; Waithaka, B.; Lanz, C.; Murphy, B.P.; Campe, R.; Lerchl, J.; Landes, A.; Gatzmann, F.; Janssen, A.; et al. Draft Genomes of Amaranthus tuberculatus, Amaranthus hybridus, and Amaranthus palmeri. Genome Biol. Evol. 2020, 12, 1988–1993. [Google Scholar] [CrossRef] [PubMed]
- Zhang, X.Y.; Zhao, J.; Wang, M.M.; Li, Z.P.; Lin, S.; Chen, H. Potential distribution prediction of Amaranthus palmeri S. Watson in China under current and future climate scenarios. Ecol. Evol. 2022, 12, 9505. [Google Scholar] [CrossRef] [PubMed]
- Seebens, H.; Essl, F.; Dawson, W.; Fuentes, N.; Moser, D.; Pergl, J.; Pysek, P.; van Kleunen, M.; Weber, E.; Winter, M.; et al. Global trade will accelerate plant invasions in emerging economies under climate change. Glob. Chang. Biol. 2015, 21, 4128–4140. [Google Scholar] [CrossRef] [PubMed]
- Zhang, M.; Shi, C.; Li, X.Y.; Wang, K.F.; Qiu, Z.L.; Shi, F.C. Changes in the structure and function of rhizosphere soil microbial communities induced by Amaranthus palmeri invasion. Front. Microbiol. 2023, 14, 1114388. [Google Scholar] [CrossRef]
- Jarnevich, C.S.; Holcombe, T.R.; Barnett, D.T.; Stohlgren, T.J.; Kartesz, J.T. Forecasting Weed Distributions using Climate Data: A GIS Early Warning Tool. Invasive Plant Sci. Manag. 2010, 3, 365–375. [Google Scholar] [CrossRef]
- Paulus, M.; Teubner, D.; Hochkirch, A.; Veith, M. Journey into the past: Using cryogenically stored samples to reconstruct the invasion history of the quagga mussel (Dreissena rostriformis) in German river systems. Biol. Invasions 2014, 16, 2591–2597. [Google Scholar] [CrossRef]
- Vallejo-Marin, M.; Friedman, J.; Twyford, A.D.; Lepais, O.; Ickert-Bond, S.M.; Streisfeld, M.A.; Yant, L.; van Kleunen, M.; Rotter, M.C.; Puzey, J.R. Population genomic and historical analysis suggests a global invasion by bridgehead processes in Mimulus guttatus. Commun. Biol. 2021, 4, 327. [Google Scholar] [CrossRef]
- Capinha, C.; Seebens, H.; Cassey, P.; Garcia-Diaz, P.; Lenzner, B.; Mang, T.; Moser, D.; Pysek, P.; Rodder, D.; Scalera, R.; et al. Diversity, biogeography and the global flows of alien amphibians and reptiles. Divers. Distrib. 2017, 23, 1313–1322. [Google Scholar] [CrossRef]
- Duncan, R.P.; Blackburn, T.M.; Rossinelli, S.; Bacher, S. Quantifying invasion risk: The relationship between establishment probability and founding population size. Methods Ecol. Evol. 2014, 5, 1255–1263. [Google Scholar] [CrossRef]
- Dyer, E.E.; Cassey, P.; Redding, D.W.; Collen, B.; Franks, V.; Gaston, K.J.; Jones, K.E.; Kark, S.; Orme, C.D.L.; Blackburn, T.M. The global distribution and drivers of alien bird species richness. PLoS Biol. 2017, 15, e2000942. [Google Scholar] [CrossRef] [PubMed]
- Briscoe Runquist, R.D.; Lake, T.; Tiffin, P.; Moeller, D.A. Species distribution models throughout the invasion history of Palmer amaranth predict regions at risk of future invasion and reveal challenges with modeling rapidly shifting geographic ranges. Sci. Rep. 2019, 9, 2426. [Google Scholar] [CrossRef] [PubMed]
- Kistner, E.J.; Hatfield, J.L. Potential geographic distribution of Palmer amaranth under current and future climates. Arg. Env. Lett. 2018, 3, 170044. [Google Scholar] [CrossRef]
- Roberts, J.; Florentine, S. A review of the biology, distribution patterns and management of the invasive species Amaranthus palmeri S. Watson (Palmer amaranth): Current and future management challenges. Weed Res. 2022, 62, 113–122. [Google Scholar] [CrossRef]
- Yang, J.; Hu, Q.; You, L.; Cai, Z.; Chen, Y.; Wei, H.; Xu, Z.; He, Z.; Yin, G.; Xu, B. Mapping the potential northern limits and promotion extent of ratoon rice in China. Appl. Geogr. 2023, 150, 102822. [Google Scholar] [CrossRef]
- Fick, S.E.; Hijmans, R.J. WorldClim 2: New 1-km spatial resolution climate surfaces for global land areas. Int. J. Climatol. 2017, 37, 4302–4315. [Google Scholar] [CrossRef]
- Eyring, V.; Bony, S.; Meehl, G.A.; Senior, C.A.; Stevens, B.; Stouffer, R.J.; Taylor, K.E. Overview of the Coupled Model Intercomparison Project Phase 6 (CMIP6) experimental design and organization. GeoSci. Model. Dev. 2016, 9, 1937–1958. [Google Scholar] [CrossRef]
- Petrie, R.; Denvil, S.; Ames, S.; Levavasseur, G.; Fiore, S.; Allen, C.; Antonio, F.; Berger, K.; Bretonniere, P.A.; Cinquini, L.; et al. Coordinating an operational data distribution network for CMIP6 data. Geosci. Model. Dev. 2021, 14, 629–644. [Google Scholar] [CrossRef]
- Fischer, G.; Nachtergaele, F.; Prieler, S.; Teixeira, E.I.; Toth, G.; Velthuizen, H.V.; Verelst, L.; Wiberg, D. Global Agro-Ecological Zones (GAEZ v3.0); International Institute for Applied Systems Analysis: Laxenburg, Austria, 2012. [Google Scholar]
- Venter, O.; Sanderson, E.W.; Magrach, A.; Allan, J.R.; Beher, J.; Jones, K.R.; Possingham, H.P.; Laurance, W.F.; Wood, P.; Fekete, B.M.; et al. Last of the Wild Project, Version 3 (LWP-3): 2009 Human Footprint, 2018 Release; NASA: Washington, DC, USA, 2018.
- Xu, Y.; Ye, X.; Yang, Q.; Weng, H.; Liu, Y.; Ahmad, S.; Zhang, G.; Huang, Q.; Zhang, T.; Liu, B. Ecological niche shifts affect the potential invasive risk of Phytolacca americana (Phytolaccaceae) in China. Ecol. Process. 2023, 12, 1. [Google Scholar] [CrossRef]
- Lin, J.; Li, H.; Zeng, Y.; He, X.; Zhuang, Y.; Liang, Y.; Lu, S. Estimating potential illegal land development in conservation areas based on a presence-only model. J. Environ. Manag. 2022, 321, 115994. [Google Scholar] [CrossRef]
- Khosa, D.; Marr, S.M.; Wasserman, R.J.; Zengeya, T.A.; Weyl, O.L. An evaluation of the current extent and potential spread of Black Bass invasions in South Africa. Biol. Invasions 2019, 21, 1721–1736. [Google Scholar] [CrossRef]
- Yang, M.; Zhao, H.X.; Xian, X.Q.; Wang, R.; Yang, N.W.; Chen, L.; Liu, W.X. Assessing risk from invasive alien plants in China: Reconstructing invasion history and estimating distribution patterns of Lolium temulentum and Aegilops tauschii. Front. Plant Sci. 2023, 14, 1113567. [Google Scholar] [CrossRef]
- Zahoor, B.; Liu, X.; Songer, M. The impact of climate change on three indicator Galliformes species in the northern highlands of Pakistan. Environ. Pollut. 2022, 29, 54330–54347. [Google Scholar] [CrossRef] [PubMed]
- Aidoo, O.F.; Souza, P.G.C.; da Silva, R.S.; Santana, P.A.; Picanco, M.C.; Kyerematen, R.; Setamou, M.; Ekesi, S.; Borgemeister, C. Climate-induced range shifts of invasive species (Diaphorina citri Kuwayama). Pest Manag. Sci. 2022, 78, 2534–2549. [Google Scholar] [CrossRef] [PubMed]
- Ramos, R.S.; Kumar, L.; Shabani, F.; Picanco, M.C. Risk of spread of tomato yellow leaf curl virus (TYLCV) in tomato crops under various climate change scenarios. Agric. Syst. 2019, 173, 524–535. [Google Scholar] [CrossRef]
- Xian, X.; Zhao, H.; Wang, R.; Huang, H.; Chen, B.; Zhang, G.; Liu, W.; Wan, F. Climate change has increased the global threats posed by three ragweeds (Ambrosia L.) in the Anthropocene. Sci. Total Environ. 2023, 859, 160252. [Google Scholar] [CrossRef] [PubMed]
- Ni, M. Herbarium records reveal multiple phases in the relationship between minimum residence time and invasion ranges of alien plant species. Plants People Planet 2023, 5, 47–57. [Google Scholar] [CrossRef]
- Shigesada, N.; Kawasaki, K. Invasion and the range expansion of species: Effects of long-distance dispersal. Dispersal Ecol. 2002, 17, 350–373. [Google Scholar]
- Sheppard, C.S.; Schurr, F.M. Biotic resistance or introduction bias? Immigrant plant performance decreases with residence times over millennia. Glob. Ecol. Biogeogr. 2019, 28, 222–237. [Google Scholar] [CrossRef]
- Dyer, E.E.; Franks, V.; Cassey, P.; Collen, B.; Cope, R.C.; Jones, K.E.; Sekercioglu, C.H.; Blackburn, T.M. A global analysis of the determinants of alien geographical range size in birds. Glob. Ecol. Biogeogr. 2016, 25, 1346–1355. [Google Scholar] [CrossRef]
- Aikio, S.; Duncan, R.P.; Hulme, P.E. Lag-phases in alien plant invasions: Separating the facts from the artefacts. Oikos 2010, 119, 370–378. [Google Scholar] [CrossRef]
- Wang, R.; Wang, Y.Z. Invasion dynamics and potential spread of the invasive alien plant species Ageratina adenophora (Asteraceae) in China. Divers. Distrib. 2006, 12, 397–408. [Google Scholar] [CrossRef]
- Huang, Q.Q.; Qian, C.; Wang, Y.; Jia, X.; Dai, X.F.; Zhang, H.; He, F.; Peng, S.L.; Wang, G.X. Determinants of the geographical extent of invasive plants in China: Effects of biogeographical origin, life cycle and time since introduction. Biodivers. Conserv. 2010, 19, 1251–1259. [Google Scholar] [CrossRef]
- Lanfear, R.; Ho, S.Y.W.; Davies, T.J.; Moles, A.T.; Aarssen, L.; Swenson, N.G.; Warman, L.; Zanne, A.E.; Allen, A.P. Taller plants have lower rates of molecular evolution. Nat. Commun. 2013, 4, 836. [Google Scholar] [CrossRef]
- Mahoney, D.J.; Jordan, D.L.; Hare, A.T.; Leon, R.G.; Roma-Burgos, N.; Vann, M.C.; Jennings, K.M.; Everman, W.J.; Cahoon, C.W. Palmer amaranth (Amaranthus palmeri) growth and seed production when in competition with peanut and other crops in North Carolina. Agronomy 2021, 11, 1734. [Google Scholar] [CrossRef]
- Norsworthy, J.K.; Griffith, G.M.; Scott, R.C.; Smith, K.L.; Oliver, L.R. Confirmation and control of glyphosate-resistant Palmer amaranth (Amaranthus palmeri) in Arkansas. Weed Technol. 2008, 22, 108–113. [Google Scholar] [CrossRef]
- Sosnoskie, L.M.; Webster, T.M.; Kichler, J.M.; MacRae, A.W.; Grey, T.L.; Culpepper, A.S. Pollen-Mediated Dispersal of Glyphosate-Resistance in Palmer Amaranth under Field Conditions. Weed Sci. 2012, 60, 366–373. [Google Scholar] [CrossRef]
- Haubrock, P.J.; Cuthbert, R.N.; Haase, P. Long-term trends and drivers of biological invasion in Central European streams. Sci. Total Environ. 2023, 876, 162817. [Google Scholar] [CrossRef]
- Liang, Y.; Li, J.; Li, J.; Valimaki, S.K. Impact of urbanization on plant diversity: A case study in built-up areas of Beijing. For. Stud. China 2008, 10, 179–188. [Google Scholar] [CrossRef]
- Malkinson, D.; Kopel, D.; Wittenberg, L. From rural-urban gradients to patch–matrix frameworks: Plant diversity patterns in urban landscapes. Landsc. Urban. Plan. 2018, 169, 260–268. [Google Scholar] [CrossRef]
- Mayer, K.; Haeuser, E.; Dawson, W.; Essl, F.; Kreft, H.; Pergl, J.; Pysek, P.; Weigelt, P.; Winter, M.; Lenzner, B.; et al. Naturalization of ornamental plant species in public green spaces and private gardens. Biol. Invasions 2017, 19, 3613–3627. [Google Scholar] [CrossRef]
- Kuang, W.H. 70 years of urban expansion across China: Trajectory, pattern, and national policies. Sci. Bull. 2020, 65, 1970–1974. [Google Scholar] [CrossRef] [PubMed]
- Irl, S.D.H.; Schweiger, A.H.; Steinbauer, M.J.; Ah-Peng, C.; Arevalo, J.R.; Beierkuhnlein, C.; Chiarucci, A.; Daehler, C.C.; Fernandez-Palacios, J.M.; Flores, O.; et al. Human impact, climate and dispersal strategies determine plant invasion on islands. J. Biogeogr. 2021, 48, 1889–1903. [Google Scholar] [CrossRef]
- Fonseca, É.; Both, C.; Cechin, S.Z. Introduction pathways and socio-economic variables drive the distribution of alien amphibians and reptiles in a megadiverse country. Divers. Distrib. 2019, 25, 1130–1141. [Google Scholar] [CrossRef]
- Ledda, A.; Yanniccari, M.; Franco, M.C.; Sobrero, M.T. Thermal time and extreme weather events determine the emergence of Amaranthus palmeri. Adv. Weed Sci. 2022, 40, e020220104. [Google Scholar] [CrossRef]
- Turner, N.C.; Molyneux, N.; Yang, S.; Xiong, Y.-C.; Siddique, K.H. Climate change in south-west Australia and north-west China: Challenges and opportunities for crop production. Crop. Pasture Sci. 2011, 62, 445–456. [Google Scholar] [CrossRef]
- Cao, J.J.; Wang, R.; Liu, W.X.; Wan, F.H.; Guo, J.Y. Invasion risk assessment of Amaranthus palmeri at different latitudinal regions in China based on seed germination rate. J. Plant Prot. 2022, 48, 8–15. [Google Scholar] [CrossRef]
- Wright, S.R.; Coble, H.D.; Raper, C.D.; Rufty, T.W. Comparative responses of soybean (Glycine max), sicklepod (Senna obtusifolia), and Palmer amaranth (Amaranthus palmeri) to root zone and aerial temperatures. Weed Sci. 1999, 47, 167–174. [Google Scholar] [CrossRef]
- Guo, P.; Al-Khatib, K. Temperature effects on germination and growth of redroot pigweed (Amaranthus retroflexus), Palmer amaranth (A. palmeri), and common waterhemp (A. rudis). Weed Sci. 2003, 51, 869–875. [Google Scholar] [CrossRef]
- Chahal, P.S.; Irmak, S.; Jugulam, M.; Jhala, A.J. Evaluating effect of degree of water stress on growth and fecundity of Palmer amaranth (Amaranthus palmeri) using soil moisture sensors. Weed Sci. 2018, 66, 738–745. [Google Scholar] [CrossRef]
- Sarangi, D.; Irmak, S.; Lindquist, J.L.; Knezevic, S.Z.; Jhala, A.J. Effect of water stress on the growth and fecundity of common waterhemp (Amaranthus rudis). Weed Sci. 2016, 64, 42–52. [Google Scholar] [CrossRef]
- Robinson, T.B.; Martin, N.; Loureiro, T.G.; Matikinca, P.; Robertson, M.P. Double trouble: The implications of climate change for biological invasions. NeoBiota 2020, 62, 463–487. [Google Scholar] [CrossRef]
- Kueffer, C. Plant invasions in the Anthropocene. Science 2017, 358, 724–725. [Google Scholar] [CrossRef] [PubMed]
- Bravo, W.; Leon, R.G.; Ferrell, J.A.; Mulvaney, M.J.; Wood, C.W. Differentiation of life-history traits among Palmer amaranth populations (Amaranthus palmeri) and its relation to cropping systems and glyphosate sensitivity. Weed Sci. 2017, 65, 339–349. [Google Scholar] [CrossRef]
- Cahoon, C.W.; York, A.C.; Jordan, D.L.; Everman, W.J.; Seagroves, R.W.; Culpepper, A.S.; Eure, P.M. Palmer amaranth (Amaranthus palmeri) management in dicamba-resistant cotton. Weed Technol. 2015, 29, 758–770. [Google Scholar] [CrossRef]
- Rockwell-Postel, M.; Laginhas, B.B.; Bradley, B.A. Supporting proactive management in the context of climate change: Prioritizing range-shifting invasive plants based on impact. Biol. Invasions 2020, 22, 2371–2383. [Google Scholar] [CrossRef]
- Tu, W.; Xiong, Q.; Qiu, X.; Zhang, Y. Dynamics of invasive alien plant species in China under climate change scenarios. Ecol. Indic. 2021, 129, 107919. [Google Scholar] [CrossRef]
- Sosnoskie, L.; Webster, T.; Grey, T.; Culpepper, A. Severed stems of Amaranthus palmeri are capable of regrowth and seed production in Gossypium hirsutum. Ann. Appl. Biol. 2014, 165, 147–154. [Google Scholar] [CrossRef]
- Bulletin, E. Amaranthus palmeri S. Watson. Bull. OEPP 2020, 50, 535–542. [Google Scholar]
- Anibaba, Q.A.; Dyderski, M.K.; Jagodziński, A.M. Predicted range shifts of invasive giant hogweed (Heracleum mantegazzianum) in Europe. Sci. Total Environ. 2022, 825, 154053. [Google Scholar] [CrossRef] [PubMed]
- Mosena, A.; Steinlein, T.; Beyschlag, W. Reconstructing the historical spread of non-native plants in the North American West from herbarium specimens. Flora 2018, 242, 45–52. [Google Scholar] [CrossRef]
- Chauvel, B.; Dessaint, F.; Cardinal-Legrand, C.; Bretagnolle, F. The historical spread of Ambrosia artemisiifolia L. in France from herbarium records. J. Biogeogr. 2006, 33, 665–673. [Google Scholar] [CrossRef]
- Rathore, M.K.; Sharma, L.K. Efficacy of species distribution models (SDMs) for ecological realms to ascertain biological conservation and practices. Biodivers. Conserv. 2023, 32, 3053–3087. [Google Scholar] [CrossRef]


| Type | FC | RM | Delta.AICc | Avg.diff.AUC | Mean.OR25 |
|---|---|---|---|---|---|
| default | LQPH | 1 | 16.90 | 0.0065 | 0.076 |
| optimized | PTH | 1.9 | 0 | 0.006 | 0.048 |
| Variable | Percent Contribution (%) | Permutation Importance (%) |
|---|---|---|
| Human footprint | 34.0 | 8.5 |
| Bio_10 | 21.9 | 36.1 |
| Wind_4 | 10.1 | 6.7 |
| Bio_4 | 7.6 | 17.9 |
| T_gravel | 4.5 | 1.8 |
| Bio_8 | 4.1 | 9.2 |
| Current | 2040s SSP126 | 2040s SSP245 | 2040s SSP585 | |
|---|---|---|---|---|
| Unsuitable | 853.2 × 10⁴ km2 | 837.0 × 10⁴ km2 | 837.4 × 10⁴ km2 | 831.4 × 10⁴ km2 |
| Low suitability | 42.5 × 10⁴ km2 | 65.8 × 10⁴ km2 | 68.3 × 10⁴ km2 | 67.8 × 10⁴ km2 |
| Medium suitability | 42.9 × 10⁴ km2 | 34.7 × 10⁴ km2 | 32.5 × 10⁴ km2 | 37.4 × 10⁴ km2 |
| High suitability | 21.3 × 10⁴ km2 | 22.5 × 10⁴ km2 | 21.8 × 10⁴ km2 | 23.5 × 10⁴ km2 |
| 2060s SSP126 | 2060s SSP245 | 2060s SSP5.8 | |
|---|---|---|---|
| Unsuitable | 821.1 × 10⁴ km2 | 815.9 × 10⁴ km2 | 818.0 × 10⁴ km2 |
| Low suitability | 76.6 × 10⁴ km2 | 80.0 × 10⁴ km2 | 78.2 × 10⁴ km2 |
| Medium suitability | 36.6 × 10⁴ km2 | 40.0 × 10⁴ km2 | 36.5 × 10⁴ km2 |
| High suitability | 25.7 × 10⁴ km2 | 24.3 × 10⁴ km2 | 27.3 × 10⁴ km2 |
| 2040-2.6 | 2040-4.5 | 2040-5.8 | 2060-2.6 | 2060-4.5 | 2060-5.8 | |
|---|---|---|---|---|---|---|
| Increased | 26.7 × 10⁴ km2 | 30.5 × 10⁴ km2 | 33.8 × 10⁴ km2 | 44.5 × 10⁴ km2 | 51.6 × 10⁴ km2 | 53.6 × 10⁴ km2 |
| served | 98.7 × 10⁴ km2 | 92.2 × 10⁴ km2 | 94.8 × 10⁴ km2 | 94.4 × 10⁴ km2 | 92.5 × 10⁴ km2 | 88.3 × 10⁴ km2 |
| Lost | 10.9 × 10⁴ km2 | 14.6 × 10⁴ km2 | 12.0 × 10⁴ km2 | 12.4 × 10⁴ km2 | 14.3 × 10⁴ km2 | 18.4 × 10⁴ km2 |
Disclaimer/Publisher’s Note: The statements, opinions and data contained in all publications are solely those of the individual author(s) and contributor(s) and not of MDPI and/or the editor(s). MDPI and/or the editor(s) disclaim responsibility for any injury to people or property resulting from any ideas, methods, instructions or products referred to in the content. |
© 2023 by the authors. Licensee MDPI, Basel, Switzerland. This article is an open access article distributed under the terms and conditions of the Creative Commons Attribution (CC BY) license (https://creativecommons.org/licenses/by/4.0/).
Share and Cite
Jiao, X.; Long, M.; Li, J.; Yang, Q.; Liu, Z. Reconstructing the Invasive History and Potential Distribution Prediction of Amaranthus palmeri in China. Agronomy 2023, 13, 2498. https://doi.org/10.3390/agronomy13102498
Jiao X, Long M, Li J, Yang Q, Liu Z. Reconstructing the Invasive History and Potential Distribution Prediction of Amaranthus palmeri in China. Agronomy. 2023; 13(10):2498. https://doi.org/10.3390/agronomy13102498
Chicago/Turabian StyleJiao, Xinyu, Mei Long, Jiayi Li, Qingyu Yang, and Zhixiong Liu. 2023. "Reconstructing the Invasive History and Potential Distribution Prediction of Amaranthus palmeri in China" Agronomy 13, no. 10: 2498. https://doi.org/10.3390/agronomy13102498