Article

Reduction in N2O Emissions and Improvement in Nitrifier and Denitrifier Communities through Bamboo-Biochar-Based Fertilization in Pomelo Orchard Soil

Institute of Soil and Fertilizer, Fujian Academy of Agricultural Sciences, Fuzhou 350013, China
*
Author to whom correspondence should be addressed.
Agronomy 2023, 13(10), 2504; https://doi.org/10.3390/agronomy13102504
Submission received: 21 August 2023 / Revised: 21 September 2023 / Accepted: 22 September 2023 / Published: 28 September 2023

Abstract

:
Farmland soil is an important source of the greenhouse gas nitrous oxide (N2O), and soil nitrification and denitrification are key processes affecting N2O production. In this study, the acidic soil of a pomelo orchard was used to investigate the effects of a bamboo-biochar-based fertilizer (BB) on soil N2O emissions and nitrifier and denitrifier communities. In this study, five treatments, namely, CK (no urea and BB), N (0.72 g·kg−1 urea), 5BB+N (0.72 g·kg−1 urea plus 5 g·kg−1 BB), 10BB+N (0.72 g·kg−1 urea plus 10 g·kg−1 BB), and 20BB+N (0.72 g·kg−1 urea plus 20 g·kg−1 BB) were applied to the acidic soil of a pomelo orchard. The nitrification (AOA-amoA, AOB-amoA) and denitrification (nirS, nirK, nosZ) gene copy numbers were analyzed by qPCR, and their community diversities were determined by Illumina MiSeq sequencing. The results showed that N treatment significantly promoted soil N2O emissions compared with CK, while all BB+N treatments significantly inhibited soil N2O emissions compared with N treatment. BB fertilizer promoted soil nitrification, alleviated the adverse effects from N fertilizer inputs on the AOA-amoA gene copy numbers and community diversity, and restored the AOA-amoA diversity to the initial level. BB had a strong effect on Crenarchaeota (AOA-amoA) and Nitrosospira (AOB-amoA). BB significantly promoted the denitrification gene copy numbers; increased nirS and nirK community diversity; particularly affected the relative abundance of denitrifiers such as Nonomuraea (nirS), Proteobacteria (nirK), and Rhodanobacter (nosZ); and, finally, reduced N2O emissions.

1. Introduction

Guanxi pomelo is one of the main varieties of pomelo in China and has a high nutritional value [1]. Its native place is Pinghe County, Fujian Province, covering a pomelo cultivation area of 5.70 × 10⁴ ha, with an annual output of 2.66 × 10⁵ t, and ranking first in China [2]. The Guanxi pomelo planting area and yields have increased yearly, accompanied by continuous increases in nitrogen (N) application. Excessive N fertilizer inputs cause soil compaction and acidification and endanger crop health and the ecological environment [3] due to low N use efficiency and high N2O emissions [4], ultimately threatening the sustainable development of an orchard.
The global warming potential (GWP) of N2O, an important greenhouse gas, is 265 times that of CO2 [5]. Farmland soil is an important global source of N2O emissions and takes up 90% of the total N2O released into the atmosphere by the biosphere [6]. In addition, approximately 1.50 × 10⁶ t N2O-N is produced because of N fertilization every year, accounting for 44% of the total N2O-N released into the environment based on human activities [7]. Nitrification and denitrification are the most important approaches that produce N2O in the soil [8]. The production of N2O by nitrification mainly occurs during the first stage (the ammonia oxidation stage), which is regulated by ammonia monooxygenase (AMO) controlled by the amoA functional gene. Ammonia-oxidizing microbes mainly include ammonia-oxidizing archaea (AOA) and ammonia-oxidizing bacteria (AOB) [9]. Nitrite reduction is the limiting-velocity step for denitrification, which is mainly regulated by nitrite reductase (Nir) controlled by the nirS and nirK functional genes [10]. N2O reductase (Nos) is mainly controlled by the nosZ functional gene, whose expression determines the completion of the process of denitrification [11].
Nitrogen availability is an important element affecting soil N2O emissions. N fertilizers can significantly increase the concentration of inorganic N in soils and, consequently, improve the intensity of nitrification and denitrification, promoting N2O production and emission in soils [12,13]. Long et al. [14] indicated that a single application of N fertilizer could increase N2O emissions and the AOB-amoA copy numbers in grasslands. Chen et al. [15] indicated that urea could increase the copy numbers of nirS in red soil but had no significant influence on the nirS community. Wang et al. [16] found that long-term N application had significant impacts on the nosZ gene copy numbers and community. Most previous studies were limited to corn fields [17] and paddy soils [16], where the N application amounts were not high. However, few studies paid attention to N2O emissions from pomelo orchards that apply a high amount of N fertilizer.
As a key bamboo-producing area in China, Fujian Province is rich in bamboo resources, with an area of 1.08 × 10⁶ ha of bamboo forest and a bamboo industry output value of over CNY 60 billion [18]. Bamboo has a short growth cycle and shows a high yield and fast growth [19]. Bamboo biochar is generated from the pyrolytic carbonization of bamboo under a high-temperature anoxic condition. Bamboo biochar is readily produced from available resources and has several good characteristics such as a high porosity, a large surface area, a good adsorption capacity, a long service life, rich mineral nutrients, and little environmental pollution. Bamboo biochar used as a soil amendment can augment the utilization efficiency of N fertilizers and reduce the use of inorganic fertilizers, thus representing a good farmland-management measure [20]. He et al. [21] found that bamboo biochar could reduce N2O emissions by 1.25–8.72%, which was mainly related to the denitrification genes (nirS, nirK, nosZ). Guo et al. [22] pointed out that bamboo biochar reduced N2O emissions by 44.83%, mainly by affecting the nirK gene copy numbers. However, in incubation experiments, Sean et al. [23] showed that a 1% bamboo biochar addition did not significantly affect soil N2O emissions, which may be due to the low application amount of bamboo biochar. The costs of labor and transport are high for bamboo biochar application because of the high use amounts, limiting the wide use of bamboo biochar in agricultural production. To avoid this drawback of biochar, a new type of fertilizer, a biochar-based fertilizer based on biochar as the matrix, was developed. Nitrogen, phosphorus, potassium, and several other nutrients were added to the biochar through physical or chemical methods to make a biochar-based fertilizer [24]. However, the effects of bamboo-biochar-based fertilizers on soil N2O emissions are still not clear.
To explore N2O emissions and their potential microbial mechanisms in the highly acidic soil of a pomelo orchard after the application of bamboo-biochar-based fertilizer (BB) and urea, the advanced and applicable techniques (qPCR and high-throughput sequencing) were used to investigate the functional microbial communities involved in N2O transformation based on the N2O transformation genes and microbial community structure. Soil chemical parameters, including pH, carbon and nitrogen concentration, and ammonium and nitrate concentration, were analyzed to provide further information on the nitrogen conversion process. A quantitative real-time polymerase chain reaction (qPCR) and high-throughput sequencing were also used to evaluate the functional gene copy numbers and microbial diversities associated with nitrification and denitrification.

2. Materials and Methods

2.1. Soil Sampling

We collected soil samples (0–30 cm) from a pomelo orchard (24°20′ N, 117°17′ E) in Chankeng Village, Pinghe County, Fujian Province. The soil type was silica–aluminum red soil with texture of clay loam. The soil was air-dried and passed through 2 mm sieve to remove coarse material. Soil properties were as follows: pH 4.38, total carbon 18.56 g·kg−1, total nitrogen 1.63 g·kg−1, alkali-hydrolyzed nitrogen 0.12 g·kg−1, available potassium 0.14 g·kg−1, ammonium 0.03 g·kg−1, and nitrate nitrogen 0.01 g·kg−1.

2.2. Biochar-Based Fertilizer

Bamboo was used as the raw material. It was dried, crushed, and passed through a sieve with 2 mm mesh, and then the biochar was cracked by oxygen at 450 °C and passed through a sieve with 0.15 mm mesh. The biochar was blended with shell powder, dolomite powder, and potassium sulfate using a blender in 25%, 30%, 35%, and 10% proportions, respectively, then passed through a sieve with 0.25 mm mesh, sealed, and stored for later use. The bamboo-biochar-based fertilizer (BB) properties are as follows: pH 9.53, total phosphorus 0.02 g·kg−1, total potassium 0.98 g·kg−1, CaO 1.83 g·kg−1, and MgO 0.54 g·kg−1.

2.3. Experimental Design

There were 5 treatments: CK (no urea and BB), N (0.72 g·kg−1 urea), 5BB+N (0.72 g·kg−1 urea plus 5 g·kg−1 BB), 10BB+N (0.72 g·kg−1 urea plus 10 g·kg−1 BB), and 20BB+N (0.72 g·kg−1 urea plus 20 g·kg−1 BB). Each treatment was repeated 3 times.
One hundred grams of air-dried soil samples that were put through a sieve with 2 mm mesh were weighed, and corresponding amounts of urea and BB were added according to the concentrations described above. The soil was stirred, mixed, and placed in 300 mL incubation bottles. The soil water content was adjusted to 60% of the maximum water-holding capacity by a weighing method, and the mouths of the incubation bottles were sealed with Parafilm sealing film to lessen water loss. The incubation temperature was set to 25 °C, and the soil water content was kept constant by monitoring the weight and adding water every 3 days. The incubation period was 60 days.

2.4. Sampling and Measurements

Soil samples were destructively collected at 0, 7, 15, 30, and 60 days after the application of various fertilizers, and some of them were used to determine soil NH4+-N, NO3-N, pH, C/N, dissolved organic carbon (DOC), and dissolved organic nitrogen (DON). The concentration of NH4+-N was analyzed by indophenol blue colorimetry, the concentration of NO3-N was analyzed by UV spectrophotometry, the pH was determined by an electrode method (soil and water ratio of 2.5:1), the C/N ratio was determined by an elemental analyzer, and the DOC and DON were determined by a TOC automatic analyzer (Shimadzu, Shimadzu TOC-L, Kyoto, Japan) [25]. The remaining samples were stored at −80 °C for subsequent DNA extraction.
At 1, 2, 3, 5, 7, 10, 14, 20, 25, 30, 40, 50, and 60 days after the application of various fertilizers, the gas samples in the incubation bottles were collected by syringe. Before samples were collected, the bottles were ventilated for half an hour, immediately covered with a rubber stopper, sealed with a sealing film, and incubated for one hour. For each determination, 20 mL gas samples were transferred to pre-vacuumed cylinders using syringes and three-way valves. The N2O gas concentration was measured by a Shimadzu gas chromatograph (Shimadzu, Shimadzu 2010 Pro, Kyoto, Japan).

2.5. Gas Flux Measurements

The following Equation [26] was used to calculate N2O emissions:
F = ρ × V × C t × 273 273 + T × 1 w
where F represents the rate of N2O emissions (μg·kg−1·h−1), ρ represents the thickness of N2O based on normal conditions, V represents the volume (m3), ΔCt represents the change in gas concentration per unit time (ppb h−1), T represents air temperature (°C) in chamber, and W represents the dried soil weight (kg).
The cumulative N2O emissions were calculated as follows [27]:
M = F i + F i + 1 2 × t i + 1 t i × 24
where M represents the cumulative N2O emissions (μg·kg−1), F represents the rate of N2O emissions (μg·kg−1·h−1), i represents the sampling time, and ti+1ti represents the sampling interval days.

2.6. DNA Extraction

Total DNA was extracted from soils in line with the instructions of the E.Z.N.A.® soil DNA kit (Omega Bio-Tek, Norcross, GA, USA). The size and concentration of the total DNA fragments were perceived by agarose gel electrophoresis and ultraviolet spectrophotometry (ND-1000, NanoDrop Technologies, Wilmington, DE, USA). The samples were compartmentalized and stored in a refrigerator at −20 °C for subsequent analysis.

2.7. Quantitative PCR Assay

The copy numbers of five functional genes were determined by the SYBR Green I method. Quantitative PCR was performed using a Thermofisher ABI 7500 StepOne Plus (Foster City, CA, USA). The reaction system for fluorescence quantitative PCR consisted of 20 μL, which included 10 μL 2× Taq Plus Master Mix (P211-02) (LMAl Bio, Shanghai, China), 5 μmol/L forward and reverse primers (0.8 μL each), and 1 μL DNA template, and the rest was supplemented with ddH2O to 20 μL [28]. The specific PCR amplification primers and reaction conditions are shown in Table 1.

2.8. Sequencing

PCR products from the same sample were blended and retrieved from a 2% agarose gel. The recovered products were purified by an AxyPrep DNA Gel Extraction Kit (Axygen Biosciences, Union City, CA, USA) and detected by 2% agarose gel electrophoresis and quantified by a Quantus fluorometer (Promega, Madison, WI, USA). Then, according to the sequencing volume requirements of each sample, the corresponding proportions were mixed to keep the DNA concentration of the samples used for sequencing in each treatment consistent. An Illumina MiSeq sequencing platform was used for double-terminal sequencing, and Shanghai Majorbio Biotechnology Technology Co., Ltd. (Shanghai, China) was commissioned to completed the sequencing work for this experiment.

2.9. Statistical Analyses

Microsoft Office Excel 2007 (v. 12.0.6612.1000) was used for data processing, Origin 2018 was used for mapping, and IBM SPSS Statistics 26 (v. 26.0) was used for statistical analysis. One-way ANOVA and LSD were used to compare the significance of differences among different treatments (p < 0.05). Pearson’s correlation analysis was used to analyze the correlation and significance between soil ammonium nitrogen, nitrate nitrogen, pH, C/N, DOC, DON, soil gene copy numbers, and N2O emissions. To compare the variations of different communities under different fertilization regimes, heatmap analysis was performed using MetaboAnalyst 3.0.

3. Results

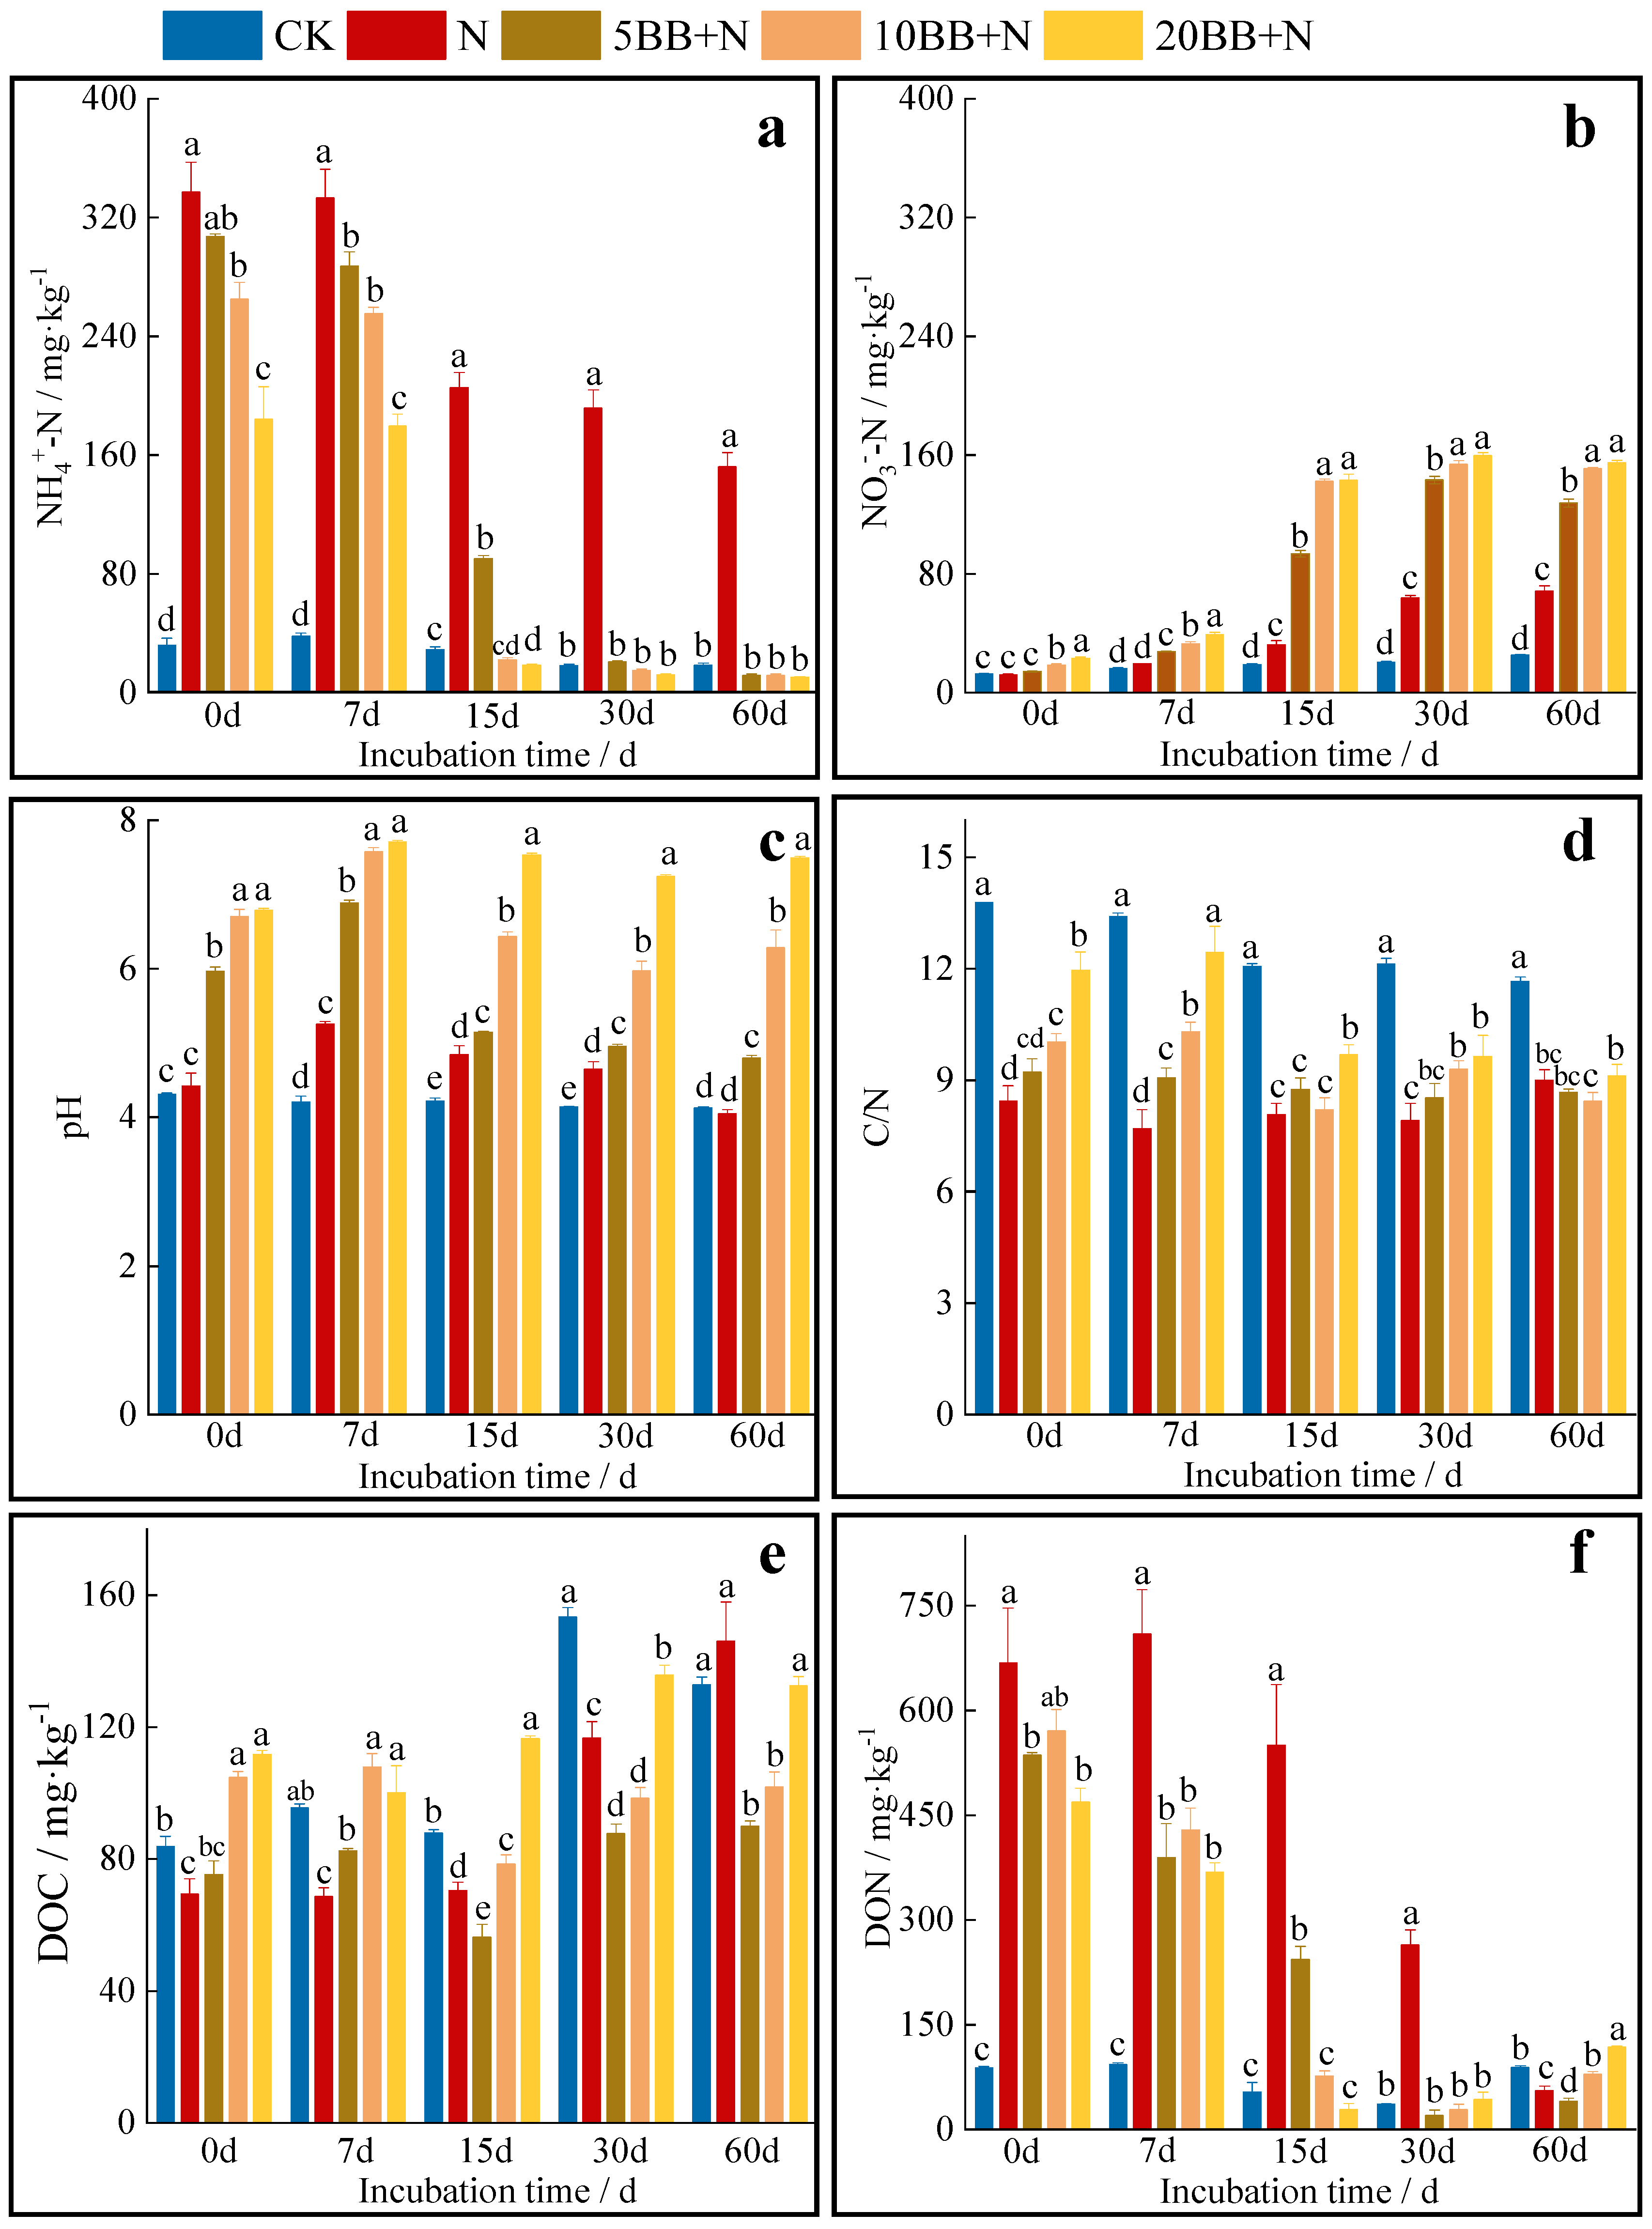
3.1. Soil Chemical Properties
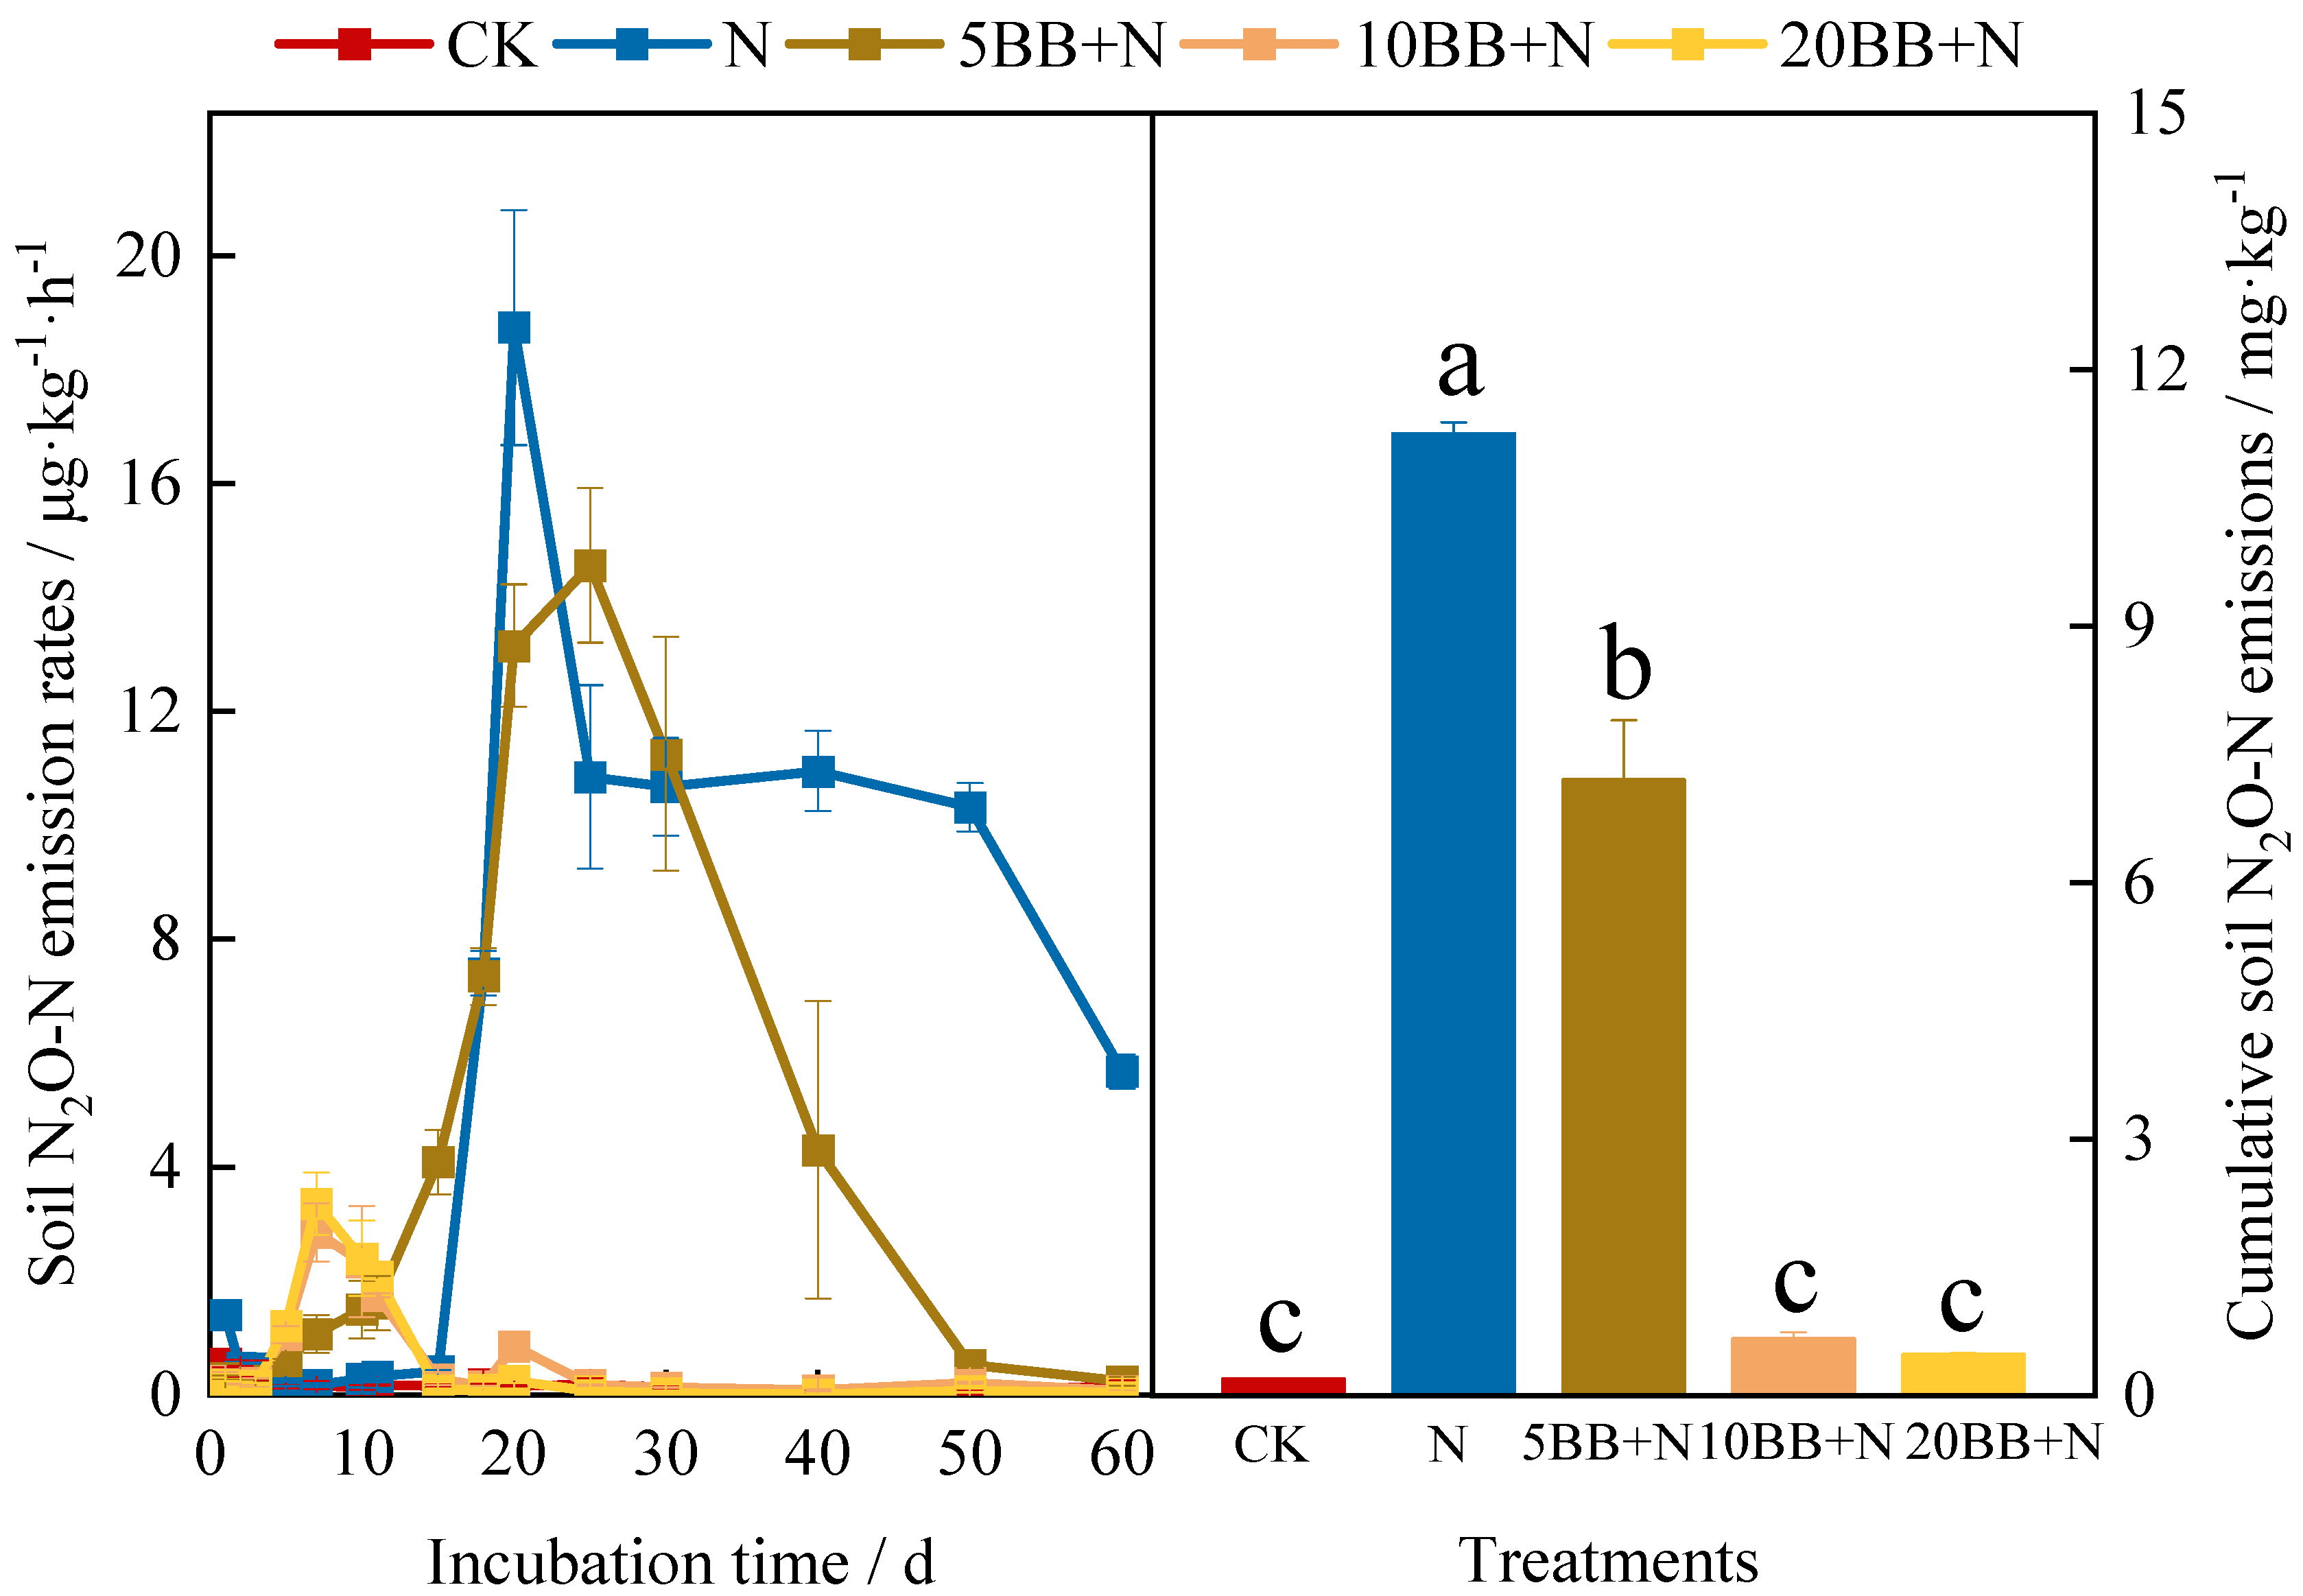
With the increase in BB, the soil NH4+-N concentration showed a decreasing trend, while the soil NO3-N, pH, C/N, DOC, and DON concentrations showed an increasing trend (Figure 1). At the end of the experiment, compared with CK, the NH4+-N, NO3-N, and DOC concentrations under N treatment were significantly increased by 8.14-, 2.72-, and 1.10-fold, respectively, and C/N and DON were significantly decreased by 22.85% and 36.99%, respectively (p < 0.05). In contrast with N treatment, BB significantly reduced NH4+-N and DOC concentrations by 92.36–93.09% and 9.21–38.42%, respectively, and increased NO3-N and pH by 1.87–2.26 and 1.19–1.85 times, respectively (p < 0.05). These results manifested that BB could promote soil nitrification, increase soil pH, and reduce soil DOC concentration.

3.2. N2O Emissions

The changes in N2O emissions under different treatments showed a similar trend: they increased first and decreased after a period of time (Figure 2a). On the 20th day after fertilization, N treatment showed the highest N2O emissions (18.74 μg·kg−1·h−1), and the N2O emissions of 5BB+N, 10BB+N, and 20BB+N were 13.15, 0.86, and 0.25 μg·kg−1·h−1, respectively. Further analysis of the cumulative N2O emissions (Figure 2b) revealed that compared with CK, the cumulative emissions of N2O in N increased by 57.47 times. Compared with N treatment, the cumulative N2O emissions of BB significantly decreased (p < 0.05). With an increase in BB application, the cumulative N2O emissions showed a decreasing trend, and the order was 5BB+N > 10BB+N > 20BB+N. These results clearly indicated that the application of BB had a remarkably positive impact on reducing the N2O emissions of the acidic soil of the pomelo orchard.

3.3. Soil Gene Copy Numbers of Nitrification and Denitrification

The copy numbers of AOA-amoA in the soil of each treatment at the end of the experiment were significantly greater than those of AOB-amoA (p < 0.05) (Figure 3a,b). Compared with CK, the gene copy numbers of AOA-amoA were significantly reduced by 99.99% under N treatment, and the gene copy numbers of AOB-amoA were not significantly different between CK and N. Compared with N treatment, the gene copy numbers of AOA-amoA and AOB-amoA under BB were significantly increased, and with increasing BB application amounts, the gene copy numbers of AOA-amoA and AOB-amoA were also improved. These results indicated that BB could promote the growth of both AOA and AOB in the acidic soil of the pomelo orchard.
At the completion of incubation, the copy numbers of the nosZ gene were significantly greater than those of nirK and nirS (p < 0.05) (Figure 3c–e). Compared with CK, the nirS gene copy numbers were significantly reduced by 94.24% under N treatment, while the nirK and nosZ gene copy numbers were not significantly different. Compared with N treatment, the gene copy numbers of nirS, nirK, and nosZ under BB significantly improved, and, as the application of BB increased, the gene copy numbers of three genes changed differently.

3.4. α Diversity of Nitrification and Denitrification Genes

Fifteen soil samples were filtered by QIIME, and 575,555 high-quality AOA-amoA sequences, 479,053 high-quality AOB-amoA sequences, 263,265 high-quality nirS sequences, 226,512 high-quality nirK sequences, and 180,567 high-quality nosZ sequences were obtained. The lowest sequence number was flattened, and OTUs were clustered according to 97% similarity. Table 2 shows the α-diversity indices of soil microorganisms. In this study, 0.98 was the coverage of each sample, indicating that the results of gene sequencing were close to the real microbial community structure. Analysis of the diversity index of each treatment showed that compared with CK, the Shannon index of AOA-amoA dramatically dropped under N treatment, the Simpson index significantly increased (p < 0.05), and there was no significant variation in AOB-amoA; the Shannon index of nirS dramatically dropped (p < 0.05), and the Simpson index had no significant difference; the Shannon index of nirK and nosZ significantly rose, and the Simpson index significantly reduced (p < 0.05). Compared with N treatment, the Shannon index of AOA-amoA under BB was dramatically increased, and the Simpson index was dramatically reduced (p < 0.05). Increasing the application amounts of BB, the diversity of AOA-amoA displayed a rising tendency, and the expression was in the order of 5BB+N > 10BB+N > 20BB+N. The diversity index of AOB-amoA had no significant variation under BB. The Shannon index of nirS under BB was dramatically improved (p < 0.05), and the diversity of nirS decreased with increasing BB application. Increasing the application of BB, the diversity of nirK and nosZ showed an increasing trend, with expression in the order of 20BB+N > 10BB+N > 5BB+N.

3.5. Compositions of Nitrification and Denitrification Genes

The microbial species of AOA-amoA were obtained by high-throughput sequencing, showing one phylum, five classes, five orders, five families, five genera, and eight species. Figure 4a showed the composition of the community structure at the genera level for AOA-amoA in soils under different treatments. Other than unidentified genera, the community of AOA-amoA was dominated by Crenarchaeota, and the relative abundance ranged from 0% to 3.61%. Compared with CK, N treatment decreased the relative abundance of Crenarchaeota. Compared with N treatment, the relative abundance of Crenarchaeota under BB rose, and the order was 20BB+N > 10BB+N > 5BB+N. Therefore, at the genus level, the AOA-amoA community composition was significantly affected by urea application and was effectively restored by BB application.
The microbial species of AOB-amoA covered a total of two phyla, three classes, four orders, four families, seven genera, and 12 species. Nitrosospira (96.71–100%) was the dominant genera for the different treatments (Figure 4b). Compared with CK, N treatment increased the relative abundance of Nitrosospira. Compared with N treatment, the relative abundance of Nitrosospira under BB decreased in the order of 5BB+N > 10BB+N > 20BB+N. Therefore, at the genus level, urea application promoted the growth of Nitrosospira in the AOB-amoA community, and BB application alleviated the promotion effect.
The microbial species of nirS covered a total of nine phyla, 12 classes, 20 orders, 21 families, 25 genera, and 35 species. Other than unidentified genera, the nirS community was dominated by Nonomuraea and Halomonas, with relative abundances of 0–2.30% and 0–0.71%, respectively (Figure 4c). Compared with CK, the relative abundance of Nonomuraea decreased under N treatment. Compared with N treatment, the relative abundance of Nonomuraea increased under BB in the order of 5BB+N > 10BB+N > 20BB+N.
The microbial species of nirK covered a total of four phyla, six classes, eight orders, 10 families, 15 genera, and 18 species. In addition to unidentified genera, Proteobacteria, Rhizobiaceae and Bosea were the main species, with relative abundances of 0.31–73.68%, 0–38.31%, and 0–4.09%, respectively (Figure 4d). Compared with CK, the relative abundance of Proteobacteria increased under N treatment. Compared with N treatment, the relative abundance of Proteobacteria under BB decreased in the order of 20BB+N > 10BB+N > 5BB+N.
The microbial species of nosZ covered a total of three phyla, five classes, six orders, 11 families, 11 genera, and 16 species. Unidentified genera dominated among nosZ, with a relative abundance of 82.82–98.08%. In addition to these genera, Rhodanobacter, Herbaspirillum, Microvirga, and Pleomorphomonas had relative abundances of 0.7–17.17%, 0–1.61%, 0–1.79%, and 0–0.75%, respectively (Figure 4e). Compared with CK, the relative abundance of Rhodanobacter increased under N treatment. Compared with N treatment, BB reduced the relative abundance of Rhodanobacter, and the expression was in the order of 5BB+N > 10BB+N > 20BB+N.

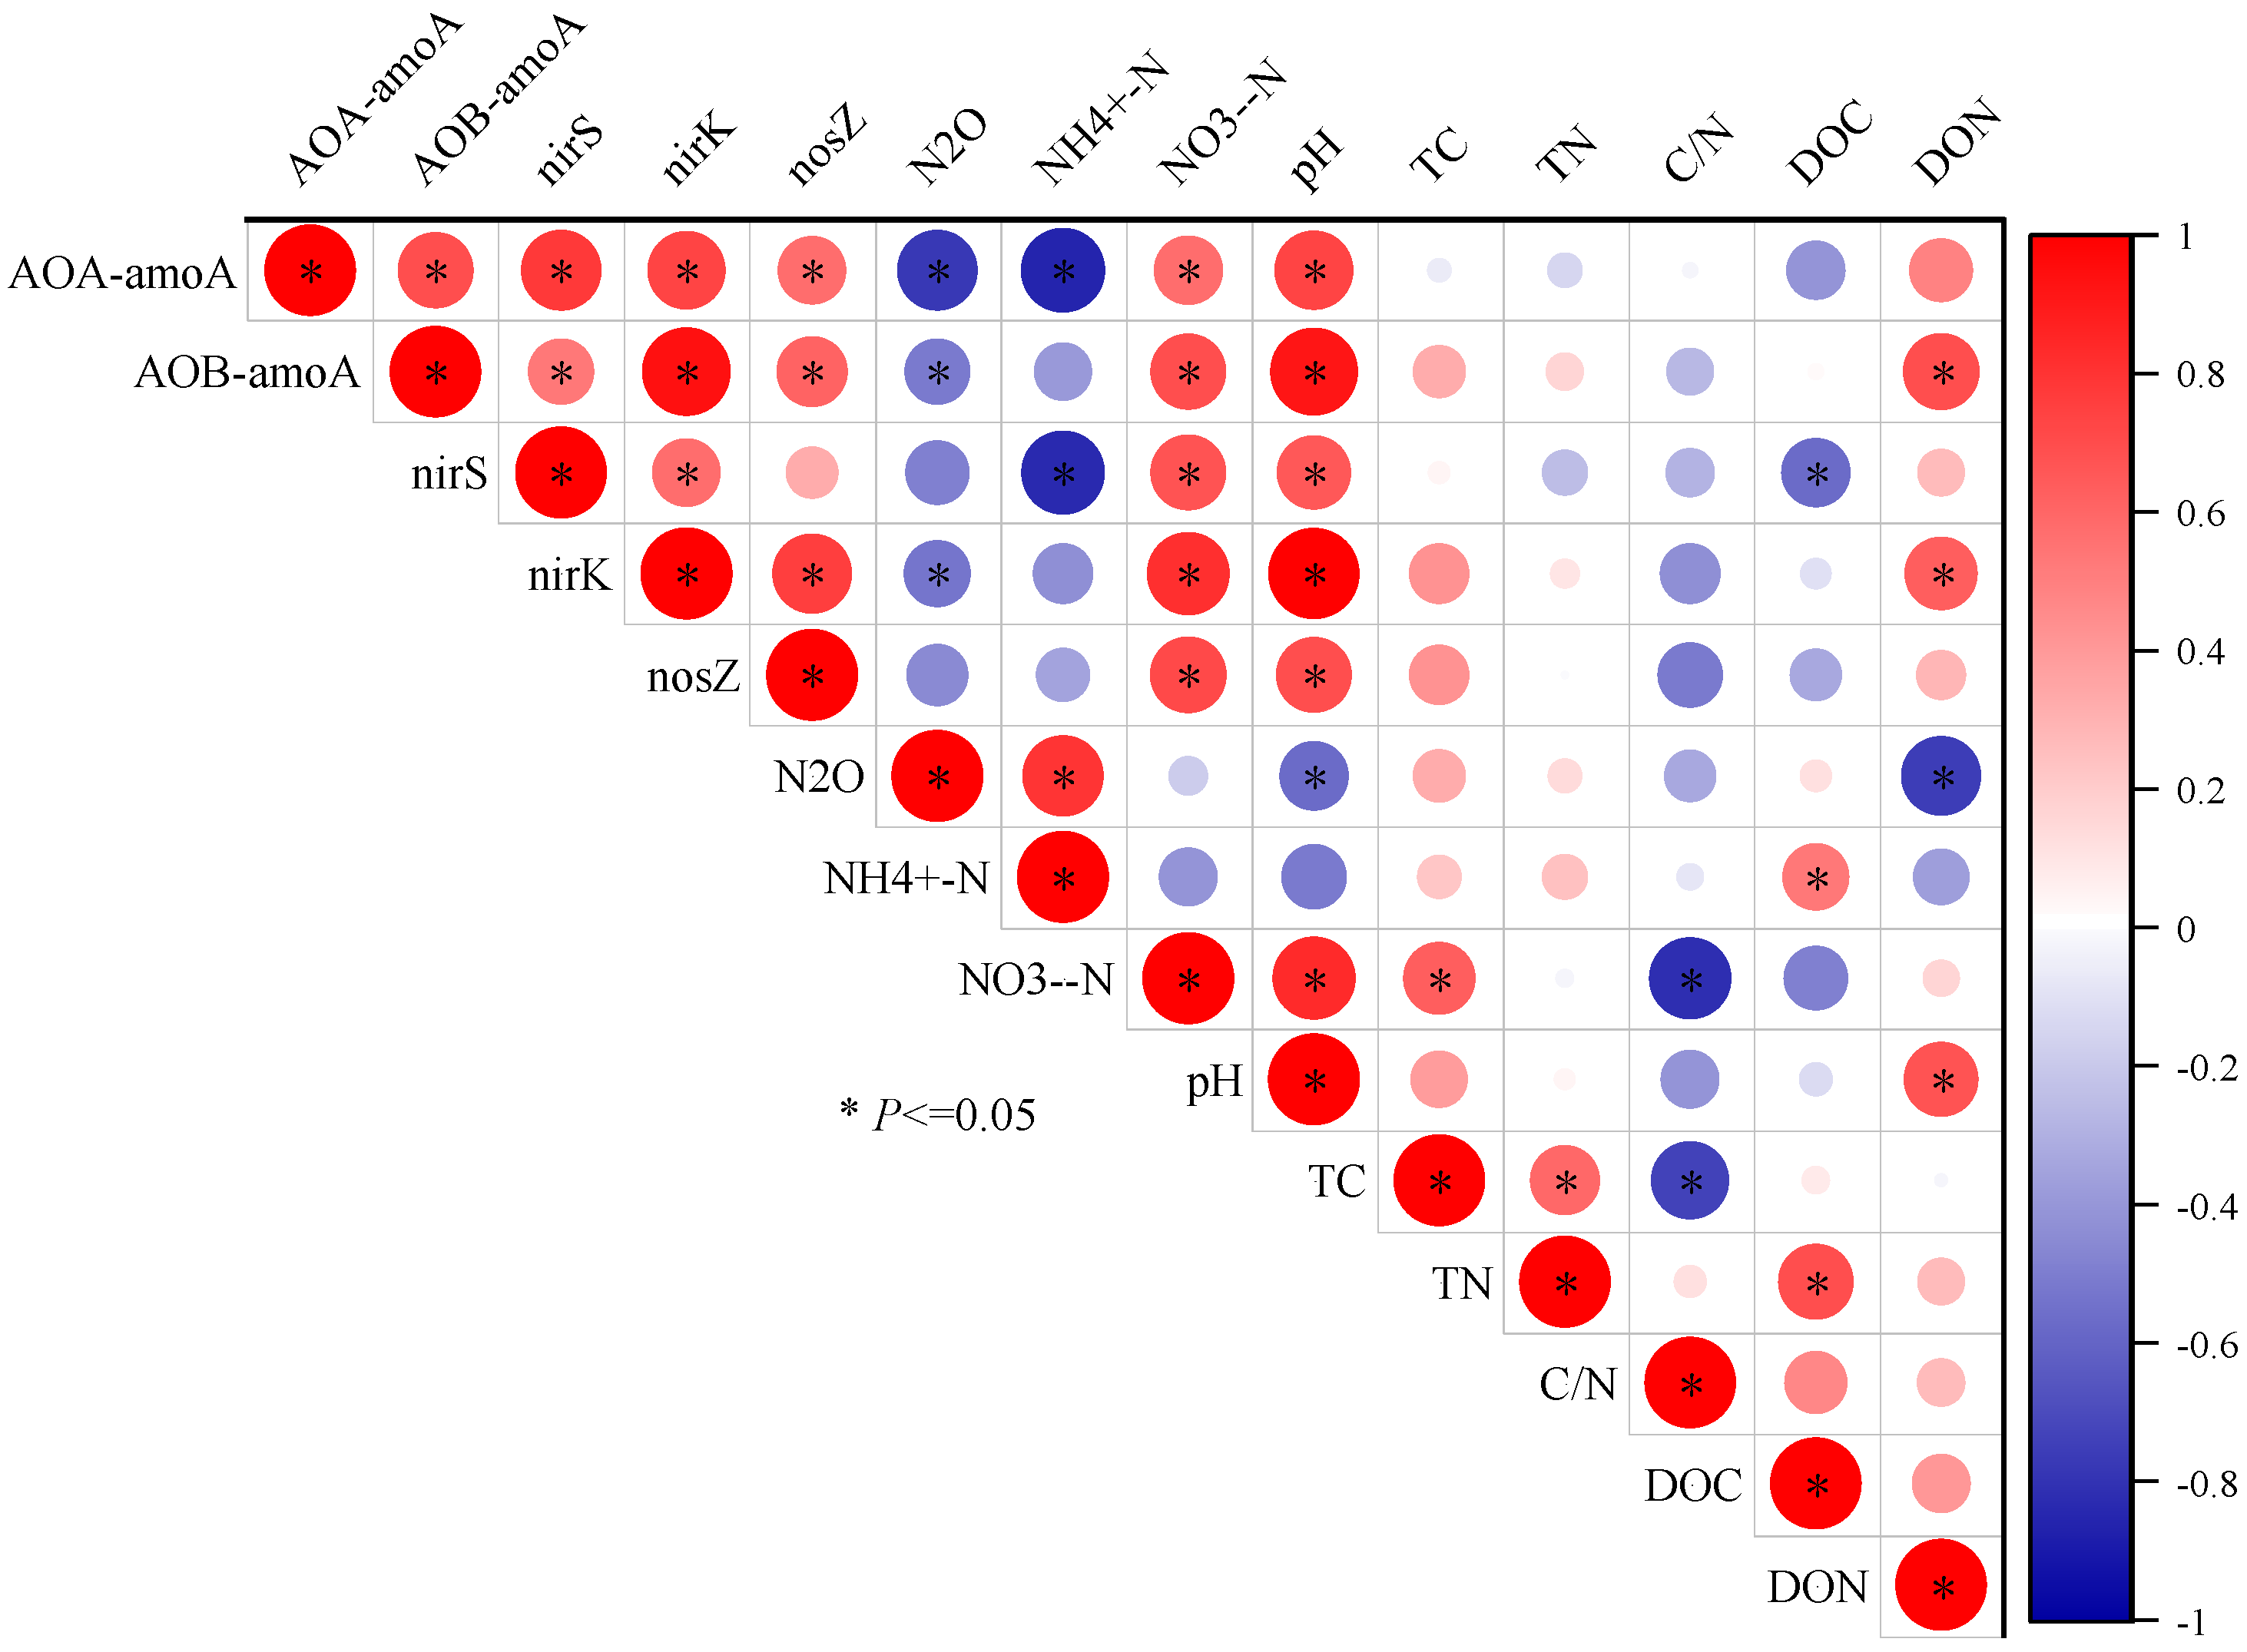
3.6. Correlation of Nitrification and Denitrification Gene Copy Numbers with Soil Chemical Properties and N2O Emissions

The correlations among the soil chemical properties, N2O emissions, and nitrifier and denitrifier gene copy numbers under each treatment are shown in Figure 5. Soil N2O emissions were negatively and significantly correlated with the gene copy numbers of AOA-amoA, AOB-amoA, and nirK by correlation analysis. NH4+-N was negatively and significantly correlated with the gene copy numbers of AOA-amoA and nirS. NO3-N and pH were positively and significantly correlated with the gene copy numbers of five functional genes. There was a negative significant correlation between DOC and the gene copy numbers of nirS, and there was a positive significant correlation between DON and the gene copy numbers of AOB-amoA and nirK (p < 0.05). There were no significant correlations between TC, TN, C/N, and the copy numbers of each functional gene.

3.7. Correlations between Environmental Factors and the Communities of Nitrification and Denitrification Genes

At the genus level, this study aimed to analyze the correlations among N2O emissions, soil chemical properties, and the community composition of five nitrifiers and denitrifiers by heatmaps (Figure 6). Thus, the relationship between Crenarchaeota (AOA-amoA) and soil NH4+-N (r = −0.638, p < 0.05) and N2O emissions (r = −0.741, p < 0.01) showed a significant negative correlation. The relationship between Crenarchaeota and soil NO3-N (r = 0.538, p < 0.05), pH (r = 0.743, p < 0.01), and DON (r = 0.782, p < 0.001) showed a significant positive correlation (Figure 6a).
Nitrosomonadaceae (AOB-amoA) and NH4+-N (r = −0.603, p < 0.05) had a significant negative correlation, and Nitrosospira and N2O emissions (r = 0.691, p < 0.01) showed a significant positive correlation (Figure 6b).
Halomonas (nirS), NH4+-N (r = −0.900, p < 0.01), and DOC (r = −0.900, p < 0.01) indicated a significant negative correlation. Bradyrhizobium and C/N (r = −0.949, p < 0.05), NH4+-N (r = −0.932, p < 0.05), and DOC (r = −0.951, p < 0.05) showed a significant negative correlation. Sphingomonas and C/N (r = −0.894, p < 0.05), NH4+-N (r = −0.889, p < 0.05), and DOC (r = −0.891, p < 0.05) had a significant negative correlation. Burkholderiaceae and C/N (r = −0.886, p < 0.05), NH4+-N (r = −0.901, p < 0.05), and DOC (r = −0.817, p < 0.05) had a significant negative correlation. Mycobacterium and C/N (r = −0.887, p < 0.05), NH4+-N (r = −0.885, p < 0.05), and DOC (r = −0.890, p < 0.05) had a significant negative correlation (Figure 6c).
Proteobacteria (nirK), NH4+-N (r = 0.901, p < 0.05), and DOC (r = 0.900, p < 0.05) showed a significant positive correlation. Rhizobiaceae and pH (r = 0.975, p < 0.01) and NO3-N (r = 0.977, p < 0.01) showed a significant positive correlation. Rhizobiales and pH (r = 0.900, p < 0.05) had a significant positive correlation. Achromobacter and pH (r = 0.894, p < 0.05) and NO3-N (r = 0.899, p < 0.05) showed a significant positive correlation (Figure 6d).
Rhodanobacter (nosZ) and pH (r = −0.901, p < 0.05) had a significant negative correlation. Mesorhizobium and pH (r = 0.900, p < 0.05) had a significant positive correlation. Microvirga and pH (r = 0.951, p < 0.001) and NO3-N (r = 0.900, p < 0.05) had a significant positive correlation. Pleomorphomonas and pH (r = 0.975, p < 0.01) and NO3-N (r = 0.963, p < 0.01) had a significant positive correlation. Herbaspirillum and C/N (r = −0.564, p < 0.01), NH4+-N (r = −0.551, p < 0.01), and DOC (r = −0.532, p < 0.01) had a significant negative correlation (Figure 6e).

4. Discussion

4.1. Response of Soil N2O Emissions to Bamboo-Biochar-Based Fertilizer and Urea

N2O emission is an important pathway for gaseous nitrogen loss from soils. This study revealed that urea application alone significantly promoted soil N2O emissions. The factors controlling soil N2O emissions include soil nitrogen concentration, nitrogen-transforming functional microorganisms, appropriate soil temperature, and soil aeration performance [32,33,34,35]. The effect of N fertilizer application on N2O emissions was significant and was also verified in this study. Compared with CK, the cumulative N2O emissions under N treatment were increased by 57.47 times (p < 0.05). This was because N2O was mainly produced during the nitrification and denitrification processes, which are enzymatic reactions, and the reaction rate was positively correlated with the substrate concentration [36]. Since the amount of nitrogen fertilization addition was much higher in the orchards than in vegetable, rice, and other fields, the urea hydrolysis rate of NH4+-N and the concentration of NO3-N were also correspondingly higher in the orchards, which provided abundant substrates for the processes of soil nitrification and denitrification and promoted nitrifying and denitrifying microbes’ activity, thus promoting N2O emissions [37].
In contrast with the conventional nitrogen application, the combined application of BB with urea significantly reduced soil N2O emissions, and the reduction effect was more remarkable under a higher BB application. The chemical properties (pH,NH4+-N, NO3-N, C/N) and biological processes (nitrogen transformation, etc.) of the soil changed after BB application [38,39]. The reducing effect of BB on N2O emissions was closely related to the process of N2O production because soil N2O production mainly occurred during the denitrification process [40]. BB promoted the complete denitrification process in soils, which induced the reduction of N2O to N2, thus reducing the emission of N2O [41]. The reasons are as follows. First, biochar was present under BB, which is a good electron conductor and shuttles electrons, causing electrons to transfer to soil denitrification microorganisms, thus inducing the process of complete denitrification [42]. Second, the pomelo orchard soils aggregated, reducing the void ratio of the sand or clay, so the biochar surface could absorb moisture to improve soil permeability. Therefore, the biochar-added soil retained more moisture and provided sites for anaerobic denitrification, influencing the denitrification process in soils and influencing N2O emissions. In this study, the NO3-N concentration under BB was significantly greater than that under N treatment (Figure 1b), and the NO3-N concentration and the gene copy numbers of nosZ increased with increasing BB application, thus promoting N2O transformation. Third, BB influenced soil pH because it had a high pH and could not only reduce the acidity of the strongly acidic soil in the pomelo orchard but also enhance the pH buffering capacity of the soil to inhibit the reduction in soil acidification [43]. Soil pH affects the ratio of nitrogen conversion during nitrification and denitrification. When denitrification dominates, N2O emissions from soils with high pH values decrease [44]. The greater the BB application was, the higher the soil pH was (Figure 1c), and the lower the soil N2O cumulative emissions were, which agreed with the research results of Urovec et al. [45]. Chen et al. [46] also discovered that with the increase in biochar addition, the reduction in soil N2O emissions was greater.

4.2. Response of Soil Nitrification to Biochar-Based Fertilizer and Urea

Environmental factors can affect the functional gene copy numbers, diversities, and composition of nitrifying microbial communities [47]. In this study, we discovered that a single urea application could significantly reduce the gene copy numbers and community diversity of AOA-amoA and significantly reduce the relative abundance of Crenarchaeota in the AOA-amoA community (p < 0.05) but had no significant effect on the AOB-amoA community, which was consistent with the experimental results of Zhong et al. [48]. In this study, a single application of N fertilizer can significantly increase the gene copy numbers and diversity of soil ammoxidation microorganisms (p < 0.05) [49,50]. This can be closely related to the amount of N fertilizer applied. Due to the large amount of fertilizer applied to the soils of the pomelo orchard, the amount of simulated N fertilizer used in this study was far greater than that in other experiments, indicating that a high amount of N fertilizer input may be detrimental to the growth of ammoxidation microorganisms. In this study, a single application of urea had no significant effect on the gene copy numbers and diversity of AOB-amoA but had a significant effect on the gene copy numbers and diversity of AOA-amoA, which may be because AOA-amoA has a higher affinity for substrates in acidic soils and is more suitable for growth in a low-pH environment [51].
Analysis of the change in soil nitrate concentration showed that the combined application of BB and urea promoted nitrification in the acidic soil in the pomelo orchard. Prommer et al. [52] found that the total nitrification rate of a soil increased by more than two-fold after biochar application, indicating that biochar application promoted soil nitrification. Similarly, in pot experiments, Song et al. [53] found that biochar application promoted the rate of soil nitrification in the soils of the Yellow River Delta. It was found that the AOA-amoA copy numbers were greater than those of AOB-amoA, indicating that the soil environment in this experiment was more suitable for AOA-amoA than for AOB-amoA. He et al. [54] also found that AOA-amoA was dominant in nitrifying archaea and contributed more to nitrification in acidic soil. The gene copy numbers of ammoxidation microorganisms increased with the application of BB, and the copy numbers of AOA-amoA and AOB-amoA under BB were significantly greater than those under N treatment (p < 0.05). Through a 30-day laboratory incubation experiment, Chen, Yin, Fan, Ye, Peng, Li, Zhao, Wakelin, Chu, and Liang [46] also discovered that the application of biochar increased the gene copy numbers of soil AOA-amoA and AOB-amoA by 40.0% and 98.2%, respectively. Thus, BB has positive effects on soil-nitrifying archaea. This may be related to the soil pH. In this study, the soil of the pomelo orchard was strongly acidic, which is not conducive to the life functions of nitrifying archaea, while BB was alkaline, which could significantly increase the soil pH of the pomelo orchard and promote the growth of nitrifying archaea due to a “lime effect” [55]. It is also possible that the input of BB improved the soil oxygen and water conditions, as there are large numbers of microporous structures on the surfaces of biochar, which could provide sufficient oxygen for nitrifying archaea [52]. DON mainly promotes the development of heterotrophic microbial communities by providing soluble organic matter [56]. In this study, correlation analysis showed that the gene copy numbers of AOB-amoA were positively and significantly correlated with DON (Figure 5), indicating that autotrophic ammoxidation microorganisms dominated the AOB-amoA community. Analysis of soil-nitrifying microbial community diversity showed that with the increase in BB application, the community diversity of AOA-amoA increased, and the application of BB alleviated the effect of high nitrogen application on AOA-amoA and restored community diversity to the level of CK. Zhang et al. [57] also found that fertilizer application alone reduced the richness and diversity of soil AOA-amoA and AOB-amoA, while biochar application significantly increased the diversity index. In the community structure of nitrifying microbes, BB had a large impact on Crenarchaeota (AOA-amoA) and Nitrosospira (AOB-amoA) (Figure 4a,b). Heatmap analysis indicated that Crenarchaeota and Nitrosospira were negatively and significantly correlated with N2O emissions (Figure 6a,b). Crenarchaeota have a high affinity for the substrate NH4+-N and can carry out ammonia oxidation, even if the concentration of NH4+-N is very low [58]. Therefore, AOA-amoA has a competitive advantage over other microorganisms for NH4+-N, which is also the reason why AOA-amoA dominated among the nitrifying archaea in this study. Nitrosospira is a typical nitrite-oxidizing bacterium that oxidizes ammonia and is suitable for living in places with low nitrate concentration [59].

4.3. Response of Soil Denitrification to Biochar-Based Fertilizer and Urea

Denitrification belongs to a process where denitrifying microbes gradually reduce NO3-N to NO2-N, NO, N2O, and N2 in soils under anaerobic conditions [11]. The application of urea alone significantly decreased the nirS copy numbers (p < 0.05) but had no significant effect on the nirK gene copy numbers, indicating that nirS was more sensitive than nirK in the acidic soil in the pomelo orchard. High N fertilizer input may not be conducive to the growth of nirS-type denitrifiers. Jiang et al. [60] suggested that the application of urea is likely to inhibit the growth of some nirK-type denitrifiers in moso bamboo forest soils, and this finding may be influenced by the differences in soil type and nitrogen application. Although urea application alone had no significant effect on the nirK and nosZ gene copy numbers, the α-diversity index showed that nirK and nosZ denitrifier community diversity under N treatment was significantly greater than that under CK (p < 0.05). Correlation analysis indicated that community diversity was mainly impacted by the soil nitrogen concentration (NH4+-N, NO3-N, C/N, DON) (Table S1).
Denitrification can generate N2O emissions and is mainly regulated by the functional genes of denitrifying microorganisms. The results showed the gene copy numbers of denitrification under BB were higher than those under N treatment, and those of 10BB+N and 20BB+N reached a significant level. Through a 6-year long-term localization experiment, He, Shan, Zhao, Wang, and Yan [54] revealed that biochar addition could significantly increase the gene copy numbers of denitrification. However, Shi et al. [61] revealed that biochar application alone could significantly reduce the nirS and nirK gene copy numbers and significantly increase the nosZ gene copy numbers. These divergent findings may be caused by differences in the soil pH and biochar properties. In this study, a significant correlation among DOC, DON, and the gene copy numbers of denitrifiers was only found in nirK (Figure 5), indicating that nirK denitrifiers were more sensitive to exogenous carbon and nitrogen than nirS or nosZ denitrifiers. Analysis of the α diversity index showed that BB treatment significantly increased the community diversity of nirS and nirK denitrifiers but significantly decreased the community diversity of nosZ denitrifiers. By increasing the application of BB, the diversity of nirK denitrifiers increased (p < 0.05). Huang et al. [62] found that the addition of exogenous carbon and nitrogen affected the community structure of denitrifying microbes such as nirS, nirK, and nosZ in soils. However, the amount of added exogenous carbon was different for different amounts of BB, which may have affected the dominant genera of the nirS, nirK, and nosZ denitrifiers. With the increase in BB application, the relative abundance of Proteobacteria (nirK) increased, and the relative abundance of Nonomuraea (nirS) and Rhodanobacter (nosZ) decreased. Importantly, Rhodanobacter (nosZ) belongs to a group of nitrogen-fixing trophic microbes in the order Rhizobia and is a facultative anaerobe [63], which indicates that denitrification may have occurred under anaerobic conditions in this study.
Previous studies showed that some denitrifiers containing nirS and nirK lack the ability to reduce N2O and are, therefore, regarded as the main cause of N2O production during denitrification [61]. There was a negative correlation between the cumulative N2O emissions and the gene copy numbers of denitrification (Figure 5), indicating that although BB promoted the copying of the functional genes of soil denitrifiers, BB eventually reduced the rate of soil N2O emissions. In addition, the genes participated in different steps of denitrification, so their contributions to denitrification were also different. Although BB promoted the gene copy numbers of nirS and nirK, the functional gene quantity advantage did not necessarily represent the activity contribution [64]. The results showed that the increase in nosZ gene copy numbers seemed to be more closely related to soil N2O emissions reduction. BB promoted the activity and growth of N2O-reducing microbes by enhancing nosZ gene transcription [55], thus reducing N2O emissions. In addition, denitrification contains an electron-consuming and heterotrophic process in which soil organic matter provides electrons for nitrate reduction and organic substrates for denitrifying microbial growth, thereby enhancing the functional gene copy numbers of microbial denitrifiers [54]. However, this correlation only indicated that microorganisms may be involved in the production of N2O, so this finding cannot be used as direct evidence. Therefore, it is very important to use isotopic tracer techniques to distinguish the contribution of different microorganisms to N2O emissions in future studies.

5. Conclusions

Bamboo-biochar-based fertilizer (BB) had effects on N2O emissions and on the nitrifier and denitrifier communities in the acidic soil of a pomelo orchard. N treatment significantly promoted N2O emissions, while BB treatments significantly reduced N2O emissions, and the inhibition effect increased with the increase in BB. BB application promoted nitrification, increased soil pH, mitigated the negative effects of N fertilizer inputs on the copy numbers and community diversity of the AOA-amoA gene, and restored diversity to the original level under 10BB+N and 20BB+N. BB had a large effect on Crenarchaeota (AOA-amoA) and Nitrosospira (AOB-amoA). N fertilizer inputs were not conducive to the growth of nirS denitrifiers, while BB significantly promoted the gene copy numbers of denitrifiers, particularly enhancing the nosZ gene, to reduce N2O emissions. In addition, N2O emissions were mainly related to denitrifiers such as Nonomuraea (nirS), Proteobacteria (nirK), Rhodanobacter (nosZ), and soil pH. Therefore, the combined application of BB and urea can be considered as an effective practice for controlling N2O emissions from acidic pomelo orchard soils. In the future, field experiments can be conducted to verify the appropriate dosage of acidic soil biochar-based fertilizers in pomelo orchards, as well as the changes in microbial gene abundance and community structure during the nitrification and denitrification processes.

Supplementary Materials

The following supporting information can be downloaded at https://www.mdpi.com/article/10.3390/agronomy13102504/s1. Table S1. Correlation analysis between denitrifier community diversity and soil chemical properties in N treatment.

Author Contributions

Q.L. and L.Z.: performed the experiment, analyzed the data, and completed the writing—original draft. H.C. and X.Q.: performed the experiment and completed the formal analysis. F.W.: provided financial support and conceived the experiment. All authors have read and agreed to the published version of the manuscript.

Funding

This research received funding from three organizations: the Public Welfare Project of Fujian Province (Qinghua Li, 2022R1025003), the “5511” Collaborative Innovation Project (Fei Wang, XTCXGC2021009), and the Science and Technology Innovation Team Project of Fujian Academy of Agricultural Sciences (Qinghua Li, CXTD2021015-1).

Data Availability Statement

The raw data supporting the conclusions of this article will be made available by the authors, without undue reservation.

Conflicts of Interest

The authors declare no conflict of interest.

References

  1. Hou, Y.; Su, D.; Wang, M.; Ye, D.; Tong, L.; Wu, L.; Weng, X.; Liu, D.; Xu, X.; Zhang, S. Long-term excessive phosphorus fertilization alters soil phosphorus fractions in the acidic soil of pomelo orchards. Soil. Tillage Res. 2022, 215, 105214. [Google Scholar] [CrossRef]
  2. Zhao, L.; Li, Q.; Qian, X.; Chen, H.; Wang, F.; Yi, Z. Effects of the combined application of biochar-based fertilizer and urea on N2O emissions, nitrifier, and denitrifier communities in the acidic soil of pomelo orchards. J. Soils Sediments 2022, 22, 3119–3136. [Google Scholar] [CrossRef]
  3. Li, Q.; Ma, X.; Cheng, Q.; Pan, D.; Yu, D.; Luo, Y.; Yuan, J.; Kong, F. Effects of nitrogen fertilizer on the accumulation and allocation of dry matter and nitrogen for maize cultivars with different low nitrogen tolerance. J. Zhejiang Univ. (Agric. Life Sci.) 2015, 41, 527–536. [Google Scholar] [CrossRef]
  4. Tanveer, S.K.; Zhang, J.; Lu, X.; Wen, X.; Liao, Y.C. Effect of Corn Residue Mulch and N Fertilizer Application on Nitrous Oxide (N2O) Emission and Wheat Crop Productivity under Rain-fed Condition of Loess Plateau China. Int. J. Agric. Biol. 2014, 16, 505–512. [Google Scholar] [CrossRef]
  5. IPCC. Climate Change 2014: Mitigation of Climate Change. Contribution of Working Group III to the Fifth Assessment Report of the Intergovernmental Panel on Climate Change; Cambridge University Press: Cambridge, UK, 2014. [Google Scholar]
  6. Bouwman, A.F. The Role of Soils and Land Use in the Greenhouse Effect. Neth. J. Agric. Sci. 1989, 37, 13–19. [Google Scholar] [CrossRef]
  7. Zhang, Y.; Hu, C.; Zhang, J.; Dong, W.; Wang, Y.; Song, L. Research advances on source/sink intensities and greenhouse effects of CO2, CH4 and N2O in agricultural soils. Chin. J. Eco-Agric. 2011, 19, 966–975. [Google Scholar] [CrossRef]
  8. Crutzen, P.J. Atmospheric chemical processes of the oxides of nitrogen, including nitrous oxide [Including nitrogen fertilizer]. In Denitrification Nitrification & Atmospheric Nitrous Oxid; Zubal Books: Cleveland, OH, USA, 1981; pp. 151–170. [Google Scholar]
  9. Li, Y.; Chapman, S.J.; Nicol, G.W.; Yao, H. Nitrification and nitrifiers in acidic soils. Soil. Biol. Biochem. 2018, 116, 290–301. [Google Scholar] [CrossRef]
  10. Braker, G.; Fesefeldt, A.; Witzel, K.-P. Development of PCR primer systems for amplification of nitrite reductase genes (nirK and nirS) to detect denitrifying bacteria in environmental samples. Appl. Environ. Microbiol. 1998, 64, 3769–3775. [Google Scholar] [CrossRef]
  11. Kuypers, M.M.M.; Marchant, H.K.; Kartal, B. The microbial nitrogen-cycling network. Nat. Rev. Microbiol. 2018, 16, 263. [Google Scholar] [CrossRef]
  12. He, F.; Jiang, R.; Chen, Q.; Zhang, F.; Su, F. Nitrous oxide emissions from an intensively managed greenhouse vegetable cropping system in Northern China. Environ. Pollut. 2009, 157, 1666–1672. [Google Scholar] [CrossRef]
  13. Sánchez-Martín, L.; Vallejo, A.; Dick, J.; Skiba, U.M. The influence of soluble carbon and fertilizer nitrogen on nitric oxide and nitrous oxide emissions from two contrasting agricultural soils. Soil. Biol. Biochem. 2008, 40, 142–151. [Google Scholar] [CrossRef]
  14. Long, X.E.; Shen, J.P.; Wang, J.T.; Zhang, L.M.; Di, H.; He, J.Z. Contrasting response of two grassland soils to N addition and moisture levels: N2O emission and functional gene abundance. J. Soils Sediments 2016, 17, 384–392. [Google Scholar] [CrossRef]
  15. Chen, Z.; Luo, X.; Hu, R.; Wu, M.; Wu, J.; Wei, W. Impact of Long-Term Fertilization on the Composition of Denitrifier Communities Based on Nitrite Reductase Analyses in a Paddy Soil. Microb. Ecol. 2010, 60, 850–861. [Google Scholar] [CrossRef]
  16. Wang, Y.Y.; Lu, S.E.; Xiang, Q.J.; Yu, L.M.; Zhao, K.; Zhang, X.P.; Tu, S.H.; Gu, Y.F. Responses of N2O reductase gene (nosZ)-denitrifier communities to long-term fertilization follow a depth pattern in calcareous purplish paddy soil. J. Integr. Agric. 2017, 016, 2597–2611. [Google Scholar] [CrossRef]
  17. Qiu, Q.; Wu, L.; Ouyang, Z.; Li, B.; Xu, Y. Effects of different forms of plant-derived organic matter on nitrous oxide emissions. Env. Sci. Process Impacts 2016, 18, 854–862. [Google Scholar] [CrossRef]
  18. Li, X.H. Present Status, Problems and Developmental Countermeasures of the Bamboo Industry in the North of Fujian Province. J. Fujian For. Sci. Technol. 2004, 02, 109–112. [Google Scholar] [CrossRef]
  19. Kuehl, Y. Resources, Yield, and Volume of Bamboos; Springer: Berlin/Heidelberg, Germany, 2015; Volume 10, pp. 91–111. [Google Scholar] [CrossRef]
  20. Won, K.S.; Hwa, C.Y.; Ju, Y.J.; Hyuk, P.J.; Hwan, P.J.; Cheol, S.D.; Sik, C.J. Effect of biochar application on nitrogen use efficiency for sustainable and productive agriculture under different field crops. J. Plant Nutr. 2021, 44, 2849–2862. [Google Scholar] [CrossRef]
  21. He, X.; Yin, H.; Fang, C.; Xiong, J.; Han, L.; Yang, Z.; Huang, G. Metagenomic and q-PCR analysis reveals the effect of powder bamboo biochar on nitrous oxide and ammonia emissions during aerobic composting. Bioresour. Technol. 2021, 323, 124567. [Google Scholar] [CrossRef]
  22. Guo, H.; Gu, J.; Wang, X.; Yu, J.; Nasir, M.; Zhang, K.; Sun, W. Microbial driven reduction of N2O and NH3 emissions during composting: Effects of bamboo charcoal and bamboo vinegar. J. Hazard. Mater. 2020, 390, 121292. [Google Scholar] [CrossRef]
  23. Case, S.D.C.; Uno, H.; Nakajima, Y.; Jensen, L.S.; Akiyama, H. Bamboo biochar does not affect paddy soil N2O emissions or source following slurry or mineral fertilizer amendment—A 15N tracer study. J. Plant Nutr. Soil. Sci. 2018, 181, 90–98. [Google Scholar] [CrossRef]
  24. Li, C.J.; Yang, W.H.; Zhou, B.Q.; Zhang, Y.; Lin, Y.; Xing, S.H. Effects of biochar based fertilizer on soil nutrients, tea output and quality in an acidified tea field. Chin. J. Soil. Sci. 2021, 52, 387–397. [Google Scholar] [CrossRef]
  25. Lu, R.K. Methods for Soil Agrochemical Analysis; China Agricultural Science and Technology Press: Beijing, China, 2000. [Google Scholar]
  26. Jantalia, C.P.; Santos, H.P.D.; Urquiaga, S.; Boddey, R.M.; Alves, B.J.R. Fluxes of nitrous oxide from soil under different crop rotations and tillage systems in the South of Brazil. Nutr. Cycl. Agroecosyst. 2008, 82, 161–173. [Google Scholar] [CrossRef]
  27. Allen, D.E.; Kingston, G.; Rennenberg, H.; Dalal, R.C.; Schmidt, S. Effect of nitrogen fertilizer management and waterlogging on nitrous oxide emission from subtropical sugarcane soils. Agric. Ecosyst. Environ. 2010, 136, 209–217. [Google Scholar] [CrossRef]
  28. Zhang, L.M.; Offre, P.R.; He, J.Z.; Verhamme, D.T.; Nicol, G.W.; Prosser, J.I. Autotrophic ammonia oxidation by soil thaumarchaea. Proc. Natl. Acad. Sci. USA 2010, 107, 17240–17245. [Google Scholar] [CrossRef] [PubMed]
  29. Francis, C.A.; Santoro, A.E.; Oakley, B.B.; Beman, J.M.; Roberts, K.J. Ubiquity and diversity of ammonia-oxidizing archaea in water columns and sediments of the ocean. Proc. Natl. Acad. Sci. USA 2005, 102, 14683–14688. [Google Scholar] [CrossRef] [PubMed]
  30. Witzel, K.P.; Rotthauwe, J.H. The ammonia monooxygenase structural gene amoA as a functional marker: Molecular fine-scale analysis of natural ammonia-oxidizing populations. Appl. Environ. Microbiol. 1997, 63, 4704–4712. [Google Scholar]
  31. Throbäck, I.N.; Enwall, K.; Jarvis, Å.; Hallin, S. Reassessing PCR primers targeting nirS, nirK and nosZ genes for community surveys of denitrifying bacteria with DGGE. FEMS Microbiol. Ecol. 2004, 49, 401–417. [Google Scholar] [CrossRef]
  32. Zhang, J.; Li, H.; Wang, Y.; Deng, J. Multiple-year nitrous oxide emissions from a greenhouse vegetable field in China: Effects of nitrogen management. Sci. Total Environ. 2018, 616-617, 1139–1148. [Google Scholar] [CrossRef]
  33. Wang, X.; Zhao, M.; Liu, B.; Mz, C.; Bla, C. Integrated systematic approach increase greenhouse tomato yield and reduce environmental losses. J. Environ. Manag. 2020, 266, 110569. [Google Scholar] [CrossRef]
  34. Jung, J.; Yeom, J.; Kim, J.; Han, J.; Lim, H.S.; Park, H.; Hyun, S.; Park, W. Change in gene abundance in the nitrogen biogeochemical cycle with temperature and nitrogen addition in Antarctic soils. Res. Microbiol. 2011, 162, 1018–1026. [Google Scholar] [CrossRef]
  35. Wang, J.; Zhang, J.; Müller, C.; Cai, Z. The Mechanisms of High N2O Emissions from Greenhouse Vegetable Field Soils. Clean-Soil. Air Water 2017, 45, 1600210. [Google Scholar] [CrossRef]
  36. Yang, T.; Li, F.; Zhou, X.; Xu, C.C.; Fang, F. Impact of nitrogen fertilizer, greenhouse, and crop species on yield-scaled nitrous oxide emission from vegetable crops: A meta-analysis. Ecol. Indic. 2019, 105, 717–726. [Google Scholar] [CrossRef]
  37. Yang, L.; Zhang, X.; Ju, X. Linkage between N2O emission and functional gene abundance in an intensively managed calcareous fluvo-aquic soil. Sci. Rep. 2017, 7, 43283. [Google Scholar] [CrossRef] [PubMed]
  38. Ding, Y.; Liu, Y.; Liu, S.; Li, Z.; Tan, X.; Huang, X.; Zeng, G.; Zhou, L.; Zheng, B. Biochar to improve soil fertility. A review. Agron. Sustain. Dev. 2016, 36, 36. [Google Scholar] [CrossRef]
  39. Lehmann, J.; Rilling, M.C.; Thies, J.; Masiello, C.A.; Cam, C.; Wch, D.; Dc, E. Biochar effects on soil biota: A review. Soil. Biol. Biochem. 2011, 43, 1812–1836. [Google Scholar] [CrossRef]
  40. Liu, Q.; Liu, B.J.; Zhang, Y.H.; Hu, T.L.; Lin, Z.B.; Liu, G. Biochar application as a tool to decrease soil nitrogen losses (NH3 volatilization, N2O emissions, and N leaching) from croplands: Options and mitigation strength in a global perspective. Glob. Chang. Biol. 2019, 25, 2077–2093. [Google Scholar] [CrossRef]
  41. Liu, H.; Li, H.; Zhang, A.; Rahaman, M.A.; Yang, Z. Inhibited effect of biochar application on N2O emissions is amount and time-dependent by regulating denitrification in a wheat-maize rotation system in North China-ScienceDirect. Sci. Total Environ. 2020, 721, 137636. [Google Scholar] [CrossRef]
  42. Xu, X.; Huang, H.; Zhang, Y.; Xu, Z.; Cao, X. Biochar as both electron donor and electron shuttle for the reduction transformation of Cr(VI) during its sorption. Environ. Pollut. 2019, 244, 423–430. [Google Scholar] [CrossRef]
  43. Shi, R.Y.; Jiu-Yu, L.I.; Ni, N.I.; Ren-Kou, X.U. Understanding the biochar’s role in ameliorating soil acidity. J. Integr. Agric. 2019, 18, 1508–1517. [Google Scholar] [CrossRef]
  44. Yoo, G.; Kim, Y.J.; Lee, Y.O.; Ding, W.X. Investigation of greenhouse gas emissions from the soil amended with rice straw biochar. KSCE J. Civ. Eng. 2016, 20, 2197–2207. [Google Scholar] [CrossRef]
  45. Urovec, O.; Wall, D.P.; Brennan, F.P.; Krol, D.J.; Richards, K.G. Increasing soil pH reduces fertiliser derived N2O emissions in intensively managed temperate grassland. Agric. Ecosyst. Environ. 2021, 311, 107319. [Google Scholar] [CrossRef]
  46. Chen, H.; Yin, C.; Fan, X.; Ye, M.; Peng, H.; Li, T.; Zhao, Y.; Wakelin, S.A.; Chu, G.; Liang, Y. Reduction of N2O emission by biochar and/or 3,4-dimethylpyrazole phosphate (DMPP) is closely linked to soil ammonia oxidizing bacteria and nosZI-N2O reducer populations. Sci. Total Environ. 2019, 694, 133658. [Google Scholar] [CrossRef] [PubMed]
  47. Thompson, K.A.; Bent, E.; Abalos, D.; Wagner-Riddle, C.; Dunfield, K.E. soil microbial communities as potential regulators of in situ N2O fluxes in annual and perennial cropping systems. Soil. Biol. Biochem. 2016, 103, 262–273. [Google Scholar] [CrossRef]
  48. Zhong, W.H.; Bian, B.Y.; Gao, Y.; Zhao, A.Z. Nitrogen fertilization induced changes in ammonia oxidation are attributablemostly to bacteria rather than archaea in greenhouse-based high N input vegetable soil. Soil. Biol. Biochem. 2016, 93, 150–159. [Google Scholar] [CrossRef]
  49. Zhang, X.; Duan, P.; Wu, Z.; Xiong, Z. Aged biochar stimulated ammonia-oxidizing archaea and bacteria-derived N2O and NO production in an acidic vegetable soil. Sci. Total Environ. 2019, 687, 433–440. [Google Scholar] [CrossRef]
  50. Di, H.J.; Cameron, K.C.; Shen, J.P.; Winefield, C.S.; O’Callaghan, M.; Bowatte, S.; He, J.Z. Nitrification driven by bacteria and not archaea in nitrogen-rich grassland soils. Nat. Geosci. 2009, 2, 621–624. [Google Scholar] [CrossRef]
  51. Zhang, L.M.; Hu, H.W.; Shen, J.P.; He, J.Z. Ammonia-oxidizing archaea have more important role than ammonia-oxidizing bacteria in ammonia oxidation of strongly acidic soils. Isme J. Multidiscip. J. Microb. Ecol. 2012, 6, 1032–1045. [Google Scholar] [CrossRef]
  52. Prommer, J.; Wanek, W.; Hofhansl, F.; Trojan, D.; Offre, P.; Urich, T.; Schleper, C.; Sassmann, S.; Kitzler, B.; Soja, G. Biochar Decelerates Soil Organic Nitrogen Cycling but Stimulates Soil Nitrification in a Temperate Arable Field Trial. PLoS ONE 2014, 9, e86388. [Google Scholar] [CrossRef]
  53. Song, Y.; Zhang, X.; Ma, B.; Chang, S.X.; Gong, J. Biochar addition affected the dynamics of ammonia oxidizers and nitrification in microcosms of a coastal alkaline soil. Biol. Fertil. Soils 2014, 50, 321–332. [Google Scholar] [CrossRef]
  54. He, L.; Shan, J.; Zhao, X.; Wang, S.; Yan, X. Variable responses of nitrification and denitrification in a paddy soil to long-term biochar amendment and short-term biochar addition. Chemosphere 2019, 234, 558–567. [Google Scholar] [CrossRef]
  55. Xu, H.J.; Wang, X.H.; Hu, L.; Yao, H.Y.; Su, J.Q.; Zhu, Y.G. Biochar Impacts Soil Microbial Community Composition and Nitrogen Cycling in an Acidic Soil Planted with Rape. Environ. Sci. Technol. 2014, 48, 9391–9399. [Google Scholar] [CrossRef] [PubMed]
  56. Guo, P.; Zhang, C.; Wang, Y.; Yu, X.; Zhang, Z.; Zhang, D. Effect of long-term fertilization on humic redox mediators in multiple microbial redox reactions. Environ. Pollut. 2018, 234, 107–114. [Google Scholar] [CrossRef] [PubMed]
  57. Zhang, M.; Xia, H.; Lv, B.; Chong, M.; Song, W.; Jiang, C. Short-Term Effect of Biochar Amendments on Total Bacteria and Ammonia Oxidizers Communities in Different Type Soils. Sci. Agric. Sin. 2019, 52, 1260–1271. [Google Scholar] [CrossRef]
  58. Konneke, M.; Schubert, D.M.; Brown, P.C.; Hugler, M.; Standfest, S.; Schwander, T.; Schada von Borzyskowski, L.; Erb, T.J.; Stahl, D.A.; Berg, I.A. Ammonia-oxidizing archaea use the most energy-efficient aerobic pathway for CO2 fixation. Proc. Natl. Acad. Sci. USA 2014, 111, 8239–8244. [Google Scholar] [CrossRef] [PubMed]
  59. Kessel, M.V.; Speth, D.R.; Albertsen, M.; Nielsen, P.H.; Op, D.; Kartal, B.; Jetten, M.; Lücker, S. Complete nitrification by a single microorganism. Nature 2015, 528, 555–559. [Google Scholar] [CrossRef]
  60. Jiang, W.T.; Tian, L.B.; Zhu, G.D.; Tang, R.G.; Lin, Y.X.; Pan, L.Q.; Cai, Y.J. Effects of different forms of nitrogen addition on N2O emissions from the soil of Moso bamboo (Phyllostachys edulis) forest. J. Plant Nutr. Fertil. 2022, 28, 857–868. [Google Scholar] [CrossRef]
  61. Shi, Y.; Liu, X.; Zhang, Q. Effects of combined biochar and organic fertilizer on nitrous oxide fluxes and the related nitrifier and denitrifier communities in a saline-alkali soil. Sci. Total Environ. 2019, 686, 199–211. [Google Scholar] [CrossRef]
  62. Huang, R.; Wang, Y.; Liu, J.; Li, J.; Gao, M. Variation in N2O emission and N2O related microbial functional genes in straw- and biochar-amended and non-amended soils. Appl. Soil. Ecol. 2019, 137, 57–68. [Google Scholar] [CrossRef]
  63. Prakash, O.; Green, S.J.; Jasrotia, P.; Overholt, W.A.; Canion, A.; Watson, D.B.; Brooks, S.C.; Kostka, J.E. Rhodanobacter denitrificans sp. nov., isolated from nitrate-rich zones of a contaminated aquifer. Int. J. Syst. Evol. Microbiol. 2012, 62, 2457–2462. [Google Scholar] [CrossRef]
  64. Taylor, A.E.; Vajrala, N.; Giguere, A.T.; Gitelman, A.I.; Bottomley, P.J. Use of Aliphatic n-Alkynes To Discriminate Soil Nitrification Activities of Ammonia-Oxidizing Thaumarchaea and Bacteria. Appl. Environ. Microbiol. 2013, 79, 6544–6551. [Google Scholar] [CrossRef]
Figure 1. Changes in soil NH4+-N (a), NO3-N (b), pH (c), C/N (d), DOC (e), and DON (f) during the experimental period. Data points and error bars represent the means and standard errors (n = 3), respectively. Different letters indicate significant differences in different treatments (p < 0.05).
Agronomy 13 02504 g001
Figure 2. Changes in soil N2O emission rates (a) and accumulated N2O emissions (b) during the experimental period. Data points and error bars represent means and standard errors (n = 3), respectively. Different letters indicate significant differences in different treatments (p < 0.05).
Agronomy 13 02504 g002
Figure 3. Changes in the gene copy numbers of AOA-amoA (a), AOB-amoA (b), nirS (c), nirK (d), and nosZ (e) in soil during the experimental period. Data points and error bars represent the means and standard errors (n = 3), respectively. Different letters indicate significant differences in different treatments (p < 0.05).
Agronomy 13 02504 g003
Figure 4. Relative abundances of AOA-amoA (a), AOB-amoA (b), nirS (c), nirK (d), and nosZ (e) at the genus level under CK, N, 5BB+N, 10BB+N, and 20BB+N treatments.
Agronomy 13 02504 g004
Figure 5. Correlation analysis between environmental factors and the gene copy numbers of nitrification and denitrification.
Agronomy 13 02504 g005
Figure 6. The correlations among nitrifiers, denitrifiers, and soil environmental factors were analyzed by heatmap at the genus level. Different panels show AOA (a), AOB (b), nirS (c), nirK (d), and nosZ (e). (* means p < 0.05, ** means p < 0.01, *** means p < 0.001.)
Agronomy 13 02504 g006
Table 1. qPCR primers and reaction conditions.
Target GenePrimerSequence (5′–3′)Annealing Temperature
(°C)
Product Fragment Size
(bp)
References
AOA-amoACHEND-arch-amoA-23FATGGTCTGGCTWAGACG55629[29]
CHEND-arch-amoA-616RGCCATCCATCTGTATGTCCA
AOB-amoAAmoA-1FGGGGTTTCTACTGGTGGT58491[30]
AmoA-2RCCCCTCKGSAAAGCCTTCTTC
nirSnirS-C1FATCGTCAACGTCAARGARACVGG55423[31]
nirS-C1RTTCGGGTGCGTCTTSABGAASAG
nirKFlaCuATCATGGTSCTGCCGCG55471[10]
R3CuGCCTCGATCAGRTTGTGGTT
nosZnosZFCGYTGTTCMTCGACAGCCAG50721[31]
nosZRCATGTGCAGNGCRTGGCAGAA
Table 2. The α-diversity index of nitrification and denitrification genes.
ShannonSimpson
TreatmentAOA-amoAAOB-amoAnirSnirKnosZAOA-amoAAOB-amoAnirSnirKnosZ
CK0.80 ± 0.01 a0.15 ± 0.01 a0.13 ± 0.00 c0.37 ± 0.02 f0.11 ± 0.00 d0.47 ± 0.00 b0.93 ± 0.00 a0.93 ± 0.00 ab0.73 ± 0.04 a0.93 ± 0.01 a
N0.43 ± 0.04 b0.00 ± 0.00 a0.04 ± 0.00 d0.55 ± 0.02 d0.45 ± 0.01 a0.73 ± 0.03 a0.99 ± 0.00 a0.88 ± 0.05 b0.56 ± 0.02 b0.70 ± 0.01 b
5BB+N0.79 ± 0.01 a0.04 ± 0.01 a0.25 ± 0.01 a0.45 ± 0.00 e0.21 ± 0.01 c0.48 ± 0.00 b0.99 ± 0.00 a0.91 ± 0.01 ab0.76 ± 0.01 a0.91 ± 0.01 a
10BB+N0.82 ± 0.00 a0.06 ± 0.05 a0.14 ± 0.00 c0.93 ± 0.01 b0.24 ± 0.01 b0.47 ± 0.00 b0.98 ± 0.02 a0.95 ± 0.01 a0.44 ± 0.01 c0.91 ± 0.01 a
20BB+N0.81 ± 0.00 a0.09 ± 0.04 a0.14 ± 0.01 b c1.42 ± 0.01 a0.24 ± 0.02 b0.48 ± 0.01 b0.96 ± 0.02 a0.95 ± 0.00 a0.27 ± 0.00 d0.91 ± 0.01 a
Different letters indicate significant differences in a column (p < 0.05).
Disclaimer/Publisher’s Note: The statements, opinions and data contained in all publications are solely those of the individual author(s) and contributor(s) and not of MDPI and/or the editor(s). MDPI and/or the editor(s) disclaim responsibility for any injury to people or property resulting from any ideas, methods, instructions or products referred to in the content.

