Article

Soil Carbon Management Index under Different Land Use Systems and Soil Types of Sanjiang Plain in Northeast China

1
Institute of Soil and Water Conservation, Northwest A&F University, Xianyang 712100, China
2
Institute of Soil and Water Conservation, Chinese Academy of Sciences and Ministry of Water Resources, Xianyang 712100, China
3
College of Natural Resources and Environment, Northwest A&F University, Xianyang 712100, China
4
State Key Laboratory of Simulation and Regulation of Water Cycle in River Basin, China Institute of Water Resources and Hydropower Research, Beijing 100048, China
5
Research Center on Soil and Water Conservation of the Ministry of Water Resources, Beijing 100048, China
*
Author to whom correspondence should be addressed.
These authors contributed equally to this work.
Agronomy 2023, 13(10), 2533; https://doi.org/10.3390/agronomy13102533
Submission received: 29 June 2023 / Revised: 12 September 2023 / Accepted: 13 September 2023 / Published: 30 September 2023
(This article belongs to the Section Farming Sustainability)

Abstract

:
Land-use systems (LUSs) and soil types (STs) are strongly related to factors that influence soil degradation and carbon (C) loss. However, the way in which land use and soil type affects the soil organic C (SOC) pools, and soil aggregation in the Sanjiang Plain, has not been thoroughly investigated. Therefore, this study aimed to investigate soil physic–ochemical properties, soil aggregates, and C management index (CMI) in three different LUSs (grassland, dryland, and paddy field) under two STs (meadow soil and albic soil) of the Sanjiang Plain in northeast China. A total of 60 composite soil samples were collected for laboratory analyses. The results were as follows: soil properties were affected by LUS and ST, especially soil chemical properties; ST had no significant effect on soil aggregates but significantly affected its SOC content, while LUS had a significant effect on soil aggregates (p < 0.01), except for small macro-aggregates (2–0.25 mm); the mean weight diameter (MWD) and SOC in meadow soil was significantly different under different land uses, with grassland being the highest and dryland the lowest. However, there was no significant difference in albic soil. The heterogeneity of grassland, dryland, and paddy field showed that different LUSs had particular effects on SOC and its active components because LUS had significant effects on C pool index (CPI) and CMI, but ST and its interaction had no significant effects on CPI and CMI. Overall, the results showed that LUS was an important factor affecting CMI in the Sanjiang Plain, rather than ST, and the paddy field CMI was optimal in the Sanjiang Plain.

1. Introduction

Soil is the biggest organic C pool in the terrestrial ecosystem [1,2]. SOC is a crucial part of the global C cycle, and even minor changes in the SOC pool can significantly shift the concentration of greenhouse gases in the atmosphere and jeopardize the current climate situation [3,4,5]. Several studies have indicated that land use change is primarily responsible for SOC stock change [6,7,8]. Land-use change is the main aspect of anthropogenic activities which interfere with SOC and directly or indirectly affect the C cycle of terrestrial ecosystems. So, the effect of land-use change on soil C is still one of the research hotspots of the soil C cycle [9,10,11].
The LUSs are an important factor in controlling the soil C balance. Since the 1990s, the worldwide conversion of natural ecosystems to farmland has caused a global loss of 0.8 Pg C every year from soils [12]. Land use changes have been proven to have a major impact on the soil C balance by altering C inputs and losses [13,14,15]. In addition, land-use change and management actions could alter the soil’s physical, chemical, and biological properties and then affect the amount of litter input, litter decomposition rates, and organic matter stabilization processes [16,17], which lead to changes in the soil C cycle and have a significant impact on soil C stock and its dynamics [18,19,20]. Moreover, the impacts of SOC cycling in agriculture have been widely researched. Studies have shown that organic C stability is a function of land use [21,22], and its stability is also largely a function of soil types (ST) [23]. Numerous studies have been conducted at both the regional and national levels to ascertain land-use change that influences the soil C balance [24,25,26,27]. However, research on soil C stock changes resulting from land-use change in different STs is limited due to natural variability and differences in soil C dynamics under various LUSs. Therefore, it is beneficial to study the differences in soil C stock caused by different LUSs and STs.
The Sanjiang Plain in the northeastern of Heilongjiang Province, which serves as an important base for strategic grain reserves and commodity grain production, is crucial to China’s agricultural development. The region’s land use has drastically changed since 1980. The large area of forestland, grassland, and wetland has first changed into dry land and then into paddy land in this region [28,29]. Since then, a large-area drought-water diversion project has been carried out here, which is bound to have a more complex impact on the spatial pattern of farmland ecosystem and ecological services [30,31]. Recently, many scholars have also studied the change of SOC from the perspective of land-use change in the Sanjiang Plain. However, most studies focused on wetland ecosystems, and there is a lack of research on SOC storage of grassland, farmland, and other ecosystems. Most previous studies have concentrated on evaluating the fertility and crop yields with soil, water, and fertilizer management [31,32,33], but the way that land use and ST affect the SOC pools, and soil aggregation in the Sanjiang Plain, have not been thoroughly investigated. Soil aggregation, soil C pools, and the C management index (CMI) should all be explored further in relation to different land use patterns and ST. The CMI reflects the stability and storage of soil C and is widely used as a sensitive indicator of total organic C changes in soil management [34,35]. Therefore, CMI is a useful tool to determine the effect of land-use change on soil quality [36]. The study, on the dynamic change of SOC storage and its effects in the Sanjiang Plain, is of great significance to agricultural production, wetland protection, and government macro decision-making.
We hypothesized that the ST and land-use patterns in the Sanjiang Plain might have an impact on soil C pools. In this study, the C fractions, soil aggregates and their SOC, and CMI of three LUS (grassland, dryland, and paddy) at two ST (meadow soil and albic soil) were examined to test this hypothesis. Therefore, we established the following goals for this research: (a) to calculate the percentage of soil aggregate and the corresponding soil C for ST and land-use regimes; (b) to quantify the changes of CMI under LUS and ST; (c) to investigate the driving factors of SOC stock under different LUS and ST in the Sanjing Plain.

2. Materials and Methods

2.1. Study Area

The research was conducted in the Sanjiang Plain, located in the east of Heilongjiang Province in northeast China, which is an alluvial plain created by the Heilongjiang, Songhua, and Wusuli Rivers, with a total area of 108,900 km2 and an existing arable land area of 48,700 km2. The main manifestation of cultivated land reclamation is the conversion from dry land to paddy field, which is mainly represented by the change of land use in the Sanjiang Plain, including grassland (22%), dry land (12%), and paddy field (53.5%). The main grassland type is alpine meadow, and the dominant species is Kobresia pygmaea C. B. Clarke, which is abundant in the Sanjiang Plain, and the main crop in the drylands is maize. According to the classification standard of soil erosion, the intensity of soil erosion in this area is mainly slight erosion. The irrigation water source in this area mainly uses surface water and groundwater. The water depth of the paddy field is about 5–10 cm throughout the year, and the groundwater level is 1–3 m in waterlogged years and 5–6 m in dry years. The climate of the survey region is characterized by temperate semi-humid continental, with an average annual temperature of 1.9 °C and an average annual precipitation of 600 mm. The altitude ranges from 900 to 1300 m above sea level. The predominant STs in this area are marsh soil and meadow soil, and the soil organic matter content is high. The albic soil is slightly acidic soil. In the soil profile, there are mainly grey and white albic soils with a thickness of 20–30 cm, which show a sheet structure after air drying. The meadow soil is the product of the development of meadow vegetation in the historical period, which has sufficient water, dense meadow and rich humus, which leads to the failure of water infiltration quickly. Under the action of leaching, a black soil layer with a granular structure is developed. The sample-site distribution is shown in Figure 1.

2.2. Soil Sampling and Laboratory Procedures

Soils were sampled from three LUSs (grassland, dryland, and paddy) and two STs (meadow soil and albic soil). A total of 60 soil samples were collected with six samples from three LUSs in two STs, n is the number of sample sites (meadow soil: grassland [n = 6], dryland [n = 9], paddy [n = 24]; albic soil: grassland [n = 3], dryland [n = 6], paddy [n = 12]), details of sampling sites and geographic location information were shown in Table S1 and Figure 1. Using the global positioning system (GPS), the locations for soil sampling sites were identified, and soil samples were collected from the specified sites at a depth of 0–15 cm after crop harvest. Three undisturbed soil samples (10 cm in diameter and 10 cm long) were taken from 0–15 cm deep to determine aggregates. Soil samples were collected from six separate points and composite samples were made at the same depth interval at each point, sealed in polyethylene bags (Yhpak Co. Ltd., Shanghai, China) and transported to the laboratory. In addition, farmland soil is generally greatly affected by environmental factors. Therefore, in the experiment, forest soil with the same type and similar location and less disturbance by human beings is selected as the reference soil to calculate the CPI. The forest soil-sampling method is consistent with other soil-sampling methods. After removing visible large roots, stones, and macrofauna, all of the soil samples were ground and sieved (2 mm and 0.15 mm), then air-dried and stored for subsequent determination of various soil physico-chemical properties and C fractions. Three steel rings (Yaxing Civil Instruments Co. Ltd., Xi’an, China) in each sample plot with a volume of 100 cm3 were used to analyze the soil bulk density (BD) (0–20 cm) [37]. The soil texture was analyzed by the laser diffraction method (Hydyo2000MU, Mastersizer, Malvern Panalytical Ltd., Malvern, UK) [38].
The soil pH was measured by a pH meter with a soil-to-water ratio of 1:2.5 and the soil electrical conductivity (EC) was measured via the conductivity method with a soil-to-water ratio of 1:5. Soil organic matter was determined by the Walkley–Black procedure (potassium dichromate) [39]. Soil alkali hydrolysable nitrogen (AHN) was determined by the alkali solution diffusion method. Based on the continuous flow analyzer (SEAL AutoAnalyzer 3, Berlin, Germany), total nitrogen (TN), ammonium nitrogen (NH4+–N) and nitrate nitrogen (NO3–N) concentrations in soil extracts were determined colorimetrically, and total phosphorus (TP) in soil by the H2SO4-HClO4 digestion Mo-Sb colorimetric method. Determination of available phosphorous (AP) contents of 0.5 mol NaHCO3 (pH 8.5) was made using Olsen colorimetry. Available potassium (AK) contents were determined using atomic absorption spectrophotometry of flames. All the above determination methods referred to Bao [40]. The fumigation extraction method was used to measure the microbial biomass C (MBC) and microbial biomass nitrogen (MBN) [41].

2.3. Soil Aggregate and C Fractionation

Studies on water-stabilized aggregates were conducted by using the wet sieving method [42]. Briefly, air-dried soil (100 g) was placed on a 2 mm sieve and soaked in deionized water for 5 min at a temperature control at 25 ± 1 °C, thereby facilitating the disintegration of the sample [43]. The screen was moved up and down within 2 min to separate the water-stable aggregates. The remaining dry weight of the soil (>2 mm aggregate) that had not passed the 2 mm sieve was a large aggregate. The soil that had passed through a 2 mm sieve was replaced in a 0.25 mm sieve and the same screening procedure as in the previous step was used to obtain small macro-aggregates (2–0.25 mm). Finally, the soil was placed in a 0.053 mm sieve for the same screening process, and components of micro-aggregates from 0.25 to 0.053 mm and clay aggregates smaller than than 0.053 mm were obtained. The aggregate fractions after drying in an oven at 50 °C were weighed to calculate the percentage of water-stable aggregates at different particle sizes.
Kemper and Koch [44] determined that the parameter MWD for aggregate stability was calculated as:
MWD = i = 1 3 ( r i - 1 + r i ) m i 2
where r 0 = r 1 when i = 0, r 1 = 2 mm, r 2 = 0.25 mm, r 3 = 0.053 mm, and m i is the mass fraction of soil aggregates remaining on the ith sieve.
The SOC of aggregates was measured by the H2SO4-K7Cr2O7 pyrogenation method, and labile organic C (LOC) was analyzed using the KMnO4 oxidation method [45].

2.4. CMI

The formula provided by Blair [45] was used to calculate CMI, with natural forest soils considered as a reference sample.
CMI = CPI × LI × 100
CPI = SOC   in   the   soil   sample SOC   in   the   reference   sample
L I   = LOC s LOC r
L = LOC LOC n
where LOCs and LOCr were the labile C in soil sample and the labile C in reference soil, respectively. L is the lability of C. LOC is labile organic C and LOCn is the C unoxidized by KMnO4.

2.5. Statistical Analyses

The soil’s physical and chemical properties, SOC and its unstable components, aggregate proportions, and other data were analyzed using the analysis of variance (ANOVA) in SPSS 25.0 software (IBM Co., Armonk, NY, USA). The Duncan method was used to estimate the significance of differences between different LUSs within the 95% confidence interval (p < 0.05). Referring to Li [46], through Amos 24.0 software (IBM Co., Armonk, NY, USA), the direct and indirect impact pathways of CMI (n = 60) were determined using structural equation modeling (SEM). According to the results of correlation analysis, the main environmental factors affecting CMI can be preliminarily determined. Then, a prior model was established. Because the model fit of some variables was poor, the prior model was corrected according to the modification indices of different paths. After optimization, the quality of the model was estimated by the value χ2, p (p > 0.05 indicates a good correspondence of the model) and root mean square error of approximation, RMSEA. (An RMSEA value between 0–0.1 indicates a good correspondence of the model.) The principal component analysis (PCA) was performed using SPSS (version 20.0) for soil physical and chemical properties. The objective of PCA was to reduce the dimension of data while minimizing the loss of information.

3. Results

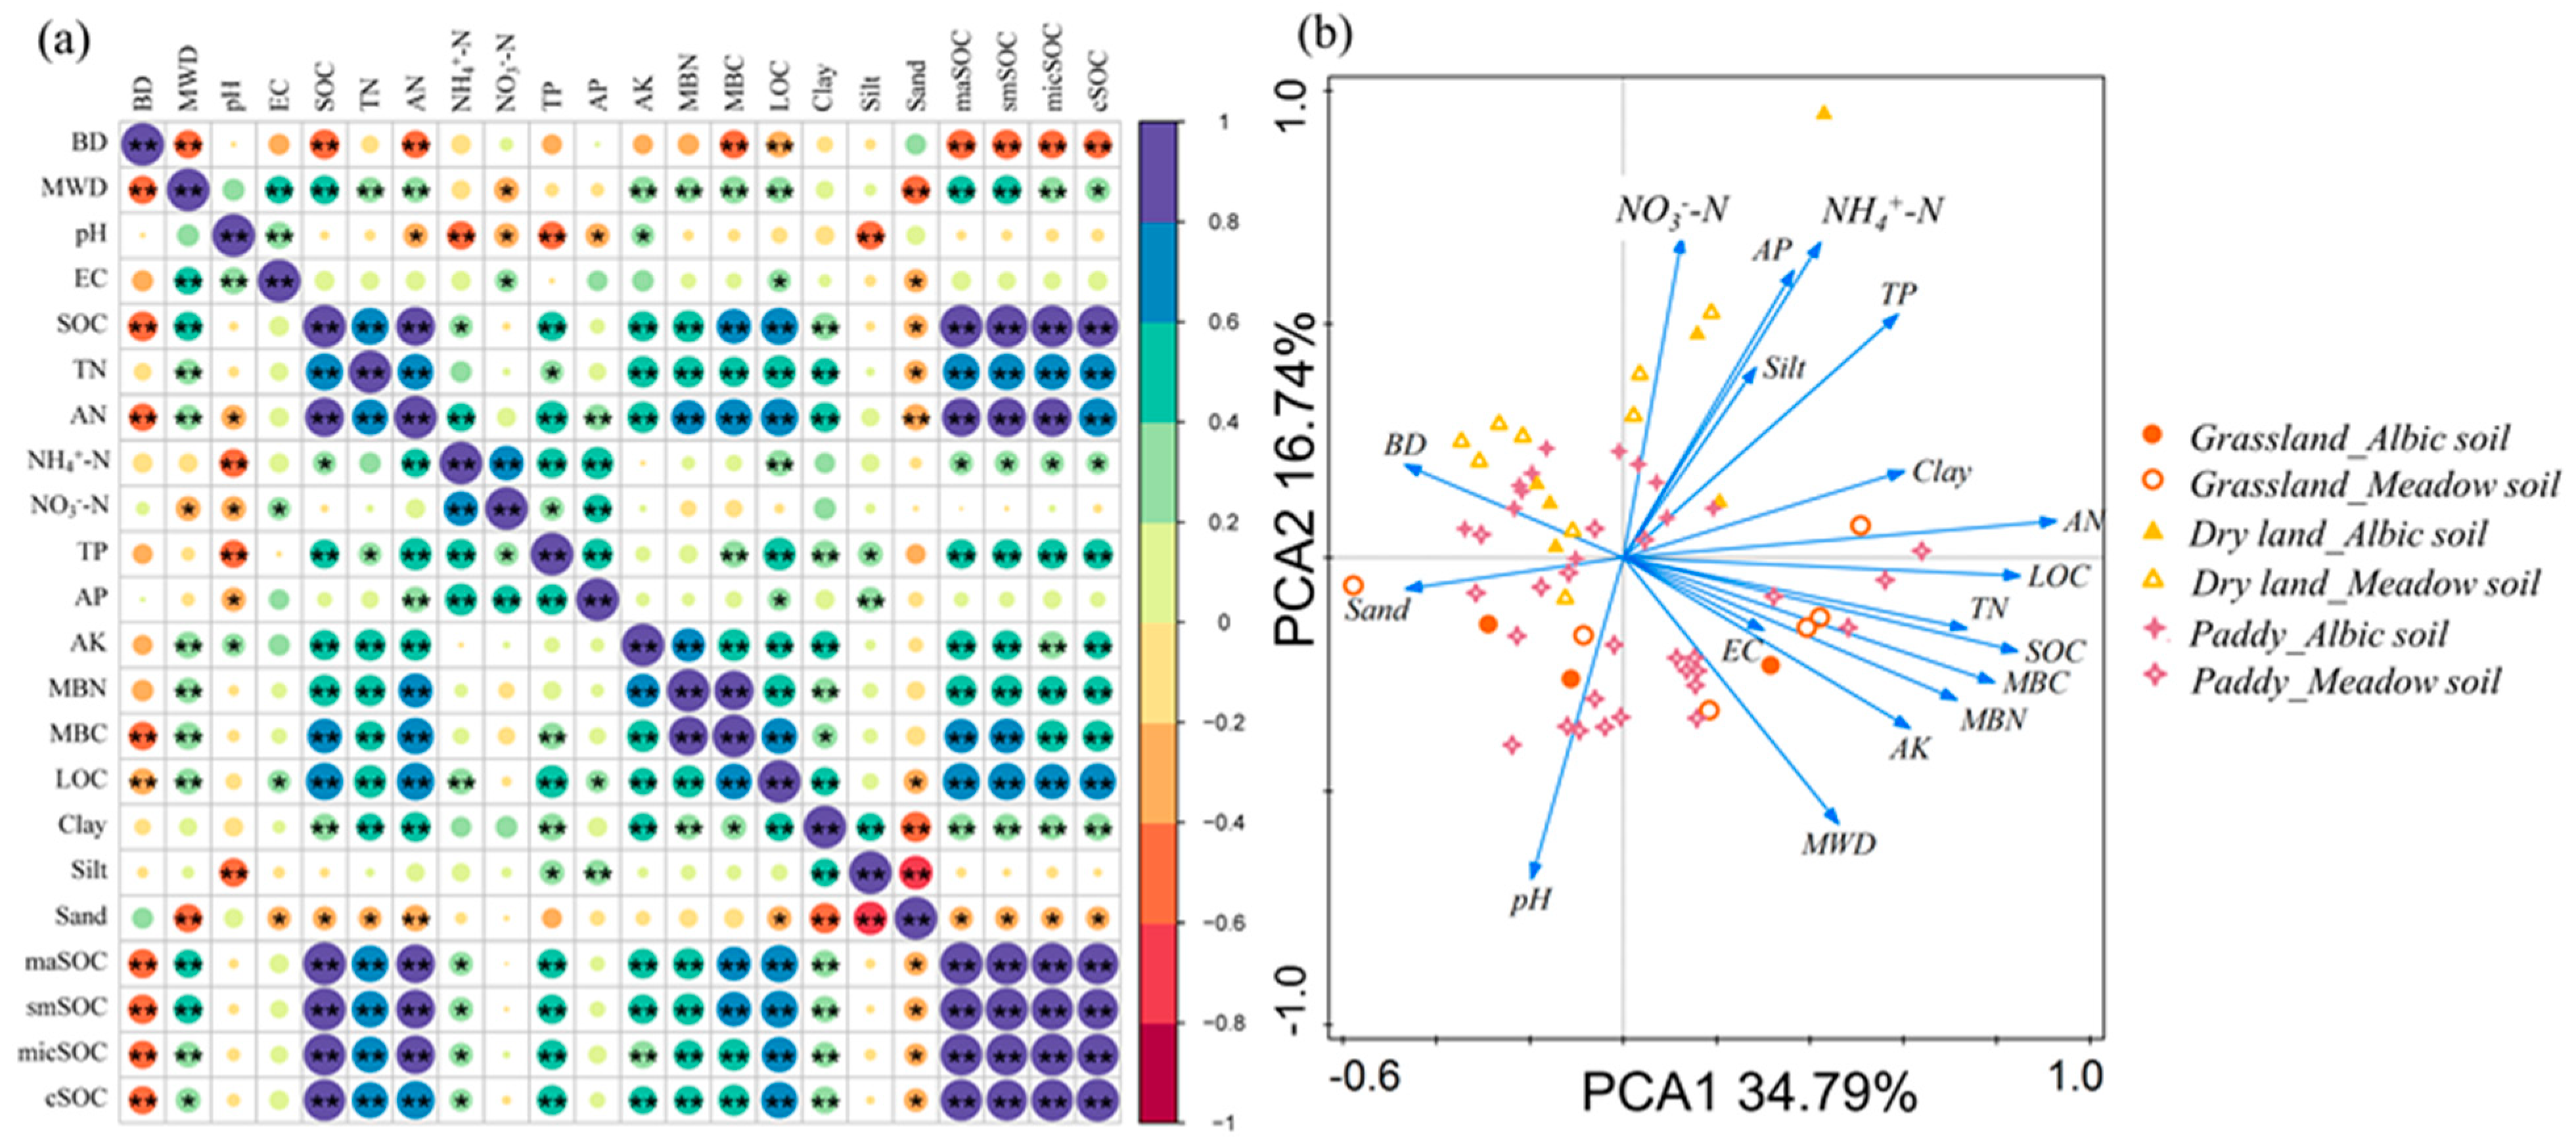
3.1. Soil Properties under Different ST and LUS

Soil properties, especially chemical properties, were affected by different ST and LUS (Table 1). The ANOVA for different variables showed that soil silt content and AP were significantly influenced by ST (p < 0.01) while NO3–N, NH4+–N, AK, MBN (p < 0.01), EC, and AP (p < 0.05) content were mainly affected by LUS. However, the LUS and ST mutually affect sand content, EC, AP, and AK. In meadow soil, the soil EC of paddy was significantly higher, while the MBN was significantly lower than that of grassland (p < 0.05). However, soil TN, AK, and MBN reduced significantly in dryland compared with grassland, while NO3–N and NH4+–N significantly increased (p < 0.05). In albic soil, compared with grassland, sand, pH, AK, and MBN contents were significantly diminished and silt content was significantly improved (p < 0.05). In addition, soil BD and TP content in dryland were significantly higher than those in grassland (p < 0.05). In albic soil, the BD, silt, and AP significantly increased as compared with the paddy field in meadow soil, while the sand, pH, EC, TP, and AHN significantly reduced.

3.2. Soil Aggregates and SOC under Different ST and LUS

Under different STs and diverse LUSs, the mass percentage of macro-aggregates (>2 mm) was the highest (40.6–69.9%), and the mass percentage of silt- and clay-aggregates (<0.053 mm) was the lowest (4.3–16.9 %) (Table 2). Multivariate analysis of variance indicated that soil aggregates were not significantly affected by ST. While LUS had a significant impact on soil aggregates (p < 0.01), except for small macro-aggregates (2–0.25 mm). In the meadow soil, soil aggregate composition was significantly changed under different land uses. The macro-aggregates (>2 mm) and small macro-aggregates (2–0.25 mm) of the paddy field were significantly lower than those of the grassland. The composition of macro-aggregates in dryland soil was significantly less, and the micro-aggregates (0.25–0.053 mm) and clay aggregates (<0.053 mm) were significantly larger than those of grassland (p < 0.05). In the albic soil, the small macro-aggregates (2–0.25 mm) in the paddy field were clearly lower than than in grassland (p < 0.05), while the micro-aggregates (0.25–0.053 mm) were significantly higher than those found in grassland (p < 0.05), but there was no significant variation in the content of other aggregates under different LUSs. In addition, the content of macro-aggregates (>2 mm) for albic soil was obviously lower than that in the paddy field of meadow soil, while the composition of micro-aggregates (0.25–0.053 mm) and clay aggregates (<0.053 mm) in meadow paddy field was significantly lower than that in albic soil.
In meadow soil, the MWD was significantly distinct under different land uses, with grassland being the highest and dryland the lowest. However, there was no visible difference in soil MWD between different land uses of albic soil. The MWD of dryland and paddy field was significantly affected by the ST: the MWD of the dryland in the albic soil was significantly higher than that in the meadow soil, while the MWD of paddy field was the opposite (Table 2).

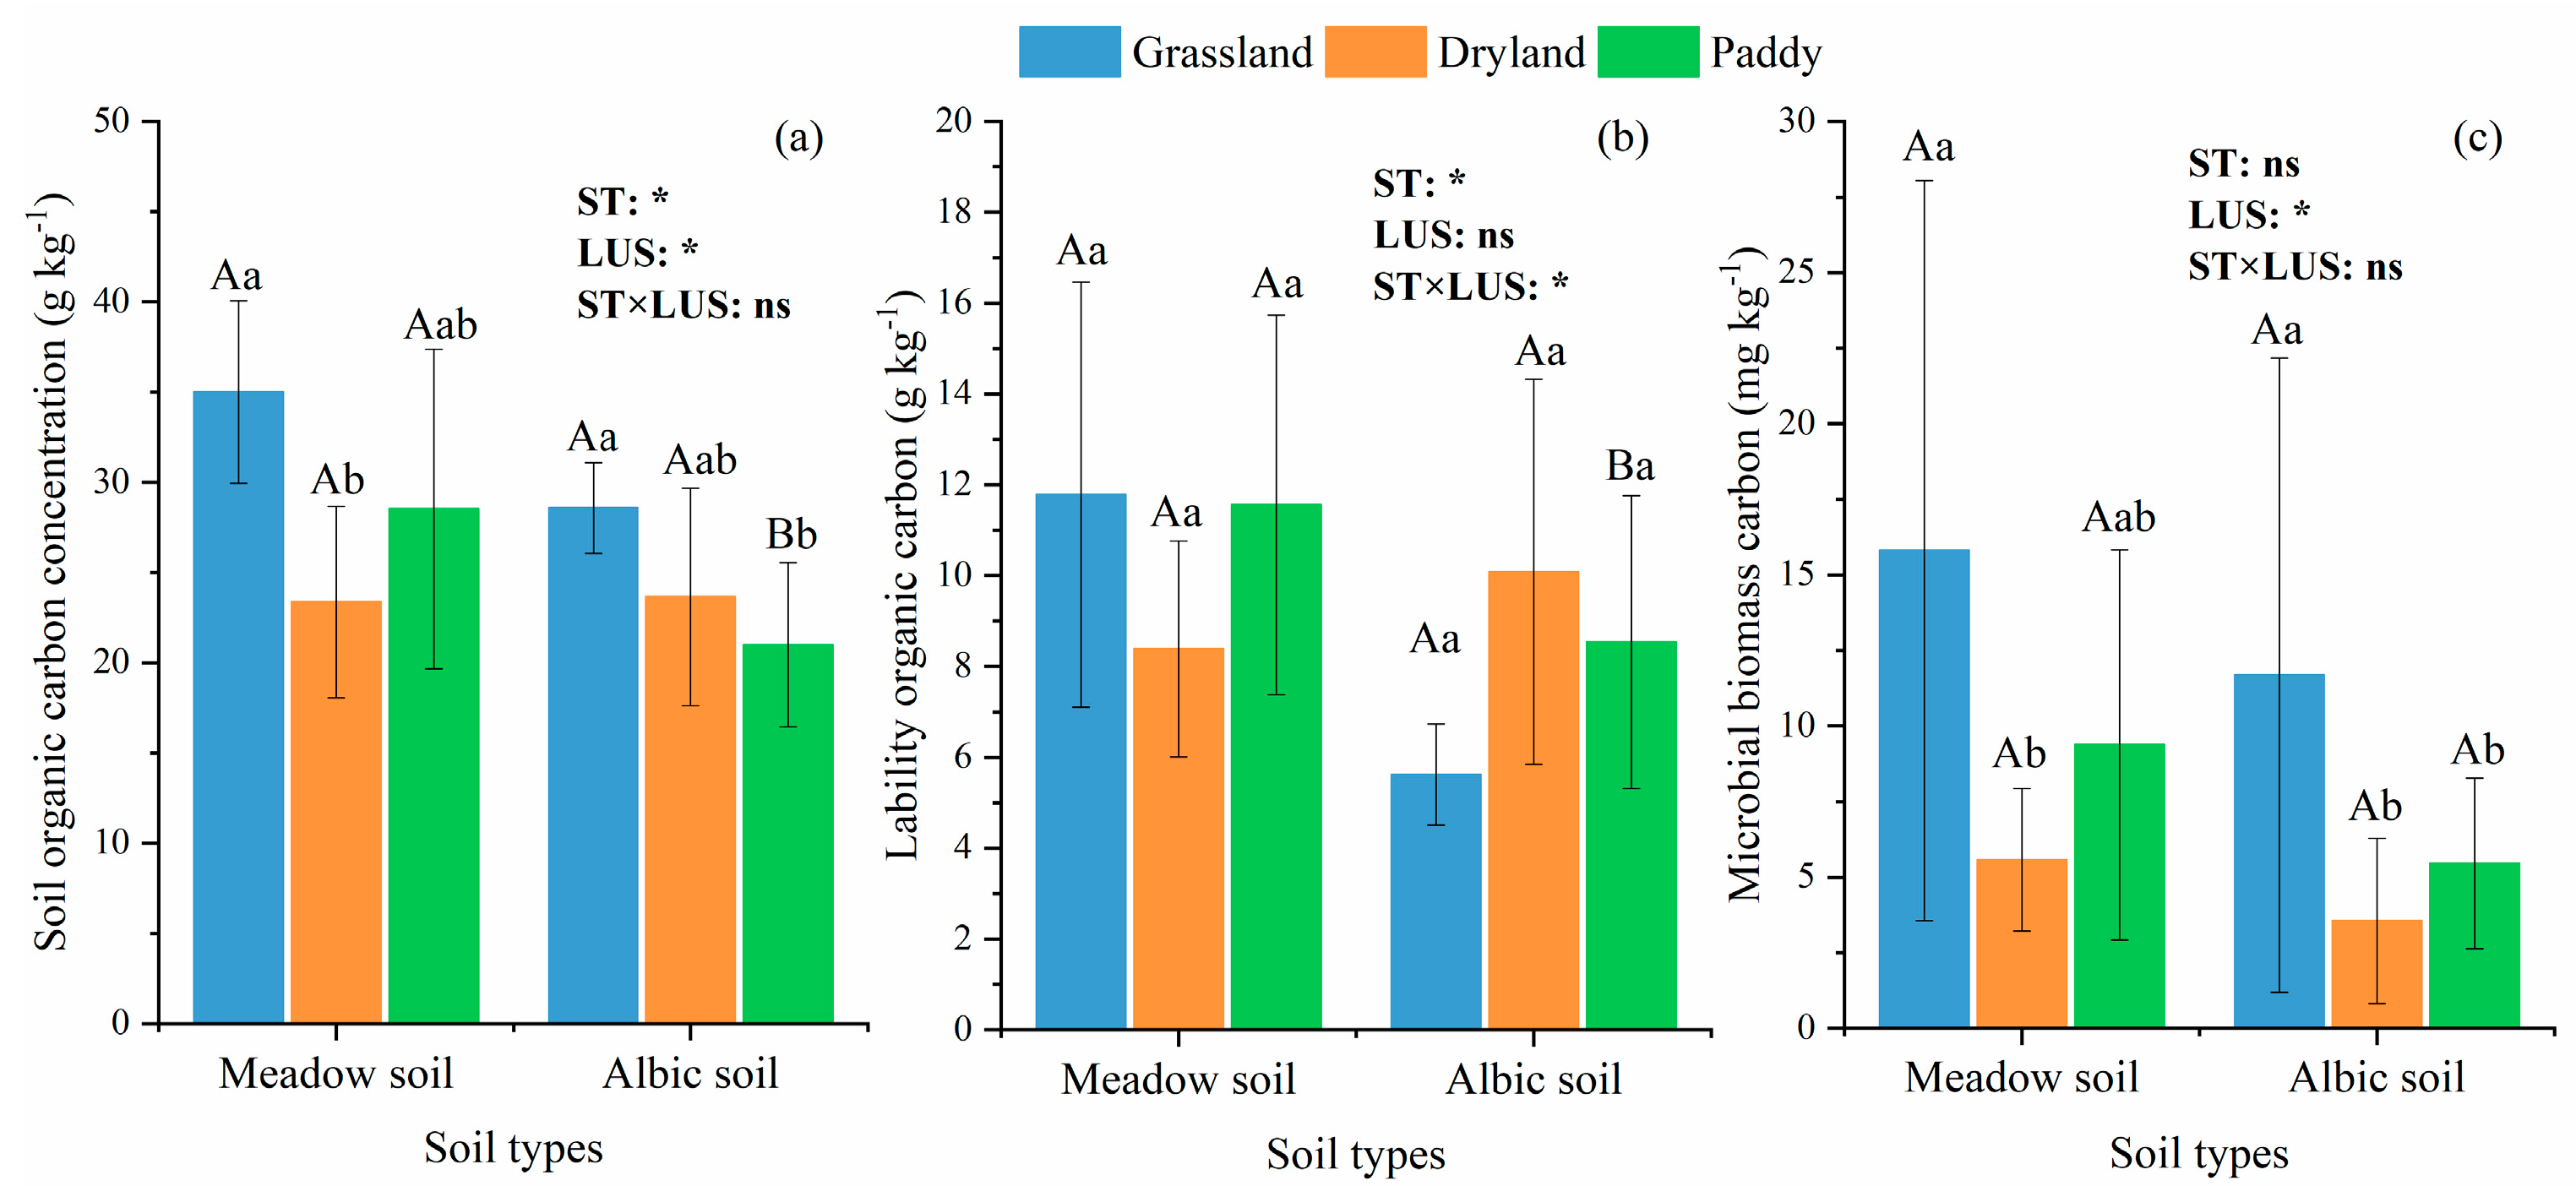
3.3. Soil C Content under Different ST and Land Uses

Under different land-use conditions, the SOC content of meadow soil and albic soil varied significantly. It was found that grassland has maximum SOC content in both two types of soils, while dryland and paddy field have the lowest SOC contents in the meadow soil and albic soil, respectively (Figure 2a). ST had little impact on the contents of MBC in soil but the SOC and LOC contents of paddy field in meadow soil were significantly improved compared with albic soil (p < 0.05). The contents of LOC in different land-use types were not significantly changed, and the MBC content of grassland was the highest. The change in LOC and MBC in different land uses of meadow soil were consistent, being highest in grassland and lowest in dryland (Figure 2b,c).
Pearson correlation analysis demonstrated that SOC content was positively correlated with LOC content (p < 0.05), and SOC and LOC content were positively correlated with MWD, TN, soil AHN, TP, AK, MBC, and MBN (p < 0.01). Soil BD was negatively correlated with SOC and LOC content (p < 0.01). In addition, soil SOC was positively correlated with NH4+–N (p < 0.05) and negatively correlated with sand (p < 0.05). It can be seen that SOC, unstable C, and easily oxidized C are closely related to soil environmental factors. A strong correlation existed between maSOC, smSOC, micSOC, and cSOC (p < 0.01), which were significantly positively correlated with MWD, SOC, TN, AN, NH4+–N, TP, AK, MBN, MBC, LOC, and clay (p < 0.05 or p < 0.01), but negatively correlated with BD and sand content (p < 0.05 or p < 0.01) (Figure 3a). Principal component analysis (PCA) revealed that the top two principal components accounted for 51.5% of the variation. Soil pH, MWD, NO3–N, NH4+–N, AP, and silt content were mainly distributed in the second axis, while the rest of the soil properties were mainly distributed in the first axis (Figure 3b). The heterogeneity of grassland, dryland, and paddy field showed that different LUSs had certain effects on SOC and its active components.

3.4. CMI under Different ST and LUS

Forest soils of the two STs were used as references to obtain CPI, LI, L, and CMI. LUS had significant effects on CPI and CMI, but STs and their interaction had no significant effects on CPI and CMI, and the interaction of ST and LUS significantly affected LI and L (Table 3). In meadow soil, the difference in L value between various LUSs was not obvious, but the CPI, LI, and CPI of dryland were significantly lower than those of grassland (p < 0.05). However, there was no significant difference in the LI and CMI under different LUS but the CPI of grassland was higher than that of dryland and paddy field in albic soil. It should be noted that the L in the dryland and paddy fields was obviously higher than that of grassland in albic soil.
SEM analysis showed that sand, silt, clay, MWD, BD, SOC, and LOC accounted for 81% of CMI variation under different ST and LUS. The SOC, LOC, and ST have a significant direct influence on CMI, accounting for 26%, 74%, and 37% of the CMI, respectively, while other indicators have an indirect influence on CMI (Figure 4). The BD had a negative effect on SOC, with a standardization coefficient of −28%, and SOC had a positive effect on LOC, with a standardization coefficient of 68%. In the analysis, the values of albic soil and meadow soil were assigned as 1 and 2 respectively. Therefore, the negative effect of ST could be interpreted as the CMI of albic soil being better than that of meadow soil. Different land uses can indirectly affect CMI by affecting soil MWD, LOC, and SOC. In the analysis, grassland, dryland, and paddy field are assigned values of 1, 2, and 3, respectively. Therefore, this path indicates that paddy field CMI is optimal.

4. Discussions

4.1. SOC Associated with Aggregate Size Fractions under Different ST and LUS

The considerably greater proportion of macro-aggregates (>2 mm) than that of other particle size aggregates in meadow soil and albic soil under different land uses could be due to the low temperature in this region (the annual mean temperature is 1.9 °C) and the long, cold winter that inhibits the decomposition of soil organic matter by micro-organisms, resulting in high organic matter content and stronger organic–mineral complexation (Table 2). The distribution of aggregate size was significantly impacted by LUS. The MWD largely represents the percentage of macro-aggregates when it comes to indicators of soil aggregate stability. The MWD was greater in the grassland than in cultivated soils in this study. The largest concentration of SOC (Figure 2a) in grassland soils may be the cause of the higher aggregate stability in grassland soils compared to dryland and paddy soils [47]. These findings are consistent with the fact that SOC is the key stabilizing agent for soil aggregation and stability [48,49,50,51]. Stable aggregates, in turn, protect soil organic matter from microbial decomposers [42] and promote soil fertility. Kukal [52] previously demonstrated that grasslands soils were more stable than the soils under other LUSs. The increased fraction of macro-aggregates in grassland, compared to cultivated soils, showed an increase in macro–aggregate turnover caused by disturbance. In contrast to forest gleyic fluvisol at the same depth, agricultural soil in the 0–20 cm layer had a higher concentration of micro-aggregates (0.25 mm), according to Gajic B [53]. This might be caused by the mechanical disruption of macro–aggregate by tillage [54], rain droplet impact, and harvest traffic [55]. Additionally, the soil organic matter, which links micro-aggregates to form macro-aggregates, is a labile fraction that is extremely vulnerable to cultivation and changes in land use [56]. The frequent drying and wetting cycle, particularly the generation and destruction of macro-aggregates, may have mechanically disturbed soil aggregates, which in turn reduced aggregate stability in paddy soils, contributing to the poorer stability of aggregates. The results of multivariate ANOVA in this study showed that ST did not significantly affect soil aggregates. This was mostly due to the fact that soil aggregates are primarily governed by structure. Meadow soil and albic soil aggregate structures are primarily dominated by 2:1 clay minerals, whose outer surfaces can absorb organic matter and the interlayer is connected by a weak van der Waals force [57].
SOC and soil-aggregate formation were tightly connected [58]. Understanding the mechanism of change of SOC in soil between different land uses could be helped by the SOC content and stock in soil-aggregate components. The bigger aggregates are made up of minor aggregates and organic binding [42], and macro-aggregates contain newer and more unstable organic matter than micro-aggregates [59,60], which may account for an increase in SOC concentration in each aggregate with increasing aggregate size. According to Sodhi [61], macro-aggregates have a larger C content than micro-aggregates, which is in line with our findings. The highest C density in soil aggregates was found in the >2 mm fraction, and it dropped as aggregate size decreased. Six [62] linked the proportion of C loss due to physical damage (trampling, tillage etc.) to an increase in the macro-aggregates turnover. This confirms that C linked with micro-aggregates better preserved against degradation and so aids in long-term soil C sequestration [63].
In this study, ST had the same effect on organic C in aggregates under different LUS. The organic C content in grassland aggregates was the highest, and the paddy field was the lowest (Table 3). The SOC contents in the soil and each type of aggregate were significantly higher in grassland as compared to dryland and paddy under different ST (Table 3 and Figure 2). It is well known that the decrease in SOC in topsoil was considered to be mainly due to the fact that there is lower C input to the soil system in cropland than grassland [64,65,66]. The C input mainly depends on litter input and microbial decomposition. Therefore, the accumulation of SOC in grassland comes from abundant input of exogenous C, but the protective effect of small macro-aggregates on SOC is also important for grassland soil. Chen [67] also proposed that land-use turnover from grassland to cropland is not a good choice for SOC sequestration and it was supported by the results of the previous study [68]. Dhumgond [69] also found that the amount of C in agroforestry systems and coffee plantations was higher than those in paddy fields. SOC concentrations and reserves have been lowered after intensive cultivation due to reduced physical protection, increased mineralization, and nutrient and C depletion [70,71].

4.2. C Management under Different LUS

Land use did not have a substantial impact on the C fractions of LOC, while ST and the interaction of ST and LUS (Figure 2b). However, a prior study revealed that labile fractions can exhibit more pronounced changes in C stocks as a result of land-use change [72]. Zhang [73] indicated that LOC responds to the change in LUS and ST. In the present study, the heterogeneity of grassland, dryland, and paddy field showed that diverse land use had particular effects on SOC and its active components (Figure 3). The LOC followed similar trends as SOC in meadow soil (Figure 2) [74], which were basically consistent with the published literature [75,76,77]. SOC storage at greater levels acts as a stabilizing factor [78]. The change of LI in meadow soil and albic soil indicated certain effects of land-use systems (Table 4). The LI of paddy was significantly higher than that of dryland in meadow soil which indicated that SOC in paddy is highly labile and its conversion is rapid and less efficient [48]. The lower levels of CPI in paddy and dryland indicated that these land-use types are at a stage of degradation, forming a scenario of lower C input and faster C turnover. The decomposition of litter and the release of nutrients after decomposition may be the reason why grassland soil biochemical parameters (such as MBC) are higher than other plots (Figure 2).
CMI is used to represent the C dynamics of the system. Although the CMI varied obviously among all the different LUSs, it showed a similar trend in different STs (Table 4). The value of CMI itself is not important, but the difference can indicate the impact of different land use on the system [45]. In meadow soil, the CMI followed the order: grassland > paddy > dryland. The higher CMI values in paddy were mainly contributed by the LI, which was closely related to the use of chemical fertilizers in the field. The nitrogen fertilizer application has been found to increase biomass, thereby increasing soil organic matter. Vieira [79] showed that fertilizer input increased the instability of soil organic matter by 12–46%, thus, increasing CMI in corn-cropping systems. In albic soil, the CMI of grassland was low but the paddy and dryland had high CMI. Nevertheless, we do not consider arable land to be superior to grassland because the increase in CMI of cultivated land depends on the increase in unstable C (Table 4), which may lead to accelerated loss of the soil C pool. The results also suggest that soil chemical properties are the key indicators influencing soil function and CMI. The adverse effect of ST could be explained by the CMI of albic soil being better than that of meadow soil (Figure 4). Land use can indirectly affect CMI through MWD and SOC, with grassland, dryland, and paddy field assigned values of 1, 2 and 3, respectively. Therefore, this path indicates that paddy field CMI was optimal (Figure 4). These findings were consistent with results presented by Blair, indicating that fallow land significantly increased CMI compared to cultivated soil [45]. This might be closely related to the concentration of soil organic matter [74,80]. There is no clear standard for CMI because it is based on the local land use of an area; however, Blair [45] considered that higher CMI values indicated recovery of C while the lower CMI values indicated that the soil C was being degraded [81]. In addition, C management for different LUSs supports the development of future land-use planning and C management policies and strategies. Hence, it is concluded that the land-use conversion of dryland to paddy field will improve C availability of the farmland soil in the Sanjiang Plain.

5. Conclusions

Our study provides evidence that soil properties are affected by LUS and ST, especially soil chemical properties; ST had no significant effect on soil aggregate, but a significant effect on SOC content. LUS had significant effects on soil aggregates, and the heterogeneity of different LUSs had specific effects on SOC and its effective components. Overall, LUS has a significant effect on CMI, while ST has no effect. Therefore, the study shows that the conversion of dry land to paddy field can increase the stable aggregates, organic C storage and CMI of albic soil, which tends to improve soil health and fertility, while meadow soil is more suitable for paddy field. The conversion of dry land to paddy field will effectively improve the C availability of farmland soil in the Sanjiang Plain. Grassland is an important C sink and an effective measure of low-cost C sequestration and emission reduction.

Supplementary Materials

The following supporting information can be downloaded at: https://www.mdpi.com/article/10.3390/agronomy13102533/s1, Table S1. Details of sampling sites and geographic location information.

Author Contributions

M.Z.: Investigation, Analyzing the data, Data curation, Writing—review & editing, Writing—original draft. J.H. (Jiale Han): Performing the experiments, Data curation, Software, Visualization, Writing—original draft. J.J.: Investigation. J.H. (Jianqiao Han): Data curation. X.Z.: Performing the experiments. K.H.: Performing the experiments. Y.K.: Performing the experiments. M.T.J.: Writing-review & editing. W.Q.: Supervision, Funding acquisition. M.Z. and J.H. contributed equal to this work. All authors have read and agreed to the published version of the manuscript.

Funding

This work was supported by the IWHR Research & Development Support Program (grant number SE0145B032021); the key consulting project “Study on the Impact of Black Soil Health in SL Project” (grant number SE120203A0102022); the MWR Major Scientific & Technological Project (SKS-2022047, SKR-2022053); the Natural Science Foundation of Shaanxi Province (grant number 2022JM-154); the open Foundation of Key Laboratory in Jiangxi Academy of Water Science and Engineering (2021SKTR02, 2022SKTR02); the Natural Science Foundation of China for Yellow River Water Research Joint Foundation (U2243212).

Data Availability Statement

The data is unavailable due to privacy restrictions.

Conflicts of Interest

The authors declare no conflict of interest.

Abbreviations

TN: total nitrogen; TP: phosphorus; AP: available phosphorus; AK: available potassium; AHN: alkali hydrolysable nitrogen; NO3−N: nitrate nitrogen; NH4+−N: ammonium nitrogen; MBC: microbial biomass carbon; MBN: microbial biomass nitrogen; BD: bulk density; EC: electrical conductivity; LOC: labile organic carbon; SOC: soil organic carbon; MWD: mean weight diameter; L: lability of carbon; LI: lability index; CPI: carbon pool index; CMI: carbon management index; macro-aggregates (>2 mm); small macro-aggregates (2–0.25 mm); micro-aggregates (0.25–0.053 mm); clay aggregates (<0.053 mm); maSOC: macro-aggregates SOC; smSOC: small aggregates SOC; micSOC: micro-aggregates SOC; cSOC: clay SOC.

References

  1. Scharlemann, J.P.W.; Tanner, E.V.J.; Hiederer, R.; Kapos, V. Global soil carbon: Understanding and managing the largest terrestrial carbon pool. Carbon Manag. 2014, 5, 81–91. [Google Scholar] [CrossRef]
  2. Schmidt, M.W.I.; Torn, M.S.; Abiven, S.; Dittmar, T.; Guggenberger, G.; Janssens, I.A.; Kleber, M.; Kogel-Knabner, I.; Lehmann, J.; Manning, D.A.C.; et al. Persistence of soil organic matter as an ecosystem property. Nature 2011, 478, 49–56. [Google Scholar] [CrossRef] [PubMed]
  3. Bradford, M.A.; Wieder, W.R.; Bonan, G.B.; Fierer, N.; Raymond, P.A.; Crowther, T.W. Managing uncertainty in soil carbon feedbacks to climate change. Nat. Clim. Change 2016, 6, 751–758. [Google Scholar] [CrossRef]
  4. Lal, R.; Smith, P.; Jungkunst, H.F.; Mitsch, W.J.; Lehmann, J.; Nair, P.K.R.; McBratney, A.B.; Sa, J.C.D.; Schneider, J.; Zinn, Y.L.; et al. The carbon sequestration potential of terrestrial ecosystems. J. Soil Water Conserv. 2018, 73, A145–A152. [Google Scholar] [CrossRef]
  5. Paustian, K.; Collier, S.; Baldock, J.; Burgess, R.; Creque, J.; DeLonge, M.; Dungait, J.; Ellert, B.; Frank, S.; Goddard, T.; et al. Quantifying carbon for agricultural soil management: From the current status toward a global soil information system. Carbon Manag. 2019, 10, 567–587. [Google Scholar] [CrossRef]
  6. Olaya-Abril, A.; Parras-Alcantara, L.; Lozano-Garcia, B.; Obregon-Romero, R. Soil organic carbon distribution in Mediterranean areas under a climate change scenario via multiple linear regression analysis. Sci. Total Environ. 2017, 592, 134–143. [Google Scholar] [CrossRef]
  7. Hu, P.L.; Liu, S.J.; Ye, Y.Y.; Zhang, W.; He, X.Y.; Su, Y.R.; Wang, K.L. Soil carbon and nitrogen accumulation following agricultural abandonment in a subtropical karst region. Appl. Soil Ecol. 2018, 132, 169–178. [Google Scholar] [CrossRef]
  8. Li, C.H.; Veum, K.S.; Goyne, K.W.; Nunes, M.R.; Acosta-Martinez, V. A chronosequence of soil health under tallgrass prairie reconstruction. Appl. Soil Ecol. 2021, 164, 103939. [Google Scholar] [CrossRef]
  9. Hobley, E.; Baldock, J.; Hua, Q.; Wilson, B. Land-use contrasts reveal instability of subsoil organic carbon. Glob. Change Biol. 2017, 23, 955–965. [Google Scholar] [CrossRef]
  10. Sainepo, B.M.; Gachene, C.K.; Karuma, A. Assessment of soil organic carbon fractions and carbon management index under different land use types in Olesharo Catchment, Narok County, Kenya. Carbon Bal. Manage. 2018, 13, 4. [Google Scholar] [CrossRef]
  11. Pham, T.G.; Nguyen, H.T.; Kappas, M. Assessment of soil quality indicators under different agricultural land uses and topographic aspects in Central Vietnam. Int. Soil Water Conse. 2018, 6, 280–288. [Google Scholar] [CrossRef]
  12. Schimel, D.S.; House, J.I.; Hibbard, K.A.; Bousquet, P.; Ciais, P.; Peylin, P.; Braswell, B.H.; Apps, M.J.; Baker, D.; Bondeau, A.; et al. Recent patterns and mechanisms of carbon exchange by terrestrial ecosystems. Nature 2001, 414, 169–172. [Google Scholar] [CrossRef] [PubMed]
  13. Guo, L.B.; Gifford, R.M. Soil carbon stocks and land use change: A meta analysis. Glob. Change Biol. 2002, 8, 345–360. [Google Scholar] [CrossRef]
  14. Wu, X.; Yao, Z.; Bruggemann, N.; Shen, Z.Y.; Wolf, B.; Dannenmann, M.; Zheng, X.; Butterbach-Bahl, K. Effects of soil moisture and temperature on CO2 and CH4 soil atmosphere exchange of various land use/cover types in a semi-arid grassland in Inner Mongolia, China. Soil Biol. Biochem. 2010, 42, 773–787. [Google Scholar] [CrossRef]
  15. Kidinda, L.K.; Doetterl, S.; Kalbitz, K.; Bukombe, B.; Babin, D.; Mujinya, B.B.; Vogel, C. Relationships between geochemical properties and microbial nutrient acquisition in tropical forest and cropland soils. Appl. Soil Ecol. 2023, 181, 104653. [Google Scholar] [CrossRef]
  16. Romkens, P.F.A.M.; van der Plicht, J.; Hassink, J. Soil organic matter dynamics after the conversion of arable land to pasture. Biol. Fert. Soils 1999, 28, 277–284. [Google Scholar] [CrossRef]
  17. Six, J.; Conant, R.T.; Paul, E.A.; Paustian, K. Stabilization mechanisms of soil organic matter: Implications for C-saturation of soils. Plant Soil 2002, 241, 155–176. [Google Scholar] [CrossRef]
  18. Yifru Abera and Belachew, T. Effect of land use on soil organic carbon and nitrogen in soils of Bale, Southeastern Ethiopia. Trop. Subtrop. Agroecosystems 2011, 14, 229–235. [Google Scholar]
  19. Haile, G.; Lemenhi, M.; Itanna, F.; Senbeta, F. Impacts of land uses changes on soil fertility, carbon and nitrogen stock under smallholder farmers in central highlands of Ethiopia: Implication for sustainable agricultural landscape management around Butajira area. N. Y. Sci. J. 2014, 7, 27–44. [Google Scholar]
  20. Ketema, H.; Yimer, F. Soil property variation under agroforestry based conservation tillage and maize based conventional tillage in Southern Ethiopia. Soil Till. Res. 2014, 141, 25–31. [Google Scholar] [CrossRef]
  21. Poeplau, C.; Don, A.; Vesterdal, L.; Leifeld, J.; Van Wesemael, B.; Schumacher, J.; Gensior, A. Temporal dynamics of soil organic carbon after land-use change in the temperate zone—Carbon response functions as a model approach. Glob. Change Biol. 2011, 17, 2415–2427. [Google Scholar] [CrossRef]
  22. Rabbi, S.M.F.; Tighe, M.; Cowie, A.; Wilson, B.R.; Schwenke, G.; Mcleod, M.; Badgery, W.; Baldock, J. The relationships between land uses, soil management practices, and soil carbon fractions in South Eastern Australia. Agr. Ecosyst. Environ. 2014, 197, 41–52. [Google Scholar] [CrossRef]
  23. Mathieu, J.A.; Hatte, C.; Balesdent, J.; Parent, E. Deep soil carbon dynamics are driven more by soil type than by climate: A worldwide meta-analysis of radiocarbon profiles. Glob. Change Biol. 2015, 21, 4278–4292. [Google Scholar] [CrossRef] [PubMed]
  24. Piao, S.L.; Fang, J.Y.; Ciais, P.; Peylin, P.; Huang, Y.; Sitch, S.; Wang, T. The carbon balance of terrestrial ecosystems in China. Nature 2009, 458, 1009-U82. [Google Scholar] [CrossRef] [PubMed]
  25. Tuomi, M.; Thum, T.; Jarvinen, H.; Fronzek, S.; Berg, B.; Harmon, M.; Trofymow, J.A.; Sevanto, S.; Liski, J. Leaf litter decomposition-Estimates of global variability based on Yasso07 model. Ecol. Model. 2009, 220, 3362–3371. [Google Scholar] [CrossRef]
  26. Zhang, C.; Liu, G.B.; Xue, S.; Sun, C.L. Soil organic carbon and total nitrogen storage as affected by land use in a small watershed of the Loess Plateau, China. Eur. J. Soil Biol. 2013, 54, 16–24. [Google Scholar] [CrossRef]
  27. Zheng, J.F.; Chen, J.H.; Pan, G.X.; Wang, G.M.; Liu, X.Y.; Zhang, X.H.; Li, L.Q.; Bian, R.J.; Cheng, K.; Zheng, J.W. A long-term hybrid poplar plantation on cropland reduces soil organic carbon mineralization and shifts microbial community abundance and composition. Appl. Soil Ecol. 2017, 111, 94–104. [Google Scholar] [CrossRef]
  28. Yan, M.; Deng, W.; Chen, P. Climate change in the Sanjiang Plain disturbed by large-scale reclamation. J. Geogr. Sci. 2002, 12, 405–412. [Google Scholar]
  29. Zhang, B.; Chang, L.; Nia, Z.; Callaham, M.A.; Sun, X.; Wu, D.H. Effects of land use changes on winter-active Collembola in Sanjiang Plain of China. Appl. Soil Ecol. 2014, 83, 51–58. [Google Scholar] [CrossRef]
  30. Kueppers, L.M.; Snyder, M.A.; Sloan, L.C. Irrigation cooling effect: Regional climate forcing by land-use change. Geophys. Res. Lett. 2007, 34, L03703. [Google Scholar] [CrossRef]
  31. Yan, F.; Zhang, S.; Su, F. Variations in ecosystem services in response to paddy expansion in the Sanjiang Plain, Northeast China. Int. J. Agr. Sustain. 2019, 17, 158–171. [Google Scholar] [CrossRef]
  32. Ouyang, W.; Xu, Y.; Hao, F.; Wang, X.; Siyang, C.; Lin, C. Effect of long-term agricultural cultivation and land use conversion on soil nutrient contents in the Sanjiang Plain. Catena 2013, 104, 243–250. [Google Scholar] [CrossRef]
  33. Zhao, Q.; Brocks, S.; Lenz-Wiedemann, V.I.S.; Miao, Y.; Zhang, F.; Bareth, G. Detecting spatial variability of paddy rice yield by combining the DNDC model with high resolution satellite images. Agr. Syst. 2017, 152, 47–57. [Google Scholar] [CrossRef]
  34. Zhao, F.; Yang, G.; Han, X.; Feng, Y.; Ren, G. Stratification of Carbon Fractions and Carbon Management Index in Deep Soil Affected by the Grain-to-Green Program in China. PLoS ONE 2014, 9, e99657. [Google Scholar] [CrossRef]
  35. Guimarães, D.V.; Silva, M.L.N.; Beiniach, A.; Bispo, D.F.A.; Contins, J.G.P.; Curi, N. Relationship between soil organic matter fractions and cover plants in Olive post planting. Rev. Bras. Frutic. 2018, 40. [Google Scholar] [CrossRef]
  36. Bispo, D.F.A.; Guimarães, D.V.; Marques, J.J.G.d.S.e.M.; Beniaich, A.; Acuña-Guzman, S.F.; Silva, M.L.N.; Curi, N. Soil Organic Carbon as Response to Reforestation Age and Land Use Changes: A Qualitative Approach to Ecosystem Services. Sustainability 2023, 15, 6863. [Google Scholar] [CrossRef]
  37. Blake, G.R.; Hartage, K.H. Bulk density. In Methods of Soil Analysis, Part 1: Physical and Mineralogical Methods, 2nd ed.; Klute, A., Ed.; American Society of Agronomy: Madison, WI, USA, 1986; pp. 363–375. [Google Scholar]
  38. Gee, G.W.; Bauder, J.W. Particle size analysis. In Methods of Soil Analysis, Part 1: Physical and Mineralogical Methods, 2nd ed.; Klute, A., Ed.; American Society of Agronomy: Madison, WI, USA, 1986; pp. 383–411. [Google Scholar]
  39. Walkley, A.; Black, I.A. An examination of the Degtjareff method for determining soil organic matter, and a proposed modification of the chromic acid titration method. A. Soil Sci. 1934, 37, 29–38. [Google Scholar] [CrossRef]
  40. Bao, S.D. Soil and Agro-Chemical Analysis; China Agriculture Press: Beijing, China, 2008. [Google Scholar]
  41. Jenkinson, D.S.; Powlson, D.S. The effects of biocidal treatments on metabolism in soil—V: A method for measuring soil biomass. Soil Biol. Biochem. 1976, 8, 209–213. [Google Scholar] [CrossRef]
  42. Elliott, E.T. Aggregate Structure and Carbon, Nitrogen, and Phosphorus in Native and Cultivated Soils. Soil Sci. Soc. Am. J. 1986, 50, 627–633. [Google Scholar] [CrossRef]
  43. Kemper, W.D.; Rosenau, R.; Nelson, S. Gas Displacement and Aggregate Stability of Soils. Soil Sci. Soc. Am. J. 1985, 49, 25–28. [Google Scholar] [CrossRef]
  44. Kemper, W.D.; Koch, E.J. Aggregate Stability of Soils from Western USA and Canada; USDA Technical Bulletin; US Government Printing Office: Washington, DC, USA, 1966; p. 1355.
  45. Blair, G.; Lefroy, R.; Lisle, L. Soil carbon fractions based on their degree of oxidation, and the development of a carbon management index for agricultural systems. Aust. J. Agr. Res. 1995, 46, 1459. [Google Scholar] [CrossRef]
  46. Li, J.B.; Zhao, Y.; Zhang, A.F.; Song, B.; Hill, R.L. Effect of grazing exclusion on nitrous oxide emissions during freeze-thaw cycles in a typical steppe of Inner Mongolia. Agric. Ecosyst. Environ. 2021, 307, 107217. [Google Scholar] [CrossRef]
  47. Eynard, A.; Schumacher, T.E.; Lindstrom, M.J.; Malo, D.D. Effect of agricultural management systems on soil organic C in aggregates of Ustoll and Usterts. Soil Till. Res. 2005, 81, 253–263. [Google Scholar] [CrossRef]
  48. Xue, S.; Liu, G.B.; Pan, Y.P.; Dai, Q.H.; Zhang, C.; Yu, N. Evolution of soil labile organic matter and carbon management index in the Artificial robinia of Loess hilly area. Sci. Agric. Sin. 2009, 42, 1458–1464. [Google Scholar]
  49. Abiven, S.; Menasseri, S.; Chenu, C. The effects of organic inputs over time on soil aggregate stability—A literature analysis. Soil Biol. Biochem. 2009, 41, 1–12. [Google Scholar] [CrossRef]
  50. Feng, H.J.; Wang, S.Y.; Gao, Z.D.; Pan, H.; Zhuge, Y.P.; Ren, X.Q.; Hu, S.W.; Li, C.L. Aggregate stability and organic carbon stock under different land uses integrally regulated by binding agents and chemical properties in saline-sodic soils. Land Degrad. Dev. 2021, 32, 4151–4161. [Google Scholar] [CrossRef]
  51. Xiao, L.; Yao, K.H.; Li, P.; Liu, Y.; Chang, E.H.; Zhang, Y.; Zhu, T.T. Increased soil aggregate stability is strongly correlated with root and soil properties along a gradient of secondary succession on the Loess Plateau. Ecol. Eng. 2020, 143, 105671. [Google Scholar] [CrossRef]
  52. Kukal, S.S.; Kaur, M.; Bawa, S.S.; Gupta, N. Water-drop stability of PVA-treated natural soil aggregates from different land uses. Catena 2007, 70, 475–479. [Google Scholar] [CrossRef]
  53. Gajic, B.; Dugalic, G.; Djurovic, N. Comparison of soil organic matter content, aggregatecomposition and water stability of gleyic fluvisol from adjacentforest and cultivated areas. Agron. Res. 2006, 4, 499–508. [Google Scholar]
  54. Lal, R. Tillage Effects on Soil Degradation, Soil Resilience, Soil Quality, and Sustainability—Introduction. Soil Till. Res. 1993, 27, 1–8. [Google Scholar] [CrossRef]
  55. Holeplass, H.; Singh, B.R.; Lal, R. Carbon sequestration in soil aggregates under different crop rotation and nitrogen fertilization in an Inceptisol in southeastern Norway. Nutr. Cycl. Agroecosys. 2004, 70, 167–177. [Google Scholar] [CrossRef]
  56. Ashagrie, Y.; Zech, W.; Guggenberger, G. Transformation of a Podocarpus falcatus dominated natural forest into a monoculture Eucalyptus globulus plantation at Munesa, Ethiopia: Soil organic C, N and S dynamics in primary particle and aggregate-size fractions. Agr. Ecosyst. Environ. 2005, 106, 89–98. [Google Scholar] [CrossRef]
  57. Giniyatullin, K.G.; Shinkarev, A.A.; Shinkarev, A.A.; Krinari, G.A.; Lygina, T.Z.; Gubaidullina, A.M.; Suchkova, G.G. Binding of organic matter into an oxidation-resistant form during the interaction of clay minerals with plant residues. Eurasian Soil Sci. 2010, 43, 1159–1173. [Google Scholar] [CrossRef]
  58. Fang, X.M.; Chen, F.S.; Wan, S.Z.; Yang, Q.P.; Shi, J.M. Topsoil and Deep Soil Organic Carbon Concentration and Stability Vary with Aggregate Size and Vegetation Type in Subtropical China. PLoS ONE 2015, 10, e0139380. [Google Scholar] [CrossRef]
  59. Puget, P.; Chenu, C.; Balesdent, J. Total and Young Organic-Matter Distributions in Aggregates of Silty Cultivated Soils. Eur. J. Soil Sci. 1995, 46, 449–459. [Google Scholar] [CrossRef]
  60. Jastrow, J.D. Soil aggregate formation and the accrual of particulate and mineral-associated organic matter. Soil Biol. Biochem. 1996, 28, 665–676. [Google Scholar] [CrossRef]
  61. Sodhi, G.P.S.; Beri, V.; Benbi, D.K. Soil aggregation and distribution of carbon and nitrogen in different fractions under long-term application of compost in rice-wheat system. Soil Till. Res. 2009, 103, 412–418. [Google Scholar] [CrossRef]
  62. Six, J.; Elliott, E.T.; Paustian, K.; Doran, J.W. Aggregation and soil organic matter accumulation in cultivated and native grassland soils. Soil Sci. Soc. Am. J. 1998, 62, 1367–1377. [Google Scholar] [CrossRef]
  63. Shrestha, B.M.; Sitaula, B.K.; Singh, B.R.; Bajracharya, R.M. Soil organic carbon stocks in soil aggregates under different land use systems in Nepal. Nutr. Cycl. Agroecosys. 2004, 70, 201–213. [Google Scholar] [CrossRef]
  64. Beare, M.H.; Hendrix, P.F.; Coleman, D.C. Water-Stable Aggregates and Organic-Matter Fractions in Conventional-Tillage and No-Tillage Soils. Soil Sci. Soc. Am. J. 1994, 58, 777–786. [Google Scholar] [CrossRef]
  65. Luo, Z.K.; Wang, E.L.; Baldock, J.; Xing, H.T. Potential soil organic carbon stock and its uncertainty under various cropping systems in Australian cropland. Soil Res. 2014, 52, 463–475. [Google Scholar] [CrossRef]
  66. Bolinder, M.A.; Katterer, T.; Poeplau, C.; Borjesson, G.; Parent, L.E. Net primary productivity and below-ground crop residue inputs for root crops: Potato (Solanum tuberosum L.) and sugar beet (Beta vulgaris L.). Can. J. Soil Sci. 2015, 95, 87–93. [Google Scholar] [CrossRef]
  67. Chen, L.D.; Gong, J.; Fu, B.J.; Huang, Z.L.; Huang, Y.L.; Gui, L.D. Effect of land use conversion on soil organic carbon sequestration in the loess hilly area, loess plateau of China. Ecol. Res. 2007, 22, 641–648. [Google Scholar] [CrossRef]
  68. Saha, D.; Kukal, S.S.; Sharma, S. Landuse impacts on SOC fractions and aggregate stability in typic ustochrepts of Northwest India. Plant Soil 2011, 339, 457–470. [Google Scholar] [CrossRef]
  69. Dhumgond, P.; Prakash, S.S.; Punith Raj, T.S.; Reddy, S.B.; Shivakumar, K.M. Dynamics of soil organic carbon and their fractions under different cropping systems in hill zone acid soils of Karnataka. Madras Agric. J. 2012, 99, 762–768. [Google Scholar] [CrossRef]
  70. Lal, R. Development in East-Africa. Geoderma 1995, 67, 159–164. [Google Scholar] [CrossRef]
  71. Nath, A.J.; Lal, R.; Sileshi, G.W.; Das, A.K. Managing India’s small landholder farms for food security and achieving the “4 per Thousand” target. Sci. Total Environ. 2018, 634, 1024–1033. [Google Scholar] [CrossRef]
  72. Schwendenmann, L.; Pendall, E. Effects of forest conversion into grassland on soil aggregate structure and carbon storage in Panama: Evidence from soil carbon fractionation and stable isotopes. Plant Soil 2006, 288, 217–232. [Google Scholar] [CrossRef]
  73. Zhang, J.B.; Song, C.C.; Yang, W.Y. Land use effects on the distribution of labile organic carbon fractions through soil profiles. Soil Sci. Soc. Am. J. 2006, 70, 1037. [Google Scholar]
  74. Meena, V.S.; Ghosh, B.N.; Singh, R.J.; Bhattacharyya, R.; Sharma, N.K.; Alam, N.M.; Meena, S.K.; Mishra, P.K. Land use types and topographic position affect soil aggregation and carbon management in the mountain agro-ecosystems of the Indian Himalayas. Land Degrad. Dev. 2021, 32, 3992–4003. [Google Scholar] [CrossRef]
  75. Lal, R. Soil carbon sequestration and aggregation by cover cropping. J. Soil Water Conserv. 2015, 70, 329–339. [Google Scholar] [CrossRef]
  76. Moharana, P.C.; Sharma, B.M.; Biswas, D.R.; Dwivedi, B.S.; Singh, R.V. Long-term effect of nutrient management on soil fertility and soil organic carbon pools under a 6-year-old pearl millet-wheat cropping system in an Inceptisol of subtropical India. Field Crop. Res. 2012, 136, 32–41. [Google Scholar] [CrossRef]
  77. Ghosh, S.; Wilson, B.; Ghoshal, S.; Senapati, N.; Mandal, B. Organic amendments influence soil quality and carbon sequestration in the Indo-Gangetic plains of India. Agr. Ecosyst. Environ. 2012, 156, 134–141. [Google Scholar] [CrossRef]
  78. Trasar-Cepeda, C.; Leiros, M.C.; Gil-Sotres, F. Hydrolytic enzyme activities in agricultural and forest soils. Some implications for their use as indicators of soil quality. Soil Biol. Biochem. 2008, 40, 2146–2155. [Google Scholar] [CrossRef]
  79. Vieira, F.C.B.; Bayer, C.; Zanatta, J.A.; Dieckow, J.; Mielniczuk, J.; He, Z.L. Carbon management index based on physical fractionation of soil organic matter in an Acrisol under long-term no-till cropping systems. Soil Till. Res. 2007, 96, 195–204. [Google Scholar] [CrossRef]
  80. Ghosh, B.N.; Meena, V.S.; Alam, N.M.; Dogra, P.; Bhattacharyya, R.; Sharma, N.K.; Mishra, P.K. Impact of conservation practices on soil aggregation and the carbon management index after seven years of maize-wheat cropping system in the Indian Himalayas. Agr. Ecosyst. Environ. 2016, 216, 247–257. [Google Scholar] [CrossRef]
  81. Benbi, D.K.; Brar, K.; Toor, A.S.; Singh, P. Total and labile pools of soil organic carbon in cultivated and undisturbed soils in northern India. Geoderma 2015, 237, 149–158. [Google Scholar] [CrossRef]
Figure 1. The sampling site.
Agronomy 13 02533 g001
Figure 2. Impact of land-use systems and soil types on soil organic carbon (SOC) (a), labile organic carbon (LOC) (b), and microbial biomass carbon (MBC) (c). Different uppercase and lowercase letters indicate significant differences among different soil types (ST) (t−test) and land use systems (LUS), respectively. * Indicates significance at the 0.05 probability levels; “ns” Indicates no significance.
Agronomy 13 02533 g002
Figure 3. Correlation (a) and principal component (b) analysis for soil properties and soil organic carbon (SOC). BD: bulk density; MWD: weight mean diameter; EC: electric conductivity; TN: total nitrogen; AN: alkali-hydrolyzable nitrogen; NO3−N: nitrate nitrogen; NH4+−N: ammonium nitrogen; TP: total phosphorus; AP: available phosphorus; AK: available potassium; MBN: microbial biomass nitrogen; MBC: microbial biomass carbon; LOC: labile organic carbon; maSOC: macro-aggregates SOC; smSOC: small aggregates SOC; micSOC: micro-aggregates SOC; cSOC: Clay SOC. * Indicates significance at the 0.05 probability levels; ** Indicate significance at the 0.01 probability levels.
Agronomy 13 02533 g003
Figure 4. Structural equation modeling (SEM) was used to examine standard total effects on CMI for soil properties under different land use systems and soil types.
Agronomy 13 02533 g004
Table 1. Soil properties under different land-use systems and soil types.
Soil TypesMeadow SoilAlbic SoilANOVA
Land-Use SystemsGrasslandDrylandPaddyGrasslandDrylandPaddySTLUSST ×
LUS
BD (g cm−3)1.2 ± 0.3 Aa1.3 ± 0.2 Aa1.2 ± 0.2 Ba1.2 ± 0.3 Ab1.3 ± 0.0 Aa1.3 ± 0.1 Aabnsnsns
Clay (%)37.5 ± 7.2 Aa37.2 ± 5.6 Aa34.9 ± 6.5 Aa34.9 ± 6.4 Aa37.5 ± 4.0 Aa36.9 ± 5.5 Aansnsns
Silt (%)34.9 ± 9.3 Aa34.5 ± 7.5 Ba33.6 ± 4.6 Ba35.1 ± 4.3 Ab43.1 ± 1.0. Aa43.1 ± 2.6 Aa**nsns
Sand (%)27.6 ± 16.0 Aa28.2 ± 11.6 Aa31.5 ± 10.0 Aa30.0 ± 10.8 Aa19.3 ± 2.5 Ab19.1 ± 3.9 Bbnsns*
pH6.2 ± 0.4 Aa6.0 ± 0.5 Aa6.5 ± 0.7 Aa6.5 ± 0.3 Aa6.0 ± 0.2 Ab5.9 ± 0.2 Bbnsnsns
EC (μs/cm)68.1 ± 19.3 Ab88.1 ± 47.1 Ab147.9 ± 17.8 Aa75.2 ± 19.4 Aa122.2 ± 86.6 Aa96.4 ± 29.3 Bans**
Total N (g kg−1)2.8 ± 1.0Aa2.0 ± 0.3 Ab2.5 ± 0.9Aab2.4 ± 1.3 Aa2.3 ± 0.8 Aa2.0 ± 0.5 Bansnsns
AN (mg kg−1)98.7 ± 28.1 Aa75.4 ± 20.8 Aa85.8 ± 27.0 Aa81.2 ± 33.5 Aa868 ± 26.8 Aa69.9 ± 12.4 Bansnsns
NO3-N (mg kg−1)3.3 ± 1.9Ab23.4 ± 18.0 Aa3.4 ± 1.2Ab6.4 ± 3.3Aa21.7 ± 23.3 Aa4.6 ± 4.3 Aans**ns
NH4+-N (mg kg−1)10.6 ± 7.8Ab17.6 ± 6.3 Aa10.9 ± 3.3Ab8.6 ± 5.0Aa15.0 ± 12.0 Aa11.7 ± 2.1 Aans**ns
TP (g kg−1)0.8 ± 0.2Aa0.8 ± 0.2 Aa0.7 ± 0.2Aa0.6 ± 0.3Ab1.0 ± 0.3 Aa0.8 ± 0.1 Aabnsnsns
AP (mg kg−1)33.3 ± 18.1 Aa30.4 ± 14.9 Aa30.2 ± 18.1 Ba37.4 ± 46.6 Aa98.2 ± 78.7 Aa50.6 ± 27.2 Aa****
AK (mg kg−1)297.8 ± 99.5 Aa198.4 ± 57.3 Ab258.8 ± 82.5 Aab419.4 ± 163.2 Aa283.7 ± 99.0 Ab208.7 ± 76.8 Abns***
MBN (mg kg−1)395.1 ± 306.2 Aa98.2 ± 61.3 Ab210.6 ± 102.7 Ab292.1 ± 262.1 Aa139.2 ± 58.9 Ab144.3 ± 75.0 Abns**ns
Different uppercase and lowercase letters indicate significant differences among different soil types (t-test) and land-use systems (LSD), respectively. ST: Soil type; LUS: Land-use system; BD: Bulk density; TN: Total nitrogen; AN: Alkali-hydrolyzable nitrogen; NO3–N: Nitrate nitrogen; NH4+–N: Ammonium nitrogen; TP: Total phosphorus; AP: Available phosphorus; AK: Available potassium; MBN: Microbial biomass nitrogen; * Indicates significance at the 0.05 probability levels; ** Indicate significance at the 0.01 probability levels; “ns” Indicates no significance.
Table 2. Impact of land-use systems and soil types on soil aggregation.
Soil TypesLand Use Systems>2mm (%)2–0.25 mm (%)0.25–0.053 mm (%)<0.053 mm (%)MWD (mm)
Meadow soilGrassland69.9 ± 6.7 Aa16.4 ± 3.6 Aa9.4 ± 2.6 Ac4.3 ± 1.6 Ab3.7 ± 0.3 Aa
Dryland40.6 ± 13.2 Ac19.4 ± 3.8 Aa23.0 ± 6.5 Aa16.9 ± 8.8 Aa2.3 ± 0.7 Bc
Paddy61.0 ± 5.3 Ab17.7 ± 3.7 Aa12.9 ± 2.1 Bb8.3 ± 2.6 Bb3.3 ± 0.2 Ab
Albic soilGrassland63.8 ± 3.2 Aa18.4 ± 2.3 Aa11.1 ± 2.7 Ab6.9 ± 3.3 Aa3.4 ± 0.2 Aa
Dryland51.7 ± 5.7 Aa18.5 ± 4.6 Aab18.4 ± 2.4 Aa11.4 ± 2.5 Aa2.8 ± 0.3 Aa
Paddy51.2 ± 16.2 Ba15.5 ± 2.9 Ab17.0 ± 5.2 Aa16.3 ± 11.5 Aa2.8 ± 0.8 Ba
ANOVA
STnsnsnsnsns
LUS**ns*****
ST × LUS**ns******
Different uppercase and lowercase letters indicate significant differences among different soil types (ST) (t-test) and land-use systems (LUS), respectively. * Indicates significance at the 0.05 probability levels; ** Indicate significance at the 0.01 probability levels; “ns” Indicates no significance.
Table 3. Impact of land-use systems and soil types on organic carbon concentration in soil aggregate size classes.
Soil TypesLand Use Systems>2mm2–0.25 mm0.25–0.053 mm<0.053 mm
Meadow soilGrassland35.7 ± 4.9 Aa33.7 ± 4.3 Aa20.5 ± 2.8 Aa21.4 ± 5.2 Aa
Dryland24.6 ± 6.1 Ab23.0 ± 5.2 Ab18.2 ± 4.2 Ab15.0 ± 3.2 Ab
Paddy28.7 ± 9.2 Ab28.3 ± 8.9 Ab19.5 ± 6.2 Ab14.8 ± 4.7 Ab
Albic soilGrassland28.5 ± 2.9 Aa26.8 ± 2.1 Ba20.5 ± 2.8 Aa16.2 ± 1.4 Aa
Dryland22.9 ± 5.8 Aab21.2 ± 5.6 Aab14.5 ± 4.2 Ab10.8 ± 3.3 Bb
Paddy20.7 ± 4.8 Bb20.7 ± 4.0 Bab12.6 ± 3.0 Bb8.5 ± 2.2 Bb
ANOVA
ST******
LUS******
ST × LUSnsnsnsns
Different uppercase and lowercase letters indicate significant differences among different soil types (t-test) and land use systems (LSD), respectively. * Indicates significance at the 0.05 probability levels; ** Indicate significance at the 0.01 probability levels; “ns” Indicates no significance.
Table 4. Impact of land-use systems and soil types on carbon management index.
Soil TypesLand use SystemsCarbon Pool IndexLability IndexLability of CCarbon Management Index
Meadow soilGrassland0.75 ± 0.11 Aa0.81 ± 0.32 Aa0.52 ± 0.25 Aa63.4% ± 30.3% Aa
Dryland0.50 ± 0.11 Ab0.58 ± 0.16 Ab0.67 ± 0.40 Aa29.1% ± 10.0% Ab
Paddy0.61 ± 0.19 Aab0.80 ± 0.29 Aa0.72 ± 0.27Aa53.0% ± 32.1% Aa
Albic soilGrassland0.83 ± 0.07 Aa0.53 ± 0.11 Aa0.24 ± 0.03 Ab44.7% ± 13.1% Aa
Dryland0.69 ± 0.17 Aab0.96 ± 0.40 Aa0.74 ± 0.27 Aa71.1% ± 45.1% Aa
Paddy0.61 ± 0.13 Ab0.81 ± 0.31 Aa0.72 ± 0.27Aa52.4% ± 28.4% Aa
ANOVA
STnsnsnsns
LUS*nsns*
ST × LUSns**ns
Different uppercase and lowercase letters indicate significant differences among different soil types (t-test) and land-use systems (LSD), respectively. * Indicates significance at the 0.05 probability levels; “ns” Indicates no significance.
Disclaimer/Publisher’s Note: The statements, opinions and data contained in all publications are solely those of the individual author(s) and contributor(s) and not of MDPI and/or the editor(s). MDPI and/or the editor(s) disclaim responsibility for any injury to people or property resulting from any ideas, methods, instructions or products referred to in the content.

