Article

Effects of Substituting B with FR and UVA at Different Growth Stages on the Growth and Quality of Lettuce

College of Horticulture, South China Agricultural University, Guangzhou 510642, China
*
Author to whom correspondence should be addressed.
Agronomy 2023, 13(10), 2547; https://doi.org/10.3390/agronomy13102547
Submission received: 23 August 2023 / Revised: 23 September 2023 / Accepted: 28 September 2023 / Published: 3 October 2023

Abstract

:
This study investigated the effects of substituting B with FR and UVA (50 μmol·m−2·s−1) at two growth stages on the growth and quality of loose-leaf lettuce (cv. Fangni). The basal light was red and blue LEDs at 250 μmol·m−2·s−1. At stage I (the first 10 days of 20-day pre-harvest), there were three treatments: B substituted by FR (FR); B substituted by UVA (UVA); and no substituting (CKI). At stage II (next ten days after stage I), there were 9 treatments: FF (FR + FR), UF (UVA + FR), BF (B + FR), FU (FR + UVA), UU (UVA + UVA), BU (B + UVA), FB (FR + B), UB (UVA + B), and B + B (CKII). At stage I, compare with UV-A and CKI, the shoot fresh weight, leaf area, leaf width, leaf length, and vitamin C content highly increased under far-red light (FR), whereas specific leaf weight and the chlorophyll contents significantly decreased by FR. In CKI, nitrate contents and the antioxidant capacity (FRAP, DPPH) were significantly higher than in FR and UVA. At stage II, higher leaf width, leaf length, leaf area, and shoot fresh and dry weight were observed in FF, UF, and BF. The lowest biomass was shown in CKII. Higher chlorophyll contents were found in FU and FB. The soluble sugar contents significantly increased by all treatments. In addition to UB and BU, soluble protein contents increased by other treatments. There were higher vitamin C contents in UU, UB, and CKII. Large amounts of nitrates accumulated under CKII. The higher antioxidant capacity (DPPH, FRAP) was found in FB and CKII. The highest flavonoid content was found in UB, and higher polyphenols contents were found in UB and BU. In this study, substituting B with FR at 2 stages were the best way to increase lettuce biomass. The optimal measure to both increased lettuce nutrition quality and biomass was FB at stage II.

1. Introduction

With the population continuing to increase and extreme climate intensifying, the protected cultivation of vegetables is taking on a new strategic role [1,2,3]. Light is a predominant factor in determining plant growth for protected vegetables, especially in artificial light plant factory (ALPF). Moreover, light is the primary energy source for plants, and the photosynthetically active radiations (PAR) defined is 400–700 nm, hence, most studies of plant photosynthesis and growth focused on this wavelength range [4,5,6].
FR (700–800 nm) is not within PAR, nevertheless, some researches confirmed that FR was essential for efficient photosynthesis [5,7,8]. In addition, the impacts of FR on plant morphogenesis and biomass accumulation have been widely investigated in recent years. In lettuce, the leaf area, plant canopy, and biomass improved by supplemental FR [9,10]. Kale morphological and canopy photosynthesis was synergistically improved by increased FR fraction under white and red light-emitting diodes (LEDs), thus biomass increased [11]. On the contrary, most studies indicated lower contents of chlorophyll and nutrition in plants uninterrupted exposed to FR. In Chinese kale, the contents of phytochemicals (glucosinolates, anthocyanins, total phenols, total flavonoids, and Vc) decreased by 12 days FR treatment [12]. Similarly, the contents of chlorophyll and anthocyanin in lettuce and basil seedlings decreased by 9 days and 12 days FR treatments [13].
UVA (320–400 nm) is also not within PAR, but more and more researches found the improved impacts of UV-A on the growth and nutrition accumulation of various vegetable species. UVA supplementation yielded higher contents of chlorophyll, soluble protein, soluble sugar, vitamin C, flavonoid, and polyphenol in lettuce [14]. Higher contents of glucosinolates and antioxidants were found in Chinese kale and kale under UVA supplementation [15,16]. The stimulating effect of UVA on vegetable nutrition accumulation was correlated to UVA doses and the time exposure to UVA. In kale, the highest contents of soluble sugar, total flavonoids, and indolic glucosinolates were observed by supplemental 12 μmol·m−2·s−1 UVA [17].
The light intensity and quality demand varied for different growth stages of vegetables. In lettuce, 16% or 13% increases in dry weight were observed with gradually increasing photosynthetic photon flux density (PPFD) during cultivation compared to treatments with decreasing or constant PPFD [18]. In lettuce, the nutritional quality and the shelf life improved by 5 days of 470 μmol m−2 s−1 before harvest [19]. In addition, supplemental green radiation was more beneficial for red lettuce seedlings’ growth, and supplemental green radiation after increased blue exposure was most favorable for growth of mature red lettuce [20].
The effects of either constant light or supplemental non-PAR radiation on the vegetable growth and quality are well reported. However, the studies about changing light supplementation according to vegetavive growth stages are fewer. Lettuce (Lactuca sativa L.) is an important leafy vegetable worldwide owing to its nutritional quality and crisp taste. There were pronounced effects on higher contents of macro and micronutrient in lettuce leaves under the blue light component’s dynamic flux [21]. In this study, keeping Yield Photon Flux Density (YPFD) constant, the growth and quality of lettuce were measured under UVA, FR instead of B at different stages, to investigate the suitable light strategy for lettuce in ALPF.

2. Materials and Methods

2.1. Plant Material and Cultivation Conditions

This study was conducted in an ALPF at South China Agricultural University (East longitude 113.36°, north latitude 23.16°). On 17 February 2022, loose-leaf Lettuce seeds (Lactuca sativa L. ‘Fangni’ from Beijing Dingfeng Modern Agricultural Development Company., Beijing, China) were sown into moist sponge blocks in nursery plates (95 × 60 × 3 cm, 216 seeds/plate) and then placed in a dark chamber for 2 days. The germinated seedlings with plate were transferred in deep flow technique (DFT) systems containing 1/2 strength Hoagland nutrient solution at ALPF. And seedlings cultured under 250 μmol·m−2·s−1 PPFD white LEDs with 12 h light/dark period (6:00–18:00), the temperature was 24 ± 2 °C, and 65–75% relative humidity, EC ≈ 1.8 ms·cm−1, pH ≈ 6.4. After three weeks, the seedlings with three expanded true leaves were transplanted into the polyethylene plate (95 × 60 × 3 cm, 24 plants/plate) in DFT for light treatments.

2.2. Light Treatments

The light sources were adjustable LED panels (Chenghui Equipment Co., Ltd., Guangzhou, China; 150 × 30 cm). This experiment involved three light treatments and two growth stages. At stage I (20 days before harvesting), the plants were grown under three light treatments: red and blue LEDs at a ratio of 3:2 with 250 ± 10 μmol·m−2·s−1, representing the basal light or control (CKI); substitute 50 ± 5 μmol·m−2·s−1 B in basal light with 50 ± 5 μmol·m−2·s−1 FR radiation (FR); substitute 50 ± 5 μmol·m−2·s−1 B in basal light with 50 ± 5 μmol·m−2·s−1 UVA radiation (UVA), keep YPFD 250 ± 10 μmol·m−2·s−1 constant (Table 1). And at stage II (10 days before harvesting), the light treatments were interchangeably combined, resulting in nine different treatment combinations: FF, UF, BF, FU, UU, UB, FB, UB, BB (Table 2).

2.3. Biometric Measurements

Eight plants in each treatment were randomly selected and destructively determined at 10 and 20 days after treatment, respectively. The fresh weights of shoots and roots were measured by an electronic balance immediately after harvest. Then shoots and roots were oven-dried for 48 h at 75 °C for dry weight determination. The expanded leaves’ length, width, and total leaf area were determined by software (ImageJ 1.8.0, National Institutes of Health, Bethesda, MD, USA). Specific leaf weight was calculated as the ratio of leaf dry weight to leaf area. 12 fresh shoots of lettuce per treatment (4 plant/replicate, 3 replicates/treatment) were immediately frozen in liquid nitrogen and stored at −80 °C until nutritional analysis.

2.4. Phytochemical Determination

2.4.1. Chlorophyll (Chl) and Carotenoid Contents

A mixture of acetone and ethanol (8 mL) was used to homogenize 0.2 g of freshly expanded lettuce leaves. The mixture was then kept at 25 °C in the dark until the tissue turned white. The absorbance at 663 nm (A663), 645 nm (A645), and 440 nm (A440) were each measured using the UV-spectrophotometer (Shimadzu UV-16A, Shimadzu, Corporation, Kyoto, Japan).The formulas were used to calculate pigments contents [22] as follows:
Chl a content (mg/g FW) = (12.70 × A663 − 2.69 × A645) × 8 mL/(1000 × 0.2 g);
Chl b content (mg/g FW) = (22.90 × A645 − 4.86 × A663) × 8 mL/(1000 × 0.2 g);
Chl a + Chl b content (mg/g FW) = (8.02 × A663 + 20.2 × A645) × 8 mL/(1000 × 0.2 g);
Carotenoid content (mg/g FW) = (4.7 × A440 − 2.17 × A663 − 5.45 × A645) × 8 mL/(1000 × 0.2 g).

2.4.2. Soluble Sugar Content

Anthrone-sulfuric acid colorimetry was used to assess the amount of soluble sugar [23]. A test tube containing 10 mL of 80% ethanol and 0.5 g of frozen fresh tissue was placed in an 80 °C water bath for 40 min. A funnel with two filter sheets was used to filter the solution. The complete filtered solution was collected in a 10 mL volumetric flask, cooled to 25 °C, and then 80% ethanol was added until the volume was 10 mL. Add 2.5 mL of 80% ethanol solution to the filtrate and continue in a water bath at 80 °C for 40 min. Repeat three times. Later, 5 mL of concentrated sulfuric acid, 0.8 mL of distilled water, and 0.2 mL of the filtered solution were combined and added to boiling water for 10 min.

2.4.3. Soluble Protein Content

Coomassie brilliant blue G-250 staining was used to determine the amount of soluble protein [24]. After mixing 0.5 g of frozen fresh plant tissue with 8 mL of distilled water, the mixture was centrifuged at 986 g for 10 min at 4 °C. The UV spectrophotometer was used to measure the absorbance at 595 nm after 0.2 mL of supernatant, 0.8 mL of distilled water, and 5 mL of Coomassie brilliant blue G-250 solution (0.1 gL) were combined for 10 min.

2.4.4. Nitrate Content

UV spectrophotometry was used to calculate the nitrate content [25]. 10 mL of distilled water were used to soak 1 g of frozen fresh plant tissue before it was cooked in a boiling water bath for 30 min. Deionized water was used to dilute the filtrate to a final volume of 25 mL. Following that, 0.1 mL of the extract was combined with 0.4 mL of the 5% salicylic acid-H2SO4 reagent. After 10 min of incubation, 8% NaOH (9.5 mL, w:v) was applied. A UV spectrophotometer was then used to measure the absorbance at 410 nm.

2.4.5. Vitamin C Content

The amount of vitamin C was measured using molybdenum blue spectrophotometry [26]. In order to homogenize 0.5 g of frozen fresh tissue, 25 mL of a 0.05 mol/L solution of oxalic acid was used. Then, a funnel with two filter sheets was used to filter the solution. Following that, 10 mL of supernatant was combined with 1 mL of a 5% metaphosphoric acid solution, 2 mL of a 5% sulfuric acid solution, and 4 mL of a 5% ammonium molybdate solution. Using oxalic acid as a blank, the supernatants were measured at 705 nm by UV spectrophotometer after being thoroughly mixed and kept still for 15 min.

2.4.6. Polyphenol Content

The Folin-Ciocalteu test was used to calculate the polyphenol content [27]. Fresh tissue that had been frozen (0.5 g) was extracted using 8 mL alcohol. The homogenate was centrifuged at 986 g for 10 min at 4 °C after standing for 30 min. The supernatant (1 mL) was next combined with 0.5 mL Folin phenol, 11.5 mL 26.7% sodium carbonate, and 7 mL dilution water. A UV spectrophotometer was used to detect the absorbance at 510 nm.

2.4.7. Flavonoid Content

An aluminum nitrate technique was used to determine the flavonoid content [28]. In a 10 mL test tube, a 1 mL sample extract that had been extracted using the same procedure as polyphenols was combined for 5 min with a 0.7 mL solution of 5% sodium nitrite. The mixture was then given 0.7 mL of 5% aluminum nitrate and left for 6 min. At a temperature of 25 °C, a total of 5 mL of 5% sodium hydroxide solution was added. A UV spectrophotometer was used to detect the absorption at 510 nm.

2.4.8. DPPH Radical-Scavenging Rate

Following Tadolini [29], the radical-scavenging rate of 2,2-diphenyl-1-picrylhydrazyl (DPPH) was determined. The absorbance of the combination at 517 nm was measured using a UV spectrophotometer after the sample extract (2 mL), which was extracted using the same procedure for polyphenols, was combined with 2 mL of DPPH solution (0.0080 g DPPH in 100 mL alcohol).

2.4.9. Ferric-Reducing Antioxidant Power

Following Benzie and Strain [30], the ferric-reducing antioxidant power (FRAP) was ascertained. The sample solution (0.4 mL), which was extracted using the same procedure as for polyphenols, was combined for 10 min at 37 °C with 3.6 mL of a solution containing 0.3 mol·L−1 of acetate buffer, 10 mmol L of 2,4,6-tripyridyl-S-triazine (TPTZ), and 20 mmol L−1 of FeCl3. A UV spectrophotometer was used to measure the FRAP at 593 nm.

2.5. Statistical Analysis

Data were shown as means of three treatments. Analyses of variance (ANOVA) followed by Duncan’s multiple range test were conducted using SPSS 17.0 (SPSS Inc., Chicago, IL, USA). The figures were made by Origin 9.0 (Origin Lab, Northampton, MA, USA). The PCA was analyzed by Origin 2021 (Origin Lab, Northampton, MA, USA).

3. Results

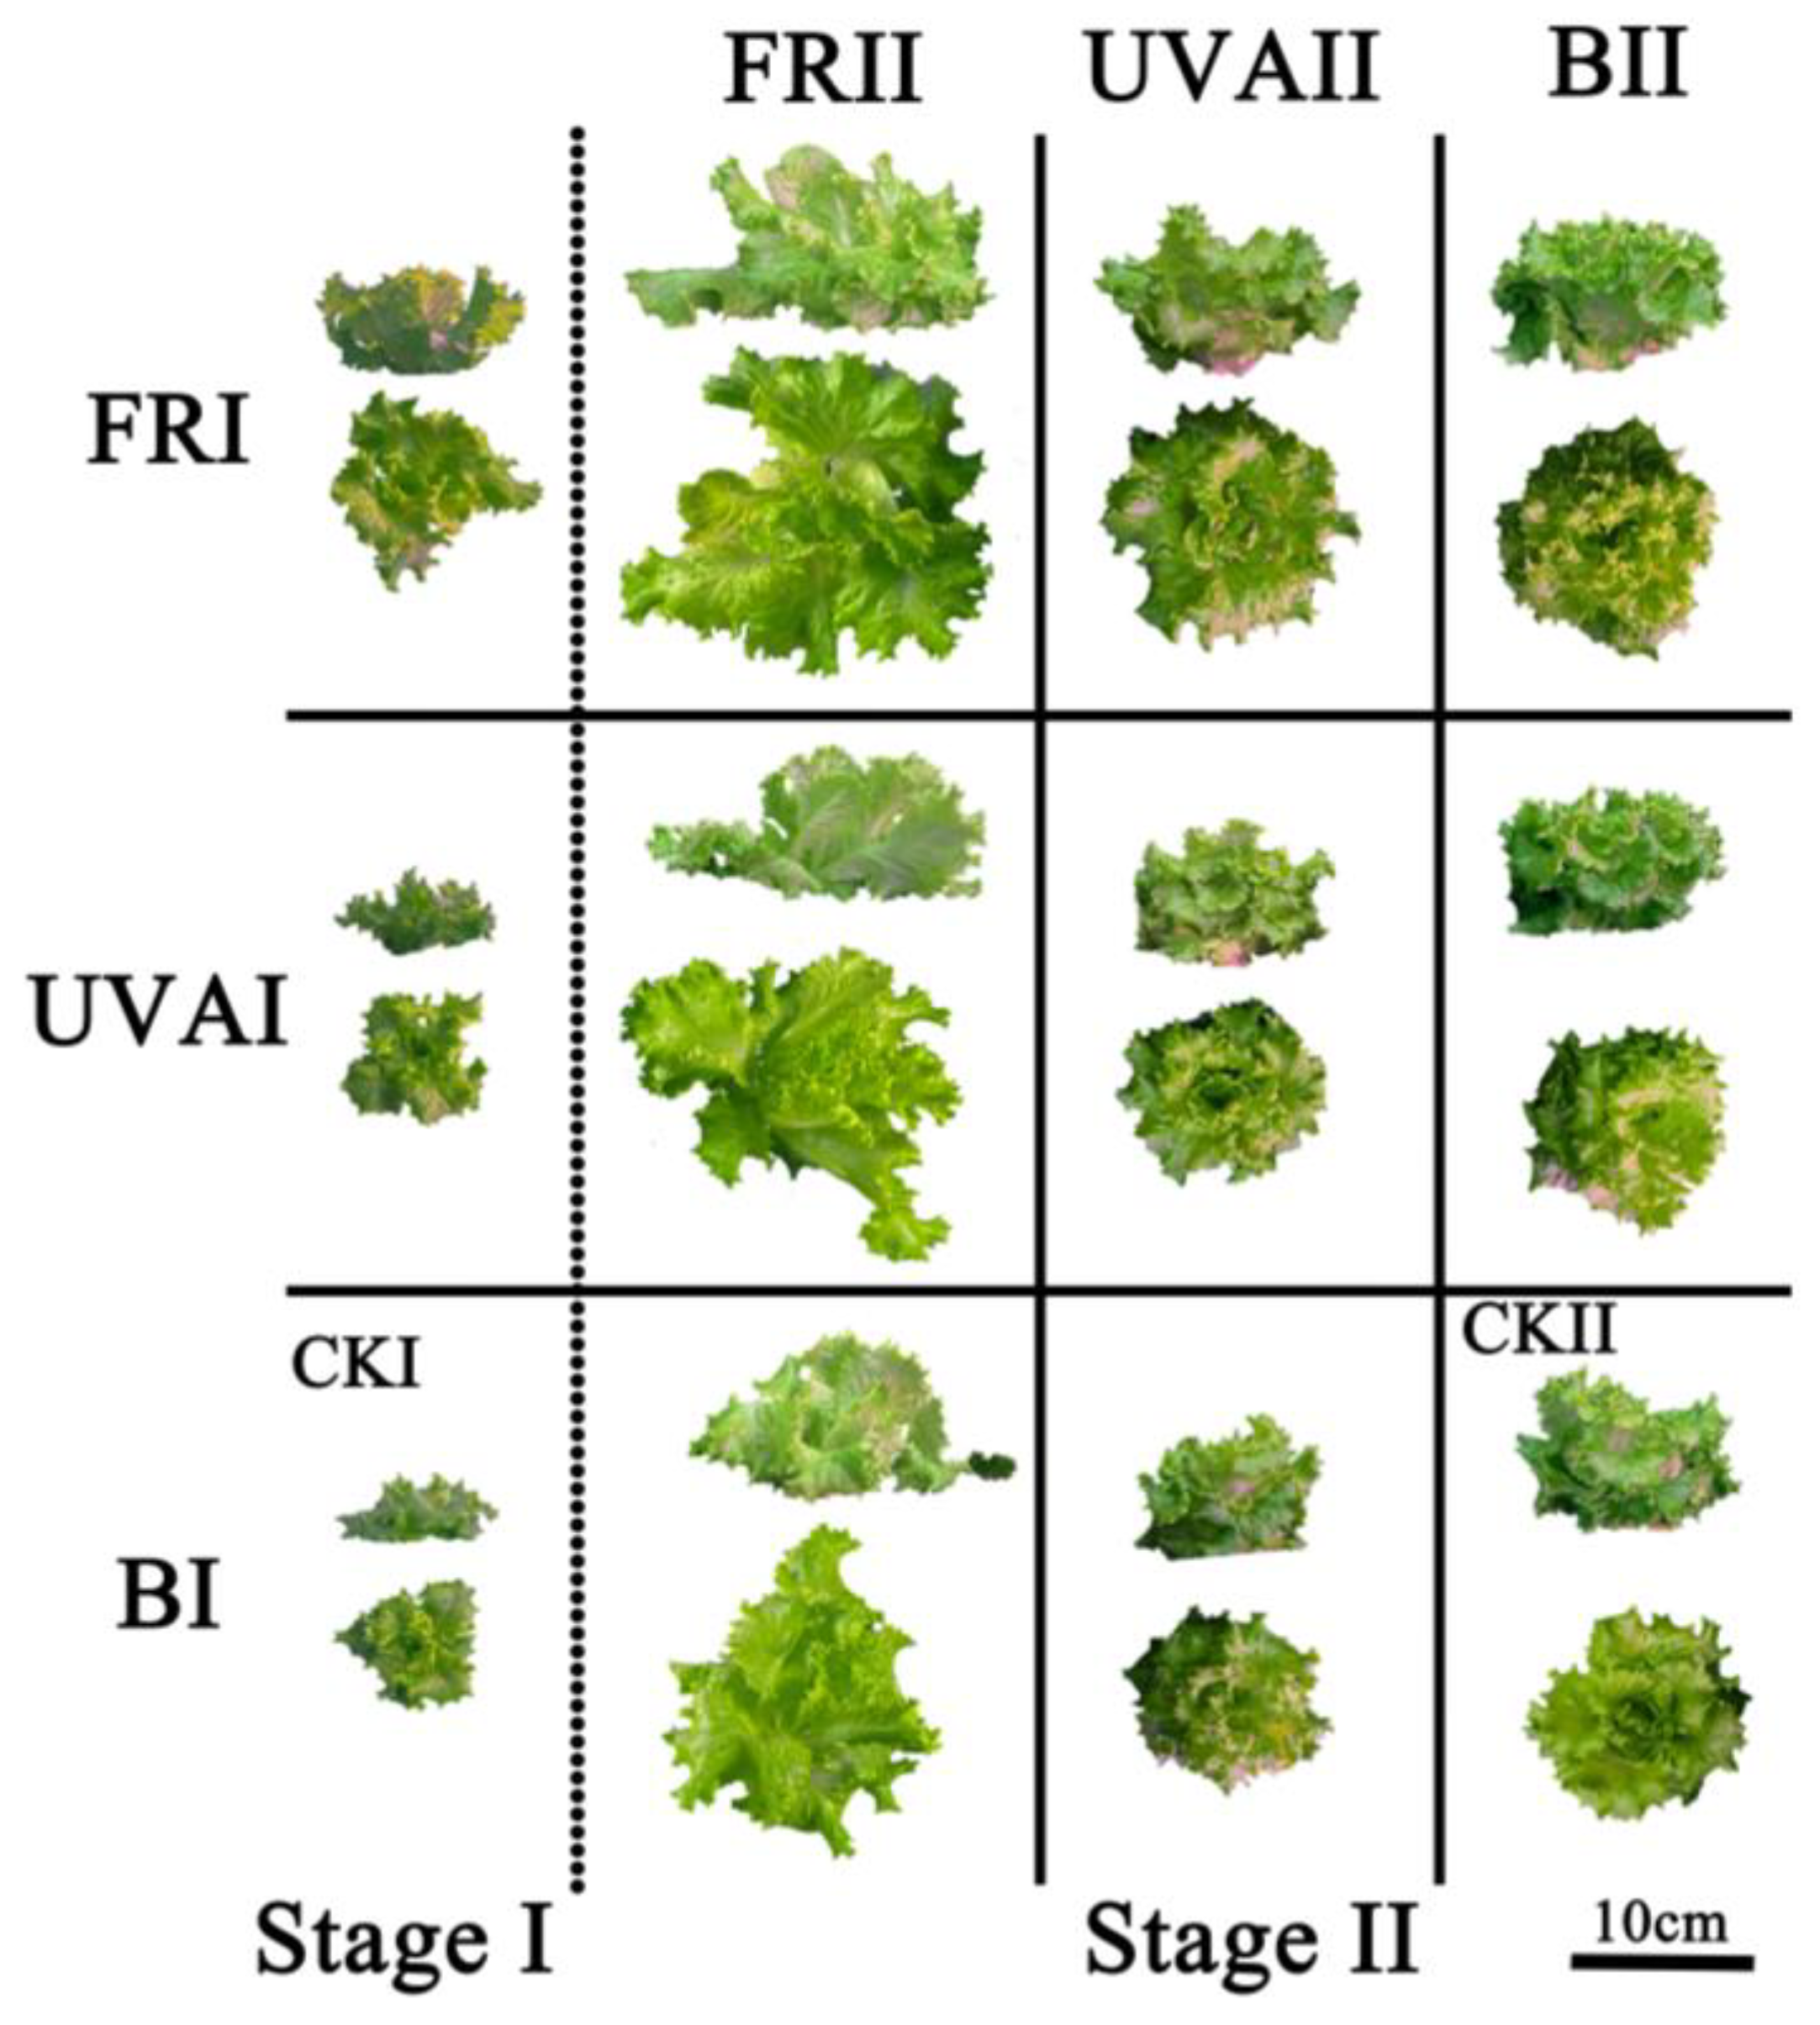
3.1. Growth and Biomass

The growth and biomass of lettuce were affected by substituting B with FR and UVA at 2 growth stages (Figure 1). At stage I, the leaf width, leaf length, leaf area, and shoot fresh weight of lettuce significantly increased 24.23%, 30.43%, 54.23%, and 40.01% by FR, respectively. However, the specific leaf weight remarkably decreased 24.72% by FR (Table 3). No significant differences were observed between UVA and CKI (Table 3). Although the specific leaf weight decreased by substituting B with FR at stage I, but biomass accumulation increased. And no significant growth differences were found between UVA and CKI.
At stage II, the lowest shoot fresh weight, shoot dry weight, root fresh weight, and leaf width were shown in CKII. The shoot fresh weight significantly improved by all treatments except BU and UB, and the most increase (49.49%) was found in FF, 47.56% and 38.70% increase in UF and BF, respectively (Table 3). Similarly, except BU, significant increases in shoot dry weight were observed in other treatments, and the most increase (53.6%) was in FF, and 41.83% increase in UF and BF. Moreover, higher leaf area, leaf length, and leaf width were observed in FF, UF and BF. The leaf area significantly increased 44.72%, 36.86%, and 49.42% by FF, UF, and BF, respectively, while no significant differences were observed in other treatments. For leaf length, 22.64%, 30.02%, and 29.07% remarkable increases shown in FF, UF, and BF, respectively, however 6.67% and 6.20% significant reduction shown in FB and UB. Except for BU and UB, the leaf width noticeably increased 20.35%, 15.32%, 23.96%, 9.08%, 20.9% and 7.33% by FF, UF, BF, FU, UU, and FB, respectively. Besides, the root fresh weight was greatly improved 30.5%, 30.22%, and 47.36% by FF, FU, and FB, respectively. The root dry weight increased by FF (29.03%) and FB (45.51%). For specific leaf weight, 19.67%, 12.57%, 15.85%, 38.25% and 18.03% noticeable increases shown in FU, UU, BU, FB, and UB, respectively, while no significant differences were observed in other treatments and CKII (Table 3). Substituting B with FR and UVA in growth stages improved lettuce growth. More increases in shoot fresh weights, shoot dry weights, leaf widths, leaf lengths, and leaf areas were found in the substituting B with FR treatments at stage II (FF, UF, BF), and more increases in root fresh weights and root dry weights were found in the substituting B with FR treatments at stage I (FF, FU, FB). Higher specific leaf weights exhibited in FU, FB, and UB.

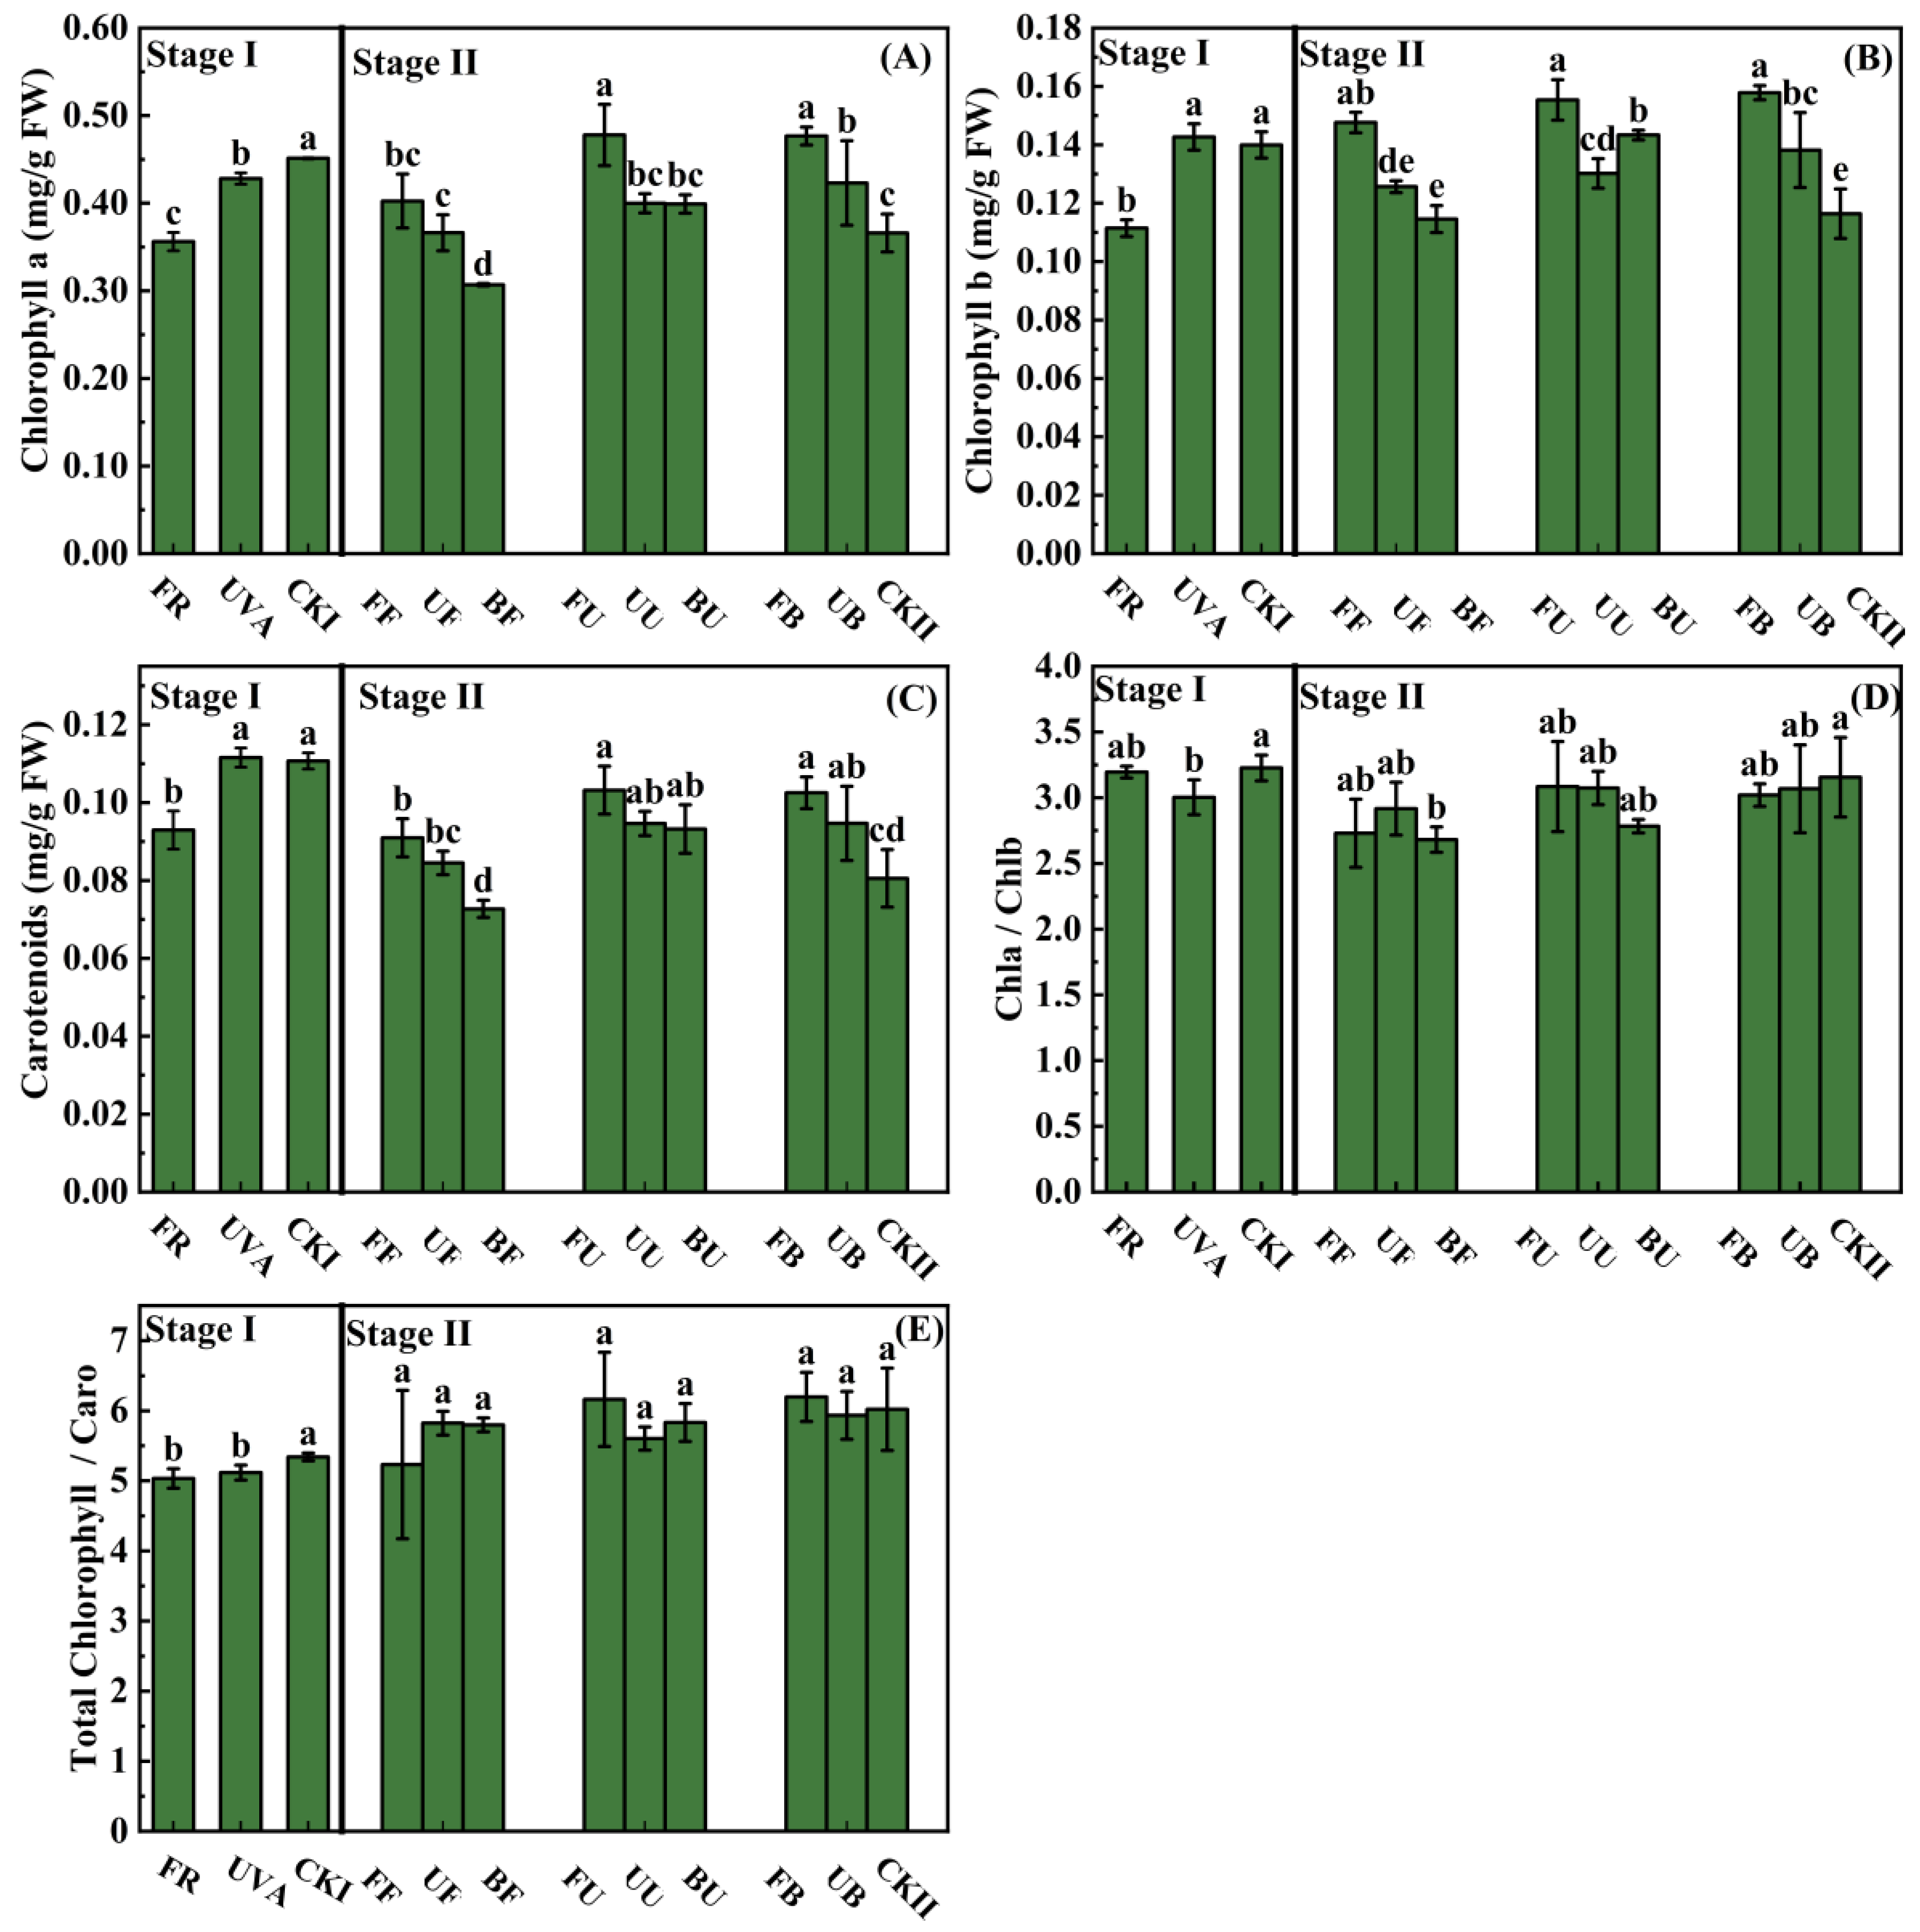
3.2. Photosynthetic Pigment Contents

At stage I, the contents of chlorophyll a, chlorophyll b, carotenoid and the total chlorophyll/carotenoids ratio in lettuce significantly decreased 21.01%, 20.36%, 16.03%, and 5.74% by FR, respectively (Figure 2A–C,E). While no significant difference in chlorophyll a/chlorophyll b were found in FR and CKI (Figure 2D). Besides, the chlorophyll a content, as well as the ratios of chlorophyll a/chlorophyll b and total chlorophyll/carotenoids, significantly decreased 5.12%, 6.91% and 4.19% by UVA (Figure 2A,D,E). However, there were no significant differences between contents of chlorophyll b and carotenoid were detected in UVA and CKI (Figure 2B,C). Thus, Substituting B with FR at stage I decreased the photosynthetic pigment contents and the total chlorophyll/carotenoids ratio. Substituting B with UVA at stage I resulted in a decrease in the chlorophyll a content, as well as the ratios of chlorophyll a/chlorophyll b and total chlorophyll/carotenoids.
At stage II, the chlorophyll a content highly increased 30.56%, 30.23%, and 15.60% by FU, FB, and UB, respectively, whereas noticeably decreased 16.16% by BF (Figure 2A). Lower chlorophyll b contents were found in UF, BF, and CKII, while 26.85%, 33.47%, 11.85%, 23.17%, 35.61%, and 18.37% increases were found in FF, FU, UU, BU, FB, and UB, respectively (Figure 2B). Similarly, lower carotenoid contents were observed in UF, BF and CKII, while 12.97%, 28.13%, 17.51%, 15.74%, 27.32% and 17,57% significantly increases were observed in FF, FU, UU, BU, FB, and UB, respectively (Figure 2C). The chlorophyll a/chlorophyll b ratio significantly decreased 15.05% by BF, while no significant differences were found in total chlorophyll/carotenoids ratio. Thus, except UF and BF, substituting B with FR and UVA at stages (FF, FU, UU, BU, FB, UB) promoted photosynthetic pigments accumulation. BF decreased chlorophyll a/chlorophyll b ratio.

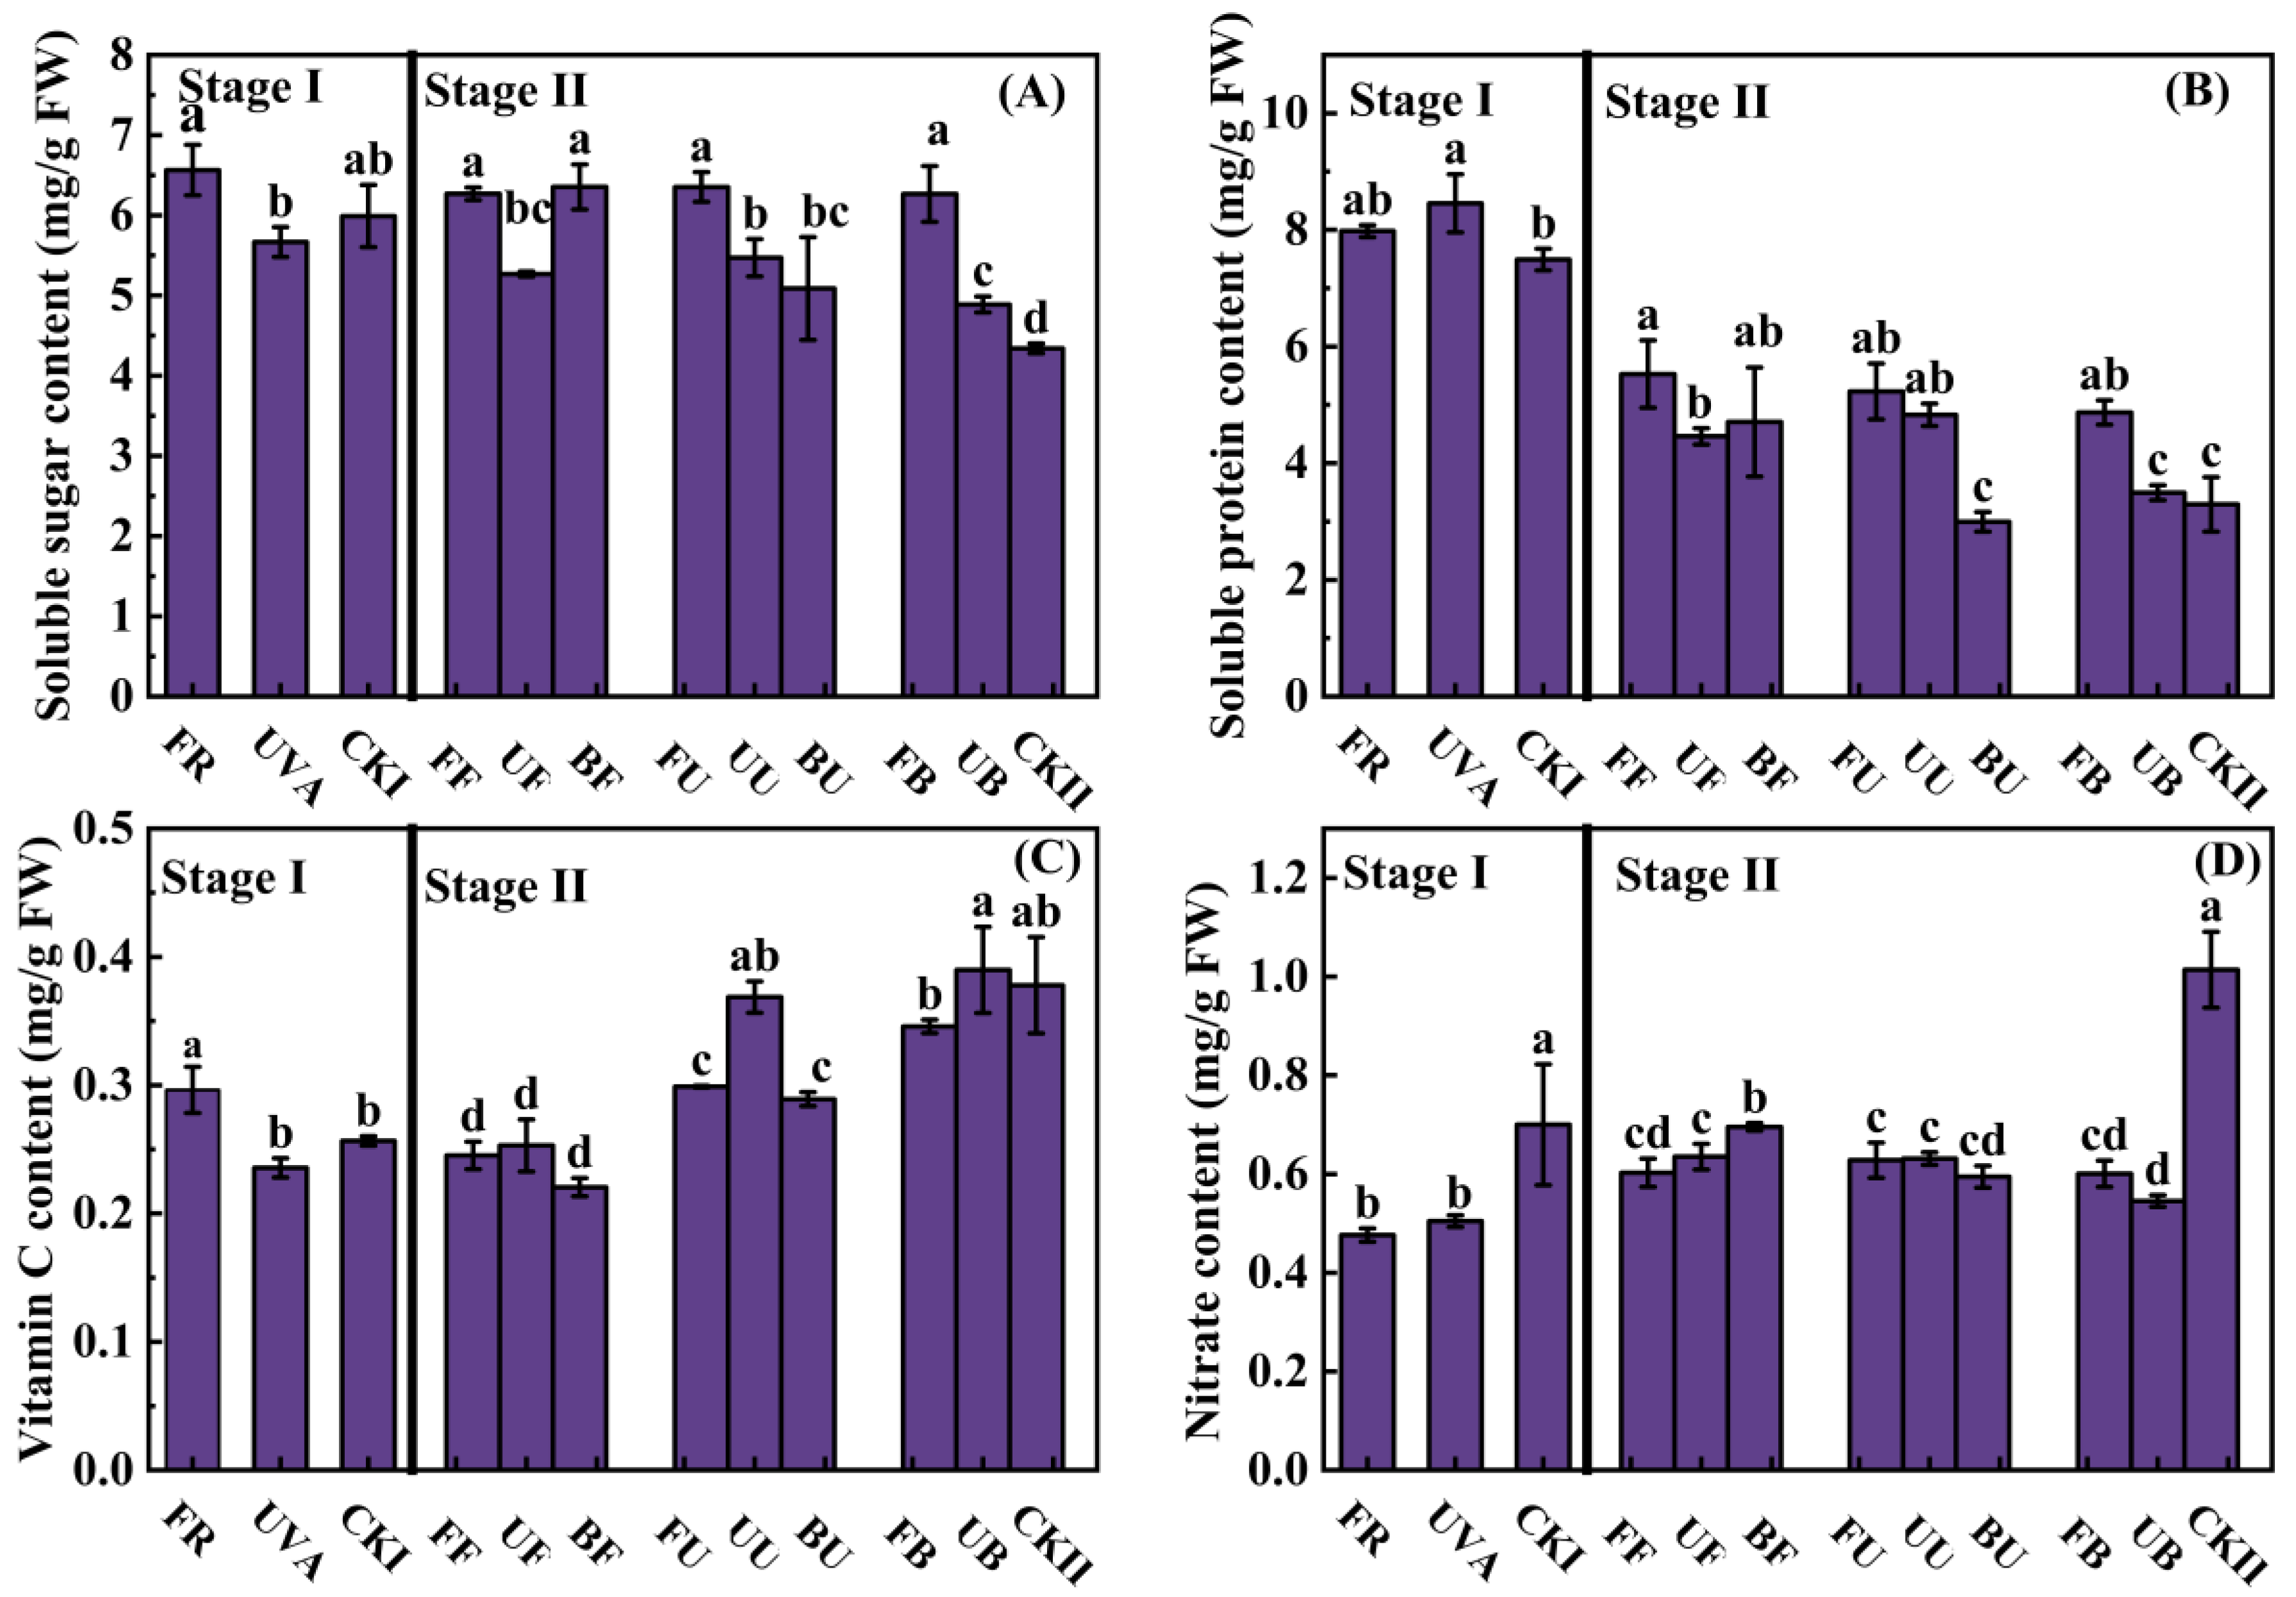
3.3. The Contents of Soluble Sugar, Soluble Protein, Vitamin C, and Nitrate

At stage I, the lowest soluble sugar content was shown in the UVA, no significant differences were found between CKI and FR (Figure 3A). The soluble protein content increased 12.88% by UVA (Figure 3B). Vitamin C content increased 15.48% by FR (Figure 3C). The nitrate content enormously decreased 31.93% and 27.92% by FR and UVA (Figure 3D). Hence, substituting B with FR at stage I increased vitamin C content, substituting B with UVA at stage I increased soluble protein content, and both of them decreased nitrate content.
At stage II, the soluble sugar content significantly increased 44.46%, 21.35%, 46.42%, 46.4%, 26.04%, 17.22%, 44.42% and 12.63% by FF, UF, BF, FU, UU, BU, FB and UB respectively (Figure 3A). Similarly, the soluble protein content significantly increased 67.53%, 35.19%, 42.66%, 58.5%, 46.31%, and 47.56% by FF, UF, BF, FU, UU and FB, respectively (Figure 3B). While higher contents of vitamin C and nitrate were found in CKII (Figure 3C,D). The vitamin C content decreased 35.46%, 33.42%, 41.98%, 21.35%, and 23.91% by FF, UF, BF, FU and BU, respectively (Figure 3C). The nitrate content sharply decreased 40.33%, 37.11%, 31.14%, 37.83%, 37.49%, 41.14%, 40.54% and 46%, by FF, UF, BF, FU, UU, BU, FB and UB respectively (Figure 3D). Thus, substituting B with FR and UVA increased soluble sugar contents. Except BU and UB, substituting B with FR and UVA (FF, UF, BF, FU, UU, FB) at stage II increased soluble protein content. While substituting B with FR and UVA largely reduced nitrate content. Except UU and UB, substituting B with FR and UVA at stage reduced vitamin C content, and more reduction were observed in the treatments of substituting B with FR at stage II (FF, UF, BF).

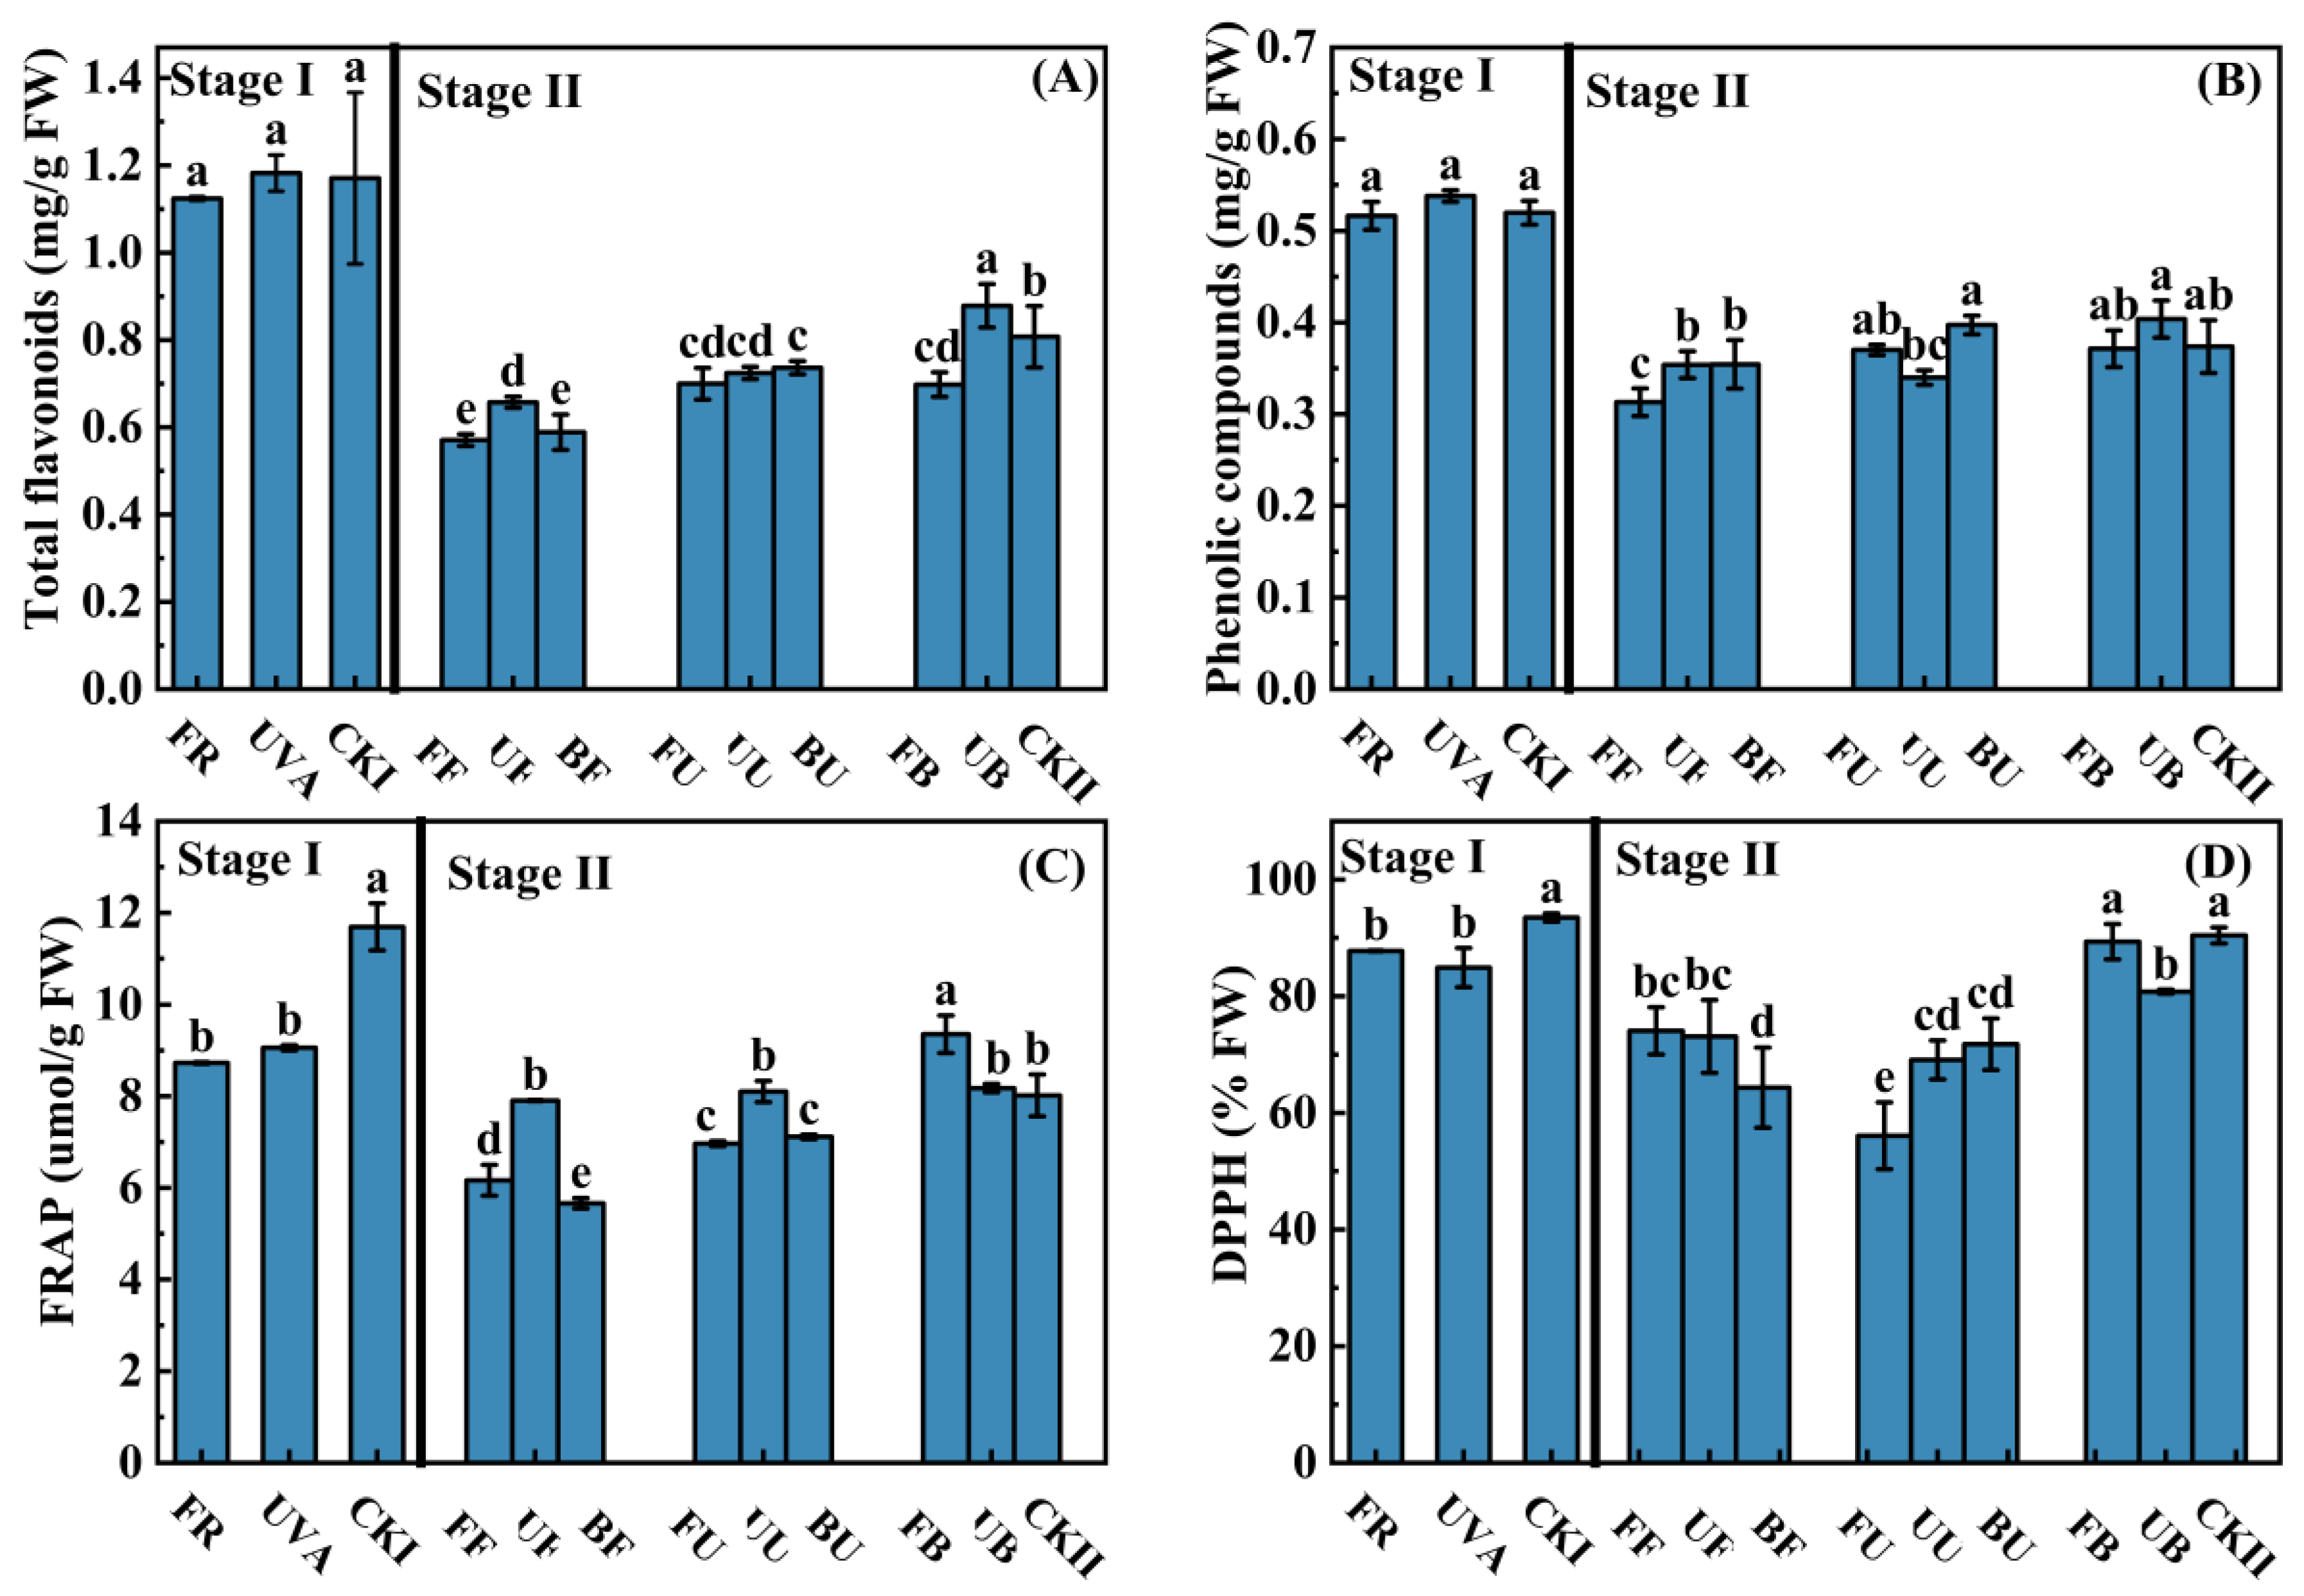
3.4. Antioxidant Content and Capacity

The antioxidant contents and capacity in lettuce were affected by FR and UVA. At stage I, there was no significant differences in the contents of total flavonoid and phenolic compounds among treatments. The highest antioxidant capacity was shown in CKI. The FRAP highly decreased 25.37% and 22.55%, DPPH decreased 6.14% and 9.2%, by FR and UVA, respectively (Figure 4A,B). Substituting B with FR and UVA at stage I reduced lettuce antioxidant capacity.
At stage II, total flavonoids content significantly increased 8.8% by UB, while significantly reduced 29.34%, 18.61%, 27.12%, 13.34%, 10.29%, 8.77%, and 13.57% by FF, UF, BF, FU, UU, BU, and FB (Figure 4A). The phenolic compounds content significantly decreased 16.24% by FF (Figure 4B). The FRAP increased 16.65% by FB, but reduced 23.12%, 29.37%, 13.14%, and 11.27% by FF, BF, FU, and BU, respectively (Figure 4C). The DPPH significantly decreased 17.87%, 18.95%, 28.68%, 37.83%, 23.4%, 20.42%, and 10.42% by FF, UF, BF, FU, UU, and BU, respectively (Figure 4D). Thus, substituting B with FR at stage II reduced the antioxidant content and antioxidant capacity.

3.5. Correlation Analysis and Comprehensive Analysis

The correlation between growth and nutritional characters of lettuce and the clustering among treatments were visualized by heat maps and principal component analysis (PCA).
At stage I, higher phytochemical contents and lower biomass were observed in UVA and CKI, whereas, lower phytochemical contents and higher biomass were observed in FR (Figure 5A,B). There was positively correlation among soluble protein (SP), total phenolic compounds (TPC), shoot dry weight (SDW), total flavonoids (TF), chlorophyll a (Chla), carotenoids (Caro), chlorophyll b (Chlb). And there were positively correlations among soluble sugar (SS), vitamin C (VC), leaf width (LW), leaf length (LL), 1/nitrate, root fresh weight (RFW), shoot fresh weight (SFW), and leaf area (LA), and among specific leaf weight (SLW), root dry weight (RDW), DPPH, FRAP total chlorophyll/carotenoids and chlorophyll a/chlorophyll b. Whereas, negative relationships were seen between phytochemical contents and biomass (Figure 5A,B).
At stage II, FF, UF, BF treatments were in one cluster, with higher growth, biomass and lower phytochemical contents. While, BU, UB, UU were in another cluster, close to CKII, with lower growth, biomass and higher phytochemical contents. Additionally, FB and FU also in a cluster were positioned between these two clusters (Figure 5C). There was positive relation observed among shoot fresh weight, shoot dry weight, root fresh weight, leaf length, and root dry weight. Similarly, there were positive correlations among total phenolic compounds, total chlorophyll/carotenoids, DPPH, FRAP, chlorophyll a/chlorophyll b, VC, and total flavonoids, and among leaf area, leaf width, soluble protein, soluble sugar, 1/nitrate, carotenoid, chlorophyll a, chlorophyll b and specific leaf weight (Figure 5C,D).
According to the result of PCA, a comprehensive score model formula [31] was constructed to comprehensively analyze the growth and the quality of lettuce under different treatments (As nitrate is a negative growth quality indicator, 1/nitrate was used for PCA analysis [32]). The formula is as follows:
Score = PC1·Y1 + PC2·Y2 + PC3·Y3.
At stage I, PC1, PC2, and PC3 explained 46.15%, 24.35%, and 10.21%, accounting for approximately 80.7% of the cumulative variance, respectively (Figure 4B; Table 4). Ranking based on comprehensive score, the optimal treatment was FR. At stage II, PC1, PC2, and PC3 explained 39.57%, 27.56%, and 7.31% and account for approximately 74.44% of the cumulative variance, respectively (Figure 4D; Table 4). According to the comprehensive score, the optimal treatment for lettuce growth and quality was FF > BF > FB > FU > UF > UU > BU > UB > BB.

4. Discussion

4.1. The Growth of Lettuce Was Affected by Light Combinations in the Growth Stage

Supplementary FR enhanced biomass accumulation and was crucial for optimizing photosynthesis efficiency. FR preferentially exciting photosystem I improves photosynthetic efficiency when combined with light that overexcites photosystem II, resulting in higher biomass [33,34,35]. FR supplementation significantly increased leaf area, length, and width in lettuce, as well as significantly increased shoot fresh and dry weight. [10,14]. In this study, positive correlations were observed among lettuce leaf width, leaf length, leaf area, and shoot fresh weight at both Stage I and Stage II (Figure 5). These characteristics significantly increase by FR (Stage I), FF, UF, and BF (Stage II; Table 3). Substituting B with FR decreased the ratio of R: FR, causing plant stem elongation and leaf expansion for more light capture, which leads to biomass increase [5,36,37,38]. At Stage II, higher shoot fresh and dry weight in lettuce were observed in FF, UF, and BF, followed by FU and FB among the nine treatments (Table 3). Although lettuce biomass accumulation was favored by substituting B with FR at stage I, a more effective substitution of B with FR was observed at stage II. Lettuce grows faster at Stage II which has contributed to more significant improvement by FR. Alternatively, it could be due to a significant reduction in photosynthetic pigment content by FR at stage I. Whereas no significant differences in growth parameters were found between UVA and CKI at Stage I. At Stage II, the shoot fresh and dry weight of lettuce significantly increased by UU, and the lowest biomass was seen in CKII (Table 3). Thus, the constant red-blue light combination might be detrimental to biomass accumulation [18,20], and substituting B with UVA could improve lettuce growth. Furthermore, the SLW was negatively related to LA, SFW, and SDW and decreased by FR (Figure 5). Substituting B with FR at stage II (FF, UF, BF) shown lower SLW (Table 3). It might be due to the promotion of leaf expansion by FR, which led to the thinner leaf. Except for FF, UF, and BF, the SLW increased by other treatments compared to CKII, it might be that alternating light could increase leaf thickness, mesophyll cell density, and leaf mass per area [39].
Light energy is absorbed by photosynthetic pigments and converted into chemical energy during photosynthesis. The photosynthetic pigment biosynthesis was influenced by light qualities. The biosynthesis and gene expression of photosynthetic pigments increased by blue light [40,41,42,43]. In lettuce, the higher photosynthetic pigments content was under 100% B than R and B [44]. The photosynthetic pigment accumulation also promoted by supplemental UVA in kale and lettuce [14,15]. However, photosynthetic pigment contents in tomato, maize, tobacco, and lettuce leaves reduced by FR [5,14]. In the present study, lettuce photosynthetic pigment contents decreased when B was replaced by FR and UVA at stage I, and a future decrease was in FR treatment (Figure 2). Substituting B with UVA decreased lettuce chlorophyll content compared to UVA supplementation, probably because B was more favorable for photosynthetic pigment biosynthesis. At stage II, the lower photosynthetic pigments were found in CKII (Figure 2). It validated that the constant red-blue light combination was not favor for lettuce photosynthetic pigments [18]. Besides, substituting B with FR at Stage I facilitated the accumulation of photosynthetic pigments at Stage II. FB and FU shown higher photosynthetic pigment contents among 9 treatments (Figure 2). The underlying regulating mechanisms need to be further explored. Moreover, the photosynthetic pigments contents were positively correlated with soluble protein content, and negatively correlated with nitrate content at stage II (Figure 5C,D). It might be due to photosynthetic pigments contents affected by N conversion [45].

4.2. The Nutrition of Lettuce Was Affected by Light Combinations in the Growth Stage

Soluble sugar is one of the major products of photosynthesis. The gene expression of sucrose synthases, invertases and starch catabolism, which enhance sugar transportation and metabolism, were up-regulated by FR [46]. The soluble sugar content in tomato increased by FR [36]. In the present study, the soluble sugar content improved by FR (Stage I), FF, BF, FU, and FB (Stage II) (Figure 3A and Figure 5). At stage II, there was a significant positive correlation existed between soluble sugar and photosynthetic pigments. Constant red-blue light combination (CKII) might be unfavorable to photosynthetic pigments accumulation, which reduced soluble sugar accumulation.
The component and biosynthesis of VC in plant were in intimate correlation with light [47]. Some enzymes activities of VC biosynthesis were enhanced by FR in lettuce [14,48] The genes expression of VC biosynthesis and regeneration were up-regulated by blue light [49,50]. Lettuce VC content increased by supplemental 10 μmol·m−2·s−1 UVA [14]. In the present study, the VC content increased by FR at Stage I. While at Stage II, the VC content largely decreased by FF, UF, and BF, followed by FU, BU, and the higher VC contents were in FB, UB, and CKII. Thus, the light quality effects on VC content were related to the lettuce growth stages. FR was most favorable for VC accumulation in early stage of lettuce, while B was most favorable for VC accumulation in late stage of lettuce.
Nitrate is the important sources of nitrogen for plants and can be converted into amino acids by Nitrate reductase (NR), nitrite reductase (NiR), amino acid synthase (GOGAT, GS) [51], and amino acids are the building blocks of proteins [52]. Light plays an extremely important role in this process. In lettuce, the NR activities significantly increased and nitrate content significantly decreased by red–blue light combination, GS and GOGAT activities significantly increased by UVA and blue light compare to white light [53]. Negative correlations between soluble protein and nitrate were reported in lettuce, Brassica microgreens, pak choi, kale, and Chinese kale under light strategies [14,17,46,54]. In this study, the negative correlations between soluble protein and nitrate were seen at Stage I and Stage II (Figure 5A–D). The nitrate contents largely decreased and soluble protein contents increased by substituting B with UVA/FR at different stages compared to CKI, CKII. Thus, supplemental FR/UVA in RB-LEDs might be a proper optimizing procedure to enhance N metabolism-related enzyme activity and the ability to convert nitrate to protein in lettuce [55,56].

4.3. The Antioxidant Contents and Activity of Lettuce Were Affected by Light Combinations in Growth Stage

Generally, the antioxidant content and capacity in plants were enhanced by short wavelength light but reduced by long wavelength light. In lettuce, supplemental UVA significantly yielded higher contents of vitamin C, flavonoid, polyphenol, anthocyanin, and DPPH, whereas FR supplementation decreased those [14]. The antioxidant capacity of Chinese Kale sprouts was intensified by blue light [57]. In sweet basil, higher phenolic content was found in UVA treatment [58]. In this study, the antioxidant capacity decreased by substituting B with FR and UVA at stage I (Figure 4C,D). Thus, B was more suitable for enhancing the antioxidant capacity than FR and UVA, but not by increasing the content of total flavonoid and polyphenol compounds. At stage II, lower antioxidant content and antioxidant capacity were shown in FF, UF, and BF (Figure 4). The antioxidant content and capacity positively correlated with specific leaf weight, but negatively correlated with leaf area (Figure 5C,D). Therefore, the antioxidant content and capacity decreased might be due to the dilution of antioxidant content by leaf expansion and thinning in FF, UF, and BF. There was higher antioxidant (total flavonoids, total phenolic compounds, vitamin C) content and antioxidant capacity (DPPH; FRAP) in FB, UB, and CKII. The longer time treated by short-wavelength light (UVA/B), the more antioxidant capacity was found in lettuce at stage II. And short-wavelength light (UVA/B) used at stage II was more favorable to antioxidant capacity than at stage I.

5. Conclusions

Substituting 50 μmol·m−2·s−1 blue light with either 50 μmol·m−2·s−1 far-red light or 50 μmol·m−2·s−1 ultraviolet A light at different stages impacted the lettuce growth and quality. Specifically, at the early growth stage of lettuce (Stage I), substituting blue light with far-red light (FR) resulted in the highest biomass as well as the highest contents of soluble sugar content and vitamin C, which greatly contributed to enhancing lettuce growth and quality. At the late growth stage of lettuce (Stage II), higher biomass was exhibited in the treatments of substituting blue light with far-red light at stage II (FF UF, BF), higher photosynthetic pigment content in FB and FU, and higher soluble sugar contents in FF, UF, BF, FU, and FB. Compared to the absence of any substitute light at both Stage I and Stage II (CKII), all treatments reduced nitrate content and increased soluble protein content. Besides, the absence of any substitute light at Stage II (FB, UB, CKII) was beneficial for antioxidant content and capacity. Based on the comprehensive analysis, substituting blue light with far-red light at both stage I and stage II proved to be the most effective lighting strategy for promoting lettuce growth. Moreover, substituting blue light with far-red light at stage I and omitting any substitute light at stage II (FB) emerged as the optimal approach for enhancing lettuce nutrition quality and growth. Light quality had a greater impact on the lettuce growth and antioxidant content during the later stage of growth (rapid growth) compared to the early stage. According to the practical requirements of production, it is feasible to replace a portion of blue light with far-red during the lettuce growth stages. It is worth investigating the optimal intensity of FR light replacement for blue light at different stages to enhance lettuce quality and biomass.

Author Contributions

Conceptualization, formal analysis, data curation, writing-original draft, Y.H. and R.H.; methodology preparation, Y.L. and X.H.; writing-review and editing, S.Z.; validation, J.J. and X.L.; resources, supervision, project administration, funding acquisition, H.L. All authors have read and agreed to the published version of the manuscript.

Funding

This work was supported by the National Key Research and Development of China (2021YFD2000701).

Data Availability Statement

Not applicable.

Acknowledgments

The authors thank College of Horticulture, South China Agricultural University for providing place to experiment.

Conflicts of Interest

The authors declare no conflict of interest.

Sample Availability

Samples of the compounds are not available from the authors.

References

  1. Majid, M.; Khan, J.N.; Ahmad Shah, Q.M.; Masoodi, K.Z.; Afroza, B.; Parvaze, S. Evaluation of Hydroponic Systems for the Cultivation of Lettuce (Lactuca Sativa L., Var. Longifolia) and Comparison with Protected Soil-Based Cultivation. Agric. Water Manag. 2021, 245, 106572. [Google Scholar] [CrossRef]
  2. van der Maesen, L.J.G.; Nijhuis, H.J.G. Human Sciences and Climate Change: Quo Vadis? Int. J. Soc. Qual. 2022, 12, v–xxii. [Google Scholar] [CrossRef]
  3. Treftz, C.; Omaye, S.T. Hydroponics: Potential for Augmenting Sustainable Food Production in Non-Arable Regions. NFS 2016, 46, 672–684. [Google Scholar] [CrossRef]
  4. McCree, K.J. The Action Spectrum, Absorptance and Quantum Yield of Photosynthesis in Crop Plants. Agric. Meteorol. 1971, 9, 191–216. [Google Scholar] [CrossRef]
  5. Tan, T.; Li, S.; Fan, Y.; Wang, Z.; Raza, M.A.; Shafiq, I.; Wang, B.; Wu, X.; Yong, T.; Wang, X.; et al. Far-Red Light: A Regulator of Plant Morphology and Photosynthetic Capacity. Crop. J. 2022, 10, 300–309. [Google Scholar] [CrossRef]
  6. Carotti, L.; Graamans, L.; Puksic, F.; Butturini, M.; Meinen, E.; Heuvelink, E.; Stanghellini, C. Plant Factories Are Heating Up: Hunting for the Best Combination of Light Intensity, Air Temperature and Root-Zone Temperature in Lettuce Production. Front. Plant Sci. 2021, 11, 592171. [Google Scholar] [CrossRef]
  7. Kusuma, P.; Bugbee, B. Improving the Predictive Value of Phytochrome Photoequilibrium: Consideration of Spectral Distortion Within a Leaf. Front. Plant Sci. 2021, 12, 596943. [Google Scholar] [CrossRef]
  8. Zhen, S.; van Iersel, M.W.; Bugbee, B. Photosynthesis in Sun and Shade: The Surprising Importance of Far-red Photons. New Phytol. 2022, 236, 538–546. [Google Scholar] [CrossRef]
  9. Zou, J.; Zhang, Y.; Zhang, Y.; Bian, Z.; Fanourakis, D.; Yang, Q.; Li, T. Morphological and Physiological Properties of Indoor Cultivated Lettuce in Response to Additional Far-Red Light. Sci. Hortic. 2019, 257, 108725. [Google Scholar] [CrossRef]
  10. Jin, W.; Urbina, J.L.; Heuvelink, E.; Marcelis, L.F.M. Adding Far-Red to Red-Blue Light-Emitting Diode Light Promotes Yield of Lettuce at Different Planting Densities. Front. Plant Sci. 2021, 11, 609977. [Google Scholar] [CrossRef] [PubMed]
  11. Kang, J.H.; Yoon, H.I.; Kim, J.; Ahn, T.I.; Son, J.E. Ray-Tracing Analysis on the Far-Red Induced Light-Capturing Ability of Kale. Sci. Hortic. 2023, 311, 111806. [Google Scholar] [CrossRef]
  12. He, R.; Li, Y.; Ou, S.; Gao, M.; Zhang, Y.; Song, S.; Liu, H. Regulation of Growth and Main Health-Promoting Compounds of Chinese Kale Baby-Leaf by UV-A and FR Light. Front. Plant Sci. 2021, 12, 799376. [Google Scholar] [CrossRef] [PubMed]
  13. Meng, Q.; Runkle, E.S. Far-Red Radiation Interacts with Relative and Absolute Blue and Red Photon Flux Densities to Regulate Growth, Morphology, and Pigmentation of Lettuce and Basil Seedlings. Sci. Hortic. 2019, 255, 269–280. [Google Scholar] [CrossRef]
  14. He, R.; Zhang, Y.; Song, S.; Su, W.; Hao, Y.; Liu, H. UV-A and FR Irradiation Improves Growth and Nutritional Properties of Lettuce Grown in an Artificial Light Plant Factory. Food Chem. 2021, 345, 128727. [Google Scholar] [CrossRef]
  15. Choi, D.-S.; Nguyen, T.K.L.; Oh, M.-M. Growth and Biochemical Responses of Kale to Supplementary Irradiation with Different Peak Wavelengths of UV-A Light-Emitting Diodes. Hortic. Environ. Biotechnol. 2022, 63, 65–76. [Google Scholar] [CrossRef]
  16. Gao, M.; Li, Y.; Jiang, H.; He, R.; Shi, R.; Song, S.; Liu, H. UVA-Radiation Exposure of Different Durations Promoted the Growth, Phytochemicals and Glucosinolate Biosynthesis of Chinese Kale. IJMS 2022, 23, 7619. [Google Scholar] [CrossRef]
  17. Jiang, H.; Li, Y.; He, R.; Tan, J.; Liu, K.; Chen, Y.; Liu, H. Effect of Supplemental UV-A Intensity on Growth and Quality of Kale under Red and Blue Light. IJMS 2022, 23, 6819. [Google Scholar] [CrossRef] [PubMed]
  18. Jin, W.; Ji, Y.; Larsen, D.H.; Huang, Y.; Heuvelink, E.; Marcelis, L.F.M. Gradually Increasing Light Intensity during the Growth Period Increases Dry Weight Production Compared to Constant or Gradually Decreasing Light Intensity in Lettuce. Sci. Hortic. 2023, 311, 111807. [Google Scholar] [CrossRef]
  19. Min, Q.; Marcelis, L.F.M.; Nicole, C.C.S.; Woltering, E.J. High Light Intensity Applied Shortly Before Harvest Improves Lettuce Nutritional Quality and Extends the Shelf Life. Front. Plant Sci. 2021, 12, 615355. [Google Scholar] [CrossRef]
  20. Samuolienė, G.; Viršilė, A.; Haimi, P.; Miliauskienė, J. Photoresponse to Different Lighting Strategies during Red Leaf Lettuce Growth. J. Photochem. Photobiol. B Biol. 2020, 202, 111726. [Google Scholar] [CrossRef]
  21. Viršilė, A.; Miliauskienė, J.; Haimi, P.J.; Laužikė, K.; Samuolienė, G. The Comparison of Constant and Dynamic Red and Blue Light Irradiation Effects on Red and Green Leaf Lettuce. Agronomy 2020, 10, 1802. [Google Scholar] [CrossRef]
  22. Gratani, L. A Non-Destructive Method to Determine Chlorophyll Content of Leaves. Photosynthetica 1992, 26, 469–473. [Google Scholar]
  23. Kohyama, K.; Nishinari, K. Effect of Soluble Sugars on Gelatinization and Retrogradation of Sweet Potato Starch. J. Agric. Food Chem. 1991, 39, 1406–1410. [Google Scholar] [CrossRef]
  24. Bradford, M.M. A Rapid and Sensitive Method for the Quantitation of Microgram Quantities of Protein Utilizing the Principle of Protein-Dye Binding. Anal. Biochem. 1976, 72, 248–254. [Google Scholar] [CrossRef]
  25. Cataldo, D.A.; Maroon, M.; Schrader, L.E.; Youngs, V.L. Rapid Colorimetric Determination of Nitrate in Plant Tissue by Nitration of Salicylic Acid. Commun. Soil Sci. Plant Anal. 1975, 6, 71–80. [Google Scholar] [CrossRef]
  26. Kampfenkel, K.; Vanmontagu, M.; Inzé, D. Extraction and Determination of Ascorbate and Dehydroascorbate from Plant Tissue. Anal. Biochem. 1995, 225, 165–167. [Google Scholar] [CrossRef]
  27. Singleton, V.L.; Orthofer, R.; Lamuela-Raventós, R.M. Analysis of Total Phenols and Other Oxidation Substrates and Antioxidants by Means of Folin-Ciocalteu Reagent. In Methods in Enzymology; Elsevier: Amsterdam, The Netherlands, 1999; Volume 299, pp. 152–178. ISBN 0076-6879. [Google Scholar]
  28. Xie, Y.; Zheng, Y.; Dai, X.; Wang, Q.; Cao, J.; Xiao, J. Seasonal Dynamics of Total Flavonoid Contents and Antioxidant Activity of Dryopteris Erythrosora. Food Chem. 2015, 186, 113–118. [Google Scholar] [CrossRef]
  29. Tadolini, B.; Juliano, C.; Piu, L.; Franconi, F.; Cabrini, L. Resveratrol Inhibition of Lipid Peroxidation. Free Radic. Res. 2000, 33, 105–114. [Google Scholar] [CrossRef]
  30. Benzie, I.F.; Strain, J.J. The Ferric Reducing Ability of Plasma (FRAP) as a Measure of “Antioxidant Power”: The FRAP Assay. Anal. Biochem. 1996, 239, 70–76. [Google Scholar] [CrossRef] [PubMed]
  31. Abdi, H.; Williams, L. Principal Component Analysis. Wiley Interdiscip. Rev. Comput. Stat. 2010, 2, 433–459. [Google Scholar] [CrossRef]
  32. Viršilė, A.; Brazaitytė, A.; Vaštakaitė-Kairienė, V.; Jankauskienė, J.; Miliauskienė, J.; Samuolienė, G.; Novičkovas, A.; Duchovskis, P. Nitrate, Nitrite, Protein, Amino Acid Contents, and Photosynthetic and Growth Characteristics of Tatsoi Cultivated under Various Photon Flux Densities and Spectral Light Compositions. Sci. Hortic. 2019, 258, 108781. [Google Scholar] [CrossRef]
  33. Emerson, R.; Chalmers, R.; Cederstrand, C. Some Factors Influencing the Long-Wave Limit of Photosynthesis. Proc. Natl. Acad. Sci. USA 1957, 43, 133–143. [Google Scholar] [CrossRef]
  34. Emerson, R.; Rabinowitch, E. Red Drop and Role of Auxiliary Pigments in Photosynthesis. Plant Physiol. 1960, 35, 477. [Google Scholar] [CrossRef] [PubMed]
  35. Zhen, S.; Haidekker, M.; van Iersel, M.W. Far-red Light Enhances Photochemical Efficiency in a Wavelength-dependent Manner. Physiol. Plant 2019, 167, 21–33. [Google Scholar] [CrossRef]
  36. Kim, D.; Son, J.E. Adding Far-Red to Red, Blue Supplemental Light-Emitting Diode Interlighting Improved Sweet Pepper Yield but Attenuated Carotenoid Content. Front. Plant Sci. 2022, 13, 938199. [Google Scholar] [CrossRef]
  37. Wang, X.; Gao, X.; Liu, Y.; Fan, S.; Ma, Q. Progress of Research on the Regulatory Pathway of the Plant Shade-Avoidance Syndrome. Front. Plant Sci. 2020, 11, 439. [Google Scholar] [CrossRef]
  38. Zhen, S.; Bugbee, B. Substituting Far-Red for Traditionally Defined Photosynthetic Photons Results in Equal Canopy Quantum Yield for CO2 Fixation and Increased Photon Capture During Long-Term Studies: Implications for Re-Defining PAR. Front. Plant Sci. 2020, 11, 581156. [Google Scholar] [CrossRef]
  39. Ohtake, N.; Ju, Y.; Ishikura, M.; Suzuki, H.; Adachi, S.; Yamori, W. Alternating Red/Blue Light Increases Leaf Thickness and Mesophyll Cell Density in the Early Growth Stage, Improving Photosynthesis and Plant Growth in Lettuce. Environ. Control. Biol. 2021, 59, 59–67. [Google Scholar] [CrossRef]
  40. Wang, H.; Gu, M.; Cui, J.; Shi, K.; Zhou, Y.; Yu, J. Effects of Light Quality on CO2 Assimilation, Chlorophyll-Fluorescence Quenching, Expression of Calvin Cycle Genes and Carbohydrate Accumulation in Cucumis sativus. J. Photochem. Photobiol. B Biol. 2009, 96, 30–37. [Google Scholar] [CrossRef] [PubMed]
  41. Song, Y.; Shang, W.; Ma, D.; Wang, Z.; He, S.; Shi, L.; Shen, Y.; He, D.; Wang, E.; Wang, X. Effect on the Growth and Photosynthetic Characteristics of Anthurium Andreanum (‘Pink Champion’, ‘Alabama’) under Hydroponic Culture by Different LED Light Spectra. Horticulturae 2022, 8, 389. [Google Scholar] [CrossRef]
  42. Guo, Y.; Zhong, Y.; Mo, L.; Zhang, W.; Chen, Y.; Wang, Y.; Chen, H.; Wang, Z.; Song, X.; Meng, X. Different Combinations of Red and Blue LED Light Affect the Growth, Physiology Metabolism and Photosynthesis of in Vitro-Cultured Dendrobium Nobile ‘Zixia’. Hortic. Environ. Biotechnol. 2023, 64, 393–407. [Google Scholar] [CrossRef]
  43. Shang, W.; Song, Y.; Zhang, C.; Shi, L.; Shen, Y.; Li, X.; Wang, Z.; He, S. Effects of Light Quality on Growth, Photosynthetic Characteristics, and Endogenous Hormones in in Vitro-Cultured Lilium Plantlets. Hortic. Environ. Biotechnol. 2022, 64, 65–81. [Google Scholar] [CrossRef]
  44. Chen, X.; Li, Y.; Wang, L.; Guo, W. Red and Blue Wavelengths Affect the Morphology, Energy Use Efficiency and Nutritional Content of Lettuce (Lactuca Sativa L.). Sci. Rep. 2021, 11, 8374. [Google Scholar] [CrossRef]
  45. Peng, J.; Feng, Y.; Wang, X.; Li, J.; Xu, G.; Phonenasay, S.; Luo, Q.; Han, Z.; Lu, W. Effects of Nitrogen Application Rate on the Photosynthetic Pigment, Leaf Fluorescence Characteristics, and Yield of Indica Hybrid Rice and Their Interrelations. Sci. Rep. 2021, 11, 7485. [Google Scholar] [CrossRef] [PubMed]
  46. Ji, Y.; Nuñez Ocaña, D.; Choe, D.; Larsen, D.H.; Marcelis, L.F.M.; Heuvelink, E. Far-red Radiation Stimulates Dry Mass Partitioning to Fruits by Increasing Fruit Sink Strength in Tomato. New Phytol. 2020, 228, 1914–1925. [Google Scholar] [CrossRef] [PubMed]
  47. Lu, Y.; Guo, X. The Effect of Light in Vitamin C Metabolism Regulation and Accumulation in Mung Bean (Vigna Radiata) Germination. Plant Foods Hum. Nutr. 2020, 75, 24–29. [Google Scholar] [CrossRef] [PubMed]
  48. Chen, X.; Xue, X.; Guo, W.; Wang, L.; Qiao, X. Growth and Nutritional Properties of Lettuce Affected by Mixed Irradiation of White and Supplemental Light Provided by Light-Emitting Diode. Sci. Hortic. 2016, 200, 111–118. [Google Scholar] [CrossRef]
  49. Zha, L.; Liu, W.; Yang, Q.; Zhang, Y.; Zhou, C.; Shao, M. Regulation of Ascorbate Accumulation and Metabolism in Lettuce by the Red:Blue Ratio of Continuous Light Using LEDs. Front. Plant Sci. 2020, 11, 704. [Google Scholar] [CrossRef] [PubMed]
  50. Zushi, K.; Suehara, C.; Shirai, M. Effect of Light Intensity and Wavelengths on Ascorbic Acid Content and the Antioxidant System in Tomato Fruit Grown in Vitro. Sci. Hortic. 2020, 274, 109673. [Google Scholar] [CrossRef]
  51. Liu, X.; Hu, B.; Chu, C. Nitrogen Assimilation in Plants: Current Status and Future Prospects. J. Genet. Genomics. 2022, 49, 394–404. [Google Scholar] [CrossRef]
  52. Dietzen, D.J. 13—Amino Acids, Peptides, and Proteins. In Principles and Applications of Molecular Diagnostics; Rifai, N., Horvath, A.R., Wittwer, C.T., Eds.; Elsevier: Amsterdam, The Netherlands, 2018; pp. 345–380. ISBN 978-0-12-816061-9. [Google Scholar]
  53. Zhang, T.; Shi, Y.; Piao, F.; Sun, Z. Effects of Different LED Sources on the Growth and Nitrogen Metabolism of Lettuce. Plant Cell Tiss Organ Cult. 2018, 134, 231–240. [Google Scholar] [CrossRef]
  54. Song, J.; Huang, H.; Hao, Y.; Song, S.; Zhang, Y.; Su, W.; Liu, H. Nutritional Quality, Mineral and Antioxidant Content in Lettuce Affected by Interaction of Light Intensity and Nutrient Solution Concentration. Sci. Rep. 2020, 10, 2796. [Google Scholar] [CrossRef] [PubMed]
  55. Bian, Z.; Cheng, R.; Wang, Y.; Yang, Q.; Lu, C. Effect of Green Light on Nitrate Reduction and Edible Quality of Hydroponically Grown Lettuce (Lactuca Sativa L.) under Short-Term Continuous Light from Red and Blue Light-Emitting Diodes. Environ. Exp. Bot. 2018, 153, 63–71. [Google Scholar] [CrossRef]
  56. Liu, H.; Fu, Y.; Yu, J.; Liu, H. Accumulation and Primary Metabolism of Nitrate in Lettuce (Lactuca Sativa L. Var. Youmaicai) Grown Under Three Different Light Sources. Commun. Soil Sci. Plant Anal. 2016, 47, 1994–2002. [Google Scholar] [CrossRef]
  57. Qian, H.; Liu, T.; Deng, M.; Miao, H.; Cai, C.; Shen, W.; Wang, Q. Effects of Light Quality on Main Health-Promoting Compounds and Antioxidant Capacity of Chinese Kale Sprouts. Food Chem. 2016, 196, 1232–1238. [Google Scholar] [CrossRef]
  58. Kang, S.; Kim, J.E.; Zhen, S.; Kim, J. Mild-Intensity UV-A Radiation Applied Over a Long Duration Can Improve the Growth and Phenolic Contents of Sweet Basil. Front. Plant Sci. 2022, 13, 858433. [Google Scholar] [CrossRef]
Figure 1. Morphology of ‘Fangni’ lettuce at stages I and II of cultivation after processing.
Agronomy 13 02547 g001
Figure 2. Effects of substituting B with FR and UVA at different growth stages on the contents of chlorophyll a (A), chlorophyll b (B), carotenoids (C), chlorophyll a/chlorophyll b (D), total chlorophyll/carotenoids (E). Abbreviations for treatment are shown in Table 2. The data in the figure represent the means. Different letters on the bars indicate significant differences at p ≤ 0.05 (Duncan’s multiple range test).
Agronomy 13 02547 g002
Figure 3. Effects of substituting B with FR and UVA at different growth stages on the contents of soluble sugar (A), soluble protein (B), vitamin C (C), and nitrate (D). Abbreviations for treatment are shown in Table 2. The data in the figure represent the means. Different letters on the bars indicate significant differences at p ≤ 0.05 (Duncan’s multiple range test).
Agronomy 13 02547 g003
Figure 4. Effects of substituting B with FR and UVA at different growth stages on the contents of total flavonoids (A), phenolic compounds (B), FRAP, ferric-reducing antioxidant power (C), and DPPH, 2,2-diphenyl-1-picrylhydrazyl (D). Abbreviations for treatment are shown in Table 2. The data in the figure represent the means. Different letters on the bars indicate significant differences at p ≤ 0.05 (Duncan’s multiple range test).
Agronomy 13 02547 g004
Figure 5. The heat map (stage I: (A); stage II: (C)) and the PCA (stage I: (B); stage II: (D)) showing correlations in the investigated parameters in lettuce and the clustering between treatments. shoot fresh weight (SFW), shoot dry weight (SDW), root fresh weight (RFW), root dry weight (RDW), leaf width (LW), leaf area (LA), leaf length (LL), specific leaf weight (SLW), chlorophyll b (Chlb), carotenoids (caro), chlorophyll a (Chla), soluble sugar (SS), soluble protein (SP), 2,2-diphenyl-1-picrylhydrazyl (DPPH), antioxidant power (FRAP), vitamin C (VC), total flavonoids (TF), total phenolic compounds (TPC), chlorophyll a/chlorophyll b (Chla/Chlb), total chlorophyll/carotenoid. Abbreviations for treatment are shown in Table 2.
Agronomy 13 02547 g005
Table 1. Experimental lighting conditions.
TreatmentR (660 ± 10 nm)B (460 ± 10 nm)FR (730 ± 10 nm)UV-A (380 ± 10 nm)PPFDYPFDUnit
FR1505050 200250μmol·m−2·s−1
UVA15050 50200250
B (CKI)150100 250250
R, red; B, blue; FR, far-red; UV-A, ultraviolet A; PPFD, photosynthetic photon flux density; YPFD, yield photon flux density. The error of monochromatic light intensity is around 5 μmol·m−2·s−1, total PPFD, YPFD is around 10 μmol·m−2·s−1.
Table 2. Lighting combinations during lettuce growth.
Stage I (20 Days before Harvesting)Stage II (10 Days before Harvesting)
FRFR (FF)
UVA (FU)
B (FB)
UVAFR (UF)
UVA (UU)
B (UB)
BFR (BF)
UVA (BU)
B (CKII)
Table 3. Growth indicators of hydroponic lettuce under light treatment.
Leaf Leaf Leaf Specific Weight (g/Plant)
Treatment Width Length Area Leaf
cm cm cm2 Weight Root Shoot Root Shoot
kg/cm2 FW FW DW DW
Stage I
FR6.46 ± 1.01 a9.13 ± 1.18 a270.24 ± 50.61 a2.13 ± 0.17 b2.18 ± 0.13 a11.25 ± 0.85 a0.11 ± 0.01 a0.57 ± 0.04 a
UVA5.13 ± 0.55 b6.84 ± 0.54 b208.42 ± 29.20 b2.57 ± 0.34 a2.41 ± 0.15 a9.30 ± 0.46 b0.12 ± 0.01 a0.53 ± 0.02 a
CKI5.20 ± 0.56 b7.00 ± 0.83 b177.29 ± 28.44 b2.83 ± 0.34 a2.16 ± 0.13 a8.03 ± 0.67 b0.12 ± 0.01 a0.5 ± 0.02 a
Stage II
FF11.00 ± 0.63 ab15.44 ± 0.99 b1203.83 ± 102.08 ab1.95 ± 0.19 c–e4.45 ± 0.27 a65.76 ± 3.01 a0.24 ± 0.04 ab2.35 ± 0.34 a
UF10.54 ± 0.28 b16.37 ± 0.83 a1138.42 ± 90.55 b1.90 ± 0.12 df3.78 ± 0.17 b64.91 ± 1.97 a0.18 ± 0.04 cd2.17 ± 0.24 ab
BF11.33 ± 0.55 a16.25 ± 0.29 a1242.92 ± 69.84 a1.75 ± 0.25 f3.66 ± 0.22 b61.01 ± 1.74 ab0.19 ± 0.03 cd2.17 ± 0.36 ab
FU9.97 ± 0.69 c12.07 ± 0.3 de919.28 ± 127.81 c2.19 ± 0.11 b4.44 ± 0.2 a57.70 ± 2.60 b0.22 ± 0.03 bc2.03 ± 0.21 bd
UU11.05 ± 0.65 ab12.98 ± 0.78 c884.23 ± 75.81 c2.06 ± 0.1 bd3.65 ± 0.08 b50.65 ± 1.18 cd0.21 ± 0.04 cd1.82 ± 0.2 cd
BU9.35 ± 0.35 de13.03 ± 0.51 c828.78 ± 71.81 c2.12 ± 0.19 bc3.82 ± 0.31 b48.48 ± 2.33 de0.18 ± 0.03 d1.76 ± 0.28 de
FB9.81 ± 0.54 cd11.75 ± 0.55 e836.97 ± 78.97 c2.53 ± 0.15 a5.02 ± 0.22 a55.86 ± 1.46 bc0.27 ± 0.04 a2.12 ± 0.23 ac
UB9.20 ± 0.27 e11.81 ± 0.47 e865.36 ± 91.14 c2.16 ± 0.25 b3.71 ± 0.09 b49.40 ± 1.41 de0.19 ± 0.03 cd1.88 ± 0.31 bd
CKII9.14 ± 0.39 e12.59 ± 0.46 cd831.84 ± 71.58 c1.83 ± 0.09 ef3.41 ± 0.14 b43.99 ± 1.24 e0.19 ± 0.01 cd1.53 ± 0.18 e
FW, fresh weight; DW, dry weight. Abbreviations for treatment are shown in Table 2. All data are expressed as the mean. Means within each column and main effect followed by different letters are significantly different (p < 0.05) (Duncan’s multiple-range test).
Table 4. The score of each principal component and the total score of each treatment.
TreatmentScore of Each Principal ComponentVariance Contribution %Total ScoreRank
Y1Y2Y3PC1PC2PC3
Stage I
FR4.02−0.73−0.0546.15%24.35%10.21%1.671
UVA−1.162.790.040.152
CKI−2.86−2.060.01−1.823
Stage II
FF4.491.49−0.0239.57%27.56%7.31%2.191
UF1.98−1.270.470.475
BF4.06−2.910.050.812
FU0.122.54−0.490.714
UU−0.47−0.160.35−0.26
BU−1.94−0.95−2.18−1.197
FB−1.294.31.320.773
UB−3.350.22−1.06−1.348
CKII−3.62−3.261.56−2.229
Disclaimer/Publisher’s Note: The statements, opinions and data contained in all publications are solely those of the individual author(s) and contributor(s) and not of MDPI and/or the editor(s). MDPI and/or the editor(s) disclaim responsibility for any injury to people or property resulting from any ideas, methods, instructions or products referred to in the content.

