Article

AMMI Analysis of Genotype × Environment Interaction on Sugar Beet (Beta vulgaris L.) Yield, Sugar Content and Production in Romania

1
Department of Economic Sciences, University of Agricultural Sciences and Veterinary Medicine Cluj-Napoca, 3-5 Manastur Street, 400372 Cluj-Napoca, Romania
2
Premium Sugar Factory, Corporation Ludus, 3-5 Fabricii Street, 545200 Ludus, Romania
3
Departament of Enviromental Engineering and Protection, University of Agricultural Sciences and Veterinary Medicine Cluj-Napoca, 3-5 Manastur Street, 400372 Cluj-Napoca, Romania
*
Author to whom correspondence should be addressed.
Agronomy 2023, 13(10), 2549; https://doi.org/10.3390/agronomy13102549
Submission received: 25 August 2023 / Revised: 20 September 2023 / Accepted: 27 September 2023 / Published: 3 October 2023
(This article belongs to the Special Issue Genotype × Environment Interactions in Crop Production)

Abstract

:
The overall yield and sugar content of sugar beet (Beta vulgaris L.) were determined by the genotype and its interaction with the environment. This study aimed to analyze the interaction of 23 genotypes with different environmental conditions during two growing seasons. To estimate the variance of genotypes, environment, and genotype function of the environment, the R 3.5.1 software package was used. In addition, the multivariate stability method was used to explain the G (genotype) × E (environment) interaction based on the GGE (Genotype plus Genotype-by-Environment) and AMMI (additive main effects and multiplicative interaction) biplots. The AMMI ASV (AMMI stability value) and biplot analysis revealed that only two genotypes (G10 and G11) showed higher values for yield and sugar content and production compared to the other genotypes. The AMMI ASV analysis also showed that the environment significantly influenced the sugar beet yield, sugar content, and sugar production, which were the descriptors for production in this study.

1. Introduction

Among the large number of plant species that contain sugars, it is commonplace to mention that due to its high sucrose content, sugar beet (Beta vulgaris L.) has great economic importance. Sugar beet cultures are highly valuable as they provide the raw material for sugar production in a temperate continental climate such as Europe. In Romania, a European country, where this present research was conducted, sugar beet cultivation is of great economic importance. In support of this assertion, it is worth mentioning that according to the currently available Romanian national statistics in 2020, sugar beet was cultivated in an area of 22.76 thousand hectares and sugar production reached 115.4 thousand tonnes [1].
In the current stage, one of the major concerns in providing raw materials is the increase in yield per hectare. The most important components for increasing sugar beet yield are root weight and sugar content. According to Kühnel [2], the existing genotypes have a dry mass content between 18 and 23% (depending on the genotype and harvesting conditions), proteins (11.50–20.25%), and almost 20–21% raw fibers [3,4]. These data may also be modified by biotic and abiotic environmental parameters [5].
Sugar beet cultures (Beta vulgaris L) have been subjected to many important changes in recent decades and improved varieties [6] have been obtained as well as complemented by better cultural practices [7], but climate is one of the most important factors that must be taken into account when crops are harvested. Setting up cultures in the most favorable areas is an important measure to increase the production of sugar beet. Natural stress, as a result of temperature and lack of precipitation, influences plant development negatively, including that of sugar beet [8,9]. Increased environmental temperatures, along with a low precipitation regime, can have a negative impact on photosynthesis and protein action in plants, a decrease in photosynthesis rate, and a decrease in the production rhythm of dry substances [10]. It is clear that these facts may be considered serious threats to the sugar supply chain [8,11].
In the last few years, in agriculture research, many instruments have been used to characterize environments to evaluate varieties and separate stable genotypes from unstable ones in different cultures [12] in order to provide adequate recommendations to farmers. By analyzing specialized literature, it is observed that the multi-environmental trials (MET) and the AMMI model (additive main effects and multiplicative interaction) are the most used statistical methods. MET is used to evaluate the relative performance of a genotype in a target environment and for better cultivation in the future [13,14,15,16], whereas AMMI can be used to understand the interactions between genotypes and environments. AMMI analysis is a combination of ANOVA and PCA, and a major output of the results is a biplot that presents the means of the genotypes used and their relation to the first PC. This biplot is an effective tool to evaluate the GE interactions graphically. The results of AMMI analysis are considered useful for the evaluation of yield stability of crops under different environmental conditions and for the determination of suitable environments for all examined genotypes [17,18].
The use of the main genotype effect (G), including the interaction of genotype with environment (GE) (G + GE) and AMMI analysis by agricultural researchers, has increased in recent years [19].
In this context, the main objective of the current research was to quantify the production performances of some sugar beet genotypes or productivity and sugar yield in relation to temperature and precipitation. The result of the present study may be of use to farmers as a time-saving and economical method to identify representative and discriminatory areas for sugar beet experimental fields involving yield and productivity and represents a great opportunity for the fast selection of a particular genotype to be used in a particular farm.

2. Materials and Methods

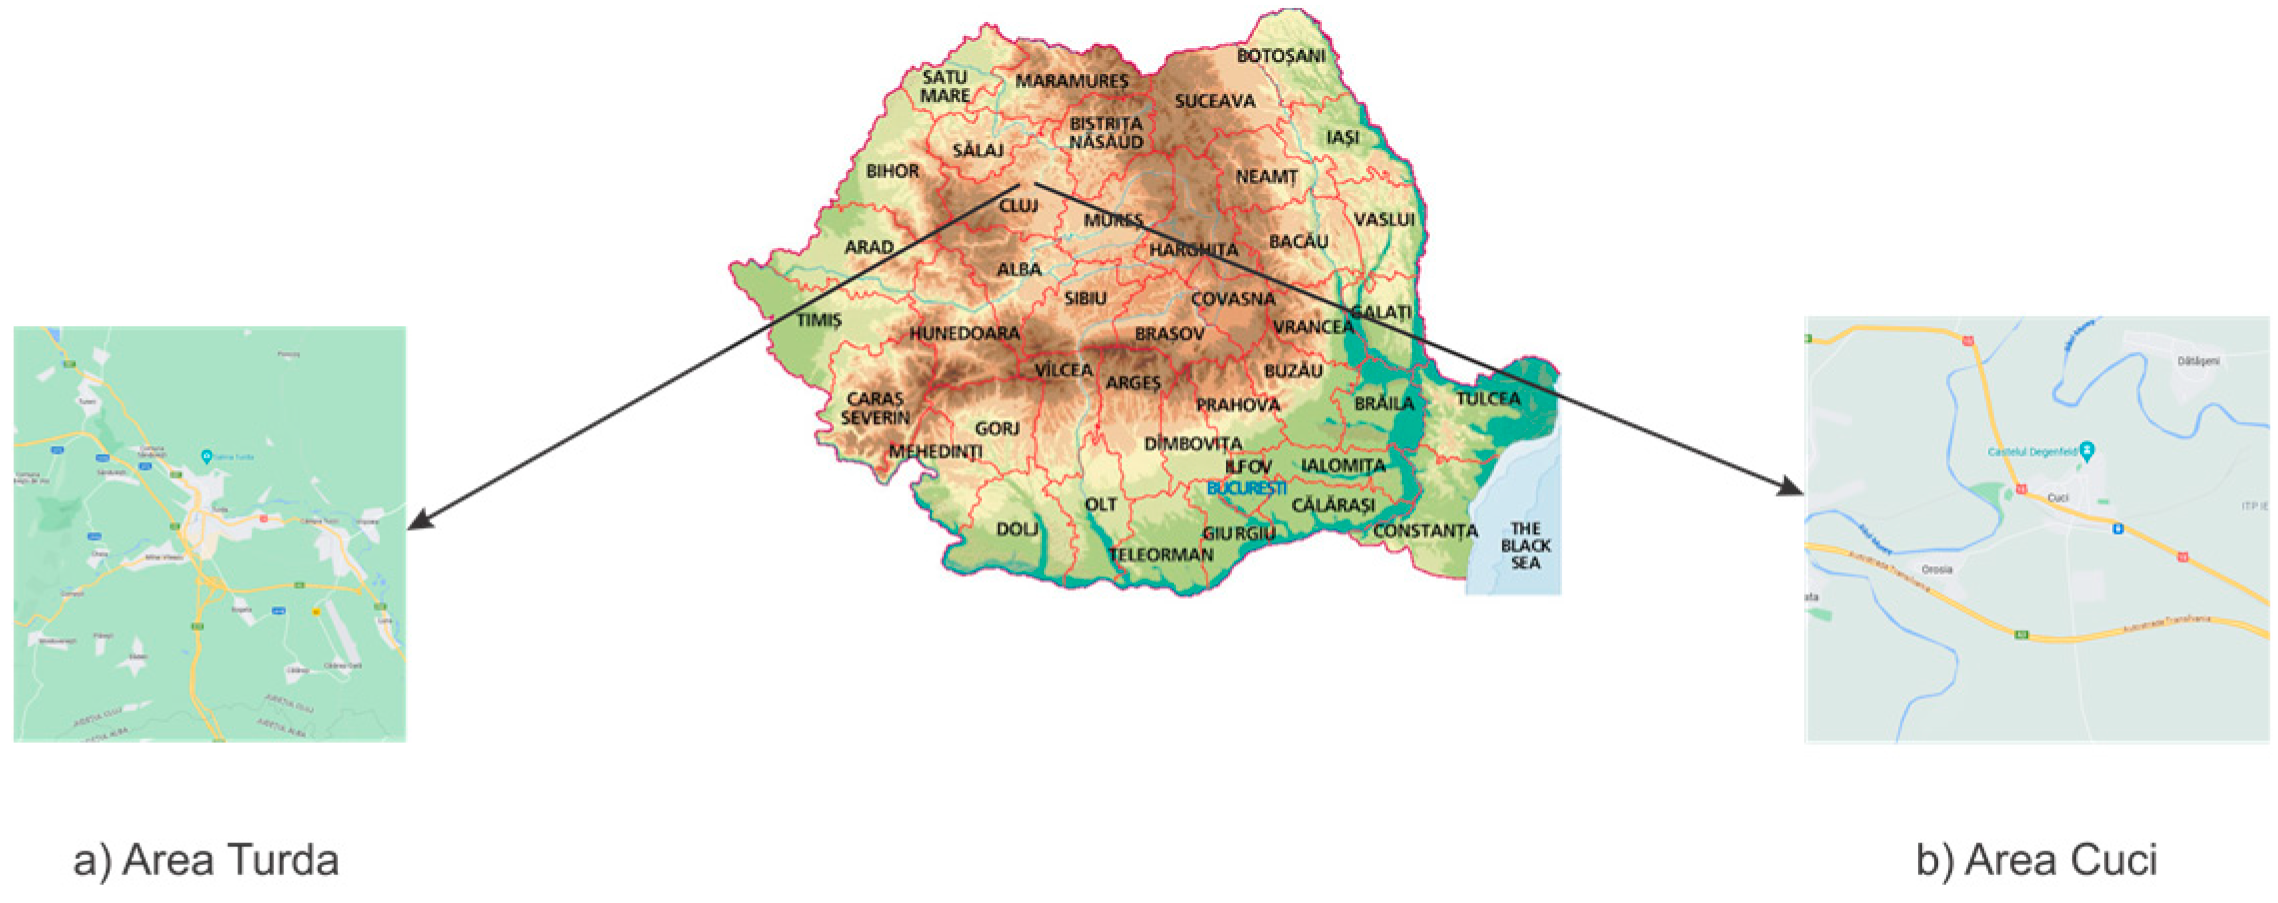
2.1. Plant Genetic Materials and Environments

In this research, twenty-three genotypes of sugar beet (Beta vulgaris L.) from five production companies (Florimond depresz (FD), Strube (STR), KWS (KWS), Maribo (MA), and Vanderhawe (SES)) were used to establish great genetic diversity and as many varieties as possible.
All the genotypes were evaluated for their quantitative characteristics (production yield and sugar production) and sugar content. The data regarding the quantitative features and sugar content were obtained from two different areas, namely, Turda (Figure 1a) and Cuci (Figure 1b), in two growing seasons during 2020–2021.
The cultivation areas (Turda and Cuci) are popular regions for sugar beet cultivation in Romania. Data regarding soil characteristics and climatic conditions for the specific period are presented in Table 1.

2.2. Experimental Design and Agronomic Practices

Each of the field experiments was performed according to a complete block design with four replicates. Each experimental plot consisted of three rows, with a 45 cm distance between the rows and a sowing depth of 2.5 cm. The spacing between plants was determined by using a plant density of 124.000 seeds/ha. Crop management included standard fertilization adapted to the particular conditions of each location, the use of herbicides and insecticides when needed, and seed treatment.
Productivity yield and sugar content were determined at the Ludus sugar factory, Romania (46.4649031 °N latitude and 24.0699223 °E longitude). Sugar yield per hectare was obtained from the root yield according to the following formula:
n e t   t o n s / h a   ×   d i g e s t i o n 100
and digestion was determined by using a polarimeter. The polarimeter method involved washing the sugar beet roots, weighing them, and transforming them into a homogenized paste. Afterwards, using an analytical balance, 30 g of paste was automatically dosed with the reagent (aluminum sulfate with distilled water), followed by filtration and introduction into a polarimeter using a 200 mm tube. The polarimeter display automatically showed the sugar content of the beet.

2.3. Statistical Analysis

ANOVA was employed to estimate the variance of genotypes, environment, and genotypes by environment using the R 3.5.1 software package. Furthermore, multivariate stability was performed to explain the G × E interaction based on the GGE biplot and AMMI. AMMI groups the univariate analysis of variance and multivariate principal component analysis.

3. Results and Discussion

3.1. Combined Variance Analysis for Yield, Sugar Content, Sugar Production, and Its Related Traits

ANOVA showed significant differences in the environment and genotype items (level of 99%) for sugar beet yield, sugar content, and sugar production. The environment explained 37.44% of the variance of the model and genotype 7.25% for sugar beet production, whereas for sugar content, the environment explained 52.13% of the variance of the model and genotype 7.12%. Concerning sugar production, the environment explained 26.84% of the variance of the model, and the genotype explained 11.74%. The Genotype × Environment interaction (G × E) was significant at a 99% level for all three analyzed traits and explained 21.04% of the variance for sugar beet production, 12.42% for sugar content, and 28.33% for production (Table 2).
According to our study (Table 2), genotype accounts for less variance compared to the environment and G × E interaction, which shows that it has a low influence on the considered sugar beet characteristics. One may note that variation explained by environment is almost two times higher for sugar content compared to sugar production, and about 15% higher compared to sugar beet yield, which suggests that environment influences to a greater extent, the sugar content, compared to sugar beet yield, and sugar production. Similar results concerning the environmental effect on yield and quality parameters are reported by Hoffman [20], who conducted a trial on nine sugar beet genotypes in 52 environments located in Europe.
The results of the combined variance analysis enabled us to emphasize that a suitable environment contributes to higher sugar beet yields and optimal sugar content, whereas a suitable environment and G × E interaction contribute to increased sugar production. These findings show that by considering targeted results, agronomic interventions may concentrate on the best environmental conditions, which facilitate a better adaptation of genotypes to these environmental conditions.

3.2. The AMMI Variance Analysis for Yield, Sugar Content, and Sugar Production

The AMMI model presents a comprehensive perspective on G × E interaction by analyzing it across multiple dimensions. Compared to ANOVA, the AMMI model provides superior prospects for studying and understanding G × E interactions [21]. In this study, the variance analysis applied to sugar beet yields of 23 genotypes tested over four environments, using the AMMI model, showed that the sugar beet yield variance was significantly influenced by the environment (p < 0.001) and had the most important contribution to the total variation, which was 30.93%. This shows that large differences are observed between the sugar beet yield functions of the environment. The genotype contributed to 5.99% of the total variance, whereas the G × E interaction contributed to 17.38%, and both contributions were highly significant (p < 0.001). These results show, on one hand, that differences between the sugar beet yield functions of genotypes are not substantial, and on the other hand, that the importance of the genotype responses to environments has about half of the magnitude of environmental influence.
The principal component analysis applied to the G × E interaction led to three-factor solutions, all of which were found to be significant for sugar beet yield at p < 0.001. The first principal component (PC1) environment explained 41.50% of the variance, the second principal component (PC2), represented by genotype, was 37.10%, and the third principal component (PC3), represented by G × E interaction, recorded the lowest value of 21.40%. The F-test at p < 0.001 showed that the first two principal components, PC1 and PC2, were significant for the AMMI model, with 46 degrees of freedom, and were the best predictors for the interaction of the 23 genotypes with the four environments. As the third principal component (PC3) was significant only at p < 0.01, it was considered less suitable as a predictor (Table 3).
The AMMI variance analysis applied to sugar content showed that both the main effects (genotype and environment) and their interaction were highly significant (p < 0.001) statistically. The largest share of variance was explained by the environment (46.37%), whereas genotype explained 9.15%, and G × E interaction explained 11.04% of the total variance. According to these results, one may find that environment is the factor that determines large differences between the sugar content of sugar beet. Thus, differences between genotype sugar content are not substantial, and the magnitude of the influence of the G × E interaction on sugar content is about 4.2 times smaller compared to the influence of the environment on sugar content (Table 4).
According to the PCA results, the first principal component (PC1) accounted for 55.40% of the variance, the second principal component (PC2) accounted for 30.20%, and the third principal component (PC3) accounted for 14.40%. The F-test at p < 0.001 showed that the first two principal components, PC1 and PC2, were highly significant for the AMMI model, and thus it shows that they are the best predictors for the G × E interaction. The third factor (PC3) was not significant at p > 0.05, indicating that it was not useful as a predictor (Table 4).
If we take into consideration sugar production, the AMMI model showed that it was highly significantly influenced by all considered factors (p < 0.001). Environment and G × E interaction had almost similar contributions to the variance of 21.56 and 19.67%, respectively, indicating that there are large differences between the sugar production functions of the above-mentioned factors. The genotype contributed to a total variation of 9.43%. These results show that environment and G × E interaction are the factors that determine large differences between sugar production, whereas the differences between sugar production of genotypes are not substantial (Table 5).
In the case of PCA applied to Genotype × Environment interaction for sugar production, the results also led to three-factor (principal components) solutions, which were found to be significant at different significance thresholds. The first principal component (PC1) explained 47.70% of the variance, and the second principal component (PC2) explained 34.10% of the variance. The third principal component (PC3) recorded the lowest value of 18.20%. The F-test at p < 0.001 showed that the first two principal components of the G × E interaction, PC1 and PC2, were highly significant for the AMMI model (p < 0.001%), and for this reason, they are considered the best predictors for the interaction of the 23 genotypes over four environments, whereas the third principal component (PC3) was significant only at p < 0.05, and thus, we considered it to be less suitable as a predictor (Table 5). The results of the AMMI variance analysis showed that the factors we took into consideration (environment, genotype, and G × E interaction) influence the sugar beet yield, sugar content, and sugar production in different ways. The environment greatly influences the sugar beet yield and sugar content, determining large differences between the reported results and the function of the environment. Sugar production is influenced by both the environment and G × E interaction.
The results of the variance analysis applied to the AMMI model enabled us to emphasize that a suitable environment contributes to higher sugar beet yields and optimal sugar content, whereas a suitable environment and G × E interaction contribute to increased sugar production. Considering the targeted results, these findings show that agronomic interventions may focus on the best environmental conditions that facilitate a better environmental adaptation of genotypes. Similar results are reported in [22,23], indicating that the main components of the AMMI analysis of variance (E, G, G × E interaction) conducted for sugar beet yield and qualitative parameters were significant. Concerning the largest proportion of the variance, they obtained different results; the authors of [21] found that it is attributed to environmental contributions, whereas the authors of [23] found that it is attributed to G × E interactions.

3.3. The AMMI Stability Value (ASV) for Yield, Sugar Content, and Sugar Production

Usually, the term stability is used to characterize a genotype that has constant production yields, independent of the cultivation environment [24]. Stability analysis methods are often used by breeders to identify genotypes that have stable performance and respond positively to improvements in environmental conditions [25]. The AMMI stability value (ASV) indicates genotype stability. Stability alone for yield performance does not warrant selection since a consistently low-yielding genotype can still be stable [26]. When assessing the yields and qualitative traits of annual crops across various locations, the genotypes often exhibit significant G × E interactions, which makes the selection or recommendation of suitable culture management challenging. To mitigate this interaction, one approach is to choose genotypes with enhanced stability across diverse environments, allowing for more accurate predictions of their performance [25,27,28] (Table 6).
According to the AMMI stability value (ASV) calculated in our study, we identified the most stable genotypes, which corresponded to the lowest scores. For sugar beet yield, we identified genotypes 2, 5, 10, and 14 as the most stable, corresponding to the lowest ASV values, and genotypes 8 and 11 as less stable, corresponding to the highest ASV value (Table 6).
Concerning sugar content, we identified genotypes 10, 15, 16, and 17 as the most stable, corresponding to the lowest ASV values, and genotype 8 as the least stable, corresponding to the highest ASV values. For sugar production, we identified genotypes 2, 4, 10, and 16 as the most stable, corresponding to the lowest ASV values, and genotype 11 as the least stable, corresponding to the highest ASV values (Table 6).
Genotypes 2 and 17 present low sugar beet yield and sugar production, respectively; they have low ASV value and are more stable, whereas genotypes 8 and 11 have high production but are less stable, confirming the assessment of [26], according to whom a consistently low-yielding genotype can still be stable. Genotype G10 is the only genotype that presents high yield, sugar content, sugar production, and low ASV values, indicating high stability. Similar results concerning discrepancies between yield and stability values are reported by [28] for a trial conducted on 11 lentil genotypes across 20 different environments.
The AMMI ASV is important for the identification of genotypes with the best stable performances, which enable them to have appropriate responses to improvements in environmental conditions [22,29]. This is a valuable indicator in our study, emphasizing that the analysis of production descriptors (sugar beet yield, sugar content, and sugar production) is mainly influenced by the environment. Genotype 10 is the most stable for all analyzed sugar beet production descriptors. The other four genotypes are identified as the most stable for two descriptors, i.e., genotypes 2 and 14 for sugar beet yield and sugar content, and 16 and 17 for sugar content and production. For this reason, we consider the use of these five genotypes as the best alternative if alterations in environmental conditions are performed to enhance sugar beet production performance and quality. Genotypes 8 and 11 are less stable; thus, for this reason, they are presumed to have low adaptation to environmental modification (Table 6).

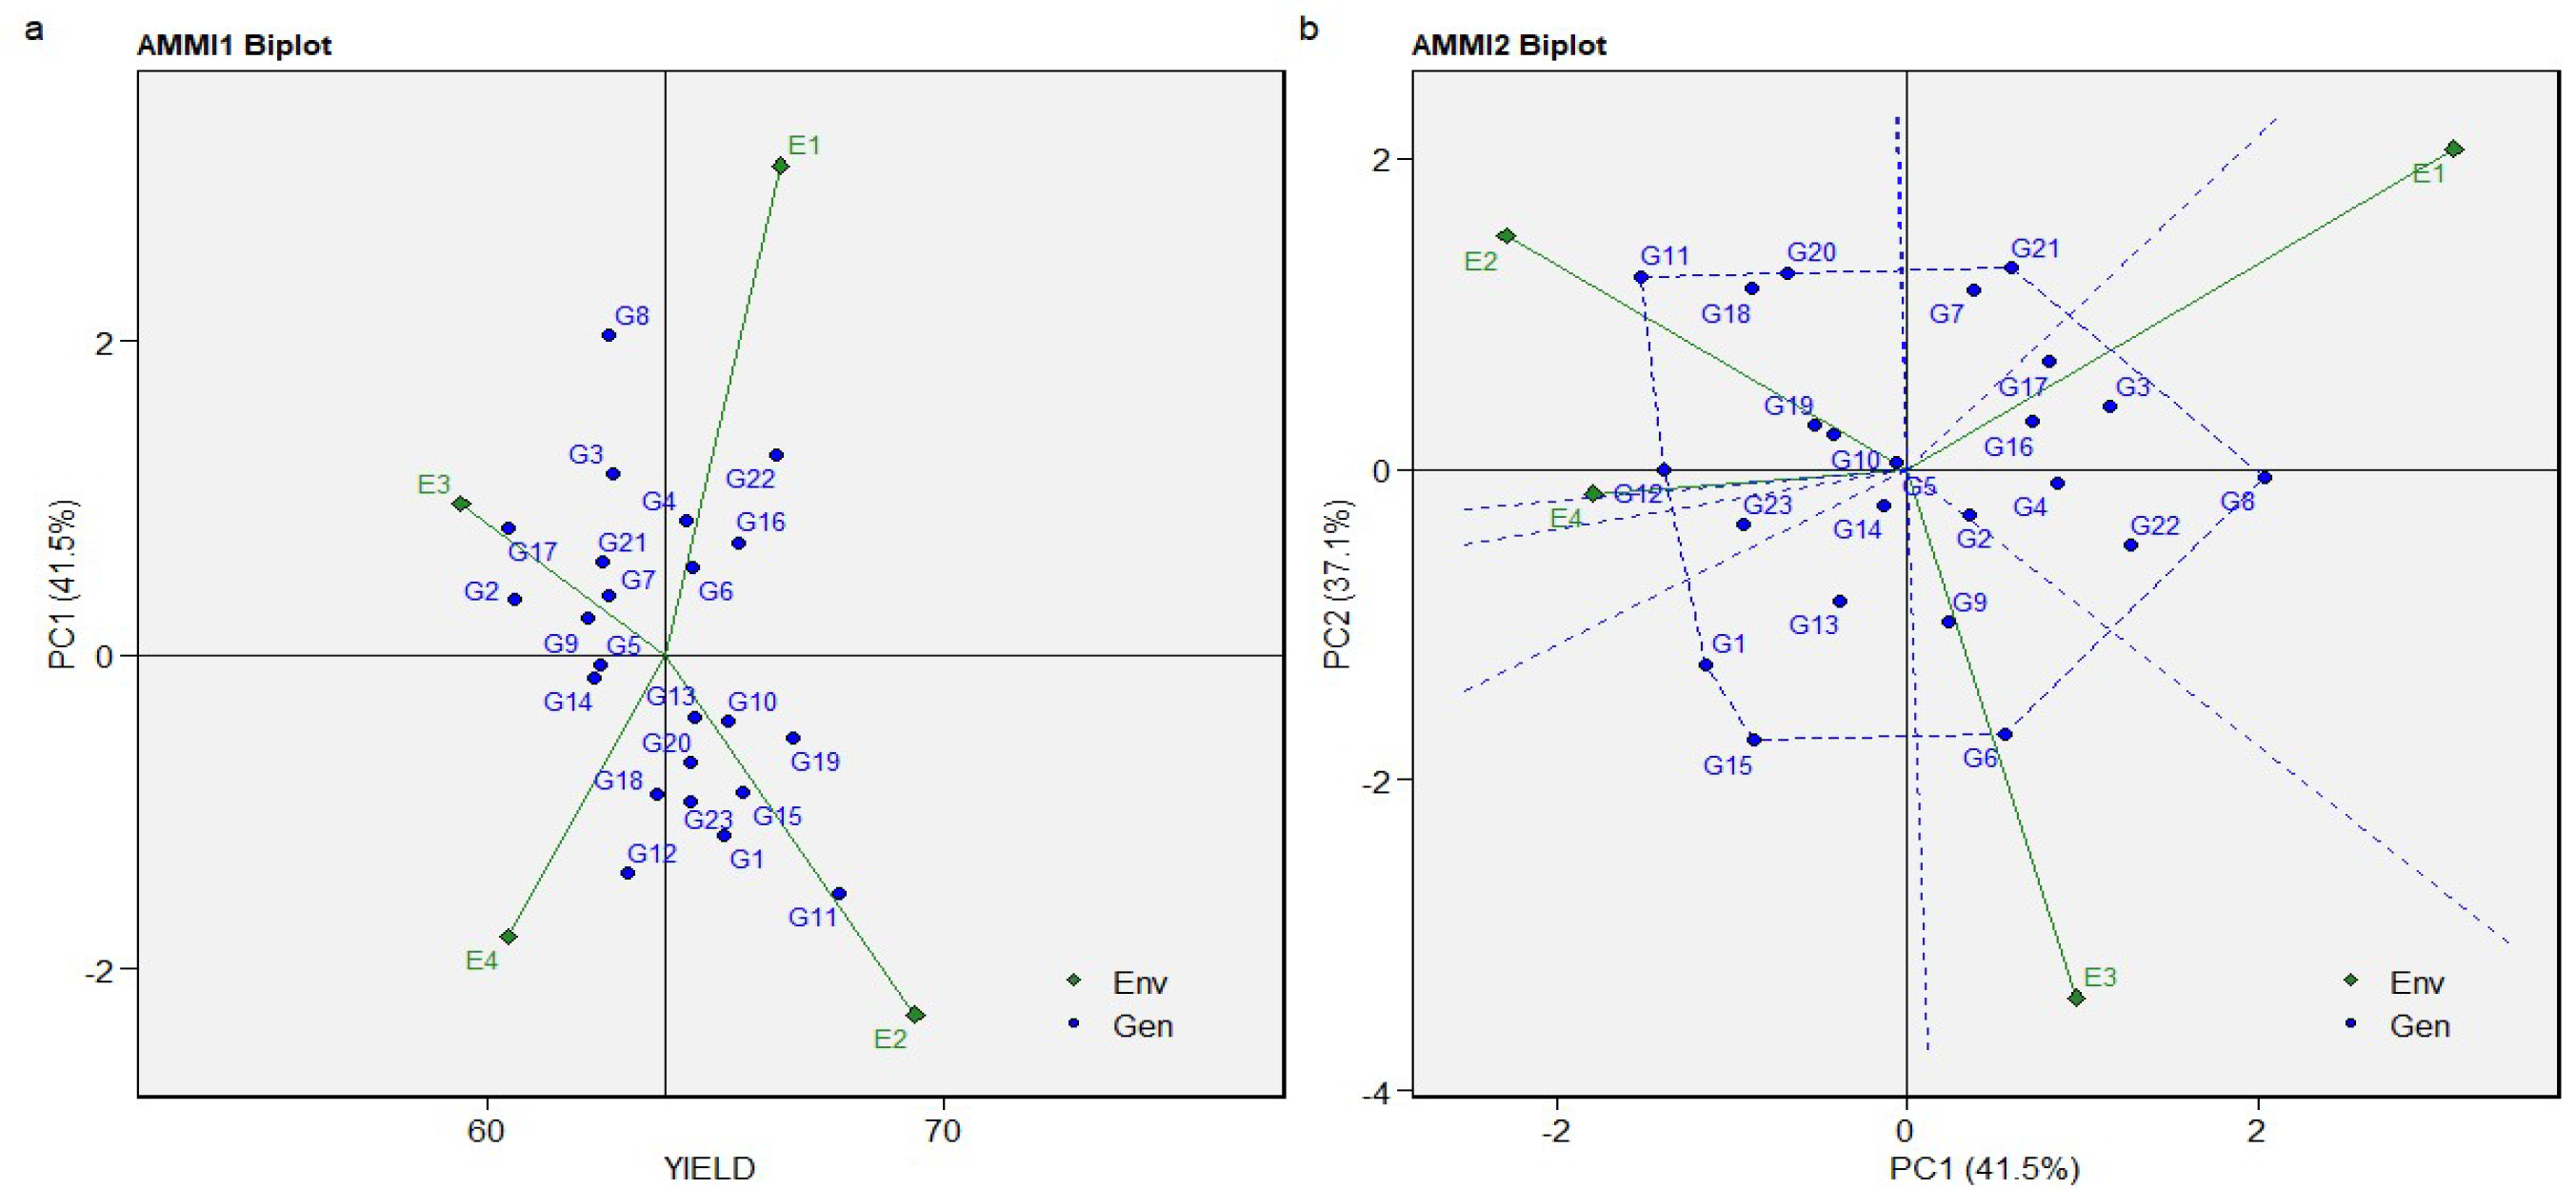
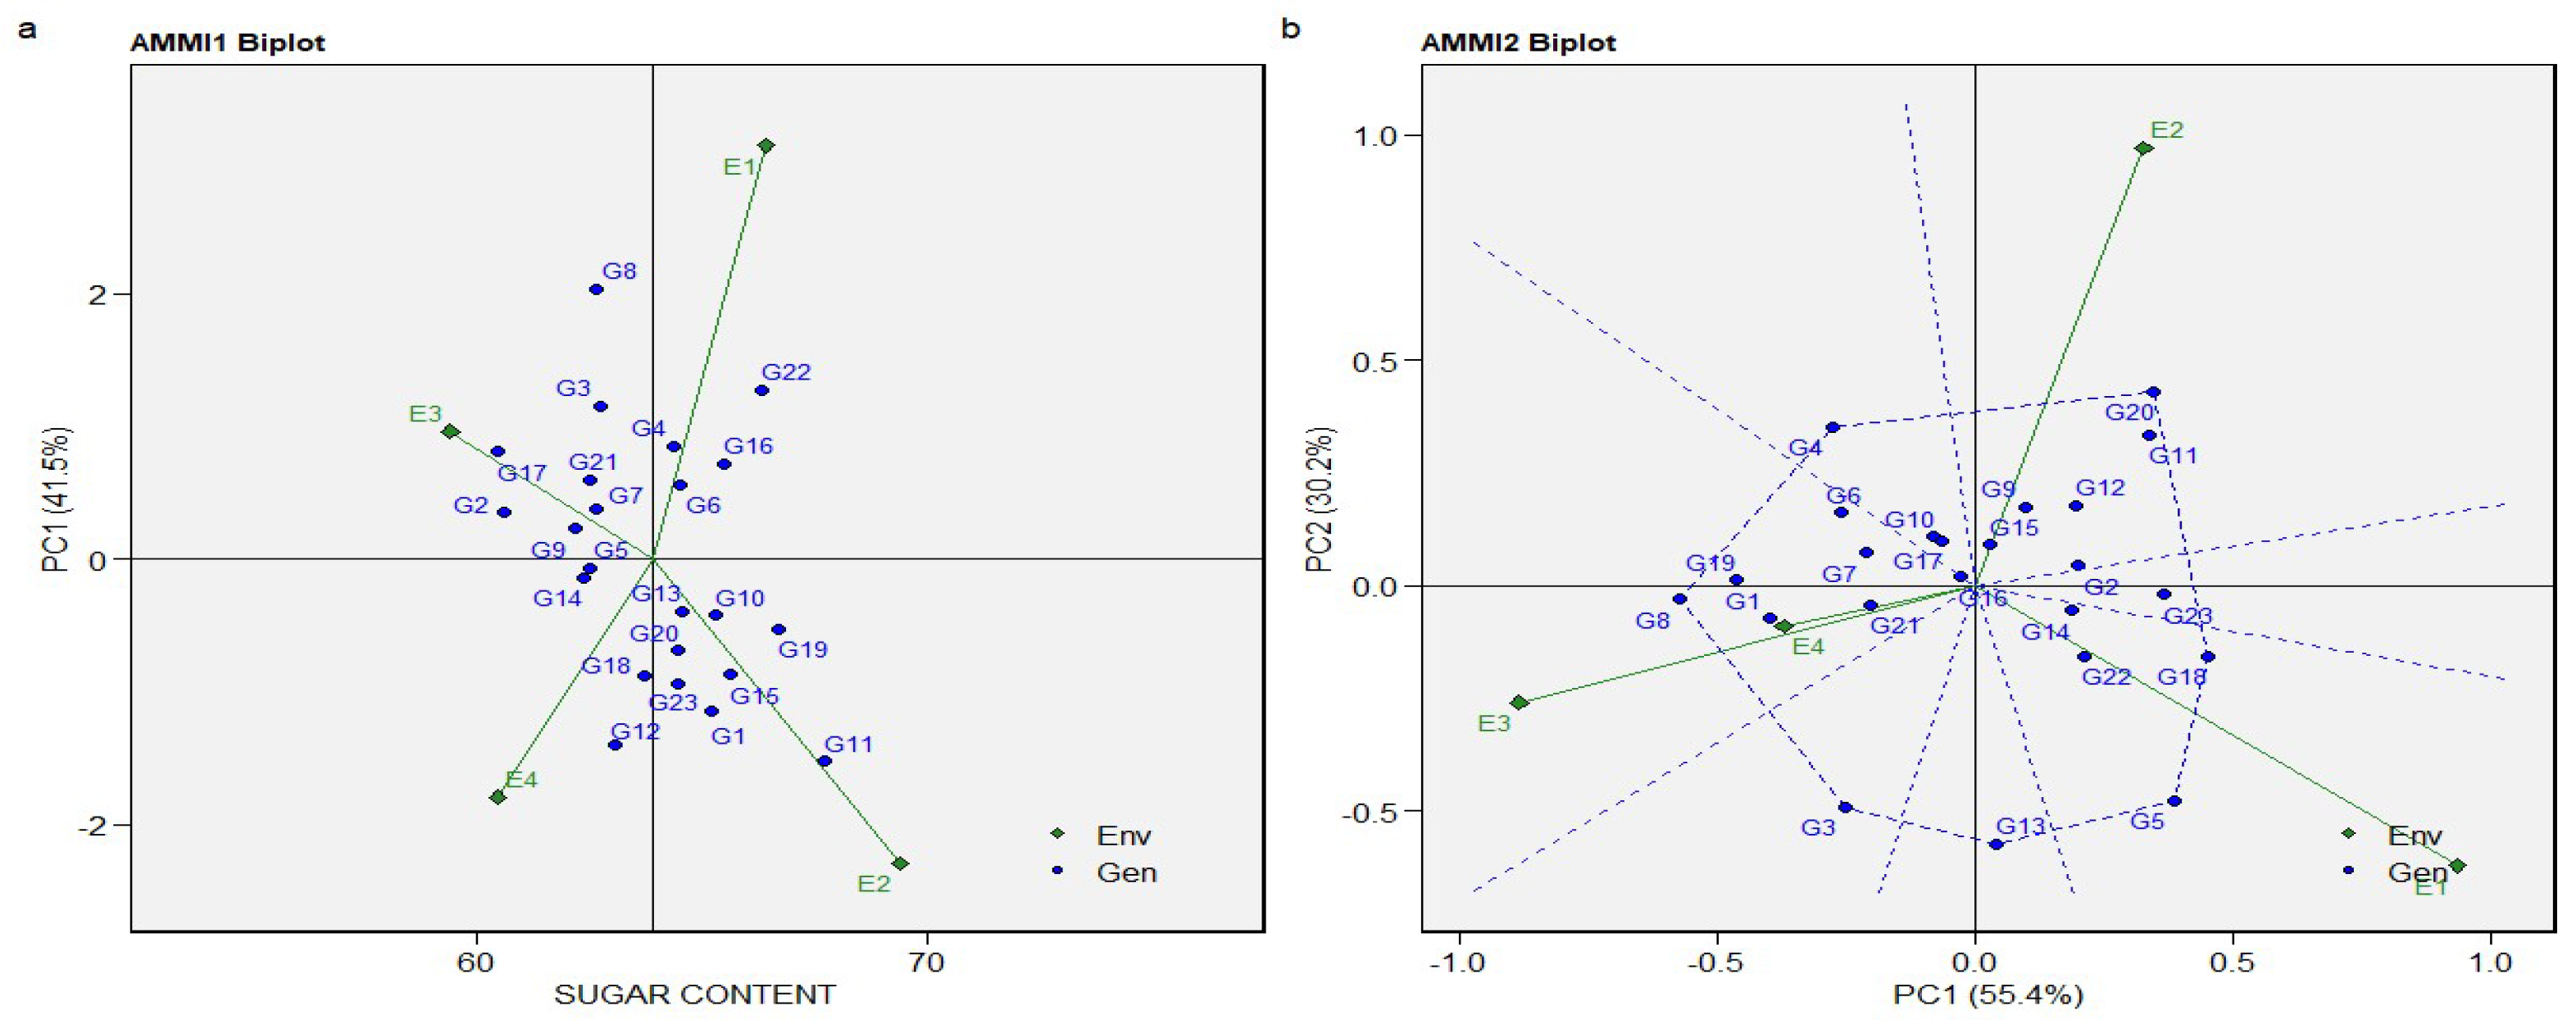
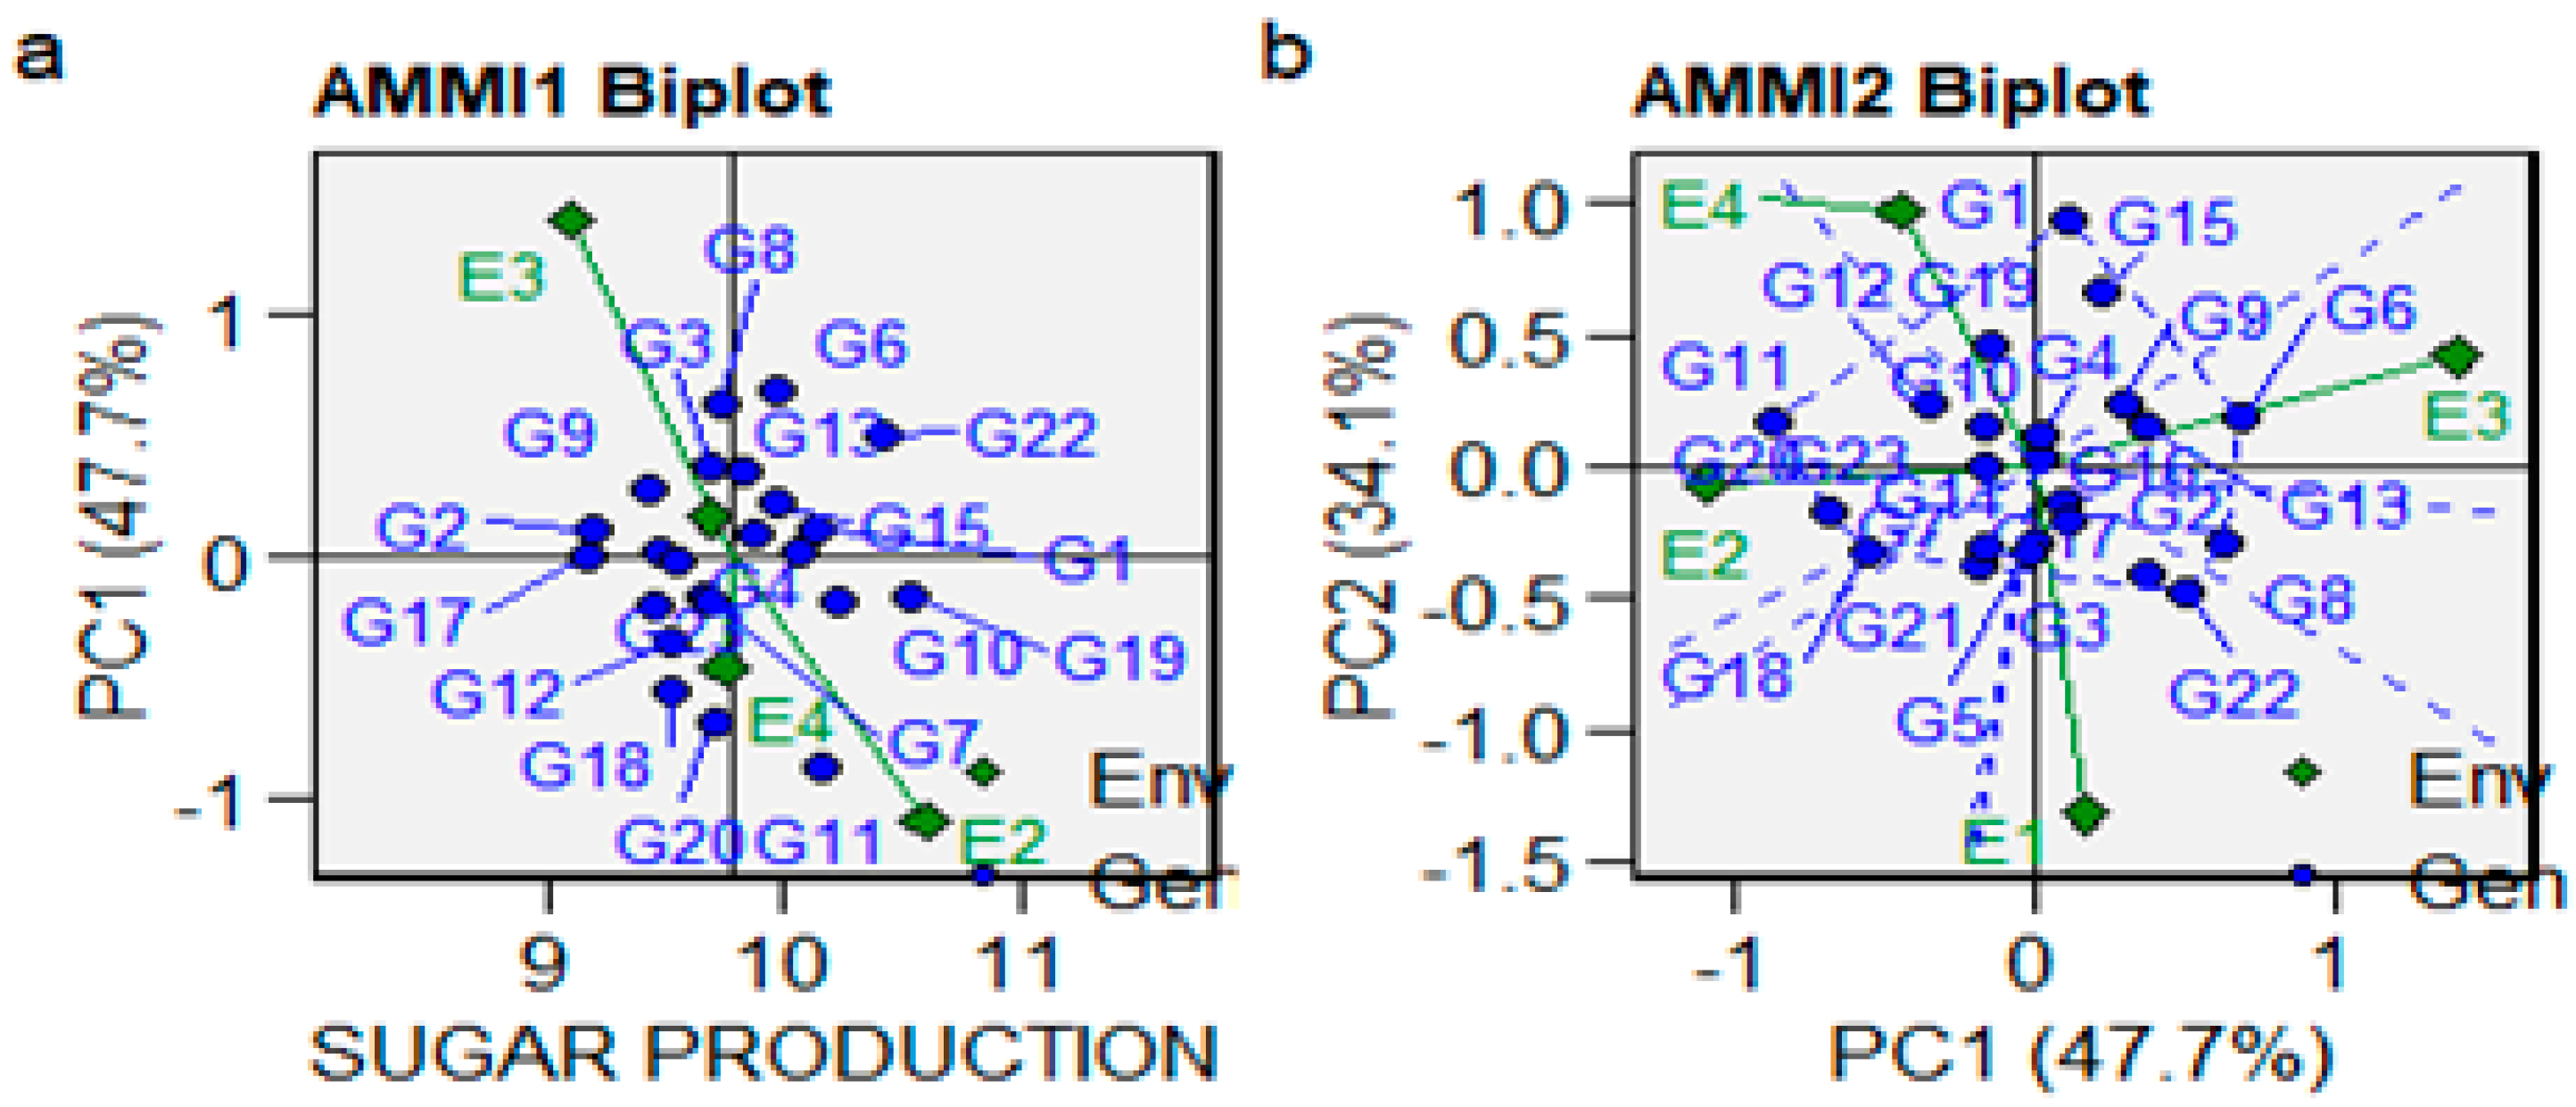
3.4. The AMMI Mono- and Biplot Model for Yield, Sugar Content, and Sugar Production

In the additive main effects and multiplicative interaction 1 (AMMI 1), the biplot abscissa and ordinate indicated the first principal component (PC1) term and the trait’s significant influence, respectively, and showed the variation in the principal additive effects of environments and genotypes (horizontal axis), and variation in the multiplicative effects of the G × E interaction (vertical axis). The PCA conducted for additive main effects and multiplicative interaction (AMMI 2) led to a principal component (PC1 and PC2) score-based graphical representation of summarized information, which provides advantages over joint regression-based analysis. AMMI 2 divulges and infers the complicated G and G × E interactions that involve significant multi-environments and the detection of genotypes with either broad or narrow spectrum adaptability. According to the AMMI 2 biplot, one may note that genotypes with similar yields, sugar content, and production are located closer to each other.
Concerning sugar beet yield, the AMMI 1 biplot shows a significant influence on yield and PC1. Environment 3 has a PCA1 score closer to zero compared to the other three environments (Figure 2a). This indicates that Environment 3 has a lower interaction with genotypes, and this ensures better performance concerning sugar beet yield for all the genotypes cultivated in this environment. The PCA conducted for the AMMI model applied to sugar beet yield shows that 11 genotypes (G2, G3, G4, G6, G7, G8, G9, G16, G17, G21, and G22) located in Environments 1 and 3 have high PC1 scores and are positively correlated with it. Thus, PC1 primarily measures the positive influence of Environment 1 and Environment 3 on 11 genotypes, emphasizing the best results obtained as a consequence of the G × E interaction. The intensity of the G × E interaction is revealed by the distance between both genotype and environment vectors originating from the zero point of the biplot [30]. The genotypes located close to the origin of the coordinates (close to zero) are considered to have the smallest interactions and a smaller angle between the environment vectors, indicating a greater correlation between those environments [31]. Genotypes 7 and 21, on the one hand, and 6, on the other hand, which are located at the highest distance from the biplot origin, are considered to have the best performances in Environment 1 and Environment 3, respectively, where they are cultivated.
Nine genotypes (3, 7, 11, 16, 17, 18, 19, and 20), located in Environments 1 and 2, have high PC2 scores and are positively correlated with it, so PC2 primarily measures the positive influence of Environment 1 and Environment 2 on 9 genotypes, emphasizing the best results obtained as a consequence of the G × E interaction. Genotypes 7 and 21, on the one hand, and 11, 18, and 20, on the other hand, which are located at the highest distance from the biplot origin, are considered to have the best performance in Environment 1 and Environment 2, respectively, where they are cultivated. PC1 explains 41.50% of the variability in the data, whereas PC2 explains 37.10% (Figure 3).
Analysis of AMMI 1 biplot for sugar content shows its significant influence and PC1. Similar to the results obtained for AMMI 1 biplot analysis of sugar beet, Environment 3 has a PCA1 score closer to zero compared to the other three environments (Figure 3a). This indicates that Environment 3 has a lower interaction with genotypes, and this ensures better performance concerning the sugar content of all genotypes cultivated in Environment 3. The PCA conducted for the AMMI model 2 biplot applied to sugar content shows that 12 genotypes (G2, G5, G9, G11, G12, G13, G14, G15, G18, G20, G22, and G23) located in Environments 1 and 2 have high PC1 scores and are positively correlated with it. Genotypes 11 and 20 are considered to have the best performance in Environment 2, and genotypes 5 and 13 are considered to have the best performance concerning sugar content in Environment 2. Five genotypes (9, 11, 12, 15, and 20), located in Environment 2, have high PC2 scores and are positively correlated with it. PC1 explains 55.40% of the variability in the data, whereas PC2 explains 30.20% (Figure 3b).
The additive main effects and multiplicative interaction 1 Biplot corresponding to sugar production show that Environment 1 has a PCA1 score closer to zero (Figure 4a), indicating, in this case, that Environment 1 has lower interaction with genotypes and this ensures better performance concerning sugar production of all genotypes cultivated in this environment. The PCA conducted for the AMMI model applied to sugar production shows that 12 genotypes (G1, G2, G3, G4, G6, G8, G9, G13, G15, G16, G17, and G22) located in Environments 1 and 3, have high PC1 scores and are positively correlated with it. PC1 primarily measures the positive influence of Environments 1 and 3 on 12 genotypes, emphasizing the best results obtained as a consequence of the G × E interaction (Figure 4b).
Genotypes 1 and 15 are located at the highest distance from the biplot origin, and for this reason, are considered to have the best performance in terms of sugar production in Environment 3. Because genotype 22 is located at the highest distance from the biplot origin, it is considered to have the best performance concerning sugar production in Environment 1. Ten genotypes (1, 4, 6, 9, 10, 11, 12, 15, 16, and 19) located in Environments 3 and 4 have high PC2 scores and are positively correlated with it. Genotype 19, on the one hand, and 1 and 15, on the other hand, which are located at the highest distance from the biplot origin, are considered to have the best performance in Environment 4 and Environment 3, respectively, where they are cultivated. PC1 explains 47.70% of the variability in the data, whereas PC2 explains 34.10% (Figure 4b).

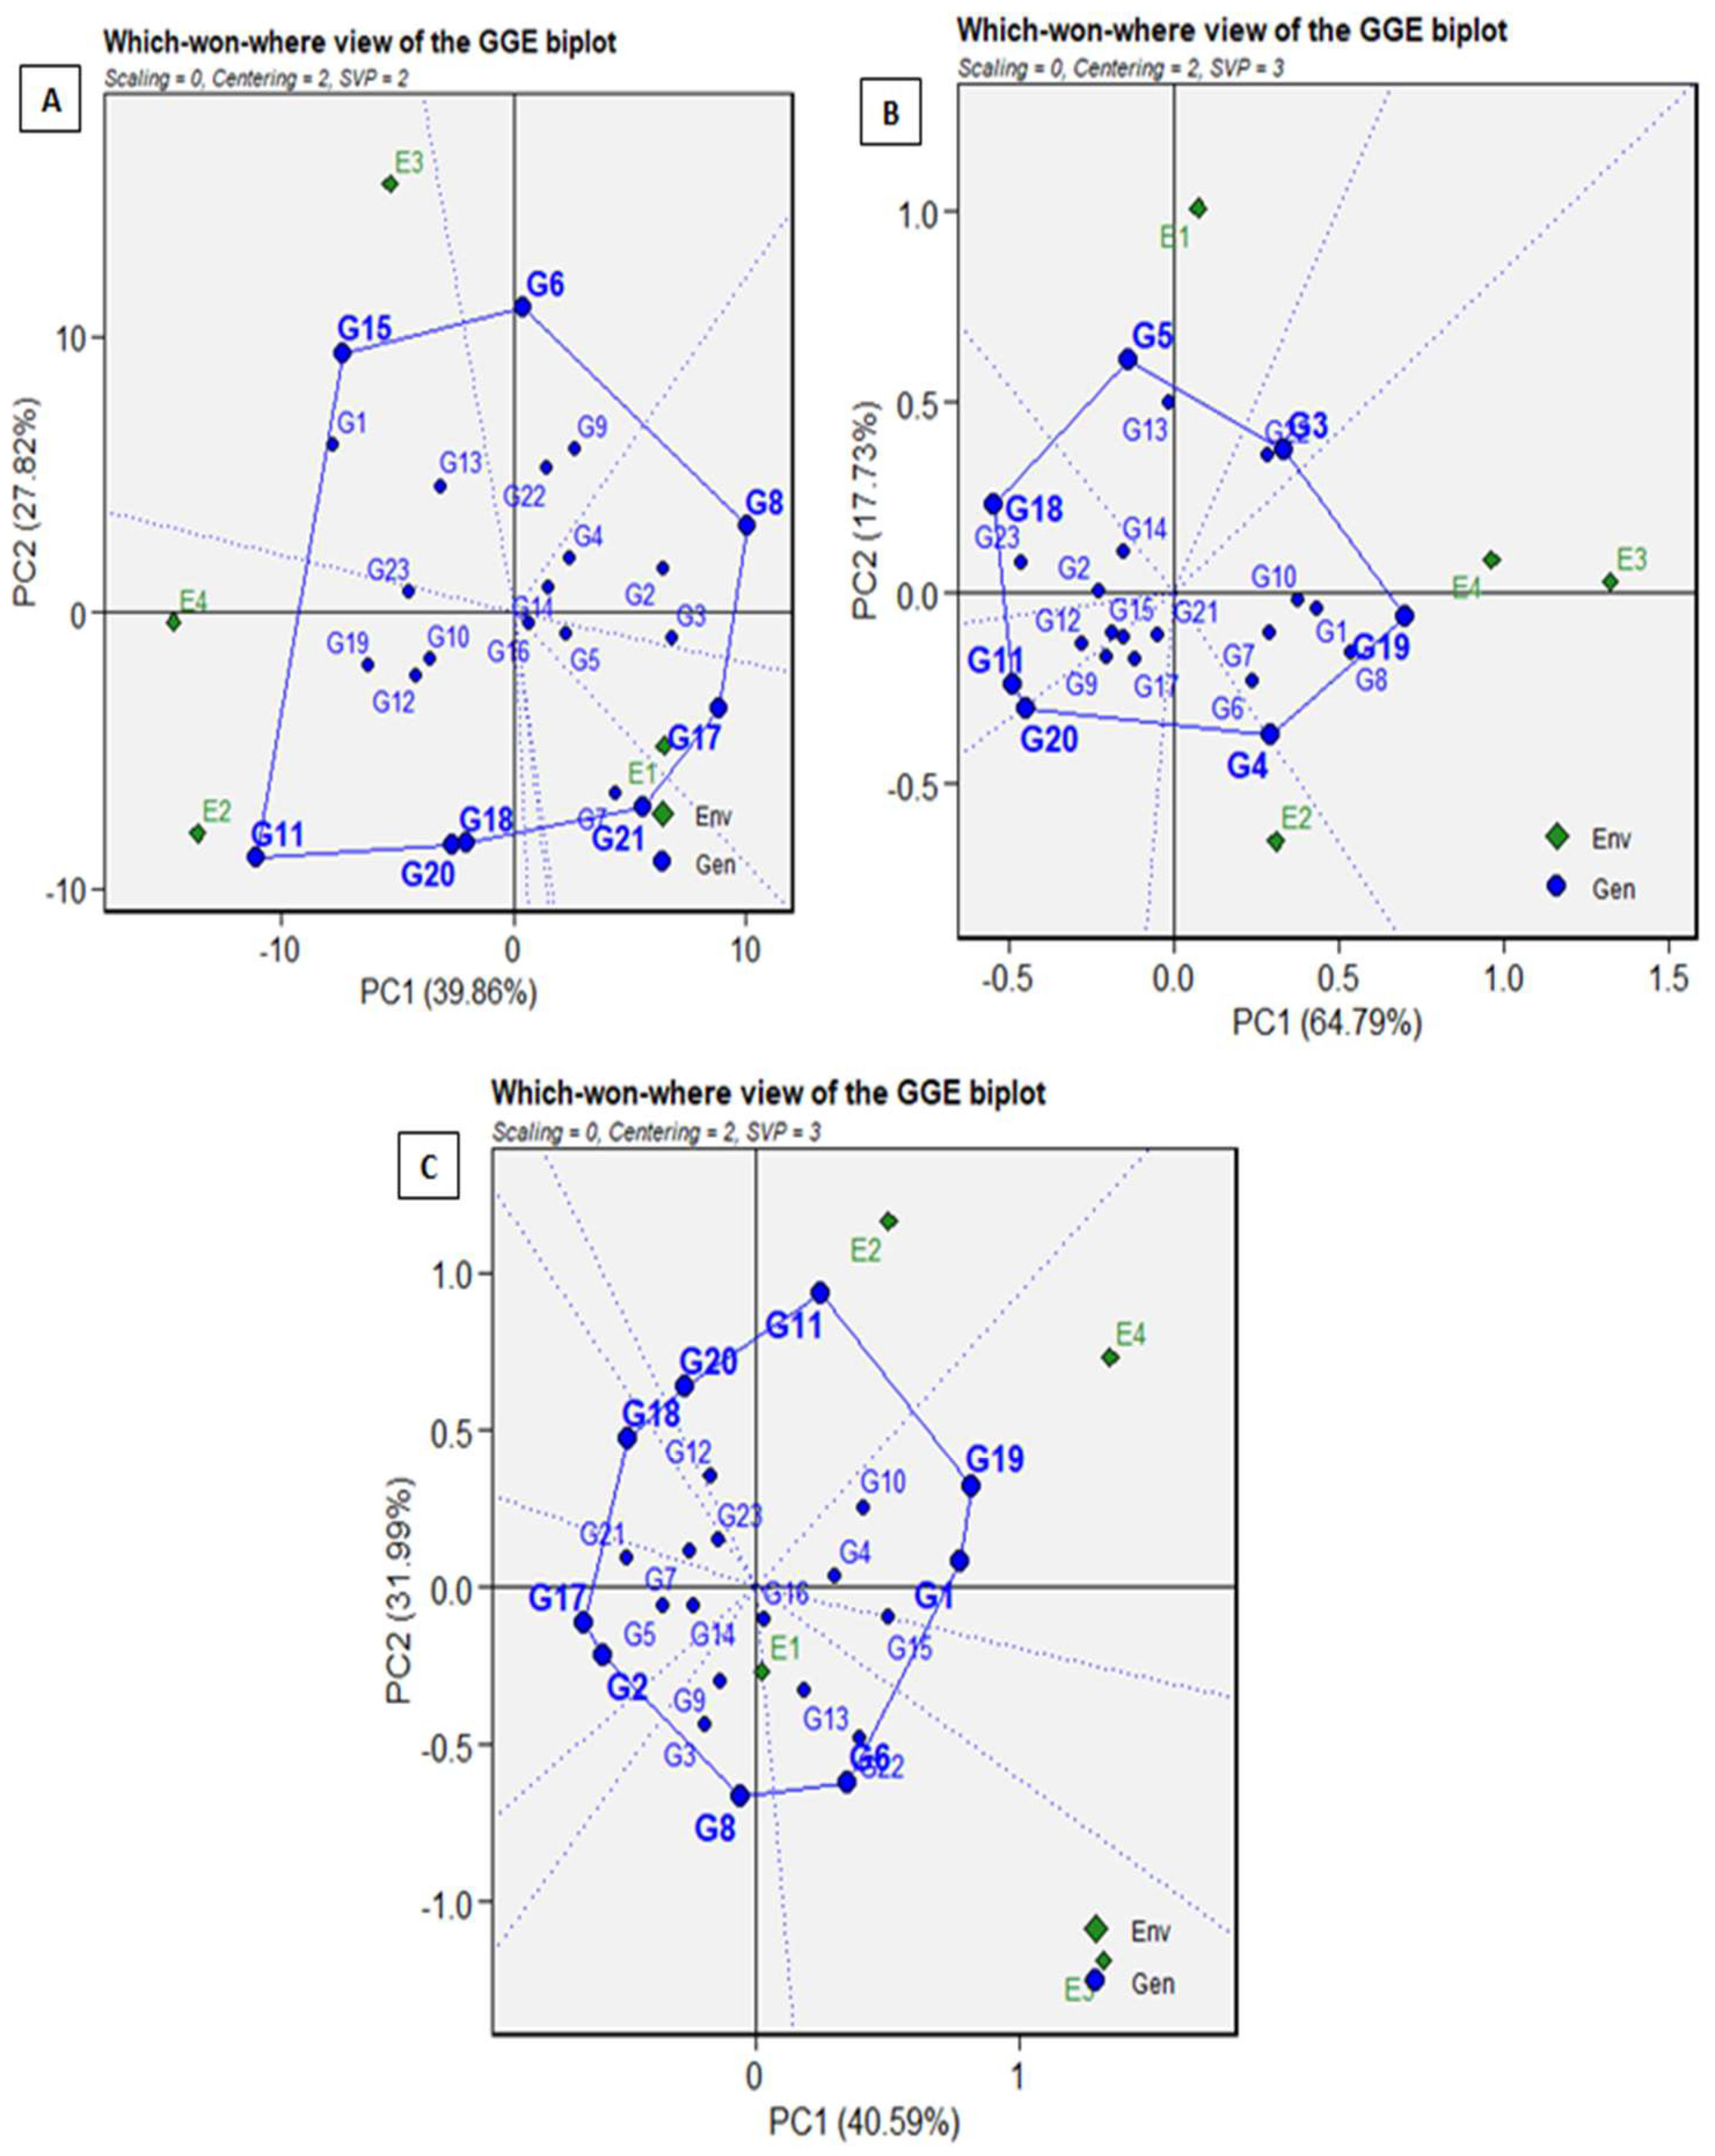
3.5. The GGE Biplot (‘Which-Won-Where’ Pattern) for Yield, Sugar Content, and Sugar Production

The recognition of mega-environments holds significant value in practice because it allows for the identification of distinctive and representative environments [32]. These environments can serve as effective test locations to evaluate genotypes that are adaptable to various conditions. Moreover, they aid in developing breeding strategies to enhance the adaptation of specific genotypes to particular environmental factors [33,34]. Considering that under multi-environment trials (MET), the main effect of the genotype (G) and G × E interaction represents the main source of variation in genotype assessment for visualizing the GEI pattern based on the correlation between genotype and environment, we approached the ’which-won-where’ pattern [30,35]. The G + G × E biplot patterns (Figure 5) for sugar beet yield, sugar content, and sugar production show that GGE variation is recorded as 67.68% (A), 82.52% (B), and 72.58% (C), respectively.
The environmental indicators positioned into 3, 2, and 2 segments of the biplot for sugar beet yield (A), sugar content (B), and sugar production (C) confirm the G × E interactions for all the above-mentioned traits. The GGE biplots are divided into 6, 7, and 9 clockwise fan-shaped segments for sugar beet yield, sugar content, and sugar production. According to the GGE biplot for sugar beet yield results, genotypes G17 and G21 have the best yields in Environment 1, whereas genotype G11 in Environments 2 and 4, and genotype G15 in Environment 3 have low performance in the corresponding environments [36,37]. For sugar content, genotypes G4 and G19 have the best performance in Environment 2, whereas genotype G3 has the lowest performance in Environments 1, 3, and 4. Genotype G6 has the highest sugar production in Environment 1 and the lowest in Environment 3. Genotypes G11 and G19 have the lowest sugar production in Environment 2 and Environment 4, respectively.

4. Conclusions

According to the results of our study, combined variance analysis for yield, sugar content, sugar production, and its related traits in sugar beet is a valuable approach that allows us to reach a comprehensive understanding of the factors influencing the above-mentioned production parameters. The G × E interaction was significant for all described traits in all sugar beet genotypes over the four considered environments, indicating the need to test the genotypes in multiple environments before effective selection can be made. From AMMI ASV analysis results, a single genotype, G10, presents high values for yield, sugar content, and production, and low ASV values, indicating high stability. According to AMMI 1 biplot 2 biplot analysis and the ‘which won where’ pattern, for genotype G11, the highest sugar beet yield is reported in Environment 2 compared to all other genotypes. Applying AMMI model allows us to describe G × E interaction, whereas AMMI ASV analysis and 2 biplot approaches facilitate the identification of genotypes possessing stable production traits and describe the specificity in production patterns and adaptability of the genotypes to specific environments, whereas ‘which won where’ pattern enables grouping of genotypes based on similarity in their performance across environments.

Author Contributions

Conceptualization, C.O. and F.U.; methodology, I.C.M. and A.O.; software I.C.M. and P.B.; validation, C.O., F.U. and I.O.; formal analysis I.C.M.; investigation, F.U. and I.V.P.-M.; data curation, I.C.M.; writing—original draft preparation, C.O.; writing—review and editing, C.O. and I.O.; supervision, C.O. All authors have read and agreed to the published version of the manuscript.

Funding

This research received no external funding.

Institutional Review Board Statement

Not applicable.

Informed Consent Statement

Not applicable.

Data Availability Statement

Not applicable.

Conflicts of Interest

The authors declare no conflict of interest.

References

  1. Ministry of Agriculture an Rural Development. 2022. Available online: www.madr.ro (accessed on 17 July 2023).
  2. Kühnel, S.; Schols, H.A.; Gruppen, H. Aiming for the Complete Utilization of Sugar-Beet Pulp: Examination of the Effects of Mild Acid and Hydrothermal Pretreatment Followed by Enzymatic Digestion. Biotechnol. Biofuels 2011, 4, 14. [Google Scholar] [CrossRef]
  3. Berłowska, J.; Pielech-Przybylska, K.; Balcerek, M.; Dziekońska-Kubczak, U.; Patelski, P.; Dziugan, P.; Kręgiel, D. Simultaneous Saccharification and Fermentation of Sugar Beet Pulp for Efficient Bioethanol Production. BioMed Res. Int. 2016, 2016, 3154929. [Google Scholar] [CrossRef]
  4. Ahmed, S.; Shahzad, F.; Rahman, H.-U.; Rajab, M. Effects of Sugar Beet Pulp Based Total Mixed Ration on Growth Performance and Blood Profile Status in Male Nili Ravi Buffalo Calves. Turk. J. Veter-Anim. Sci. 2020, 44, 928–933. [Google Scholar] [CrossRef]
  5. Broccanello, C.; McGrath, J.M.; Panella, L.; Richardson, K.; Funk, A.; Chiodi, C.; Biscarini, F.; Barone, V.; Baglieri, A.; Squartini, A.; et al. A SNP mutation affects rhizomania-virus content of sugar beets grown on resistance-breaking soils. Euphytica 2018, 214, 14. [Google Scholar] [CrossRef]
  6. Jaggard, K.W.; Clark, C.J.A.; Draycott, A.P. The weight and processing quality of components of the storage roots of sugar beet (Beta vulgaris L). J. Sci. Food Agric. 1999, 79, 1389–1398. [Google Scholar] [CrossRef]
  7. Milford, G.F.J.; Houghton, B.J. An analysis of the variation in crown size in sugar-beet (Beta vulgaris) grown in England. Ann. Appl. Biol. 1999, 134, 225–232. [Google Scholar] [CrossRef]
  8. Verma, A.; Deepti, S. Abiotic stress and crop improvement: Current scenario. Adv. Plants Agric. Res. 2016, 4, 345–346. [Google Scholar]
  9. Hoberg, F.; Ladewig, E.; Kenter, C. Genotype environment interactions in sugar beet in Germany. In Proceedings of the IIRB-Congress, Brussels, Belgium, 16–17 February 2016. [Google Scholar]
  10. Gholami, R.; Zahedi, S.M. Identifying superior drought-tolerant olive genotypes and their biochemical and some physiological responses to various irrigation levels. J. Plant Nutr. 2019, 42, 2057–2069. [Google Scholar] [CrossRef]
  11. Okorie, V.O.; Mphambukeli, T.N.; Amusan, S.O. Exploring the political economy of water and food security nexus in BRICS. Afr. Insight 2019, 48, 21–38. [Google Scholar]
  12. Phuke, R.M.; Anuradha, K.; Radhika, K.; Jabeen, F.; Anuradha, G.; Ramesh, T.; Hariprasanna, K.; Mehtre, S.P.; Deshpande, S.P.; Anil, G.; et al. Genetic Variability, Genotype × Environment Interaction, Correlation, and GGE Biplot Analysis for Grain Iron and Zinc Concentration and Other Agronomic Traits in RIL Population of Sorghum (Sorghum bicolor L. Moench). Front. Plant Sci. 2017, 8, 712. [Google Scholar] [CrossRef] [PubMed]
  13. Diyah, H.S.; Hadi, A.F. AMMI Model for Yield Estimation in Multi-Environment Trials: A Comparison to BLUP. Agric. Agric. Sci. Procedia 2016, 9, 163–169. [Google Scholar] [CrossRef]
  14. Ma, D.; Stützel, H. Prediction of winter wheat cultivar performance in Germany: At national, regional and location scale. Eur. J. Agron. 2014, 52, 210–217. [Google Scholar] [CrossRef]
  15. Yan, W. Analysis and handling of G × E in a practical breeding program. Crop. Sci. 2016, 56, 2106–2118. [Google Scholar] [CrossRef]
  16. Rodrigues, P.C.; Malosetti, M.; Gauch, H.G.; van Eeuwijk, F.A. A weighted AMMI algorithm to study genotype-by-environment interaction and QTL-by-environment interaction. Crop. Sci. 2014, 54, 1555–1570. [Google Scholar] [CrossRef]
  17. Li, W.; Yan, Z.-H.; Wei, Y.-M.; Lan, X.-J.; Zheng, Y.-L. Evaluation of Genotype × Environment Interactions in Chinese Spring Wheat by the AMMI Model, Correlation and Path Analysis. J. Agron. Crop. Sci. 2006, 192, 221–227. [Google Scholar] [CrossRef]
  18. Agahi, K.; Ahmadi, J.; Oghan, H.A.; Fotokian, M.H.; Orang, S.F. Analysis of genotype × environment interaction for seed yield in spring oilseed rape using the AMMI model. Crop. Breed. Appl. Biotechnol. 2020, 20, e26502012. [Google Scholar] [CrossRef]
  19. Yan, W.; Kang, M.S.; Ma, B.; Woods, S.; Cornelius, P.L. GGE Biplot vs. AMMI Analysis of Genotype-by-Environment Data. Crop Sci. 2007, 47, 643–653. [Google Scholar] [CrossRef]
  20. Hoffmann, C.M.; Huijbregts, T.; van Swaaij, N.; Jansen, R. Impact of different environments in Europe on yield and quality of sugar beet genotypes. Eur. J. Agron. 2009, 30, 17–26. [Google Scholar] [CrossRef]
  21. Vargas, M.; Crossa, J.; Van Eeuwijk, F.; Sayre, K.D.; Reynolds, M.P. Interpreting treatment × environment interaction in agronomy trials. Agron. J. 2001, 93, 949–960. [Google Scholar] [CrossRef]
  22. Hassani, M.; Heidari, B.; Dadkhodaie, A.; Stevanato, P. Genotype by environment interaction components underlying variations in root, sugar and white sugar yield in sugar beet (Beta vulgaris L.). Euphytica 2018, 214, 79. [Google Scholar] [CrossRef]
  23. Moradi, F.M.; Safari, H.; Jalililan, A. Study of genotype × environment interaction for sugar beet monogerm cultivars using AMMI method. J. Sugar Beet 2012, 28, 55–66. [Google Scholar] [CrossRef]
  24. Flores, F.; Moreno, M.; Cubero, J. A comparison of univariate and multivariate methods to analyze environments. Field Crop. Res. 1998, 56, 271–286. [Google Scholar] [CrossRef]
  25. Jafari, T.; Farshadfar, E. Stability analysis of bread wheat genotypes (Triticum aestivum L.) by GGE biplot. Cereal Res. 2018, 8, 199–208. [Google Scholar] [CrossRef]
  26. Yang, R.-C.; Crossa, J.; Cornelius, P.L.; Burgueño, J. Biplot analysis of genotype × environment interaction: Proceed with caution. Crop. Sci. 2009, 49, 1564–1576. [Google Scholar] [CrossRef]
  27. Yaghotipoor, A.; Farshadfar, E. Non-parametric estimation and component analysis of phenotypic stability in chickpea (Cicer arietinum L.). Pak. J. Biol. Sci. 2007, 10, 2646–2652. [Google Scholar]
  28. Sabaghnia, N.; Sabaghpour, S.H.; Dehghani, H. The use of an AMMI model and its parameters to analyse yield stability in multi-environment trials. J. Agric. Sci. 2008, 146, 571–581. [Google Scholar] [CrossRef]
  29. Naroui Rad, M.R.; Abdul Kadir, M.; Rafii, Y.M.; Hawa, Z.E.J.; Naghavi, M.R.; Ahmadi, A. Genotype 9 environment interaction by AMMI and GGE biplot analysis in three consecutive generations of wheat (Triticum aestivum) under normal and drought stress conditions. Aust. J. Crop Sci. 2013, 7, 956–961. [Google Scholar]
  30. Khan, M.H.; Rafii, M.Y.; Ramlee, S.I.; Jusoh, M.; Al Mamun, A. Genetic analysis and selection of Bambara groundnut (Vigna subterranea L. Verdc.) landraces for high yield revealed by qualitative and quantitative traits. Sci. Rep. 2021, 11, 22791. [Google Scholar] [CrossRef]
  31. Mostavafi, K.; Orazizadeh, M.; Rajabi, A.; Ilkaei, M.N. Stability and adaptability analysis in sugar beet varieties for sugar content using GGE-biplot and AMMI methods. Bulg. J. Agric. Sci. 2018, 24, 40–45. [Google Scholar]
  32. Taleghani, D.; Rajabi, A.; Saremirad, A.; Fasahat, P. Stability analysis and selection of sugar beet (Beta vulgaris L.) genotypes using AMMI, BLUP, GGE biplot and MTSI. Sci. Rep. 2023, 13, 10019. [Google Scholar] [CrossRef] [PubMed]
  33. Akinwale, R.O.; Fakorede, M.A.B.; Badu-Apraku, B.; Oluwaranti, A. Assessing the usefulness of GGE biplot as a statistical tool for plant breeders and agronomists. Cereal. Res. Commun. 2014, 42, 534–546. [Google Scholar] [CrossRef]
  34. Xu, Y. Envirotyping for deciphering environmental impacts on crop plants. Theor. Appl. Genet. 2016, 129, 653–673. [Google Scholar] [CrossRef] [PubMed]
  35. Yan, W.; Tinker, N.A. Biplot analysis of multi-environment trial data: Principles and applications. Can. J. Plant Sci. 2006, 86, 623–645. [Google Scholar] [CrossRef]
  36. Gauch, H.G., Jr.; Zobel, R.W. Optimal Replication in Selection Experiments. Crop. Sci. 1996, 36, 838–843. [Google Scholar] [CrossRef]
  37. Studnicki, M.; Lenartowicz, T.; Noras, K.; Wójcik-Gront, E.; Wyszyński, Z. Assessment of Stability and Adaptation Patterns of White Sugar Yield from Sugar Beet Cultivars in Temperate Climate Environments. Agronomy 2019, 9, 405. [Google Scholar] [CrossRef]
Figure 1. Geographical areas of the experimental fields.
Agronomy 13 02549 g001
Figure 2. The AMMI 1 and 2 biplots of the sugar beet yield the main effects and first principal component PC1 effects of genotype and environment (a), and the effects of first two principal components, PC1 and PC2, on genotype and Genotype × Environment interaction (b) of 23 genotypes located in 4 environments.
Agronomy 13 02549 g002
Figure 3. The AMMI 1 biplot and 2 biplot of the sugar content effects and first principal component PC1 effects of genotype and environment (a), and effects of first two principal components, PC1 and PC2, on genotype and Genotype × Environment interaction (b) of 23 genotypes located in 4 environments.
Agronomy 13 02549 g003
Figure 4. The AMMI 1 biplot and 2 biplot of the sugar production effect and first principal component PC1 effects of genotype and environment (a), and effects of first two principal components, PC1 and PC2, on genotype and Genotype × Environment interaction (b) of 23 genotypes located in 4 environments.
Agronomy 13 02549 g004
Figure 5. The GGE biplot patterns for sugar beet yield (A), sugar content (B), and sugar production (C).
Agronomy 13 02549 g005
Table 1. Characteristics of the experimental fields.
EnvironmentLocationYearAltitude (m)Latitude (°N)Longitude
(°E)
Low Temp (°C)High Temp (°C)Mean Temp
(°C)
Rainfall (mm)Soil Classification
E1Bogata (Turda)202034346.514333723.80549820.03218.98336chernozem argiloiluvial
E3Cuci202025746.446809924.17056631.03117.22316chernozem argiloiluvial
E2Bogata (Turda)202134346.511584323.79379941.503017.50342chernozem argiloiluvial
E4Cuci202125446.455566323.79379942.372713.40321chernozem argiloiluvial
Table 2. The combined variance analysis for the ANOVA sugar beet production yield (t/ha), sugar content (t), sugar production (t/ha), and their related traits in sugar beet.
Source of VariationDfSSMSF Valuep Value% of Total Variance Explained
The sugar beet yield
ENV36267.512089.17114.61820.0000037.44
GEN221213.02955.137673.025020.000017.25
GEN × ENV663521.3153.353182.9271170.0000021.04
Residuals2644811.98418.22721 34.27
CV (%)6.677775
The sugar content of the sugar beet
ENV3109.392336.46409254.38160.0000052.13
GEN2221.593320.9815146.8472630.000007.12
GEN × ENV6626.062120.3948812.7547750.0000012.42
Residuals26437.842830.143344 28.33
CV (%)2.469693
The sugar production of the sugar beet
ENV3105.10535.03576.864510.0000026.84
GEN2245.978642.0899384.5851880.0000011.74
GEN × ENV6695.888751.452863.187480.0000024.18
Residuals264120.33170.455802 37.24
CV (%)6.898275
Df—degrees of freedom; SS—sum of squares; MS—mean squares; ENV—environment; GEN—genotype; GEN × ENV—Genotype × Environment interaction; CV—coefficient of variation.
Table 3. AMMI analysis of variance for sugar beet yield (t/ha) over four environments.
Source of VariationDfSSMSF Valuep Value% of Total Variance Explained
ENV36267.512089.1727.088670.0000130.93
GEN221213.02955.137673.025020.000015.99
GEN × ENV663521.3153.353182.9271170.0000017.38
PC1241459.82960.826223.340.0000041.50
PC2221308.16459.462023.260.0000037.10
PC320753.316137.66582.070.0054021.40
Residuals2644811.98418.22721 23.75
CV (%)43320260.6246.79128
Df—degrees of freedom; SS—sum of squares; MS—mean squares; ENV—environment; GEN—genotype; GEN × ENV—Genotype × Environment interaction; PC—principal component; CV—coefficient of variation.
Table 4. The AMMI analysis of variance for sugar content (t) over four environments.
Source of VariationDfSSMSF Valuep Value% of Total Variance Explained
ENV3109.392336.4640929.279260.0000146.37
GEN2221.593320.9815146.8472630.000009.15
GEN × ENV6626.062120.3948812.7547750.0000011.04
PC12414.440130.601674.20.0000055.4
PC2227.87550.357982.50.0003030.2
PC3203.746490.187321.310.1719014.4
Residuals26437.842830.143344 16.04
CV (%)433235.89730.544797
Df—degrees of freedom; SS—sum of squares; MS—mean squares; ENV—environment; GEN—genotype; GEN × ENV—Genotype × Environment interaction; PC—principal component; CV—coefficient of variation.
Table 5. The AMMI analysis of variance for sugar production (t/ha) over four environments.
Source of VariationDfSSMSF Valuep Value% of Total Variance Explained
ENV3105.10535.03517.320290.0001221.56
GEN2245.978642.0899384.5851880.000009.43
GEN × ENV6695.888751.452863.187480.0000019.67
PC12445.724451.905194.180.0000047.70
PC22232.742751.488313.270.0000034.10
PC32017.421550.871081.910.0121018.20
Residuals264120.33170.455802 24.69
CV (%)433487.46611.125788
Df—degrees of freedom; SS—sum of squares; MS—mean squares; ENV—environment; GEN—genotype; GEN × ENV—Genotype × Environment interaction; PC—principal component; CV—coefficient of variation.
Table 6. The AMMI stability value (ASV) for sugar beet yield (t/ha), sugar content (t), and sugar production (t/ha) of 23 sugar beet genotypes over four environments.
GENYieldASVSugar ContentASVSugar Production (t/ha)ASV
G165.214381.79382288815.568750.73843210.150.953568
G260.604380.49096614315.193750.3643989.193750.253539
G362.758131.35281233215.518750.678929.70.661424
G464.36750.9579820315.518750.61824810.06250.127496
G562.503750.08557074615.350.8520289.556250.319414
G664.53251.81677389715.456250.5057369.968750.970598
G762.66251.22732863315.5250.3997819.70.396533
G862.682.27488851915.593751.0548059.743750.923854
G962.201251.01766341715.1750.24669.431250.461223
G1065.30.52105031115.68750.18402810.2250.292545
G1167.722.09946142715.01250.69935110.168751.233068
G1263.101251.55331799915.150.398999.53750.556771
G1364.5750.95713513715.30.5771559.843750.526721
G1462.363750.27671610715.26250.3460769.4750.040036
G1565.620631.99876832515.18750.104059.9750.725254
G1665.503130.85809370915.118750.0598899.8750.191199
G1760.488751.13838769215.181250.1551739.168750.293401
G1863.729381.52291467114.981250.8390749.5250.852712
G1966.690630.65066252715.8250.85526610.53750.502168
G2064.48251.47486442215.068750.765669.71250.970572
G2162.543131.45369443715.168750.3739139.456250.473743
G2266.341251.50903488815.718750.4144310.418750.842799
G2364.486251.10568921715.031250.6691629.6750.24469
GEN—genotype.
Disclaimer/Publisher’s Note: The statements, opinions and data contained in all publications are solely those of the individual author(s) and contributor(s) and not of MDPI and/or the editor(s). MDPI and/or the editor(s) disclaim responsibility for any injury to people or property resulting from any ideas, methods, instructions or products referred to in the content.

