Article

Straw Inputs Improve Soil Hydrophobicity and Enhance Organic Carbon Mineralization

College of Resource and Environmental Science, Jilin Agricultural University, Changchun 130118, China
*
Authors to whom correspondence should be addressed.
Agronomy 2023, 13(10), 2618; https://doi.org/10.3390/agronomy13102618
Submission received: 14 September 2023 / Revised: 8 October 2023 / Accepted: 11 October 2023 / Published: 14 October 2023
(This article belongs to the Section Soil and Plant Nutrition)

Abstract

:
The mechanism of the influence of soil water repellency (SWR) and agglomeration stability on soil organic carbon (SOC) mineralization has not been thoroughly studied following different methods of returning straw to the field. The research background in this study was ordinary black soil, and the addition of straw was accomplished via straw mixing (CT), straw mulching (CM), straw deep burying (CD), and straw tripling deep burial (CE). A 120-day long-term incubation test was used to measure the contact angle between water droplets and soil, the particle size distribution of aggregates and their organic carbon (OC) content, organic carbon pool (OCP) content, OC contribution, and soil CO2-C release, the extent of SWR and the direct effect of agglomerates on SOC mineralization were assessed under different straw return methods. The results revealed that the water-droplet–soil contact angle (CA) was much greater and the rate of CA decline was significantly lower in the CD treatment compared to the CT, CM, and CE treatments, the rate of water droplet penetration on the soil surface was slower, and the SWR was improved. The CD treatment significantly increased the content of macroaggregates and their OCP content, and also significantly increased the content of microaggregates’ OC. The CO2-C emission rate and cumulative emissions were enhanced by adding the same amount of straw, with the most significant enhancement in the deep straw treatment. The cumulative CO2-C emission rate and SOC mineralization significantly increased with increases in SWR, macroaggregates content, and microaggregates OC content, but significantly decreased with increases in macroaggregates’ OC content, according to principal component analysis and Pearson’s correlation analysis. These results highlight the extent of SWR and the direct effect of agglomerate particle size distribution and OC content on SOC mineralization under different straw return methods. This will help to consolidate soil structural stability and nutrient management to support productivity and SOC sequestration in different agricultural systems.

Graphical Abstract

1. Introduction

Straw return is widely used in agricultural systems and is a simple and environmentally friendly method of plant waste treatment [1]. Straw residues are an important source of soil organic carbon (SOC) [2], and inputs of straw residues can affect microbial biomass and activity through co-metabolism, which increases SOC mineralization [3]. On the other hand, straw return to the field affects SOC mineralization by physically disrupting the soil, altering soil physical properties such as soil structure and aggregate stability, and improving the microbial environment and nutrient access [4]. The rate of SOC mineralization depends on the number and activity of microorganisms [5], and this process is closely related to the soil moisture status and the state of aggregates [6].
Soil structure and soil organic matter (SOM) are two of the most dynamic soil properties and are highly sensitive to agricultural management practices [7]. It is well known that disruption of soil aggregate structure due to tillage increases the exposure of SOM in different size classes of aggregates, thereby increasing microbial activity and accessibility to aggregate-associated SOM fractions [8,9]. Agglomerates are closely related to SOC mineralization, and all factors affecting soil aggregates will influence soil carbon mineralization. The binding of SOM to clay particles in aggregates of different particle sizes varies, and the rate of mineralization varies, especially as changes in aggregate particle size will directly affect the rate of SOC mineralization [10]. Organic carbon (OC) decomposition is slow in microagglomerates (<0.053 mm), whereas macroagglomerates (>0.25 mm) have more organic matter of plant origin, are faster to turnover, and are more sensitive to farm management practices [11].
Structurally diverse plant residues, such as lignin, are produced during straw decomposition, and these recalcitrant substances accumulate and are incorporated into the SOM [12], which leads to an increase in soil water repellency (SWR) [13]. SWR is produced by the accumulation of hydrophobic compounds, which originate from vegetation or microorganisms [14,15], or by decomposition of organic matter with a low degree of humification [13]. Moderate water repellency is ubiquitous in soils, and its positive effects on soil structure and quality have been recognized [6,16,17]. SWR has been shown to play an important role in maintaining soil stability [18,19], and SOC sequestration [20].
The degree and persistence of SWR influence soil moisture content [21,22,23]. It has been shown that small differences in soil wettability can affect soil aggregates [6], and that increasing SWR reduces the loss of soil water to evaporation, increases soil aggregate stability [24], and contributes to the binding of soil microaggregates to macroaggregates [25], which in turn alters the soil aggregate size distribution [26] and increases the associated C content in macroaggregates [27]. On the other hand, soil moisture content significantly affects SOC mineralization, and in general, the rate of SOC mineralization increases with increasing soil moisture within a certain range [28]. Therefore, the degree of SWR after straw return may affect the distribution of SOC of different particle sizes in the agglomerates and SOC mineralization.
There are many methods to study SWR, such as water drop penetration time measurement, molar concentration measurement of an ethanol droplet (MED, molarity of an ethanol droplet), and contact angle measurement (CA, contact angle). The two most common methods for characterizing SWR are CA and WDPT, where the former is related to the degree of SWR and the latter to the persistence of SWR [29]. An increase in SWR implies an increase in soil quality because basic indicators such as the structural stability of the soil are improved [30]. Therefore, it is important to correctly assess SWR in agricultural soils [31]. However, there is no systematic study of water repellency of soils after different modes of straw return and linking SWR to the mechanism of the effect of agglomerate stability on SOC mineralization. This understanding will help to consolidate soil structural stability and nutrient management to support productivity and SOC sequestration in different agricultural systems. Therefore, the objective of this study is to increase our understanding of how SWR and agglomerate particle size distribution interact to influence SOC mineralization under different straw return practices.
In our study, we proposed two broad hypotheses: (i) deep straw burial will increase SWR and thus the proportion of macroaggregates, and the OC content of macroaggregates will be lower than that of microaggregates; and (ii) deep straw burial will lead to more mineralization of SOC, which is derived from the nutrient reserves of the organic carbon pool (OCP) in the aggregate, which may be directly affected by the difference in SWR. To test these hypotheses, we simulated straw addition by straw mixing, straw mulching, straw deep-returning, and straw-enriched deep-returning using typical black soil as the study background. A 120-day long-term incubation experiment was conducted to assess the extent of SWR and the direct effect of agglomerate particle size distribution and OC content on SOC mineralization under different straw-addition methods.

2. Materials and Methods

2.1. Study Site

The soil used for the culture study was collected from a long-term (15 years) maize continuous cropping field trial at the Experimental Station of Jilin Agricultural University, Changchun, Jilin Province, China (43°48′43.57″ N, 125°23′38.50″ E). The region has a humid, temperate continental monsoon climate, with an average annual temperature of 4.6 °C and an average annual precipitation of 600–700 mm. The soil type is a meadow black soil, which corresponds to clayey sedimentary wet soft soils (Argiudolls) in the American systematic classification.
In October 2020 (fall fallow), composite soil samples were collected from the 0–20 cm soil layer using a soil auger (7.5 cm in diameter) at 30 randomly selected sampling sites from large fields. After sampling, straw and other organic residues visible to the naked eye were removed, and the wet soil from the field was stored at 5 °C, pending further treatment for incubation tests. The basic soil properties were as follows: SOC was 11.11 g kg−1, total nitrogen was 1.28 g kg−1, quick-acting nitrogen was 132.21 mg kg−1, quick-acting phosphorus was 18.52 mg kg−1, quick-acting potassium was 99.32 mg kg−1, CaCO3 was 12.55 g kg−1 and pH was 6.76. The soil is 32% sand, 35% chalk, and 33% clay, and is loamy clay.

2.2. Corn Straw

The maize straw used in the experiment was collected from a long-term (15 years) continuous maize field at the Experimental Station of Jilin Agricultural University, Changchun City, Jilin Province, China (43°48′43.57″ N, 125°23′38.50″ E), and the collected maize straws (including leaves) were clipped, dried (at 50–70 °C) and pulverized, then passed through a 0.25 mm sieve. The basic properties of the corn straw were: OC 376.4 g kg−1, total nitrogen 5.72 g kg−1, total phosphorus 7.7 g kg−1, total potassium 4.5 g kg−1, and C/N 65.8.

2.3. Experimental Design

The experiment simulated four different corn stover treatments: (1) control treatment (CK): no corn straw was added, and 500 g of soil sample was added to the culture bottle; (2) straw mixing (CT): 500 g of soil sample was mixed with 7 g of straw and then added to the culture bottle; (3) straw mulching (CM): the CM treatment was added to the culture bottle with 500 g of soil sample, and then 7 g of straw was evenly spread on the soil surface; (4) straw deep burying (CD): 100 g of soil sample was added to the culture bottle, and then 7 g of straw was evenly spread on the soil surface, and then 400 g of soil sample was mulched; (5) straw tripling deep burying (CE): 100 g of soil sample was added to the culture bottle, 21 g straw was evenly spread on the soil surface, and then 400 g of soil sample was covered. Each treatment was repeated three times.
Based on the volume of the culture bottle and the weight of the soil, the loading height of the soil in the culture bottle under the condition of soil capacity of 1.2 g cm−3 was calculated, which in turn adjusted the firmness of the soil in the culture bottle. The amount of nitrogen fertilizer applied in each culture bottle for each treatment was calculated based on C/N, and a quantitative amount of urea was dissolved in distilled water and uniformly sprayed on the surface layer of the cultured soil on the first day of the experiment. The water content was adjusted to 15% by using 72.8 mL of distilled water per bottle based on the average field capacity and ensuring that the soil surface was level. One CO2-trap solution (10 mL of 1 m NaOH) was placed in each culture bottle. The incubation was conducted in a constant-temperature incubator at 30 ± 0.5 °C. This study simulated the rapid growth phase of maize, where microbial activity is more active at this temperature so that the mineralization of SOC is much greater.

2.4. Sample Collection

The experiment lasted for 123 d. The samples were taken out at 0.5, 1, 2, 4, 8, 13, 19, 26, 33, 43, 53, 63, 83, 103, and 123 d for the determination of the lye solution and the replacement of new lye solution to continue the experiment. Soil samples were removed at 30th, 60th, 90th, and 120th d. Soil samples were collected at 2 cm of the straw–soil interface and mixed to remove visible organic debris.

2.5. Physical and Chemical Analysis

2.5.1. SWR Determination

The CA of the treated soil samples with water droplets was measured by a fully automated contact angle meter (Optical Contact Angle Meter, OCA20, DataPhysics Instruments GmbH, Filderstadt, Germany) at room temperature. The specific procedure was as follows: The soil samples were sprinkled on double-sided adhesive tapes (1.5 cm × 1.5 cm) and pasted on smooth glass slides. A 100 g weight was used to press the soil sample against the tape for 10 s, and then the slide was gently tapped to remove the excess soil sample. After this process was repeated twice, the sample was placed on the platform. A drop of deionized water (volume of 10 μL) was placed on the surface of the soil sample using a micropipette and digital micrographs of the horizontal view of the water droplet were taken at 0, 1, 3, and 5 s. The CA was measured at five different locations on each surface, and the CA obtained by averaging the values was the final static water CA.

2.5.2. Soil Aggregates

The wet sieving method [32] was used to separate soil aggregates into four size fractions: (1) >2 mm; (2) 2–0.25 mm; (3) 0.25–0.053 mm; and (4) <0.053 mm.
A 50 g air-dried soil sample was placed in a 2 mm sieve and slowly soaked in 5 mL of deionized water for 5 min before sieving. The sample was then placed in a shaker consisting of three sieves (2 mm, 0.25 mm, and 0.053 mm) connected in series, and shaken vertically 50 times (5 cm) over 5 min. After sieving, the grain grades remaining in each sieve were washed into separate beakers, and the grain grades remaining in the bucket (<0.053 mm) were allowed to settle for 24 h. The next day, each grain size was dried and weighed.
The formula for calculating the mass percentage of agglomerates for each grain size is given below:
w i = m i M × 100 %
where wi is the mass fraction (%) of a particular grain-size aggregate among all aggregates, mi is the mass (g) of a particular grain-size aggregate, and M is the total mass (g) of the soil sample.
The OC content of aggregates of each grain size was determined by the K2Cr2O7-H2SO4 oxidation method [33].
The formula for calculating the OCP content of agglomerates of each grain size was as follows:
p i = w i × S O C i
where pi is the OCP content (g kg−1) of a particular particle size agglomerate, and SOCi is the OC content (g kg−1) of a particular particle size agglomerate.
The OC contribution of agglomerates of each grain size was calculated as follows:
C i = p i S O C × 100 %
where Ci is a particular grain size agglomerate’s OC contribution (%).

2.5.3. CO2-C Emission

The mineralization of SOC was determined by incubation at room temperature and the sodium hydroxide absorption method. Absorbent bottles were removed at 0.5, 1, 2, 4, 8, 13, 19, 26, 33, 43, 53, 63, 83, 103, and 123 d after incubation. In total, 2 mL of 1 mol L−1 BaCl2 solution and 2 drops of phenolphthalein indicator were added, titrated with standard acid (HCl) to a slight red color, and used to calculate the amount of SOC mineralized during the incubation period based on the amount of CO2 released.
The formula for CO2-C release was calculated as follows:
Q = ( V 0 V ) × C × 22 × 1000 m × 12 44
Q is the CO2-C release (mg kg−1), C is the HCl concentration (mol L−1), V0 is the amount of HCl solution consumed to titrate the control treatment (mL), and V is the amount of HCl solution consumed to titrate the soil sample treatment (mL); 22 is the molar mass of 1/2 (g mol−1); m is the air-dry weight of the soil sample (g), 12 is the relative molecular mass of C, and 44 is the CO2 relative molecular mass.
The CO2-C emission rate was calculated as follows:
ε = Q   T Q   C K d
ε is the rate of CO2-C emission (g kg−1 d−1), QT is the amount of CO2-C released from each treatment (mg kg−1), QCK is the amount of CO2-C released from the control treatment, and d is the number of days of incubation.

2.6. Analytical Methods

Data were processed using Microsoft Office Excel 2017 (v16.0.8730.2050) and analyzed by an analysis of variance (ANOVA) using SPSS software (IBM Statistics 21.0) to evaluate the effect of different straw return patterns on all measured soil parameters. The least significant difference test at p < 0.05 was used to evaluate the significant differences in the mean values of straw return patterns and adjusted for TUKEYs at p < 0.05. Graphs were compiled using Origin 2021b software (OriginPro 2021 v9.8.0.200) (OriginLab Inc., Northampton, MA, USA).

3. Results

3.1. SWR

Figure 1 shows the morphology of not hydrophobically treated. Water droplets on the surface of each treatment soil at 0 s, 1 s, 3 s, and 5 s. The CA of each treatment soil with water droplets decreases with time, and when the time reaches 5 s, the CA of each treatment is greater than 0°, which exhibits mild hydrophobicity. As shown in Figure 2, the CA of each treatment was CE > CD > CM > CT > CK, while the decreasing rate of CA of each treatment was CE > CK > CM > CT > CD, which indicated that the water droplets infiltrated faster on the surface of the soil of straw tripling and deep return treatment although the contact angle was larger. Compared with the blank treatment, the CA of water droplets in CD treatment was larger and the decline rate was significantly lower at 5 s. The water droplets infiltrated more slowly on the soil surface of CD treatment, which significantly improved the SWR.

3.2. Soil Aggregates

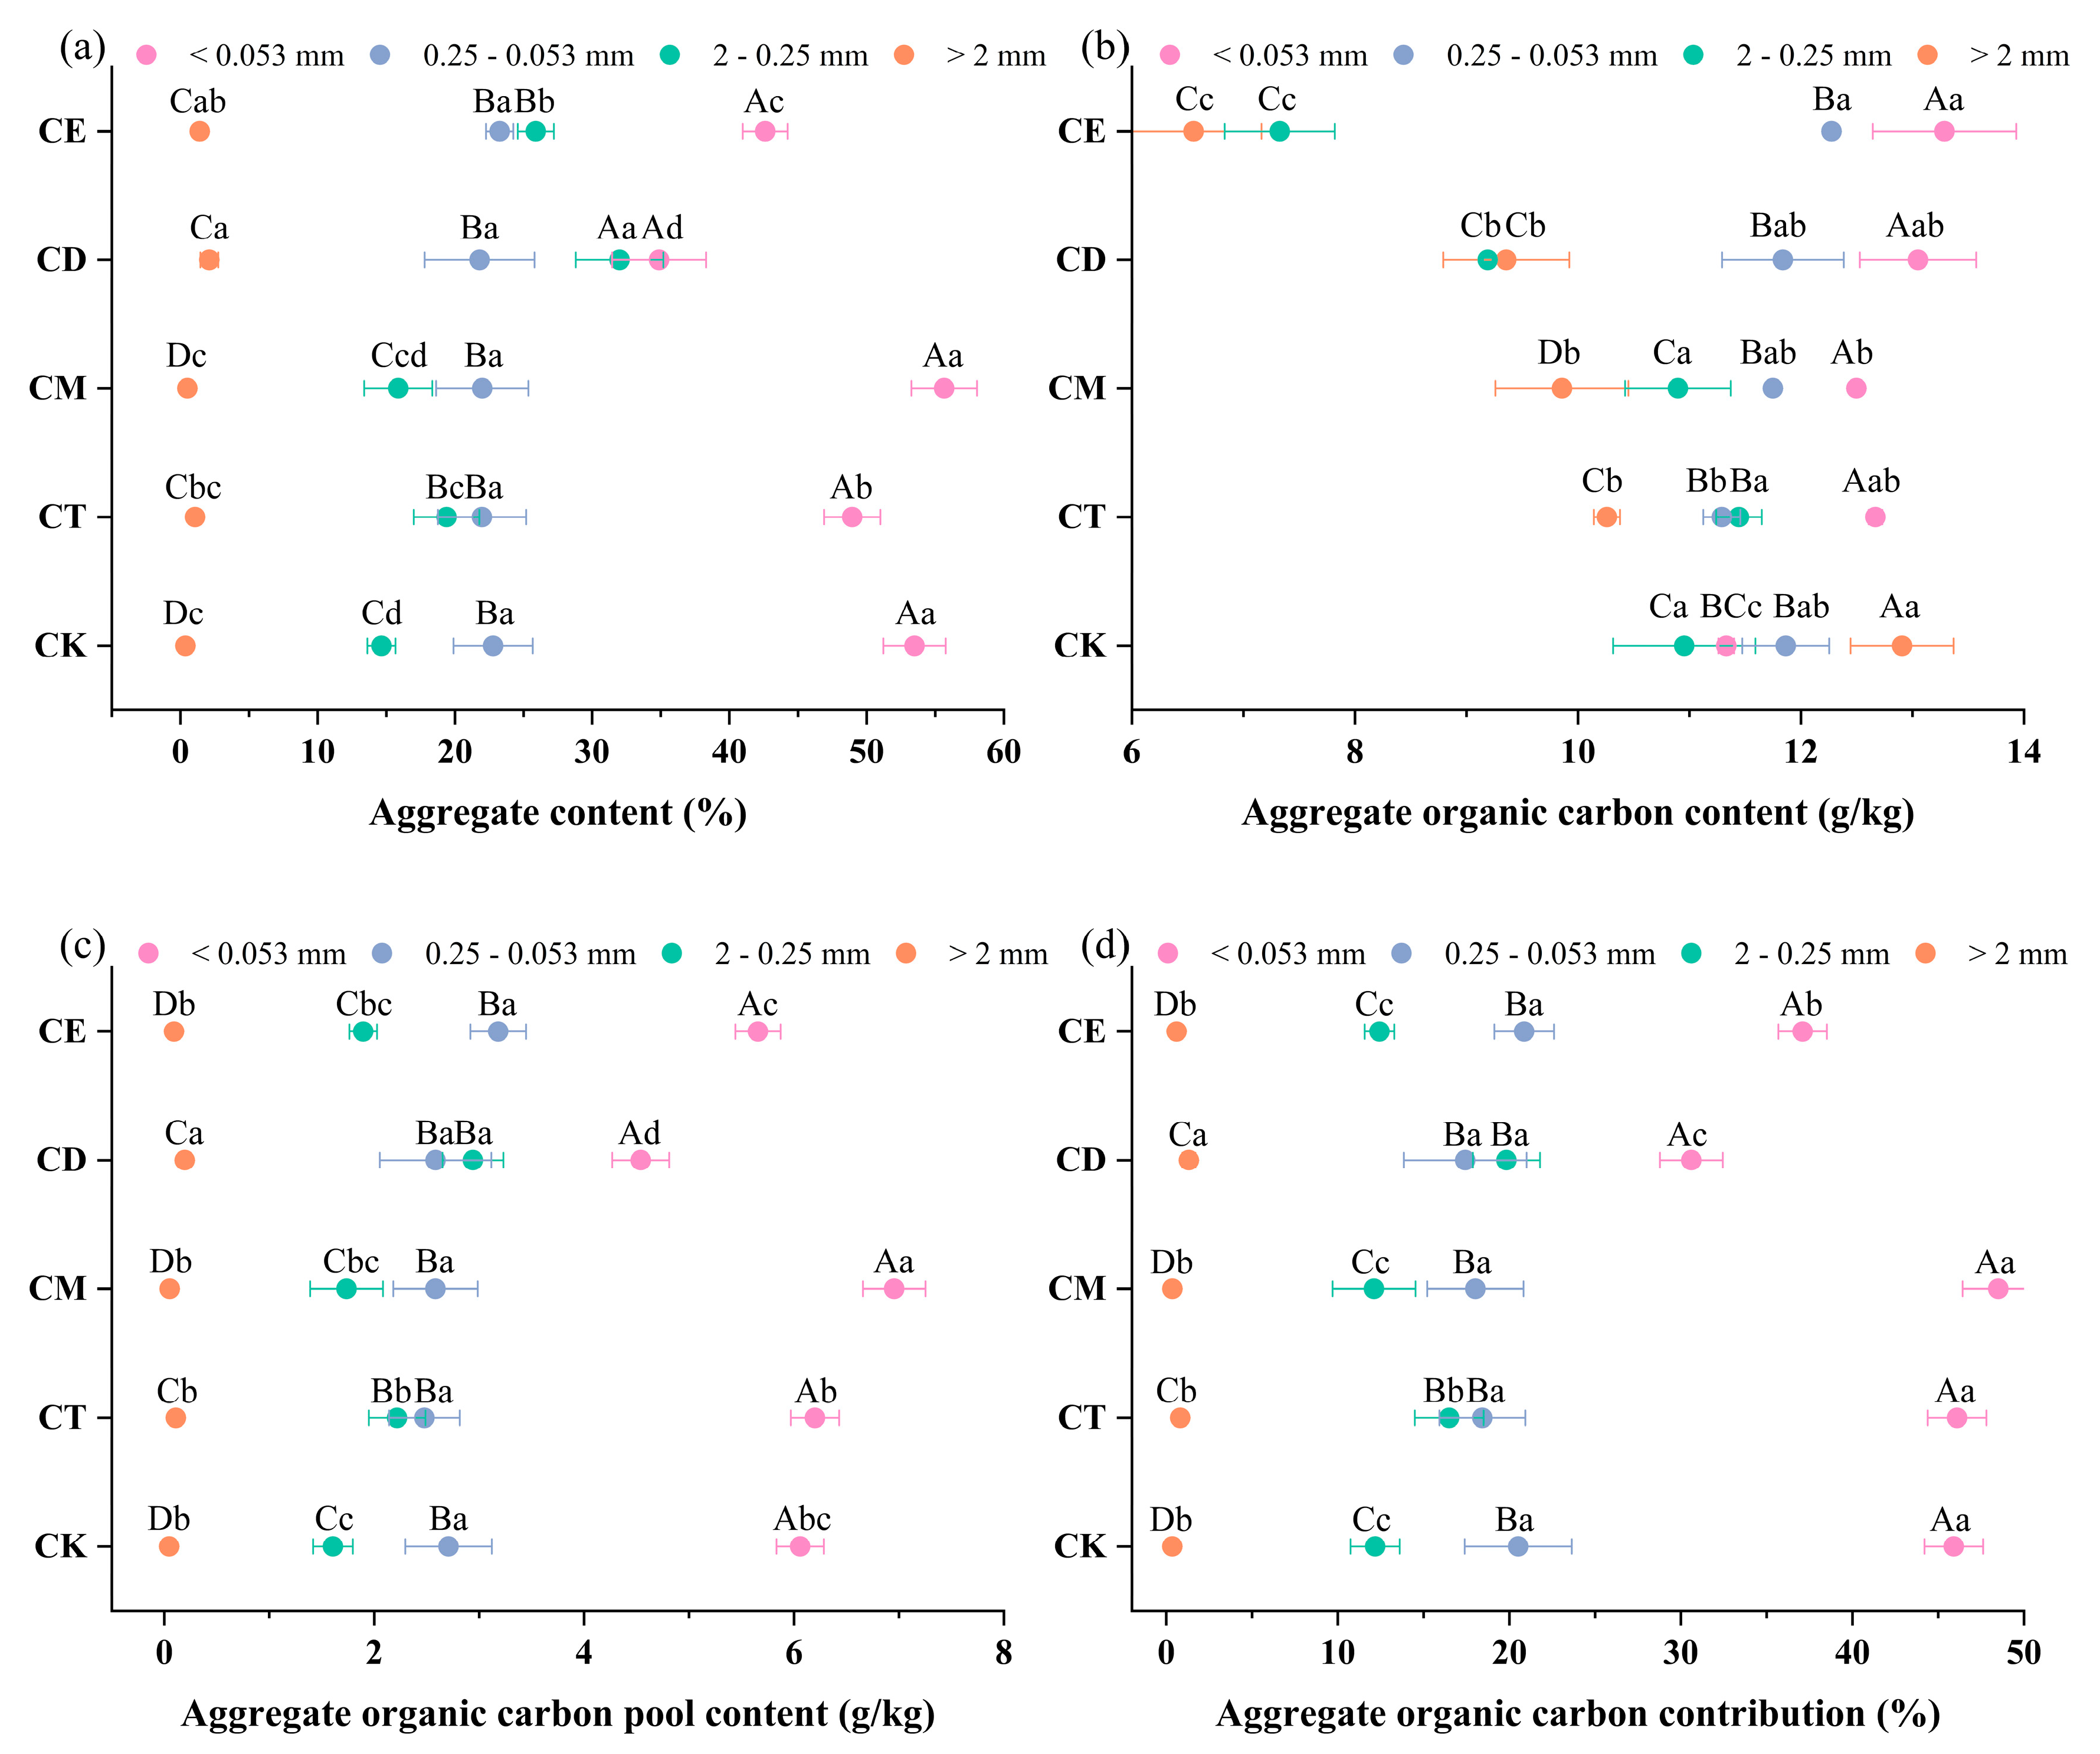
The addition of organic matter to soil provides a material basis for the formation of soil aggregates, which leads to changes in the distribution of soil microaggregates. Figure 3a shows the effect of different additions of straw on the distribution of soil aggregates. Compared with the control at 120 d, straw addition could increase the contents of >2 mm and 2–0.25 mm aggregates, and compared with the CK treatment, CD, CE, CT, and CM increased the contents of 2–0.25 mm aggregates by 118.58%, 76.84%, 32.45%, and 8.40%, respectively, with the CD treatment having the most significant effect. In addition, the number of <0.053 mm agglomerates was also significantly reduced by 33.54%, 19.61%, 8.18%, and 3.32% for CD, CE, CT, and CM, respectively, compared with CK treatment. This indicates that straw addition can indeed promote the conversion of small-size agglomerates to large-size agglomerates, but there are some differences in the amount and manner of straw addition. The content of 2–0.25 mm size agglomerates increased significantly in the CD treatment, which suggests that deep burying of straw can better improve the content of large-size agglomerates.
From Figure 3b, it can be seen that except for the control treatment, the OC content of <0.053 mm agglomerates was higher than the OC content of agglomerates of other grain sizes. The OC content of <0.053 mm agglomerates was significantly higher than that of >2 mm and 2–0.25 mm agglomerates in the CM, CD, and CE treatments, and the difference was most significant in the CE treatment. Compared with the control treatment, in the 0.25–0.053 mm agglomerates, the CE treatment significantly increased the agglomerates’ OC content by 3.46%, while the CT treatment significantly decreased it by 4.81%; in the 2–0.25 mm agglomerates, the OC content of the CD and CE treatments were significantly decreased by 16.07% and 33.06%, respectively; in the >2 mm agglomerates, the OC content of the CM, CT, and CD; and in >2 mm agglomerates, the OC content of CM, CT, CD, and CE treatments were all significantly reduced, CE treatment reduced by 49.26%. This indicates that the addition of straw increased the OC content of small agglomerates and decreased the OC content of large agglomerates.
Similar to the agglomerate OC content, compared to other particle sizes, <0.053 mm agglomerates had the highest OCP content and contribution, and >2 mm agglomerates had the lowest OCP content and contribution among the treatments (Figure 3c,d). Compared with the control treatment, in <0.053 mm agglomerates, CM treatment significantly increased the agglomerates OCP content by 14.69%, while the CD and CE treatments significantly decreased by 25.08% and 6.60%, respectively. The OC contribution rate was significantly reduced by 33.33% and 19.19%, respectively; in 0.25–0.053 mm agglomerates, there were no significant treatments other than the CT treatment. In the 0.25–0.053 mm agglomerates, there was no significant difference between the other treatments except CT treatment, and the OCP content and OC contribution rate of CT treatment were significantly reduced by 8.49% and 12.18%, respectively. In the 2–0.25 mm and >2 mm agglomerates, the OCP content was significantly increased in the CM, CT, CD, and CE treatments, in which the CD treatment raised the OCP content by 18.01% and 300.00%, and the OC contribution rate by 62.94% and 277.14%, which was the most significant. This indicates that the deep burial of straw decreased the OCP content and OC contribution of small agglomerates and increased the OCP content and OC contribution of large agglomerates.

3.3. CO2-C Emission Characteristics

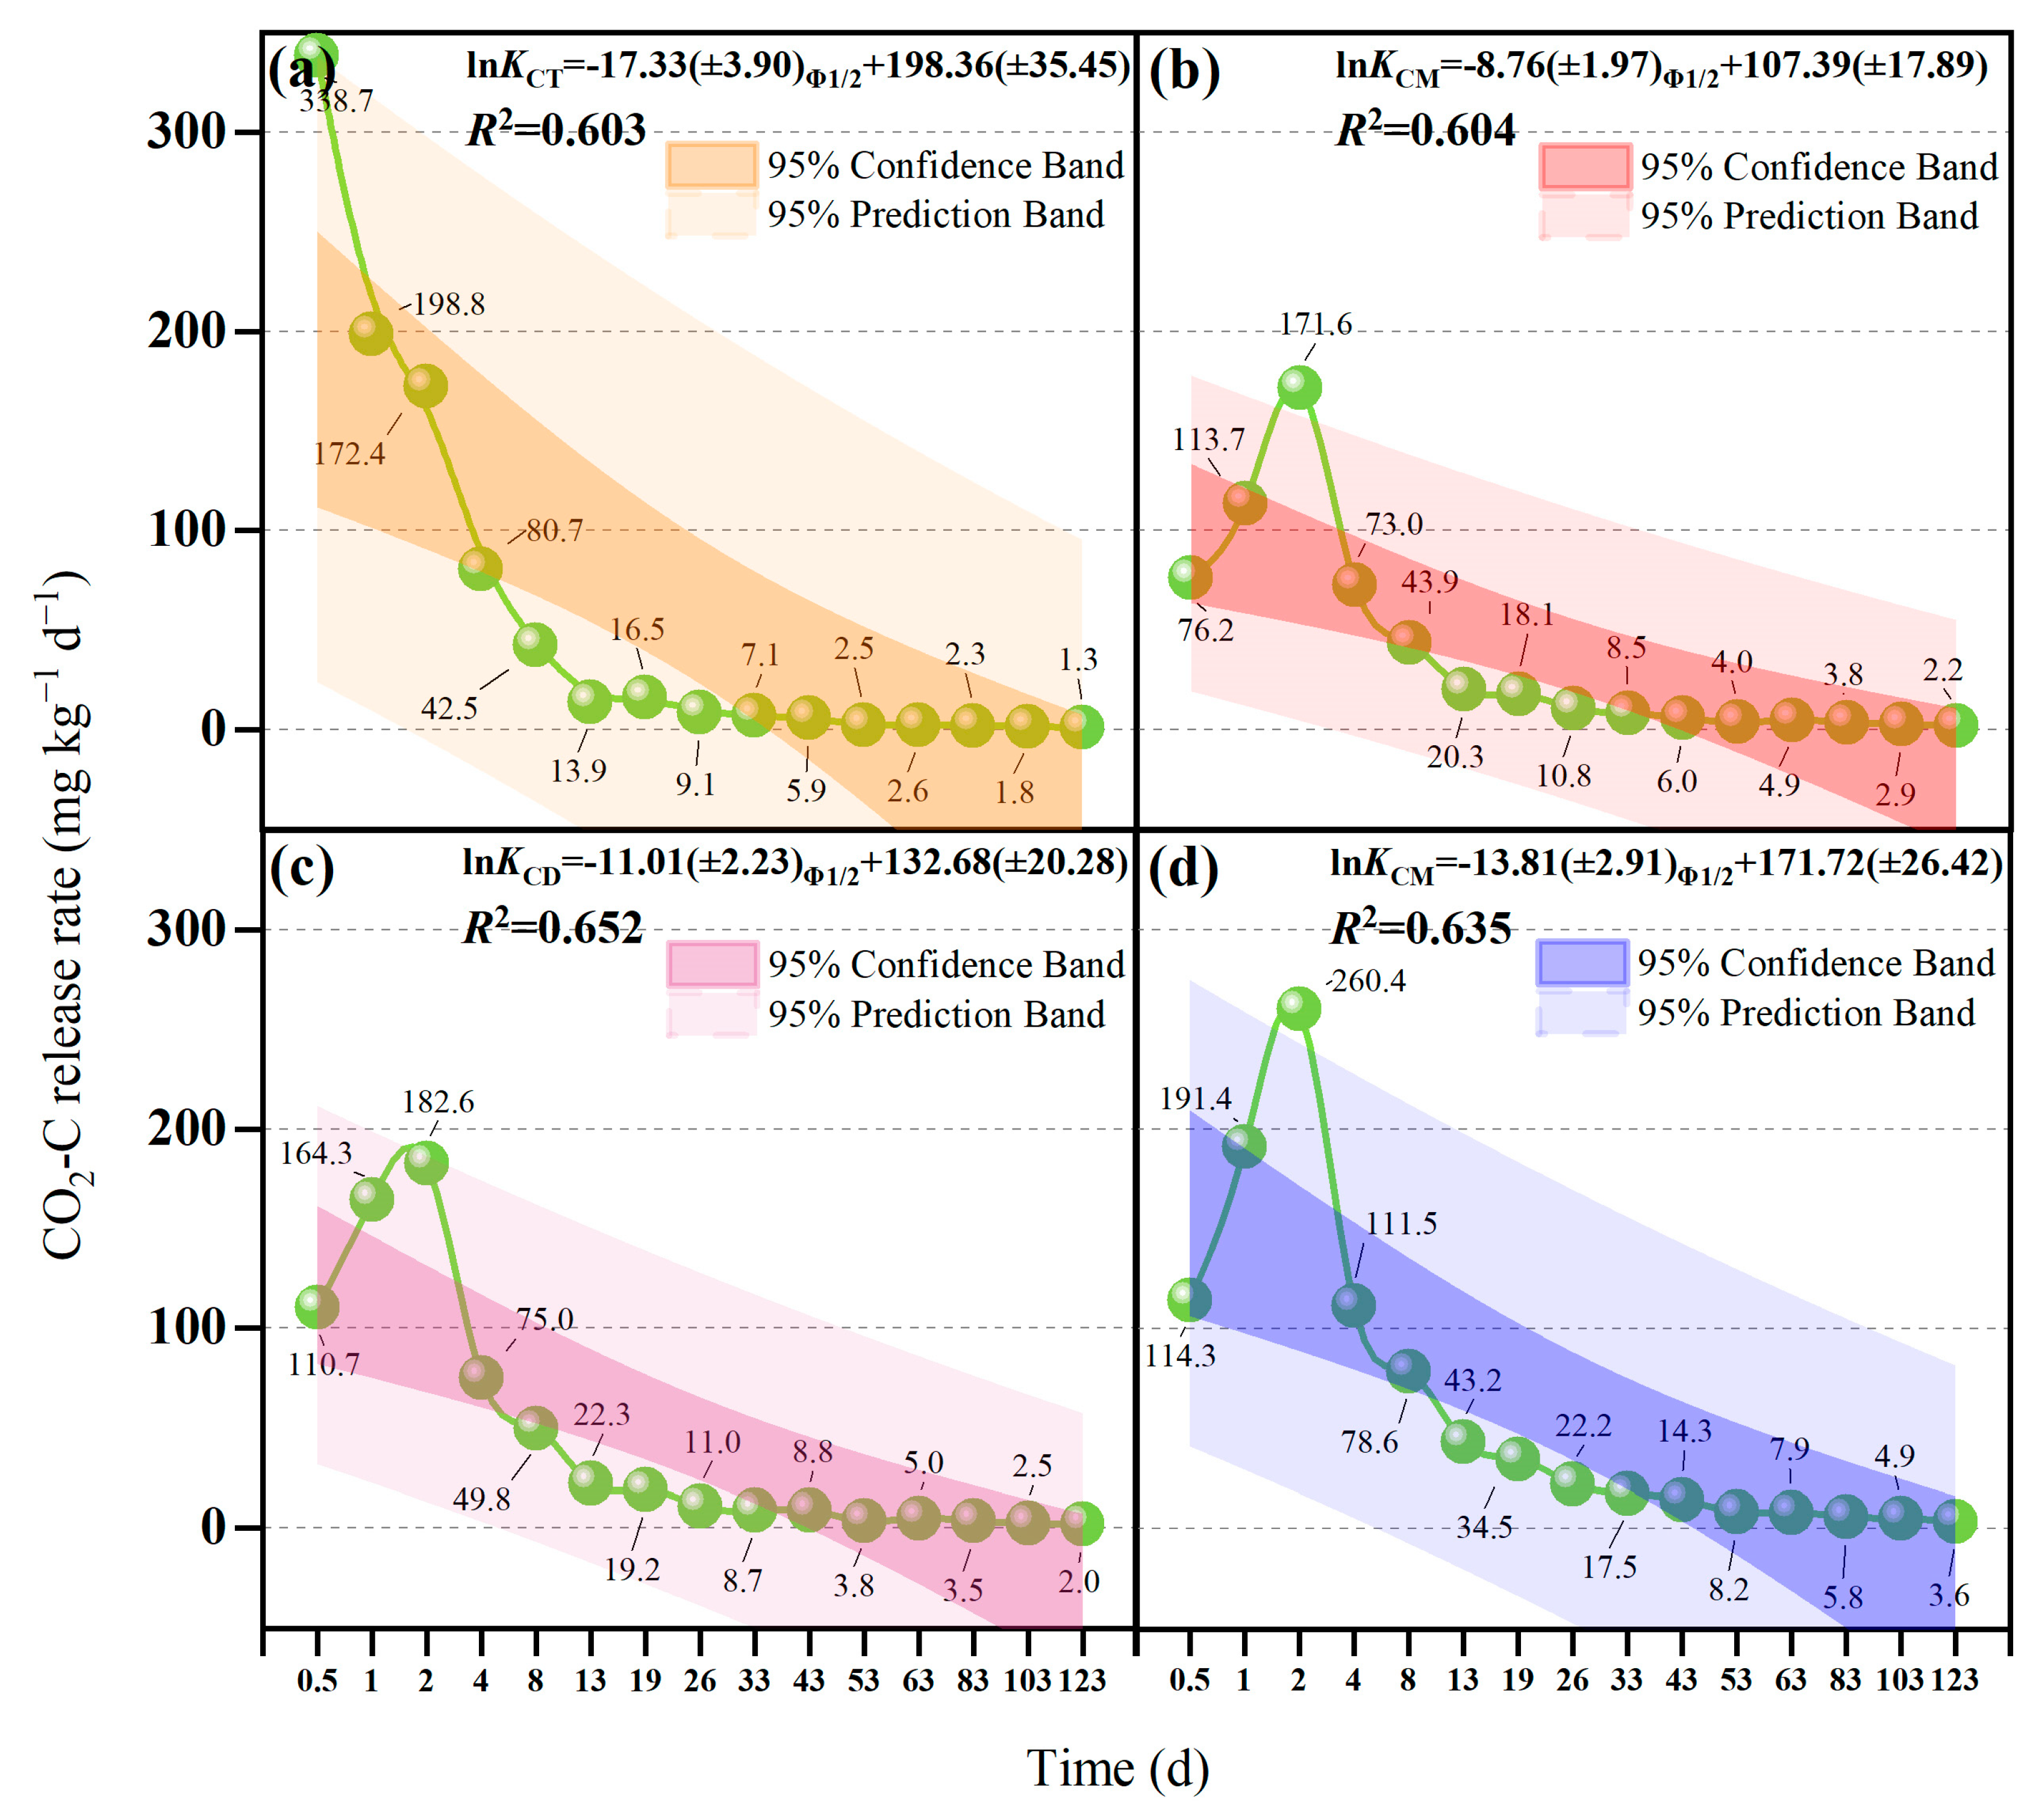
After adding straw, part of the organic matter will be mineralized to CO2 by soil microorganisms and discharged to the soil surface. The statistics in Figure 4 and Table 1 show the curves of the soil CO2-C emission rate, process, and characteristics increasing with time under different straw additions and different methods.
The CO2-C emission rate curves of all treatments (Figure 4, Table 1) showed a peak CO2-C emission from 0.5 to 2 d. The straw decomposition rates of the CM, CD, and CE treatments reached the peaks from 171.62 to 260.35 mg kg−1d−1, and the CT, CM, CD, and CE treatments started the process of a rapid decrease in the CO2-C emission rate at 19, 26, 26, and 33 days. The straw decomposition rate of the CT, CM, CD, and CE treatments entered the first slow-emission plateau at 19, 26, 26, and 33 days, with the average CO2-C emission rate ranging from 13.88 to 43.21 mg kg−1d−1, and then entered the second slow-emission plateau (lower than the first one), with the slow decrease in the straw decomposition rate, and the average CO2-C emission rate ranging from 1.28 to 3.60 mg kg−1d−1. The decomposition rate of straw significantly increased with the increase in the amount of straw used at different straw amounts. Under different straw dosages, the decomposition rate of straw increased significantly with the increase in straw dosage, and the maximum decomposition rate of straw in the CE treatment at three times the straw dosage ranged from 3.60 to 260.35 mg kg−1d−1. The CO2-C emission rate of different treatments with the same straw dosage was in the order of CD > CM > CT, and the CT treatment had the highest emission rate at 0.5–1 d, higher than that of CD and CM at 1–4 d, and the lowest at 4–123 d. The CT treatment had the lowest emission rate at 4–123 d, the lowest at 4–123 d, the lowest at 4–123 d, the lowest at 4–123 d, and the lowest at 4–123 d, respectively. The CT treatment had the highest emission rate from 0.5 to 1 d, a higher emission rate from 1 to 4 d than the CD and CM treatments, and the lowest emission rate from 4 to 123 d.
The peak CO2 emission rate of the CT treatment appeared at 0.5 d, 1.5 d earlier than that of the CM, CD, and CE treatments, and the peak and average CO2 emission rates of the CT treatment were greater than those of the CD and CM treatments at the first slow-emission plateau, and, on the contrary, were significantly lower than those of the CD and CM treatments after entering the second slow-emission plateau. With the addition of straw, the CE treatment’s peak and average CO2 emission rates increased significantly and were higher than those of the other treatments in both the first and second slow-emission plateaus.
The cumulative CO2-C release from the different treatments is shown in Figure 5, where all treatments increased CO2-C excretion with the addition of a corn stover. The cumulative curves show two distinct phases, an initial fast phase utilizing readily available compounds followed by a slower phase. In the first 2 d of incubation, all CO2-C cumulative emissions showed a rapidly increasing trend due to the presence of peak CO2-C emission rates, and the cumulative CO2-C release showed CT > CE > CD > CM in 0.5 to 2 d. Thereafter, the cumulative CO2-C emissions gradually entered a slow-increasing phase. The cumulative CO2-C emission was CE > CT > CD > CM from 2 to 13 d. The cumulative CO2-C emission was CE > CD > CM > CT from 13 to 123 d, which were 8405.83, 5406.13, 5167.87, 4631.37, and 1208.75 mg kg−1, respectively.

3.4. Relationship Analysis of SWR, Soil Aggregates, and CO2-C Emission under Different Straw Addition Methods

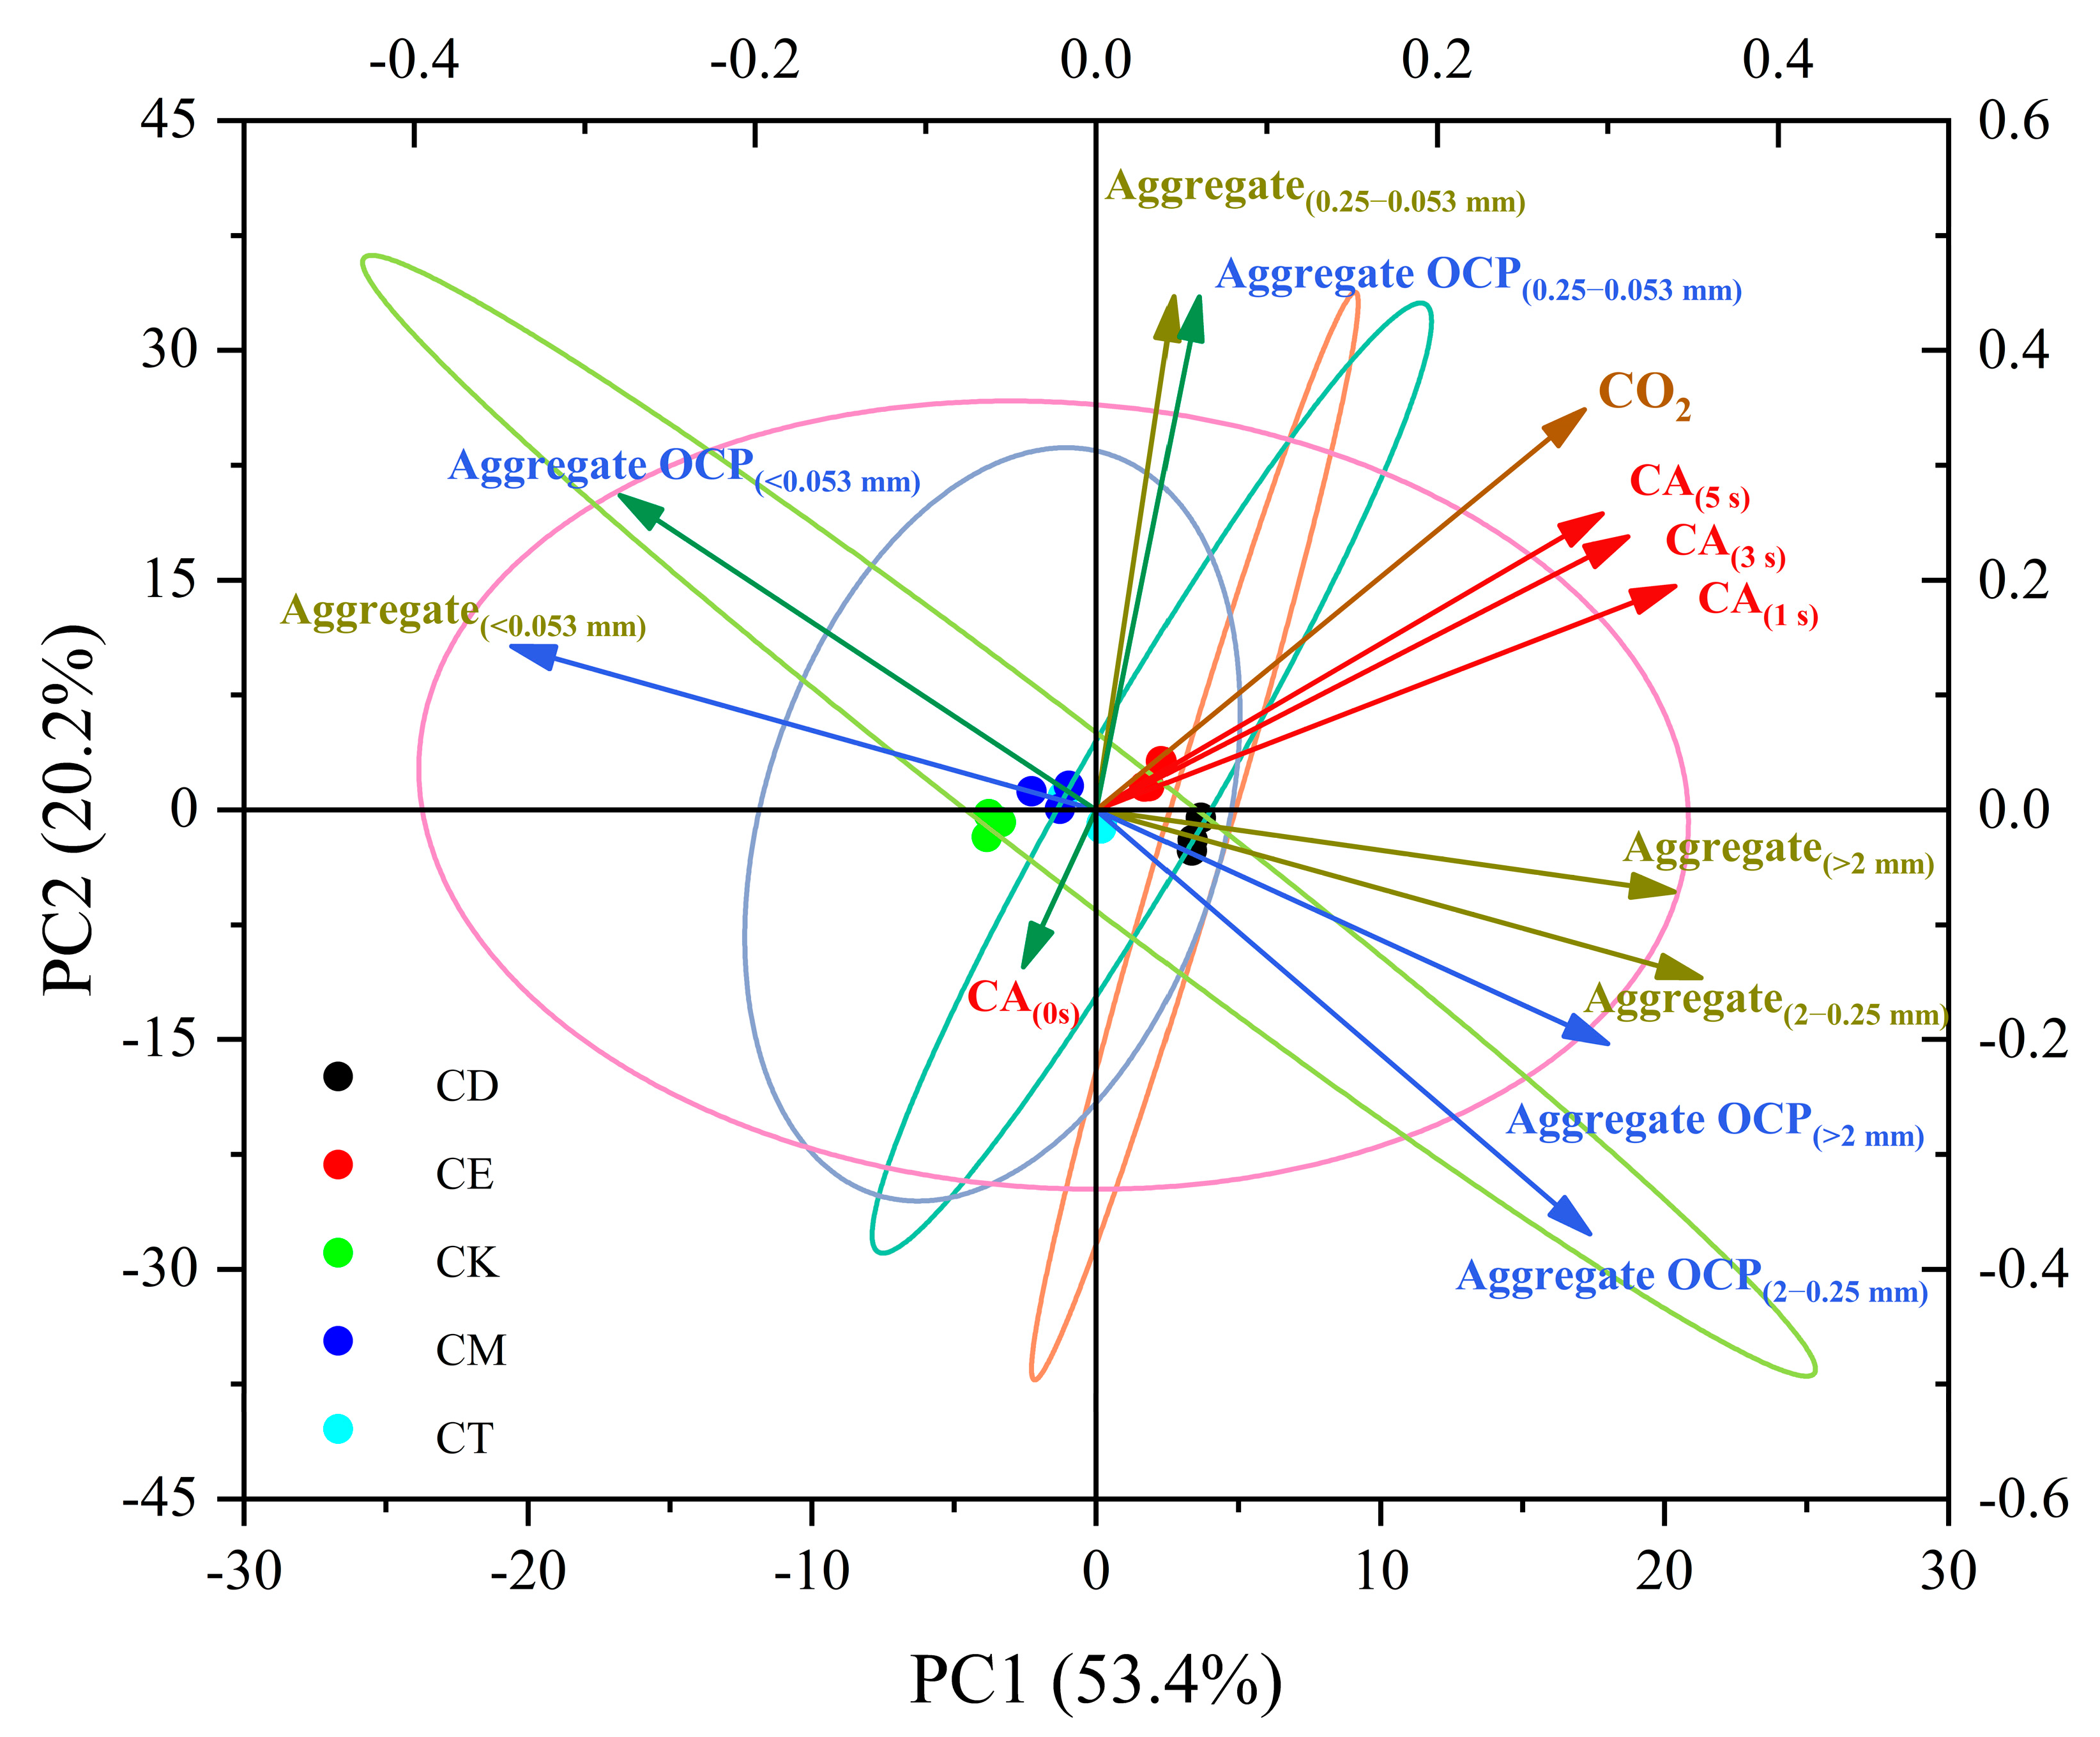
Figure 6 shows the principal component analysis of CA, soil aggregates content of each particle size, OCP content and CO2-C cumulative emissions for each treatment of different straw-return methods, extracted to obtain two principal components (PCs), which were 53.4% and 20.2% of the total variance of all the samples, respectively, and it can be seen that the >2 mm, 2–0.25 mm aggregates content and their OCP content, CA (1 s ), CA (3 s), CA (5 s) and CO2-C cumulative emissions had a large positive contribution to PC1, and the <0.053 mm agglomerate content and its OCP content had a large negative contribution to PC1; the 0.25–0.053 mm agglomerate content and its OCP content and had a large positive contribution to PC2, and CA (0 s) had a large negative contribution to PC2. PCA showed that SWR and soil aggregates had different effects on CO2-C cumulative emissions in different straw addition methods, with a greater effect in straw deep burial treatment. CA (1 s), CA (3 s), and CA (5 s) were positively correlated with >2mm, 2–0.25 mm agglomerates and their OCP contents, as well as CO2-C cumulative emissions in different straw-return methods, which indicated that straw addition increased the contact angle between water droplets and the soil, increased SWR and affected the content of soil macroagglomerates and their OCP contents, and ultimately increased SOC mineralization.
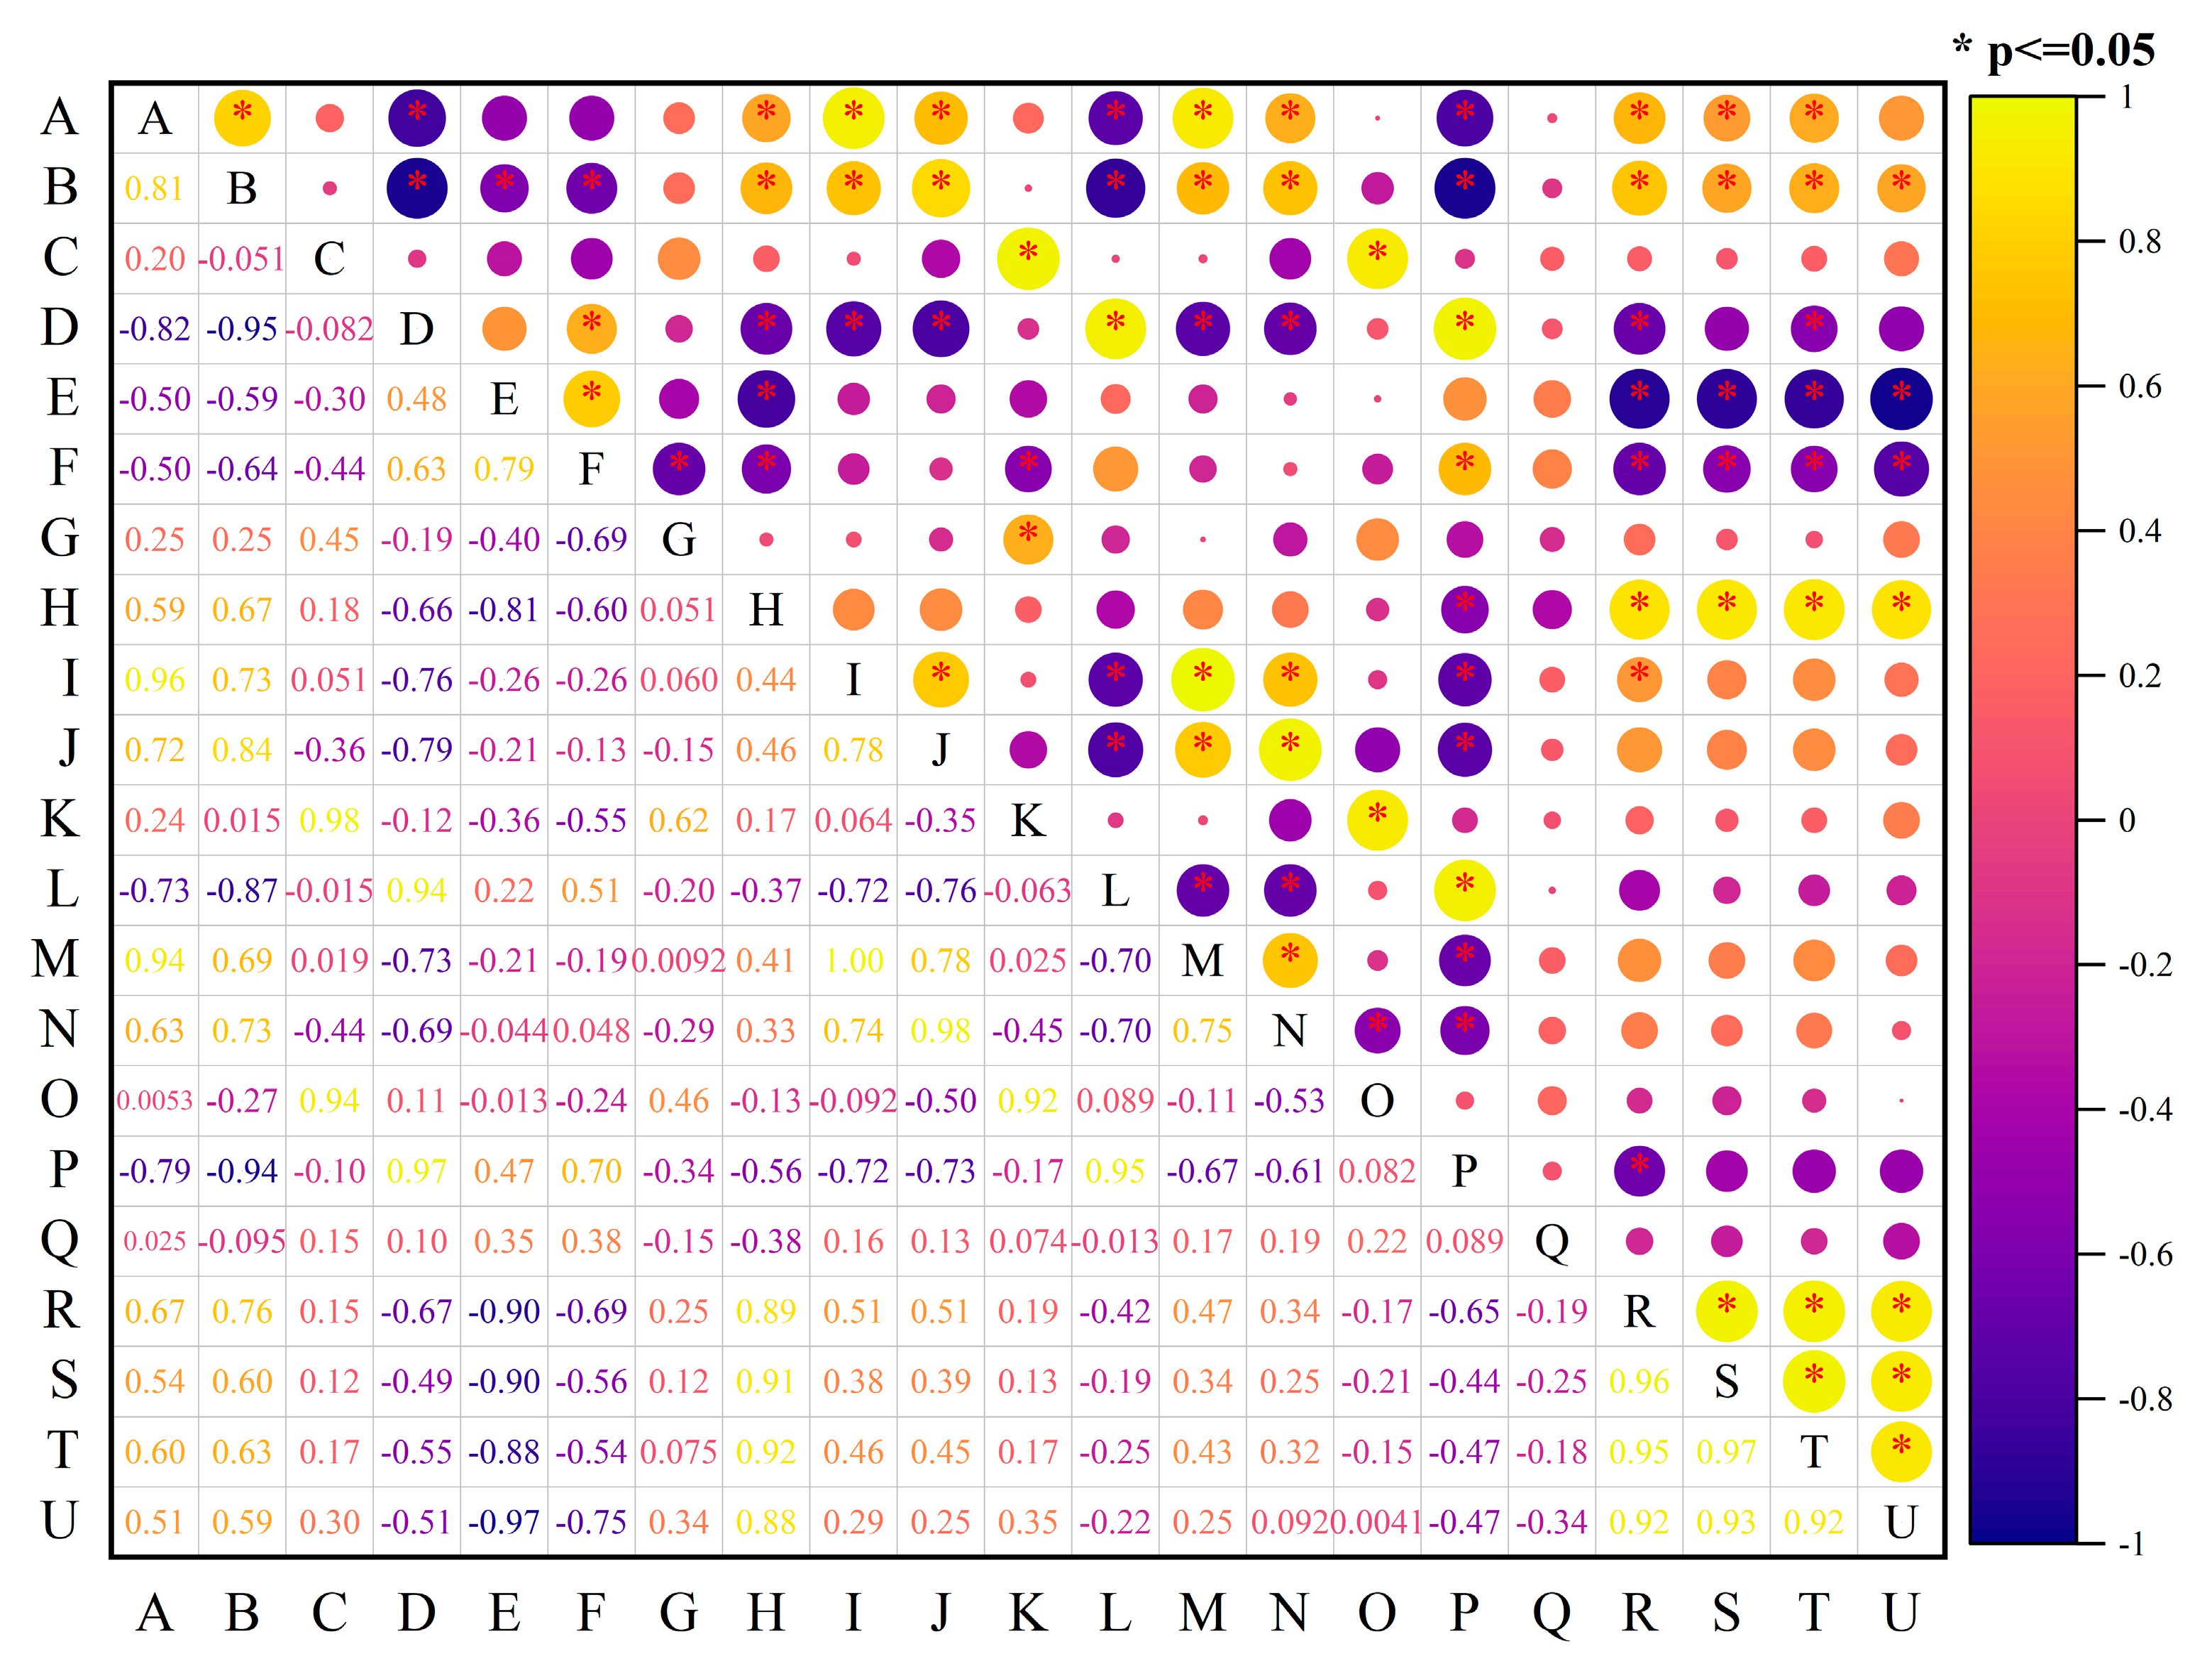
The correlations between SWR, soil aggregates, and CO2-C emissions under different straw addition methods are shown in Figure 7. At the p < 0.05 level, the cumulative CO2-C emission was significantly positively correlated with the content of 2–0.25 mm agglomerates, the carbon content of <0.053 mm agglomerates, CA (1 s), CA (3 s), and CA (5 s), with correlation coefficients of 0.59, 0.88, 0.92, 0.93, and 0.92; and the cumulative CO2-C emission was significantly negatively correlated with the OC content of >2 mm and 2–0.25 mm agglomerates, with correlation coefficients of −0.97, −2.95, −2.95, −0.97 and −2.95. The OC contents of >2 mm and 2–0.25 mm agglomerates were significantly negatively correlated, with correlation coefficients of −0.97 and −0.75. It can be seen that, under different straw addition methods, the increase in the SWR, large agglomerate content, and carbon content of microagglomerates will significantly enhance the cumulative emission of CO2-C and increase the mineralization of SOC, while the increase in carbon content of large agglomerates will significantly reduce the cumulative emission of CO2-C, and decrease the mineralization of SOC.

4. Discussion

4.1. Different Straw Addition Methods Affect SWR

SWR is an important phenomenon that affects soil moisture and usually results from the fact that some soil particles are covered with nonpolar organic matter [34,35], which consists mainly of humic substances, a complex of organic compounds with hydrophobic or hydrophilic properties [36], formed as a result of changes in plant residues in the soil [37,38]. In this study, compared to the control treatment, the CD treatment had a larger and significantly lower droplet CA at 5 s. Water droplets infiltrated more slowly on the surface of the CD-treated soil, which significantly increased the SWR (Figure 1 and Figure 2). Water repellency is crucial role to the content of SOM [39], and the greater the content of SOM, the greater the soil water repellency [31]. In previous studies, SOM was commonly used to assess SWR [40], and therefore changes in the contact angle of water droplets with the soil surface can be explained by the OC content. In general, adding straw increases SOC content to varying degrees until the soil reaches carbon saturation [41]. The deep burial of straw can bring straw into closer contact with soil microorganisms and promote mineralization [42]. Studies have shown that deep burial of straw is more beneficial to increase SOC than straw mulching because it increases the contact area of straw with soil microorganisms and enzymes [43,44] and increases soil microbial activity [45]. More humus is formed in the soil than straw mulch [46]. In this study, straw addition was the main source of increasing soil carbon stocks, and the deep burial of straw was more favorable for C accumulation [47]. Studies have shown that straw return affects SWR [48], adding plant residues to the soil and increasing the SOC content increased CA [16,49]. The SOC content affects soil water repellency [50], and management practices that increase SOC content increase SWR and decrease wettability [51,52]. This has been demonstrated in several studies: soils had a greater water repellency after straw was added to the soil [53]. Decreases in SOC content reduce the degree of SWR [54], which reduces the water-holding capacity of the soil [51]. SOC plays an important role in SWR, which supports the idea that SWR is one of the main properties affecting the structural stability of soil [55].
On the other hand, the water repellency of soil is associated with hydrophobic components of SOM, which are believed to originate from the microbial decomposition of plant residues or root secretions [34,56], producing hydrophobic compounds that contribute to the formation of water repellency in the soil [57]. Also, waxes on plant epidermis may cause soil hydrophobicity [58]. Many studies have focused on isolating compounds that cause soil hydrophobicity, including alkanes [59], fatty acids and their esters [60], phytol, phytane, and sterol [56], amides, aldehydes, ketones, and more complex heterocyclic structures [61]. Unstable components of organic matter, such as carbohydrates and aliphatics, are usually degraded during the early stages of straw decomposition. Stable components of organic matter, such as aromatic hydrocarbons, are released in the later stages of decomposition, while aliphatic and aromatic organic carbon fractions are derived from organic inputs of cellulose and lignin, respectively [62]. Lignin does not contain chemical bonds that can be hydrolyzed and are primarily bonded by aromatic and aliphatic carbons, and these aliphatic hydrocarbons are considered to be the most important chemical class causing SWR [59,63,64]. Capriel et al. [65] found a correlation with the number of aliphatic C-H units affecting SWR in studies of SOM water repellency in arable land; McKissock et al. [66] found a correlation between aliphatic C-H and water repellency in Australian soils. Aranda et al. [16], in a long-term field experiment on the influence of olive pomace on SWR, showed the effect of olive pomace, where higher concentrations of aliphatic compounds in applied organic matter led to an increase in SWR. González-Peñaloza et al. [67] suggested that the water repellency of soils can be attributed to the addition of inputs of water-repelling organic compounds, such as plant residues and organic fertilizers, or be affected by soil use and management effects. This confirms our results that different straw-return methods influenced straw decomposition and led to a significant increase in SWR.

4.2. Enhancement of SWR Improves Aggregate Stability

Soil aggregates are the basic units of soil structure and play a crucial role in soil nutrient storage [68]. The higher biomass of straw is a major factor influencing soil aggregates, and organic particles or colloids derived from crop residues can bind with minerals and combine microaggregates into macroaggregates [69]. This finding is consistent with the findings of Wang et al. [70] that straw return significantly improved the stability of >2 mm agglomerates. Straw application increased the percentage of water-stable agglomerates, mean weight diameter, and higher porosity [71]. Straw addition promoted the formation of macroaggregates while decreasing the microaggregate content and increasing the carbon content of different aggregate particle sizes [72]. The addition of straw increased the soil organic matter SOM content and released polysaccharides and organic acids during the decomposition of the residue, which combined the residue with soil particles to form macroagglomerates [73]. This could explain the significant increase in the content of 2–0.25 mm particle size agglomerates and the significant decrease in the content of microagglomerates observed in this study (Figure 3a).
Soil wettability is another important factor influencing the stability of aggregates [74,75]. Water-repellent soils enhance aggregate stability in addition to having a direct effect on microbial accessibility [20]. The increased stability of soil aggregates under hydrophobic conditions is attributed to reduced water infiltration limiting the water pressure on soil aggregates [76], and the high stability of soil aggregates is thought to be caused by the presence of hydrophobic substances and their configurations [77,78]. In this study, slower infiltration of water droplets on the surface of CD-treated soils significantly increased the SWR (Figure 1 and Figure 2), the content of macroaggregates was significantly increased and the content of microaggregates was significantly decreased (Figure 3a), and aggregate stability was positively correlated with water repellency (Figure 6 and Figure 7), and the enhanced water repellency of soils increased the resistance of aggregates to water [79]. In water-repellent soils, the infiltration rate decreases when aggregates are kept dry for long periods; therefore, it can be inferred that the bonding between particles will act for longer due to slow wetting. This indirectly increases the structural stability of the soil aggregates and thus the water resistance [17]. According to Vogelmann et al., the effect on aggregate stability is only positive during dry periods when the soil becomes more water resistant [80].
OC in soil aggregates increases with decreasing aggregate diameter [81], and microaggregates have the highest OC content [82]. SOC is mainly present in relatively large aggregates, and some OC is re-transferred to microaggregates [83]. Microaggregates have a high content of pores with diameters smaller than 0.2 μm, which is considered to be the size limit for bacterial entry [84], and about 75% of OM is retained in these pores, providing protection for OM in microaggregates [85]. In addition, microaggregates can bind tightly to OC as organic–inorganic complexes due to their greater specific surface area and surface charge, which in turn promotes their sequestration of OC [84]. Straw application provides a substrate for microorganisms [86] that can alter the distribution of OC and increase the OCP content of macroaggregates [87]. Although the OC content of macroaggregates was slightly lower, the deep burial of straw significantly increased the OC contribution of macroaggregates, which was consistent with the results of Ma et al. [83]. And the contribution of macroaggregates to soil OC showed an increasing trend with time [88].
The addition of organic matter to soil increases the SWR and increases the number and size of water-stable aggregates [89], and SWR enhances the stability of aggregates and also helps to protect the stability of SOM [20]. In contrast, the accumulation of SOM increases the molecular binding of humic substances [90], forms a water-repellent coating on the outside of the agglomerates, reduces the entry of water into the agglomerates, and promotes the aggregation of microaggregates, enhancing the formation and stabilization of the agglomerates [20]. The findings of this paper are in agreement with other studies showing an important link between agglomerate stability, SOC content, and SWR [55,80].

4.3. Different Straw-Return Methods Change the SWR and Thus Affect CO2 Emission

Straw-returning methods affect CO2 emissions [91]. This study showed that all treatments’ CO2 emission rate curves (Figure 3) showed peak CO2 emission at 0.5–2 d. The CT, CM, CD, and CE treatments started the process of rapid decrease in the CO2 emission rate on Days 19, 26, 26, and 33, entering the first slow-emission platform, and then entering the second slow-emission platform, with a slow decrease in the rate of straw decomposition, and the rate of CO2 emission averaged from 1.28 to 3.60 mg kg−1d−1. Numerous studies have shown that the addition of straw to the soil can provide energy and nutrients for soil microorganisms and easily stimulate the activity of soil microorganisms. Eventually, the rapid decomposition of organic matter and the emission rate of CO2 reached a peak. Thereafter, the mineralization process gradually enters a slow decomposition phase as the readily degradable OC decreases [45]. The rapid decomposition phase in the wild is typically 1–3 months or longer, but under simulated culture conditions, the time to peak is much shorter, taking only a few days or a week or so [92]. The addition of straw to the soil provided a large source of OC for microorganisms and intensified the microbial metabolic rate. The microorganisms first assimilated and decomposed the easily decomposed components of straw, such as sugars and amino acids, and at this time, soil respiration was strengthened, so the initial rate of straw decomposition and the cumulative amount of decomposition increased rapidly. However, with the prolongation of decomposition time, the easily decomposed organic matter in straw was consumed by microorganisms, and the microorganisms began to turn to the more difficult-to-decompose organic matter such as cellulose and lignin, and the decomposition rate of straw decreased, and the cumulative decomposition rate increased slowly. In addition, the decomposition of straw is most affected by its carbon content. Because the OC content of the easily decomposable components of straw was higher than that of difficult-to-decompose components in the pre-decomposition stage, straw was dominated by difficult-to-decompose components in the post-decomposition stage, and its OC content also decreased gradually [93,94].
Factors affecting soil aggregates will all influence soil carbon mineralization, especially changes in aggregate grain size [95]. Adding organic matter to soils can increase the SWR and increase the number and size of water-stable aggregates [89]. Studies have shown that OC in large aggregates is more unstable and more susceptible to mineralization [96]. The higher cumulative SOC-derived CO2 production in macroaggregates compared to microaggregates is mainly attributed to the higher proportion of readily decomposable and less protected OC in macroaggregates [97]. Thus, soil aggregate particle size has a significant effect on carbon mineralization.
Macroaggregates contribute the most to SOC mineralization because they are abundant in soils [96]. The greater rate of OC decomposition in macroaggregates than in microaggregates is due to the larger pore sizes and higher accessibility of newly formed macroaggregates [98]. Jiang et al. [99] found the most bioactive microorganisms in macroaggregates, which increased the rate of OC mineralization in macroaggregates. The increased OCP content of macroaggregates provided more nutrients for the overall growth of microorganisms and induced the production of extracellular enzymes, which enhanced SOC mineralization [100]. The results of the study showed that the turnover rate of OC in macroaggregates was faster than that of microaggregates, and the active OC was easily transformed under the influence of the environment [101]. In contrast, the OC in microaggregates is mostly a highly humic inert fraction that is not easily mineralized [9]. The lower specific respiration rate of microaggregate OC (Figure 4b) was associated with the high OC content (Table 1). Microaggregates contain more OC than macroaggregates [96], and microaggregates have a high carbon stabilization capacity, which is enhanced by highly processed OC and reduced oxygen diffusion (limiting aerobic decomposition) [24]. The elevated OC content of microaggregates due to straw return may favor long-term carbon sequestration because microaggregates have longer turnover times and a higher stability relative to macroaggregates [85].
Goebel et al. found that SWR makes SOM highly stable, promotes the conversion of microaggregates to macroaggregates, and facilitates CO2 efflux from macroaggregates [6]. CO2 emissions are affected by soil aggregate size [102], and CO2 emissions from larger aggregates are higher [103]. Straw return significantly increased the SWR, altered agglomerate distribution, and increased CO2 emissions (Figure 6 and Figure 7) and mineralization levels [104]. These studies confirmed the findings of this experiment.

5. Conclusions

Compared with the CT, CM, and CE treatments, the CA of soil and water droplets was significantly higher in the CD treatment, and the rate of decrease in CA was significantly lower than that of the other treatments, the water droplets infiltrated more slowly on the soil surface, and the SWR was enhanced. The CD treatment significantly increased the content of macroaggregates and their OCP content, and at the same time, significantly increased the content of microaggregates’ OC. The CO2-C emission rate and cumulative emissions were enhanced by adding the same amount of straw, with the most significant enhancement in the deep straw treatment. Principal component analysis and Pearson’s correlation analysis showed that increases in SWR, macroaggregates content, and microaggregates’ carbon content significantly increased CO2-C cumulative emissions and SOC mineralization, whereas increases in macroaggregates’ carbon content significantly decreased CO2-C cumulative emissions and SOC mineralization. These results emphasize the degree of SWR and the direct effects of agglomerate particle size distribution and OC content on SOC mineralization under different land return methods. This will help to consolidate soil structural stability and nutrient management to support productivity and SOC sequestration in different agricultural systems.

Author Contributions

Conceptualization, S.D. and D.G.; methodology, data curation, B.-Y.Z.; formal analysis, B.-Y.Z. and S.G.; resources, B.-Y.Z.; investigation, B.-Y.Z. and S.G.; writing—original draft preparation, B.-Y.Z.; funding acquisition, B.-Y.Z. All authors have read and agreed to the published version of the manuscript.

Funding

This work was supported by the National Key Research and Development Program of China (2022YFD1500304), and the National Natural Science Foundation of China (42077022).

Data Availability Statement

Not applicable.

Conflicts of Interest

The authors declare no conflict of interest.

References

  1. Li, H.; Dai, M.; Dai, S.; Dong, X. Current Status and Environment Impact of Direct Straw Return in China’s Cropland—A Review. Ecotoxicol. Environ. Saf. 2018, 159, 293–300. [Google Scholar] [CrossRef] [PubMed]
  2. Wang, W.; Lai, D.Y.F.; Wang, C.; Pan, T.; Zeng, C. Effects of Rice Straw Incorporation on Active Soil Organic Carbon Pools in a Subtropical Paddy Field. Soil Tillage Res. 2015, 152, 8–16. [Google Scholar] [CrossRef]
  3. Guenet, B.; Neill, C.; Bardoux, G.; Abbadie, L. Is There a Linear Relationship between Priming Effect Intensity and the Amount of Organic Matter Input? Appl. Soil Ecol. 2010, 46, 436–442. [Google Scholar] [CrossRef]
  4. Zhang, Y.; Gao, Y.; Zhang, Y.; Huang, D.; Li, X.; Gregorich, E.; McLaughlin, N.; Zhang, X.; Chen, X.; Zhang, S.; et al. Effect of Long-Term Tillage and Cropping System on Portion of Fungal and Bacterial Necromass Carbon in Soil Organic Carbon. Soil Tillage Res. 2022, 218, 105307. [Google Scholar] [CrossRef]
  5. Nyamadzawo, G.; Nyamangara, J.; Nyamugafata, P.; Muzulu, A. Soil Microbial Biomass and Mineralization of Aggregate Protected Carbon in Fallow-Maize Systems under Conventional and No-Tillage in Central Zimbabwe. Soil Tillage Res. 2009, 102, 151–157. [Google Scholar] [CrossRef]
  6. Goebel, M.-O.; Bachmann, J.; Woche, S.K.; Fischer, W.R. Soil Wettability, Aggregate Stability, and the Decomposition of Soil Organic Matter. Geoderma 2005, 128, 80–93. [Google Scholar] [CrossRef]
  7. Devine, S.; Markewitz, D.; Hendrix, P.; Coleman, D. Soil Aggregates and Associated Organic Matter under Conventional Tillage, No-Tillage, and Forest Succession after Three Decades. PLoS ONE 2014, 9, e84988. [Google Scholar] [CrossRef]
  8. Raiesi, F. Carbon and N Mineralization as Affected by Soil Cultivation and Crop Residue in a Calcareous Wetland Ecosystem in Central Iran. Agric. Ecosyst. Environ. 2006, 112, 13–20. [Google Scholar] [CrossRef]
  9. Six, J.; Elliott, E.T.; Paustian, K. Soil Macroaggregate Turnover and Microaggregate Formation: A Mechanism for C Sequestration under No-Tillage Agriculture. Soil Biol. Biochem. 2000, 32, 2099–2103. [Google Scholar] [CrossRef]
  10. Whalen, J.K.; Bottomley, P.J.; Myrold, D.D. Carbon and Nitrogen Mineralization from Light- and Heavy-Fraction Additions to Soil. Soil Biol. Biochem. 2000, 32, 1345–1352. [Google Scholar] [CrossRef]
  11. Fuentes, M.; Hidalgo, C.; Etchevers, J.; De León, F.; Guerrero, A.; Dendooven, L.; Verhulst, N.; Govaerts, B. Conservation Agriculture, Increased Organic Carbon in the Top-Soil Macro-Aggregates and Reduced Soil CO2 Emissions. Plant Soil 2012, 355, 183–197. [Google Scholar] [CrossRef]
  12. Cotrufo, M.F.; Soong, J.L.; Horton, A.J.; Campbell, E.E.; Haddix, M.L.; Wall, D.H.; Parton, W.J. Formation of Soil Organic Matter via Biochemical and Physical Pathways of Litter Mass Loss. Nat. Geosci. 2015, 8, 776–779. [Google Scholar] [CrossRef]
  13. Comino, F.; Aranda, V.; Domínguez-Vidal, A.; Ayora-Cañada, M.J. Thermal Destruction of Organic Waste Hydrophobicity for Agricultural Soils Application. J. Environ. Manag. 2017, 202, 94–105. [Google Scholar] [CrossRef] [PubMed]
  14. de Blas, E.; Rodríguez-Alleres, M.; Almendros, G. Speciation of Lipid and Humic Fractions in Soils under Pine and Eucalyptus Forest in Northwest Spain and Its Effect on Water Repellency. Geoderma 2010, 155, 242–248. [Google Scholar] [CrossRef]
  15. Schaumann, G.E.; Braun, B.; Kirchner, D.; Rotard, W.; Szewzyk, U.; Grohmann, E. Influence of Biofilms on the Water Repellency of Urban Soil Samples. Hydrol. Process. 2007, 21, 2276–2284. [Google Scholar] [CrossRef]
  16. Aranda, V.; Calero, J.; Plaza, I.; Ontiveros-Ortega, A. Long-Term Effects of Olive Mill Pomace Co-Compost on Wettability and Soil Quality in Olive Groves. Geoderma 2016, 267, 185–195. [Google Scholar] [CrossRef]
  17. Mataix-Solera, J.; Cerdà, A.; Arcenegui, V.; Jordán, A.; Zavala, L.M. Fire Effects on Soil Aggregation: A Review. Earth-Sci. Rev. 2011, 109, 44–60. [Google Scholar] [CrossRef]
  18. Blanco-Canqui, H.; Lal, R. Extent of Soil Water Repellency under Long-Term No-till Soils. Geoderma 2009, 149, 171–180. [Google Scholar] [CrossRef]
  19. Wang, Z.; Wu, Q.J.; Wu, L.; Ritsema, C.J.; Dekker, L.W.; Feyen, J. Effects of Soil Water Repellency on Infiltration Rate and Flow Instability. J. Hydrol. 2000, 231–232, 265–276. [Google Scholar] [CrossRef]
  20. Piccolo, A.; Mbagwu, J.S.C. Role of Hydrophobic Components of Soil Organic Matter in Soil Aggregate Stability. Soil Sci. Soc. Am. J. 1999, 63, 1801–1810. [Google Scholar] [CrossRef]
  21. Czachor, H.; Doerr, S.H.; Lichner, L. Water Retention of Repellent and Subcritical Repellent Soils: New Insights from Model and Experimental Investigations. J. Hydrol. 2010, 380, 104–111. [Google Scholar] [CrossRef]
  22. de Jonge, L.W.; Moldrup, P.; Jacobsen, O.H. Soil-Water Content Dependency of Water Repellency in Soils. Soil Sci. 2007, 172, 577–588. [Google Scholar] [CrossRef]
  23. Kawamoto, K.; Moldrup, P.; Komatsu, T.; de Jonge, L.W.; Oda, M. Water Repellency of Aggregate Size Fractions of a Volcanic Ash Soil. Soil Sci. Soc. Am. J. 2007, 71, 1658–1666. [Google Scholar] [CrossRef]
  24. Lützow, M.v.; Kögel-Knabner, I.; Ekschmitt, K.; Matzner, E.; Guggenberger, G.; Marschner, B.; Flessa, H. Stabilization of Organic Matter in Temperate Soils: Mechanisms and Their Relevance under Different Soil Conditions—A Review: Mechanisms for Organic Matter Stabilization in Soils. Eur. J. Soil Sci. 2006, 57, 426–445. [Google Scholar] [CrossRef]
  25. Huang, T.; Yang, H.; Huang, C.; Ju, X. Effects of Nitrogen Management and Straw Return on Soil Organic Carbon Sequestration and Aggregate-Associated Carbon: Organic Fertilizer Benefit for SOC Sequestration. Eur. J. Soil Sci. 2018, 69, 913–923. [Google Scholar] [CrossRef]
  26. Wang, X.; Qi, J.-Y.; Zhang, X.-Z.; Li, S.-S.; Latif Virk, A.; Zhao, X.; Xiao, X.-P.; Zhang, H.-L. Effects of Tillage and Residue Management on Soil Aggregates and Associated Carbon Storage in a Double Paddy Cropping System. Soil Tillage Res. 2019, 194, 104339. [Google Scholar] [CrossRef]
  27. Messiga, A.J.; Ziadi, N.; Angers, D.A.; Morel, C.; Parent, L.-E. Tillage Practices of a Clay Loam Soil Affect Soil Aggregation and Associated C and P Concentrations. Geoderma 2011, 164, 225–231. [Google Scholar] [CrossRef]
  28. Gerschlauer, F.; Dannenmann, M.; Kühnel, A.; Meier, R.; Kolar, A.; Butterbach-Bahl, K.; Kiese, R. Gross Nitrogen Turnover of Natural and Managed Tropical Ecosystems at Mt. Kilimanjaro, Tanzania. Ecosystems 2016, 19, 1271–1288. [Google Scholar] [CrossRef]
  29. Leelamanie, D.A.L.; Karube, J.; Yoshida, A. Characterizing Water Repellency Indices: Contact Angle and Water Drop Penetration Time of Hydrophobized Sand. Soil Sci. Plant Nutr. 2008, 54, 179–187. [Google Scholar] [CrossRef]
  30. Bünemann, E.K.; Bongiorno, G.; Bai, Z.; Creamer, R.E.; De Deyn, G.; de Goede, R.; Fleskens, L.; Geissen, V.; Kuyper, T.W.; Mäder, P.; et al. Soil Quality—A Critical Review. Soil Biol. Biochem. 2018, 120, 105–125. [Google Scholar] [CrossRef]
  31. Cervera-Mata, A.; Aranda, V.; Ontiveros-Ortega, A.; Comino, F.; Martín-García, J.M.; Vela-Cano, M.; Delgado, G. Hydrophobicity and Surface Free Energy to Assess Spent Coffee Grounds as Soil Amendment. Relationships with soil quality. CATENA 2021, 196, 104826. [Google Scholar] [CrossRef]
  32. Elliott, E.T. Aggregate Structure and Carbon, Nitrogen, and Phosphorus in Native and Cultivated Soils. Soil Sci. Soc. Am. J. 1986, 50, 627–633. [Google Scholar] [CrossRef]
  33. Nelson, D.W.; Sommers, L.E. Total Carbon, Organic Carbon, and Organic Matter. In Methods of Soil Analysis; Agronomy Monographs; Wiley: Hoboken, NJ, USA, 1983; pp. 539–579. ISBN 978-0-89118-977-0. [Google Scholar]
  34. Doerr, S.H.; Shakesby, R.A.; Walsh, R.P.D. Soil Water Repellency: Its Causes, Characteristics and Hydro-Geomorphological Significance. Earth-Sci. Rev. 2000, 51, 33–65. [Google Scholar] [CrossRef]
  35. Mainwaring, K.; Hallin, I.L.; Douglas, P.; Doerr, S.H.; Morley, C.P. The Role of Naturally Occurring Organic Compounds in Causing Soil Water Repellency: Soil Water Repellency from Organic Compounds. Eur. J. Soil Sci. 2013, 64, 667–680. [Google Scholar] [CrossRef]
  36. Maryganova, V.; Szajdak, L.W.; Tychinskaya, L. Hydrophobic and Hydrophilic Properties of Humic Acids from Soils under Shelterbelts of Different Ages. Chem. Ecol. 2010, 26, 25–33. [Google Scholar] [CrossRef]
  37. Olk, D.C.; Bloom, P.R.; De Nobili, M.; Chen, Y.; McKnight, D.M.; Wells, M.J.M.; Weber, J. Using Humic Fractions to Understand Natural Organic Matter Processes in Soil and Water: Selected Studies and Applications. J. Environ. Qual. 2019, 48, 1633–1643. [Google Scholar] [CrossRef]
  38. Weber, J.; Chen, Y.; Jamroz, E.; Miano, T. Preface: Humic Substances in the Environment. J. Soils Sediments 2018, 18, 2665–2667. [Google Scholar] [CrossRef]
  39. Vogelmann, E.S.; Reichert, J.M.; Prevedello, J.; Consensa, C.O.B.; Oliveira, A.É.; Awe, G.O.; Mataix-Solera, J. Threshold Water Content beyond Which Hydrophobic Soils Become Hydrophilic: The Role of Soil Texture and Organic Matter Content. Geoderma 2013, 209–210, 177–187. [Google Scholar] [CrossRef]
  40. Matějková, Š.; Šimon, T. Application of FTIR Spectroscopy for Evaluation of Hydrophobic/Hydrophilic Organic Components in Arable Soil. Plant Soil Environ. 2012, 58, 192–195. [Google Scholar] [CrossRef]
  41. Sommer, R.; Ryan, J.; Masri, S.; Singh, M.; Diekmann, J. Effect of Shallow Tillage, Moldboard Plowing, Straw Management and Compost Addition on Soil Organic Matter and Nitrogen in a Dryland Barley/Wheat-Vetch Rotation. Soil Tillage Res. 2011, 115–116, 39–46. [Google Scholar] [CrossRef]
  42. Li, J.; Li, H.; Zhang, Q.; Shao, H.; Gao, C.; Zhang, X. Effects of Fertilization and Straw Return Methods on the Soil Carbon Pool and CO2 Emission in a Reclaimed Mine Spoil in Shanxi Province, China. Soil Tillage Res. 2019, 195, 104361. [Google Scholar] [CrossRef]
  43. Stemmer, M.; Von Lützow, M.; Kandeler, E.; Pichlmayer, F.; Gerzabek, M.H. The Effect of Maize Straw Placement on Mineralization of C and N in Soil Particle Size Fractions. Eur. J. Soil Sci. 1999, 50, 73–85. [Google Scholar] [CrossRef]
  44. Wingeyer, A.B.; Walters, D.T.; Drijber, R.A.; Olk, D.C.; Arkebauer, T.J.; Verma, S.B.; Wedin, D.A.; Francis, C.A. Fall Conservation Deep Tillage Stabilizes Maize Residues into Soil Organic Matter. Soil Sci. Soc. Am. J. 2012, 76, 2154–2163. [Google Scholar] [CrossRef]
  45. Zhao, X.M.; He, L.; Zhang, Z.D.; Wang, H.B.; Zhao, L.P. Simulation of Accumulation and Mineralization (CO2 Release) of Organic Carbon in Chernozem under Different Straw Return Ways after Corn Harvesting. Soil Tillage Res. 2016, 156, 148–154. [Google Scholar] [CrossRef]
  46. Huang, T.; Yang, N.; Lu, C.; Qin, X.; Siddique, K.H.M. Soil Organic Carbon, Total Nitrogen, Available Nutrients, and Yield under Different Straw Returning Methods. Soil Tillage Res. 2021, 214, 105171. [Google Scholar] [CrossRef]
  47. Haynes, R. Labile Organic Matter as an Indicator of Organic Matter Quality in Arable and Pastoral Soils in New Zealand. Soil Biol. Biochem. 2000, 32, 211–219. [Google Scholar] [CrossRef]
  48. Hallett, P.D.; Baumgartl, T.; Young, I.M. Subcritical Water Repellency of Aggregates from a Range of Soil Management Practices. Soil Sci. Soc. Am. J. 2001, 65, 184–190. [Google Scholar] [CrossRef]
  49. Liyanage, T.D.P.; Leelamanie, D.A.L. Influence of Organic Manure Amendments on Water Repellency, Water Entry Value, and Water Retention of Soil Samples from a Tropical Ultisol. J. Hydrol. Hydromech. 2016, 64, 160–166. [Google Scholar] [CrossRef]
  50. McKissock, I.; Gilkes, R.J.; Walker, E.L. The Reduction of Water Repellency by Added Clay Is Influenced by Clay and Soil Properties. Appl. Clay Sci. 2002, 20, 225–241. [Google Scholar] [CrossRef]
  51. Werner, W.J.; Sanderman, J.; Melillo, J.M. Decreased Soil Organic Matter in a Long-Term Soil Warming Experiment Lowers Soil Water Holding Capacity and Affects Soil Thermal and Hydrological Buffering. J. Geophys. Res. Biogeosci. 2020, 125, e2019JG005158. [Google Scholar] [CrossRef]
  52. Zavala, L.M.; González, F.A.; Jordán, A. Intensity and Persistence of Water Repellency in Relation to Vegetation Types and Soil Parameters in Mediterranean SW Spain. Geoderma 2009, 152, 361–374. [Google Scholar] [CrossRef]
  53. Cosentino, D.; Hallett, P.D.; Michel, J.C.; Chenu, C. Do Different Methods for Measuring the Hydrophobicity of Soil Aggregates Give the Same Trends in Soil Amended with Residue? Geoderma 2010, 159, 221–227. [Google Scholar] [CrossRef]
  54. Vogelmann, E.S.; Reichert, J.M.; Reinert, D.J.; Mentges, M.I.; Vieira, D.A.; De Barros, C.A.P.; Fasinmirin, J.T. Water Repellency in Soils of Humid Subtropical Climate of Rio Grande Do Sul, Brazil. Soil Tillage Res. 2010, 110, 126–133. [Google Scholar] [CrossRef]
  55. Behrends Kraemer, F.; Hallett, P.D.; Morrás, H.; Garibaldi, L.; Cosentino, D.; Duval, M.; Galantini, J. Soil Stabilisation by Water Repellency under No-till Management for Soils with Contrasting Mineralogy and Carbon Quality. Geoderma 2019, 355, 113902. [Google Scholar] [CrossRef]
  56. Franco, C.M.M.; Michelsen, P.P.; Oades, J.M. Amelioration of Water Repellency: Application of Slow-Release Fertilisers to Stimulate Microbial Breakdown of Waxes. J. Hydrol. 2000, 231–232, 342–351. [Google Scholar] [CrossRef]
  57. Olorunfemi, I.E.; Fasinmirin, J.T. Land Use Management Effects on Soil Hydrophobicity and Hydraulic Properties in Ekiti State, Forest Vegetative Zone of Nigeria. CATENA 2017, 155, 170–182. [Google Scholar] [CrossRef]
  58. Ma’Shum, M.; Tate, M.E.; Jones, G.P.; Oades, J.M. Extraction and Characterization of Water-Repellent Materials from Australian Soils. J. Soil Sci. 1988, 39, 99–110. [Google Scholar] [CrossRef]
  59. Horne, D.J.; McIntosh, J.C. Hydrophobic Compounds in Sands in New Zealand—Extraction, Characterisation and Proposed Mechanisms for Repellency Expression. J. Hydrol. 2000, 231–232, 35–46. [Google Scholar] [CrossRef]
  60. Graber, E.R.; Tagger, S.; Wallach, R. Role of Divalent Fatty Acid Salts in Soil Water Repellency. Soil Sci. Soc. Am. J. 2009, 73, 541–549. [Google Scholar] [CrossRef]
  61. Morley, C.P.; Mainwaring, K.A.; Doerr, S.H.; Douglas, P.; Llewellyn, C.T.; Dekker, L.W. Organic Compounds at Different Depths in a Sandy Soil and Their Role in Water Repellency. Soil Res. 2005, 43, 239. [Google Scholar] [CrossRef]
  62. Dhillon, G.S.; Gillespie, A.; Peak, D.; Van Rees, K.C.J. Spectroscopic Investigation of Soil Organic Matter Composition for Shelterbelt Agroforestry Systems. Geoderma 2017, 298, 1–13. [Google Scholar] [CrossRef]
  63. Atanassova, I.; Doerr, S. Organic Compounds of Different Extractability in Total Solvent Extracts from Soils of Contrasting Water Repellency. Eur. J. Soil Sci. 2010, 61, 298–313. [Google Scholar] [CrossRef]
  64. Doerr, S.H.; Llewellyn, C.T.; Douglas, P.; Morley, C.P.; Mainwaring, K.A.; Haskins, C.; Johnsey, L.; Ritsema, C.J.; Stagnitti, F.; Allinson, G.; et al. Extraction of Compounds Associated with Water Repellency in Sandy Soils of Different Origin. Soil Res. 2005, 43, 225. [Google Scholar] [CrossRef]
  65. Capriel, P.; Beck, T.; Borchert, H.; Gronholz, J.; Zachmann, G. Hydrophobicity of the Organic Matter in Arable Soils. Soil Biol. Biochem. 1995, 27, 1453–1458. [Google Scholar] [CrossRef]
  66. McKissock, I.; Gilkes, R.J.; van Bronswijk, W. The Relationship of Soil Water Repellency to Aliphatic C and Kaolin Measured Using DRIFT. Soil Res. 2003, 41, 251. [Google Scholar] [CrossRef]
  67. González-Peñaloza, F.A.; Cerdà, A.; Zavala, L.M.; Jordán, A.; Giménez-Morera, A.; Arcenegui, V. Do Conservative Agriculture Practices Increase Soil Water Repellency? A Case Study in Citrus-Cropped Soils. Soil Tillage Res. 2012, 124, 233–239. [Google Scholar] [CrossRef]
  68. Xu, X.; Schaeffer, S.; Sun, Z.; Zhang, J.; An, T.; Wang, J. Carbon Stabilization in Aggregate Fractions Responds to Straw Input Levels under Varied Soil Fertility Levels. Soil Tillage Res. 2020, 199, 104593. [Google Scholar] [CrossRef]
  69. Liu, C.; Lu, M.; Cui, J.; Li, B.; Fang, C. Effects of Straw Carbon Input on Carbon Dynamics in Agricultural Soils: A Meta-Analysis. Glob. Change Biol. 2014, 20, 1366–1381. [Google Scholar] [CrossRef]
  70. Wang, X.; Jia, Z.; Liang, L.; Yang, B.; Ding, R.; Nie, J.; Wang, J. Maize Straw Effects on Soil Aggregation and Other Properties in Arid Land. Soil Tillage Res. 2015, 153, 131–136. [Google Scholar] [CrossRef]
  71. Verma, T.S.; Bhagat, R.M. Impact of Rice Straw Management Practices on Yield, Nitrogen Uptake and Soil Properties in a Wheat-Rice Rotation in Northern India. Fertil. Res. 1992, 33, 97–106. [Google Scholar] [CrossRef]
  72. Benbi, D.K.; Senapati, N. Soil Aggregation and Carbon and Nitrogen Stabilization in Relation to Residue and Manure Application in Rice–Wheat Systems in Northwest India. Nutr. Cycl. Agroecosyst. 2010, 87, 233–247. [Google Scholar] [CrossRef]
  73. Monreal, C.M.; Schnitzer, M.; Schulten, H.-R.; Campbell, C.A.; Anderson, D.W. Soil Organic Structures in Macro and Microaggregates of a Cultivated Brown Chernozem. Soil Biol. Biochem. 1995, 27, 845–853. [Google Scholar] [CrossRef]
  74. Chenu, C.; Le Bissonnais, Y.; Arrouays, D. Organic Matter Influence on Clay Wettability and Soil Aggregate Stability. Soil Sci. Soc. Am. J. 2000, 64, 1479–1486. [Google Scholar] [CrossRef]
  75. Leelamanie, D.A.L.; Karube, J. Water Stable Aggregates of Japanese Andisol as Affected by Hydrophobicity and Drying Temperature. J. Hydrol. Hydromech. 2014, 62, 97–100. [Google Scholar] [CrossRef]
  76. Goebel, M.-O.; Bachmann, J.; Reichstein, M.; Janssens, I.A.; Guggenberger, G. Soil Water Repellency and Its Implications for Organic Matter Decomposition—Is There a Link to Extreme Climatic Events? Glob. Change Biol. 2011, 17, 2640–2656. [Google Scholar] [CrossRef]
  77. Eynard, A.; Schumacher, T.E.; Lindstrom, M.J.; Malo, D.D.; Kohl, R.A. Effects of Aggregate Structure and Organic C on Wettability of Ustolls. Soil Tillage Res. 2006, 88, 205–216. [Google Scholar] [CrossRef]
  78. Kořenková, L.; Matúš, P. Role of Water Repellency in Aggregate Stability of Cultivated Soils under Simulated Raindrop Impact. Eurasian Soil Sci. 2015, 48, 754–758. [Google Scholar] [CrossRef]
  79. Piyaruwan, H.I.G.S.; Leelamanie, D.A.L. Existence of Water Repellency and Its Relation to Structural Stability of Soils in a Tropical Eucalyptus Plantation Forest. Geoderma 2020, 380, 114679. [Google Scholar] [CrossRef]
  80. Vogelmann, E.S.; Reichert, J.M.; Prevedello, J.; Awe, G.O.; Mataix-Solera, J. Can occurrence of soil hydrophobicity promote the increase of aggregates stability? CATENA 2013, 110, 24–31. [Google Scholar] [CrossRef]
  81. Liu, N.; Gong, M.; Zhang, P.; Li, L.; Li, W.; Lee, R. Silver-Embedded Zeolite Crystals as Substrates for Surface-Enhanced Raman Scattering. J. Mater. Sci. 2011, 46, 3162–3168. [Google Scholar] [CrossRef]
  82. Brodowski, S.; John, B.; Flessa, H.; Amelung, W. Aggregate-Occluded Black Carbon in Soil: Occluded Black Carbon in Soil. Eur. J. Soil Sci. 2006, 57, 539–546. [Google Scholar] [CrossRef]
  83. Ma, L.; Wang, W.; Shen, S. Response of Soil Aggregate Stability and Distribution of Organic Carbon to Alpine Grassland Degradation in Northwest Sichuan. Geoderma Reg. 2020, 22, e00309. [Google Scholar] [CrossRef]
  84. Simonetti, G.; Francioso, O.; Nardi, S.; Berti, A.; Brugnoli, E.; Francesco Morari, E.L. Characterization of Humic Carbon in Soil Aggregates in a Long-Term Experiment with Manure and Mineral Fertilization. Soil Sci. Soc. Am. J. 2012, 76, 880–890. [Google Scholar] [CrossRef]
  85. McCarthy, J.F.; Ilavsky, J.; Jastrow, J.D.; Mayer, L.M.; Perfect, E.; Zhuang, J. Protection of Organic Carbon in Soil Microaggregates via Restructuring of Aggregate Porosity and Filling of Pores with Accumulating Organic Matter. Geochim. Cosmochim. Acta 2008, 72, 4725–4744. [Google Scholar] [CrossRef]
  86. An, T.; Schaeffer, S.; Zhuang, J.; Radosevich, M.; Li, S.; Li, H.; Pei, J.; Wang, J. Dynamics and Distribution of 13C-Labeled Straw Carbon by Microorganisms as Affected by Soil Fertility Levels in the Black Soil Region of Northeast China. Biol. Fertil. Soils 2015, 51, 605–613. [Google Scholar] [CrossRef]
  87. Guan, S.; Dou, S.; Chen, G.; Wang, G.; Zhuang, J. Isotopic Characterization of Sequestration and Transformation of Plant Residue Carbon in Relation to Soil Aggregation Dynamics. Appl. Soil Ecol. 2015, 96, 18–24. [Google Scholar] [CrossRef]
  88. Wen, D.; He, N.; Zhang, J. Dynamics of Soil Organic Carbon and Aggregate Stability with Grazing Exclusion in the Inner Mongolian Grasslands. PLoS ONE 2016, 11, e0146757. [Google Scholar] [CrossRef]
  89. Lynch, J.M.; Bragg, E. Microorganisms and Soil Aggregate Stability. In Soil Restoration; Lal, R., Stewart, B.A., Eds.; Advances in Soil Science; Springer: New York, NY, USA, 1985; Volume 17, pp. 133–171. ISBN 978-1-4612-7684-5. [Google Scholar]
  90. Piccolo, A.; Mbagwu, J.S.C. Effects of Different Organic Waste Amendments on Soil Microaggregates Stability and Molecular Sizes of Humic Substances. Plant Soil 1990, 123, 27–37. [Google Scholar] [CrossRef]
  91. Tian, X.; Wang, L.; Hou, Y.; Wang, H.; Tsang, Y.F.; Wu, J. Responses of Soil Microbial Community Structure and Activity to Incorporation of Straws and Straw Biochars and Their Effects on Soil Respiration and Soil Organic Carbon Turnover. Pedosphere 2019, 29, 492–503. [Google Scholar] [CrossRef]
  92. Duong, T.T.T.; Baumann, K.; Marschner, P. Frequent Addition of Wheat Straw Residues to Soil Enhances Carbon Mineralization Rate. Soil Biol. Biochem. 2009, 41, 1475–1482. [Google Scholar] [CrossRef]
  93. Wang, X.; Sun, B.; Mao, J.; Sui, Y.; Cao, X. Structural Convergence of Maize and Wheat Straw during Two-Year Decomposition under Different Climate Conditions. Environ. Sci. Technol. 2012, 46, 7159–7165. [Google Scholar] [CrossRef]
  94. Xu, Y.; Fan, J.; Ding, W.; Bol, R.; Chen, Z.; Luo, J.; Bolan, N. Stage-Specific Response of Litter Decomposition to N and S Amendments in a Subtropical Forest Soil. Biol. Fertil. Soils 2016, 52, 711–724. [Google Scholar] [CrossRef]
  95. Six, J.; Conant, R.T.; Paul, E.A.; Paustian, K. Stabilization Mechanisms of Soil Organic Matter: Implications for C-Saturation of Soils. Plant Soil 2002, 241, 155–176. [Google Scholar] [CrossRef]
  96. Bimüller, C.; Kreyling, O.; Kölbl, A.; Von Lützow, M.; Kögel-Knabner, I. Carbon and Nitrogen Mineralization in Hierarchically Structured Aggregates of Different Size. Soil Tillage Res. 2016, 160, 23–33. [Google Scholar] [CrossRef]
  97. Tian, J.; Pausch, J.; Yu, G.; Blagodatskaya, E.; Gao, Y.; Kuzyakov, Y. Aggregate Size and Their Disruption Affect 14C-Labeled Glucose Mineralization and Priming Effect. Appl. Soil Ecol. 2015, 90, 1–10. [Google Scholar] [CrossRef]
  98. Puget, P.; Chenu, C.; Balesdent, J. Total and Young Organic Matter Distributions in Aggregates of Silty Cultivated Soils. Eur. J. Soil Sci. 1995, 46, 449–459. [Google Scholar] [CrossRef]
  99. Jiang, X.; Wright, A.L.; Wang, J.; Li, Z. Long-Term Tillage Effects on the Distribution Patterns of Microbial Biomass and Activities within Soil Aggregates. CATENA 2011, 87, 276–280. [Google Scholar] [CrossRef]
  100. Liao, H.; Zhang, Y.; Zuo, Q.; Du, B.; Chen, W.; Wei, D.; Huang, Q. Contrasting Responses of Bacterial and Fungal Communities to Aggregate-Size Fractions and Long-Term Fertilizations in Soils of Northeastern China. Sci. Total Environ. 2018, 635, 784–792. [Google Scholar] [CrossRef]
  101. Franzluebbers, A.J.; Arshad, M.A. Water-Stable Aggregation and Organic Matter in Four Soils under Conventional and Zero Tillage. Can. J. Soil Sci. 1996, 76, 387–393. [Google Scholar] [CrossRef]
  102. Mangalassery, S.; Sjögersten, S.; Sparkes, D.L.; Sturrock, C.J.; Mooney, S.J. The Effect of Soil Aggregate Size on Pore Structure and Its Consequence on Emission of Greenhouse Gases. Soil Tillage Res. 2013, 132, 39–46. [Google Scholar] [CrossRef]
  103. Zhu, B.; Gutknecht, J.L.M.; Herman, D.J.; Keck, D.C.; Firestone, M.K.; Cheng, W. Rhizosphere Priming Effects on Soil Carbon and Nitrogen Mineralization. Soil Biol. Biochem. 2014, 76, 183–192. [Google Scholar] [CrossRef]
  104. Jiang, M.; Yang, N.; Zhao, J.; Shaaban, M.; Hu, R. Crop Straw Incorporation Mediates the Impacts of Soil Aggregate Size on Greenhouse Gas Emissions. Geoderma 2021, 401, 115342. [Google Scholar] [CrossRef]
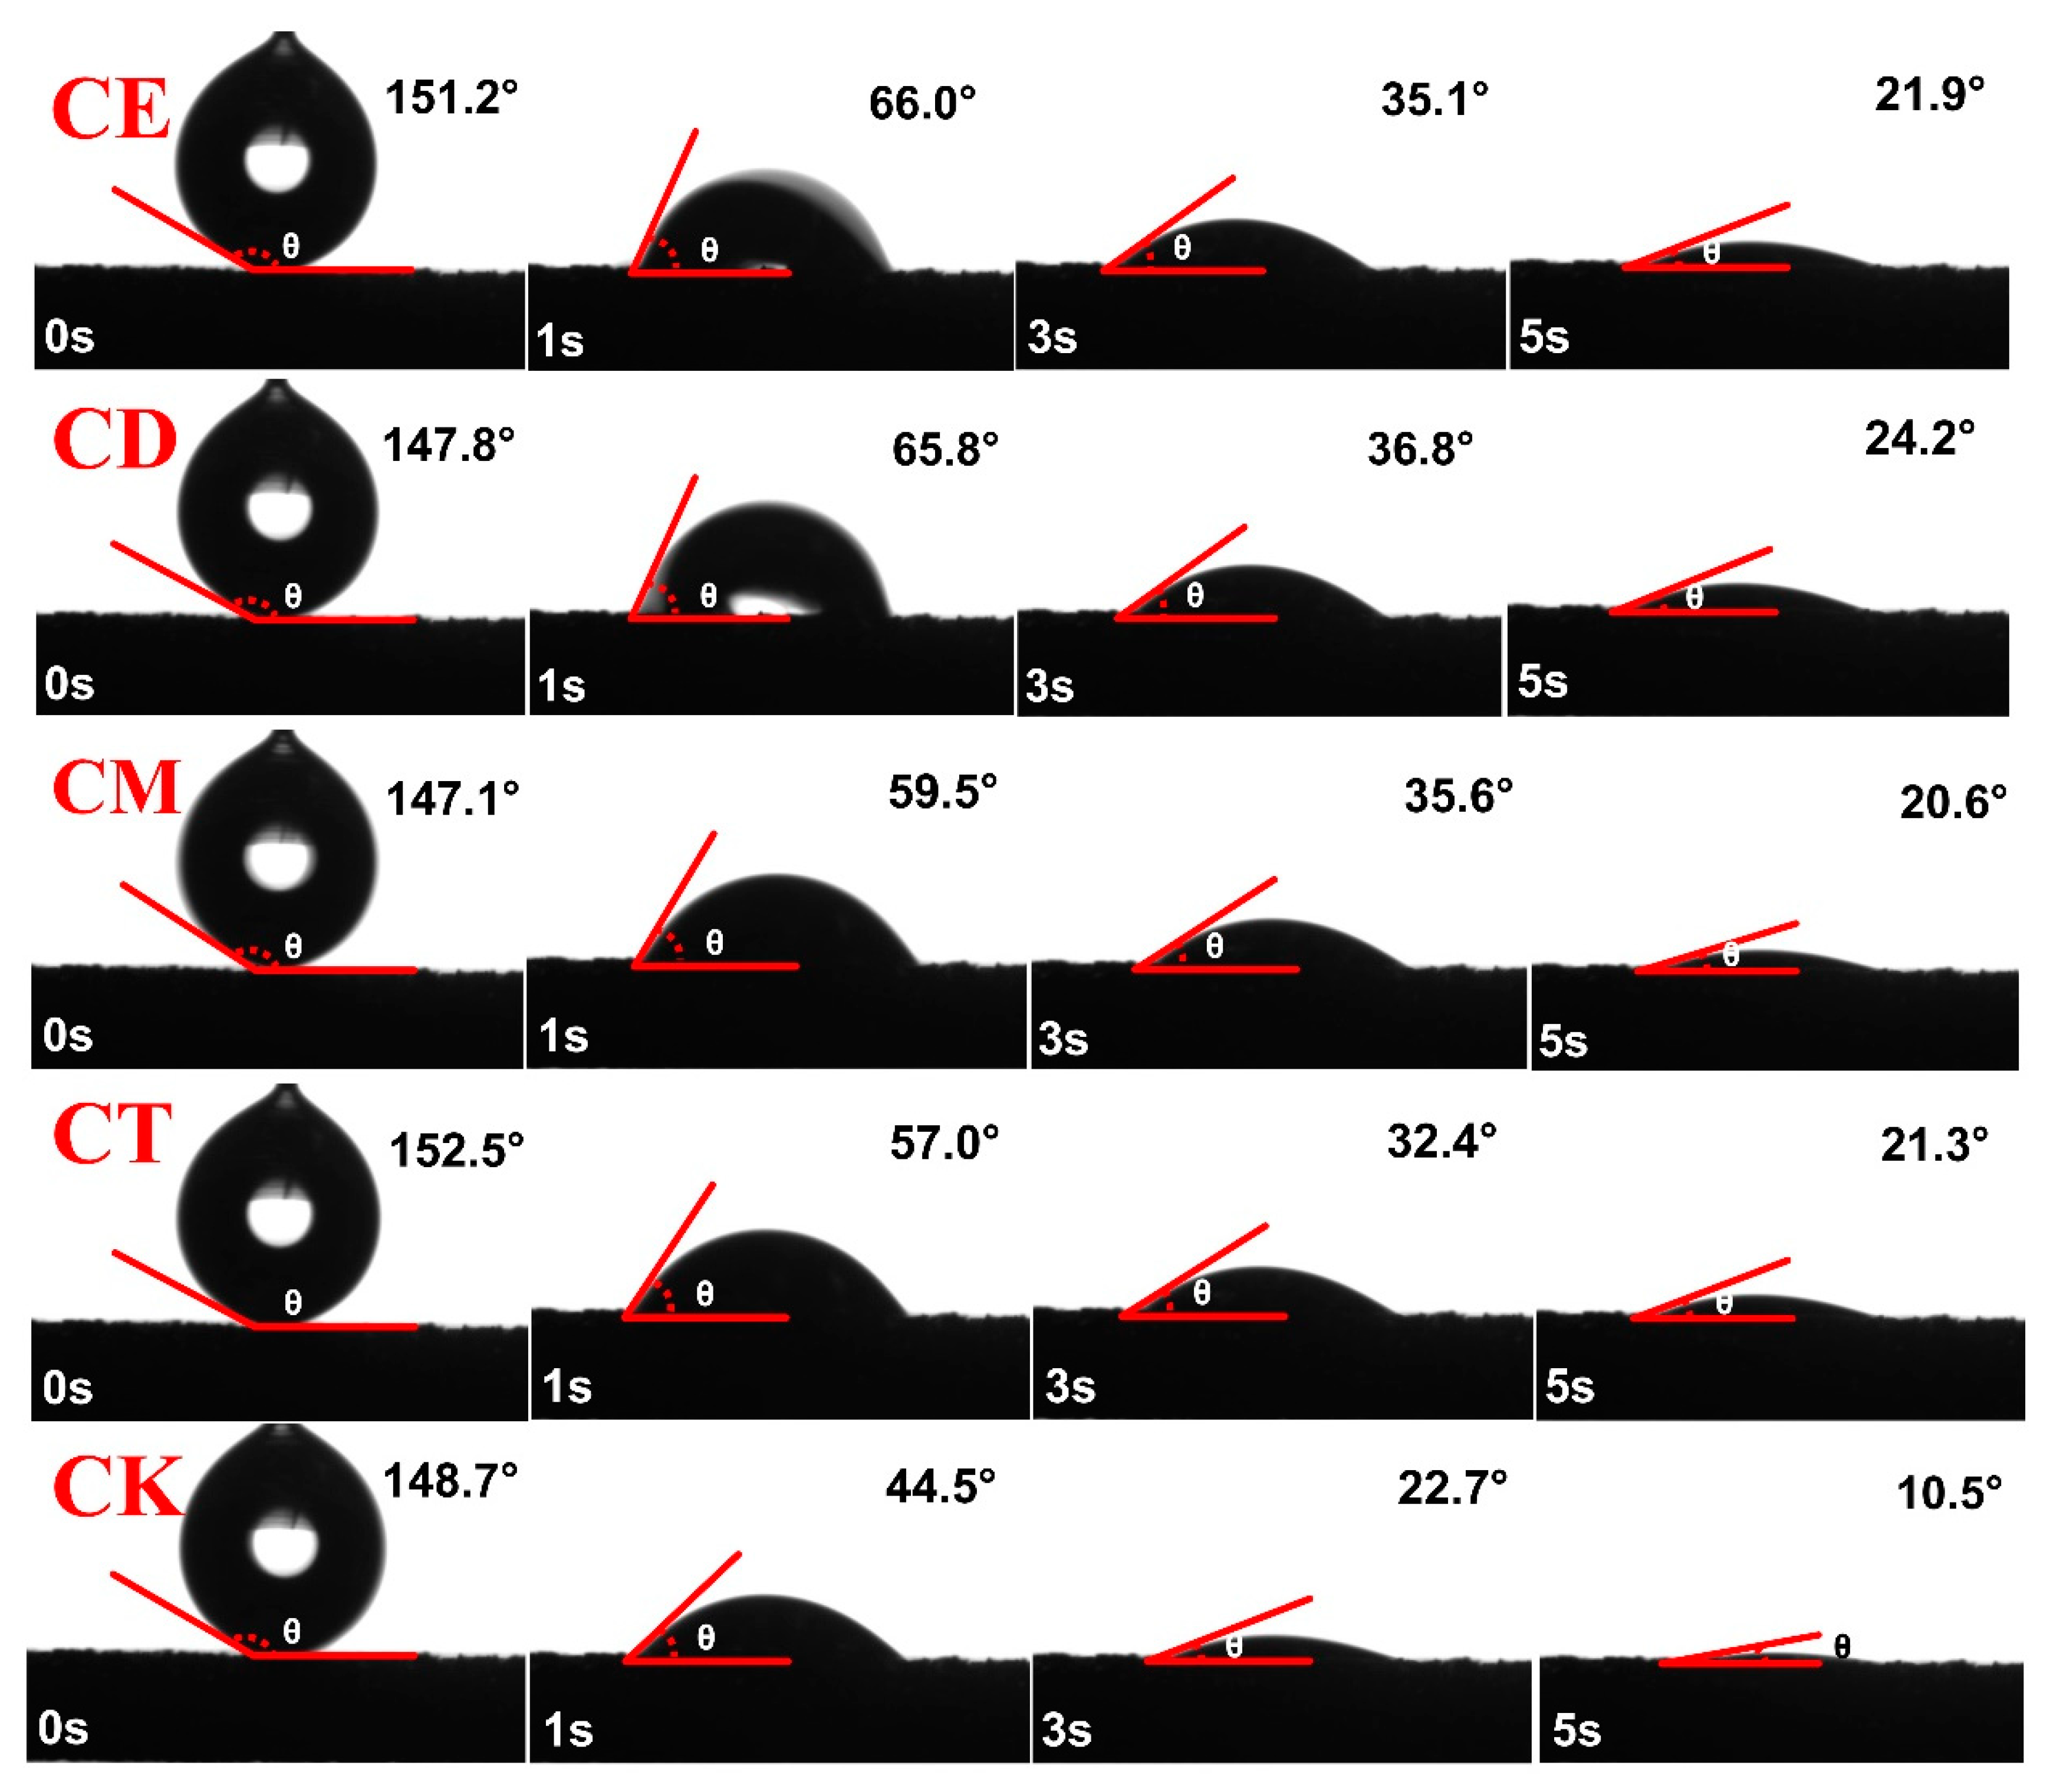
Figure 1. Soil morphology of water droplets on the soil surface of each treatment at 0 s, 1 s, 3 s, and 5 s. The experimental treatments were the control (CK); straw mix (CT); straw mulch (CM); straw deep (CD); and straw tripling deep burying (CE).
Agronomy 13 02618 g001
Figure 2. Changes in CA on the soil surface of water droplets on each treatment with time and the rate of CA decrease. The experimental treatments were the control (CK); straw mixture (CT); straw mulch (CM); straw deep burying (CD); and straw tripling deep burying (CE). Bubble size indicates CA, bubble color indicates CA decline rate, and letters indicate significant differences in CA among treatments (p < 0.05).
Agronomy 13 02618 g002
Figure 3. Distribution of soil aggregates content (a), aggregate organic carbon content (b), aggregate organic carbon pool content (c) and aggregate organic carbon contribution (d) under different methods of straw addition. The experimental treatments were the control (CK); straw mixture (CT); straw mulch (CM); straw deep burial (CD); and straw tripling deep burial (CE). Upper case letters indicate significant differences (p < 0.05) among different grain sizes. Lowercase letters indicate significant differences between treatments (p < 0.05).
Agronomy 13 02618 g003
Figure 4. CO2-C emission rates of straw mixing (a), straw mulching (b), straw deep burial (c), and straw tripling deep burying (d).
Agronomy 13 02618 g004
Figure 5. Cumulative CO2-C emissions from straw mixing (a), straw mulching (b), straw deep burial (c), and straw tripling deep burying (d).
Agronomy 13 02618 g005
Figure 6. Principal component analysis (PCA) of SWR, soil aggregates, and cumulative CO2-C emissions under different straw addition methods. The experimental treatments were control (CK); straw mixture (CT); straw mulching (CM); straw deep burying (CD); and straw doubled deep burying (CE).
Agronomy 13 02618 g006
Figure 7. Pearson correlation analysis of SWR, soil aggregates, and CO2-C emission under different straw addition methods. A, B, C, and D are >2 mm, 2–0.25 mm, 0.25–0.053 mm, and <0.053 mm agglomerate content; E, F, G, and H are >2 mm, 2–0.25 mm, 0.25–0.053 mm, and <0.053 mm agglomerate OC content; and I, J, K, and L are >2 mm, 2–0.25 mm, 0.25–0.053 mm, and <0.053 mm agglomerates OCP content; M, N, O, and P are >2 mm, 2–0.25 mm, 0.25–0.053 mm, and <0.053 mm agglomerates OC contribution, respectively; Q, R, S, and T are the CA of the droplets to the soil for 0 s, 1 s, 3 s, and 5 s, respectively, and U is the cumulative CO2-C emission.
Agronomy 13 02618 g007
Table 1. Process and characteristics of soil CO2-C release under different methods of straw addition. The experimental treatments were the control (CK); straw mixture (CT); straw mulching (CM); straw deep burying (CD); and straw doubled deep burying (CE). Lowercase letters indicate significant differences between treatments (p < 0.05).
TreatmentCO2 Emission PeakFirst Slow-Emission Platform Second Slow-Emission Platform
Peak Emission RateProcess Average Emission RateProcess Average Emission Rate
(Days)(mg kg−1 d−1)(Days)(mg kg−1 d−1)(Days)(mg kg−1 d−1)
CTTh 0.5338.7Th 0.5–1999.42 ± 6.19bTh 19–12317.19 ± 1.45c
CMTh 2171.6Th 2–2669.44 ± 2.49cTh 26–12319.09 ± 1.06bc
CDTh 2182.6Th 2–2673.59 ± 7.53cTh 26–12319.42 ± 0.84b
CETh 2260.4Th 2–33115.76 ± 3.96aTh 33–12326.81 ± 2.60a
Disclaimer/Publisher’s Note: The statements, opinions and data contained in all publications are solely those of the individual author(s) and contributor(s) and not of MDPI and/or the editor(s). MDPI and/or the editor(s) disclaim responsibility for any injury to people or property resulting from any ideas, methods, instructions or products referred to in the content.