Article

Spatial–Temporal Dynamics of Grassland Net Primary Productivity and Its Driving Mechanisms in Northern Shaanxi, China

1
College of Grassland Agriculture, Northwest A&F University, Xianyang 712100, China
2
College of Mechanical and Electronic Engineering, Northwest A&F University, Xianyang 712100, China
3
College of Water Resources and Architectural Engineering, Northwest A&F University, Xianyang 712100, China
*
Author to whom correspondence should be addressed.
These authors contributed equally to this work.
Agronomy 2023, 13(11), 2684; https://doi.org/10.3390/agronomy13112684
Submission received: 8 October 2023 / Revised: 21 October 2023 / Accepted: 24 October 2023 / Published: 25 October 2023

Abstract

:
Grasslands, a vital ecosystem and component of the global carbon cycle, play a significant role in evaluating ecosystem health and monitoring the global carbon balance. In this study, based on the Carnegie–Ames–Stanford Approach (CASA) model, we estimated the Net Primary Productivity (NPP) of grasslands in northern Shaanxi from 2000 to 2020. Employing trend analysis, stability analysis, multiple regression analysis, and residual analysis, the research examined the dynamic changes of grassland NPP and its response to climatic and human factors. Key findings include: (1) Grassland NPP showed a significant increasing trend during 2000–2020, with high-coverage grasslands showing a higher rate of increase than medium and low-coverage grasslands. (2) Most grasslands (>90%) exhibited unstable growth and high NPP fluctuation. (3) While temperature, precipitation, and radiation undulate, the trends were not significant. Rainfall and radiation emerged as dominant factors affecting NPP, with temperature suppressing NPP increase to some extent. (4) Policies like returning farmland to grassland had a positive impact on grassland recovery, vegetation productivity, and regional ecosystem health.

1. Introduction

Grassland, covering 40% of the global land [1,2], plays an essential role in mitigating global climate change [3,4,5], developing livestock husbandry [6,7], preserving hydrological functions [8], and increasing carbon and nitrogen sequestration [9,10,11]. Furthermore, grassland also exerts a significant role in carbon storage, accounting for approximately one-third of the terrestrial carbon with an estimated magnitude of 200–300 Pg C. During drought periods, grasslands potentially become a carbon source [12]. However, with the aggravation of climate extremes and human factors, 61.49% of the total grass has suffered degradation throughout 2001–2010 in northwest China [13,14]. In addition, land use transformation and the quantifying of spatiotemporal variations in different types of grasslands should receive strengthened supervision, which is of great significance in assessing the carbon cycling in grassland ecosystems [13,15,16,17].
Net Primary Production (NPP) of grasslands refers to the total accumulation of organic matter fixed by green plants through photosynthesis per unit of time and area, which accounts for more than 30% of the NPP in the global terrestrial biomes and is a crucial sensitive indicator directly reflecting the productivity of ecosystems [18,19,20,21]. NPP is not only the key element in the link of energy flow and biomass accumulation within ecosystems but also an essential constituent part of the global carbon cycle, which holds great significance for evaluating ecosystem health, monitoring global carbon balance, and is used commonly as an essential indicator to assess and reflect the sustainability of grassland ecosystems and their source/sink functions. With the development of 3S technology, remote sensing products coupled with statistical models were widely adopted to estimate the NPP of terrestrial ecosystems [22,23,24].
To date, numerous remote sensing-based models have been developed to estimate NPP. Scholars, such as Wang et. al. [25], used the Zhou Guangsheng model to replicate climate-induced potential NPP (PNPP), from which they obtained the anthropogenic-induced NPP (HNPP) by subtracting the actual NPP (ANPP). They also assessed human activities’ impact on grasslands. This methodology was adopted by Feng et al. [26] and Tian et al. [27]. The Carnegie–Ames–Stanford Approach (CASA) model, derived from absorbed photosynthetically active radiation (APAR) and light energy efficiency, has been commonly used to calculate NPP regionally and globally [28,29,30]. As a result, changes in vegetation NPP dynamics in China and other regions have been unveiled. Yet, northern Shaanxi, a key area for the “Grain for Green Project”, still lacks comprehensive studies on grassland NPP dynamics and influencing factors. Since 2000, northern Shaanxi has seen significant development opportunities with the implementation of national strategies such as the “Western China Development” plan and the “Belt and Road Initiative”. However, large-scale “mountaintop removal” and “gas oil” projects have left areas like Yan’an and Yulin in an unsustainable state [31,32]. This study categorizes the grasslands in northern Shaanxi into three coverages according to Land Use and Cover Change (LUCC). This provides an understanding of the distribution and dynamic patterns of grassland types in this particularly fragile region. It also serves as a reference for the restoration of similar arid and semi-arid grasslands located in energy-rich but ecologically vulnerable environments, thereby promoting the actual construction of such restoration initiatives. A more comprehensive analysis of the influential factors on NPP would indeed enhance the persuasiveness of this study.
Therefore, the trend analysis methods (including the Theil–Sen median trend analysis and Mann–Kendall test): stability analysis, partial correlation analysis, multiple regression analysis, and residual analysis, were used to investigate the spatiotemporal distribution of grassland NPP of northern Shaanxi in 2000–2010, and explore relationships between NPP and the driving factors at multiple time scales by using Pearson correlation analysis and Multivariate regression analysis (MLR). The main objectives are as follows: (1) to investigate the spatiotemporal features of NPP dynamics during 2000–2020; (2) to reveal the nonlinear trend of NPP and determine the dominantly responsible timescale for vegetation NPP dynamics; (3) to examine the spatial heterogeneity of the relationships between NPP and climate factors, as well as to quantify the relative contributions of human intervention and climate variations on NPP over different timescales. In future regional ecosystem management decisions, the differences in climate background should be given top priority, and the Interco ordination between local ecosystem resource demands and ecosystem restoration must be taken seriously to maximize the benefits of ecosystem restoration plans. This is particularly pertinent for the energy-abundant yet fragile eco-environment of the northern Shaanxi.

2. Materials and Methods

2.1. Study Area

The northern Shaanxi, located at the center of the Loess Plateau and the northern perimeter of Shaanxi Province (107.3°~111.4° E, 35.4°~39.6° N), comprises 22 counties, 3 municipal districts, and 9689 administrative villages. This region spans the entire jurisdictions of Yan’an and Yulin cities, covering approximately 79,957.2 km2. It is bordered by Inner Mongolia, Ningxia, and Gansu provinces to the north and west, while the Weibei Plateau, Weinan, Tongchuan, and Xianyang lie to the south within the province. The Yellow River separates it from Shanxi Province to the east. As of 2020, the resident population exceeded 5.91 million, representing 15.82% of the total population of Shaanxi Province. The terrain displays a gradual slope from the northwest to the southeast, within an elevation range of 508 to 1911 m above sea level. The region predominantly falls within arid and semi-arid zones, characterized by a temperate, arid continental monsoon climate. This climate results in high temperatures and rainfall during the summer and autumn, with average annual precipitation and temperatures ranging from 318.78 to 612.77 mm and 7.20 to 12.86 °C, respectively. The local grassland is divided into three types according to the Land Use and Cover Change (LUCC) classification system: high-coverage grassland (2533 km2), medium-coverage grassland (20,352 km2) and low-coverage grassland (11,915 km2) (Figure 1e).

2.2. Data Source and Preprocessing

2.2.1. NDVI Data

The study utilized the normalized difference vegetation index (NDVI) data from the Earth Observing System (EOS)/Moderate Resolution Imaging Spectroradiometer (MODIS) dataset available on the National Aeronautics and Space Administration (NASA) official website (https://lpdaac.usgs.gov/data/ (accessed on 20 March 2023)). The data were then processed, including splicing, filling missing data, interpolation, unit conversion of meteorological data, mean calculation, and other preprocessing steps, to estimate the ecosystem NPP with high precision and reliability.

2.2.2. Meteorological Data

The meteorological data originated from the “China Meteorological Science Data Sharing Service Network” platform (http://www.cmatc.cn/, accessed on 20 March 2023), which provides monthly average temperature, precipitation, and total radiation data from 722 standard meteorological stations in China for the period 2000–2020. The 30 m resolution Digital Elevation Model (DEM) data were obtained from the Geographic Spatial Data Cloud of the Computer Network Information Center of the Chinese Academy of Sciences (http://www.gscloud.cn, accessed on 20 March 2023). Before analyzing and simulating meteorological data, adjustments were made using ANUSPLIN 4.1 software to account for spatial and temporal differences in the data. This ensured alignment with the NPP data and the validity of the analysis and calculations.

2.2.3. Grassland Type Data

The grassland type data were sourced from the MCD12Q1 data product on the NASA official website, combined with the “Chinese Grassland Type Classification System 2012” [33] established jointly by the Cold and Arid Regions Environmental and Engineering Research Institute of the Chinese Academy of Sciences and Inner Mongolia University. The data were reclassified using ArcGIS to obtain usable grassland-type data. The data were obtained from the Resource Environment Science and Data Center of the Chinese Academy of Sciences (http://www.resdc.cn/DOI, accessed on 20 March 2023), 2023. DOI:10.12078/2023010301), and 2015 land use data were selected. The data were cropped according to the boundary of the northern Shaanxi to obtain grassland-type data with a resolution of 30 m. The classification system includes six primary categories and 25 secondary categories of land use, and grassland types are divided into low, medium, and high coverage levels based on coverage of 5%, 20%, and 50%, respectively.

2.2.4. Human Activity Data

Data on human activities, including the output value of agriculture, forestry, animal husbandry, and fishery (AFAHF), area of food crops (AFC), livestock stocking (the number of head of large livestock at the end of the year), gross domestic product (GDP), and per capita gross domestic product (PCGDP), were obtained from the Shaanxi Provincial Statistical Yearbook (http://tjj.shaanxi.gov.cn/tjsj/ndsj/tjnj/, accessed on 20 March 2023).

2.2.5. Land Use Data

Land use data were sourced from the Chinese Academy of Sciences Resource and Environmental Science Data Center (http://www.resdc.cn/, accessed on 20 March 2023) with a spatial resolution of 1 km. The data were classified into six categories: grassland, cropland, forest, water, construction land, and bare land.

2.3. Simulation of NPP

In this study, we employed the Carnegie–Ames–Stanford Approach (CASA) model to calculate the quantity of each type of grassland and the total Net Primary Productivity (NPP) in northern Shaanxi [34,35,36,37]. The calculation formulas are as follows:
  N P P x , t = A P A R x , t × ε x , t
A P A R denotes the absorbable photosynthetically active radiation, while ε represents the utilization efficiency of photosynthetically active radiation. This indicates that for period t , the image element x is the actual amount of radiation absorbed by the vegetation. Therefore, the vegetation NPP is related to the effective radiation and the radiation that can be absorbed by the vegetation, taking into account environmental factors such as soil moisture, temperature, CO2 concentration, and vegetation type. Consequently, A P A R and ε need to be considered separately, and the calculation formula is as follows:
  A P A R x , t = S O L x , t × F P A R x , t × 0.5
In this equation, S O L x , t , the monthly image element x signifies the total monthly solar radiation at the location (MJ/m2). F P A R x , t represents the proportion of photosynthetically active radiation absorbed by the vegetation canopy at the monthly image element x . The constant 0.5 indicates the plant projected area ratio, also referred to as the leaf area index (LAI), which signifies the proportion of total solar radiation utilized by the vegetation. Taking into account habitat conditions, maximum net photosynthetic rate, key physiological indicators, and spatial consistency, the maximum light energy utilization on the rate of grassland types was determined to be 0.542, as established by Zhu Wenquan [38].
The formula for light energy utilization efficiency is:
ε x , t = T ε 1 x , t × T ε 2 x , t × W ε x , t × ε m a x
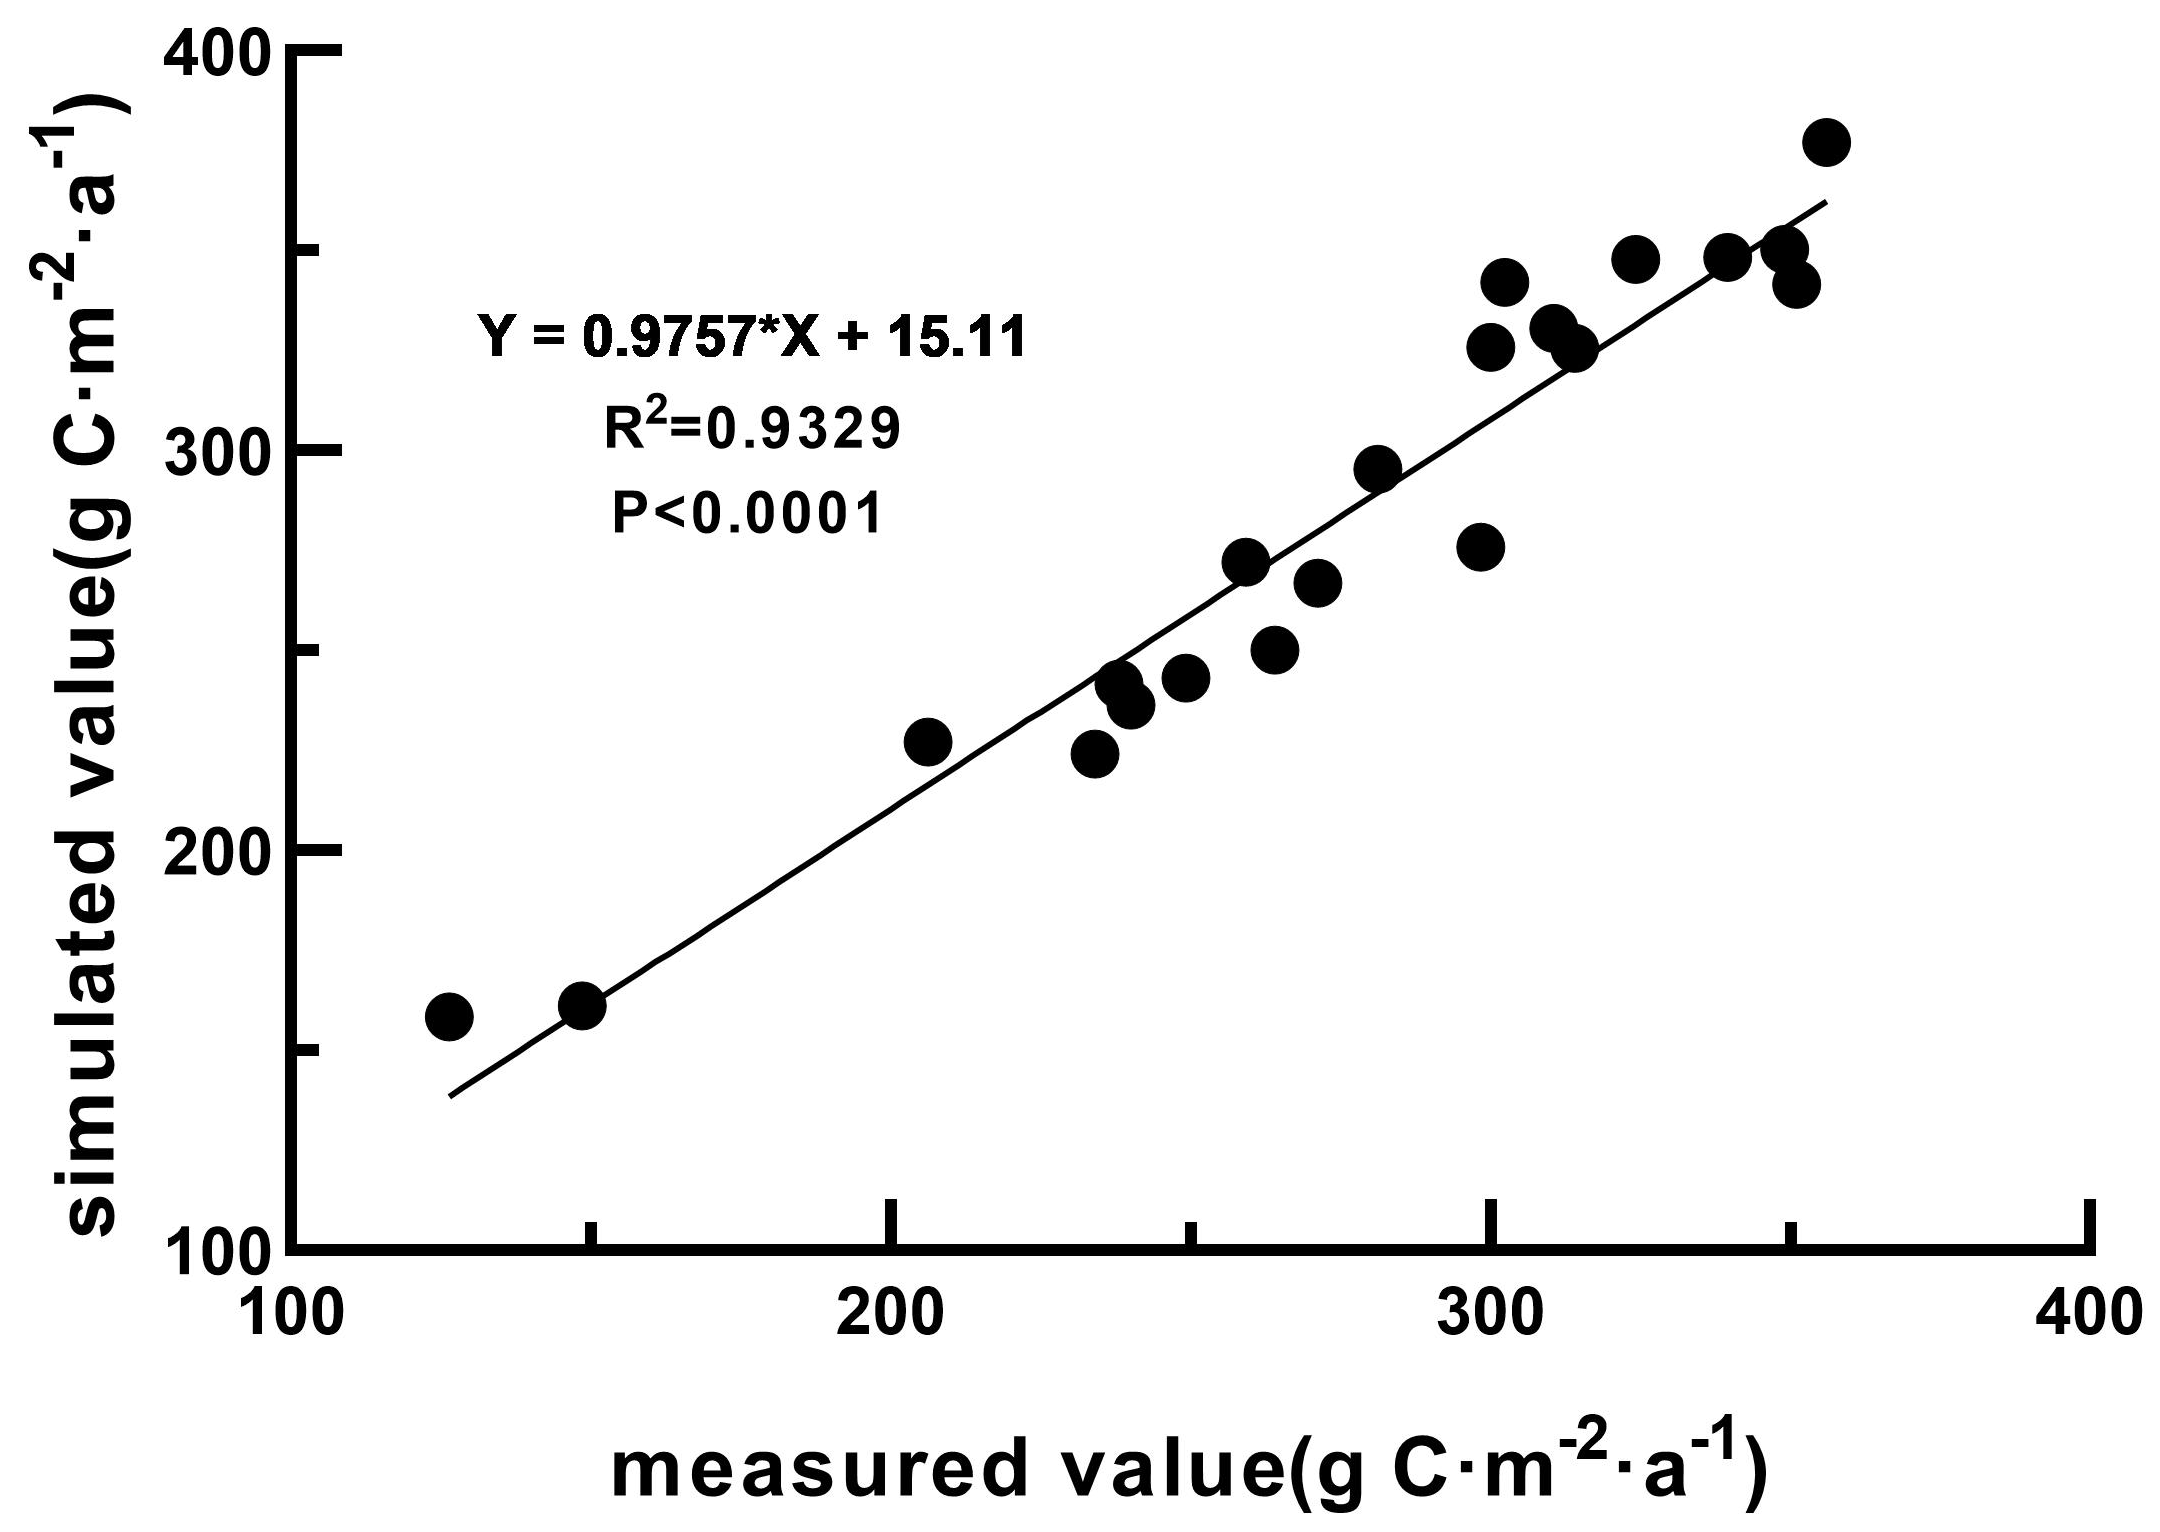
In this equation, T ε 1 x , t , T ε 2 x , t and W ε x , t denote the effects of maximum and minimum temperature and moisture conditions on light energy utilization, respectively, calculated concerning the previous studies [36,37]. Additionally, ε m a x , the maximum light energy utilization rate of vegetation under ideal conditions was expressed [36]. The comparative analysis between measured values and those simulated by the CASA model revealed a significant correlation (R2 = 0.93, p < 0.0001). This indicates that the CASA model is aptly suited for calculating the NPP values of grasslands in the study area.

2.4. Validation of the CASA Model

To further validate the CASA model’s accuracy, it is necessary to convert the biomass Net Primary Productivity (NPP) by integrating the study area with the study’s temporal dimension. The results are shown in Figure 2. The research team conducted field samplings in the grasslands of northern Shaanxi Province during the growing seasons of July and August 2020. Sample plots were selected, and within these, 1 m × 1 m sub-plots exhibiting uniform grass growth and flat topography were randomly chosen. Five replicates were established, resulting in a total of several sample plots.
Following the harvest, the plots were oven-dried at a steady temperature of 70 °C until a constant weight was achieved, which was then recorded as the dry weight. The measured NPP values were typically calculated using the carbon conversion rate of 0.475 [12,39].

2.4.1. Trend Analysis

The spatial and temporal trends of grass NPP and other meteorological factors in northern Shaanxi were quantitatively analyzed using the Sen+MK test from 2000 to 2020. Initially, the trend of the data sample time series was tested using the Theil–Sen slope estimation method to determine its significance [40]. This was conducted to analyze the 21-year trend of grassland NPP and to ascertain whether there was a discernible upward or downward trend. The specific calculation formula is as follows [41]:
β = M e d i a n N P P j N P P i j i , 1 i < j 21
β represents the slope of the median of the sample data. When β > 0 , it signifies an increasing trend in the dataset over time; if β < 0 , it indicates a decreasing trend. The Mann–Kendall (MK) test is a widely used nonparametric method that calculates the MK statistic based on sign differences [42,43]. The specific formula is as follows:
Z = S 1 V a r ( S ) , S > 0       0             , S = 0     S + 1 V a r ( S ) , S < 0
Among them.
S = i = 1 n 1 j = i + 1 n s i g n ( N P P j N P P i )
V a r S = n ( n 1 ) ( 2 n + 5 ) 18
s i g n N P P j N P P i =     1 ,   N P P j N P P i > 0     0 ,   N P P j N P P i = 0 1 , N P P j N P P i < 0
The value of the| Z | was standardized at a confidence level of α = 0.05. When | Z | ≥ 1.96 and | Z | ≥ 2.58, the hypothesis of a non-existent linear trend is refuted. Consequently, five alteration levels were established: extremely significant increase, significant increase, insignificant, significant decrease, and extremely significant decrease.

2.4.2. Stability Analysis

The Coefficient of Variation (Cv) serves as a robustness indicator, capable of reflecting the dispersion of data within a dataset. Typically, Cv is the ratio of the standard deviation of the indicator to its mean. A smaller Cv value signifies lesser variability within the dataset, thereby indicating superior data stability [44]. In this study, Cv is used to calculate the degree of variability of NPP under different time series, and the formula is specified as follows:
C V = i = 1 n N P P i N P P ¯ n 1 N P P ¯
The C V   value is smaller, indicating that the fluctuation of NPP with time is minimal and stable. Conversely, a larger C V value suggests a high degree of data fluctuation and low stability.

2.4.3. Correlation Analysis

To control the linear influence of temperature, precipitation, and radiation, and to analyze the linear correlation between NPP and one of the meteorological factors, this study employs partial correlation analysis [45,46]. The specific calculation formula is as follows:
R x y = n × i = 1 n x i × y i i = 1 n x i i = 1 n y i n × i = 1 n x i 2 ( i = 1 n x i ) 2 n × i = 1 n y i 2 ( i = 1 n y i ) 2
In this equation: R x y denotes the correlation coefficient between the target variables; n denotes the 21-year study period; x i is the NPP in the i t h year of the study period; y i is the value of the variable in year   i .
The bilateral t-test was used to perform significance testing on the calculated correlation coefficients [47]. The specific formula is as follows:
t = R · n 2 1 R 2
Based on the t-value, significance is divided into six levels: extremely significant positive correlation ( R > 0, p < 0.01), significant positive correlation ( R > 0, 0.01 < p < 0.05), insignificant positive correlation ( R > 0, p > 0.05), extremely significant negative correlation ( R < 0, p < 0.01), significant negative correlation ( R < 0, 0.01 < p < 0.05) and insignificant negative correlation ( R < 0, p > 0.05).

2.4.4. Multiple Regression Analysis of NPP

Under the assumptions of linearity and independence, sample data were collected, and regression coefficients were calculated to predict the dependent variable values. This approach is typically used to describe the linear relationship between dependent variables and multiple independent variables and to predict the dependent variable values using estimated regression coefficients. The formula is as follows:
Y = a 1 X 1 + a 2 X 2 + + a n X n
In this equation, Y is the estimated value of the dependent variable, X 1 ,   X 2 , … X n are the values of the respective variables, and a i represents the standard partial regression coefficient of the independent variable [48].
The independent variables are temperature, precipitation, and radiation meteorological factors μ i can be calculated by using the following formula:
μ i = a i i = 1 n a i

2.4.5. Residual Analysis

Residual analysis has been used to examine the influence of human activities on NPP dynamics. Residual value refers to the difference between observed and predicted values. By eliminating the portion of NPP changes influenced by meteorological factors, the portion influenced by anthropogenic factors was determined. The calculation formula is as follows:
y = a X 1 + b X 2 + c X 3
N P P r e s i d u a l = N P P o b s e r v e d N P P p r e d i c t e d
In this equation, N P P p r e d i c t e d is the predicted value of NPP under the influence of climate factors calculated by the multiple linear regression model, X 1   , X 2 and X 3 represent the independent variables of precipitation, temperature, and total radiation, respectively; a , b and c are slopes; and N P P o b s e r v e d is the observed value of NPP. If N P P r e s i d u a l > 0, the primary influence factor of NPP dynamics is climatic changes; if N P P r e s i d u a l < 0, the major influence factor of NPP variation is human activities.

3. Results

3.1. Spatiotemporal Variation of NPP in the Northern Shaanxi

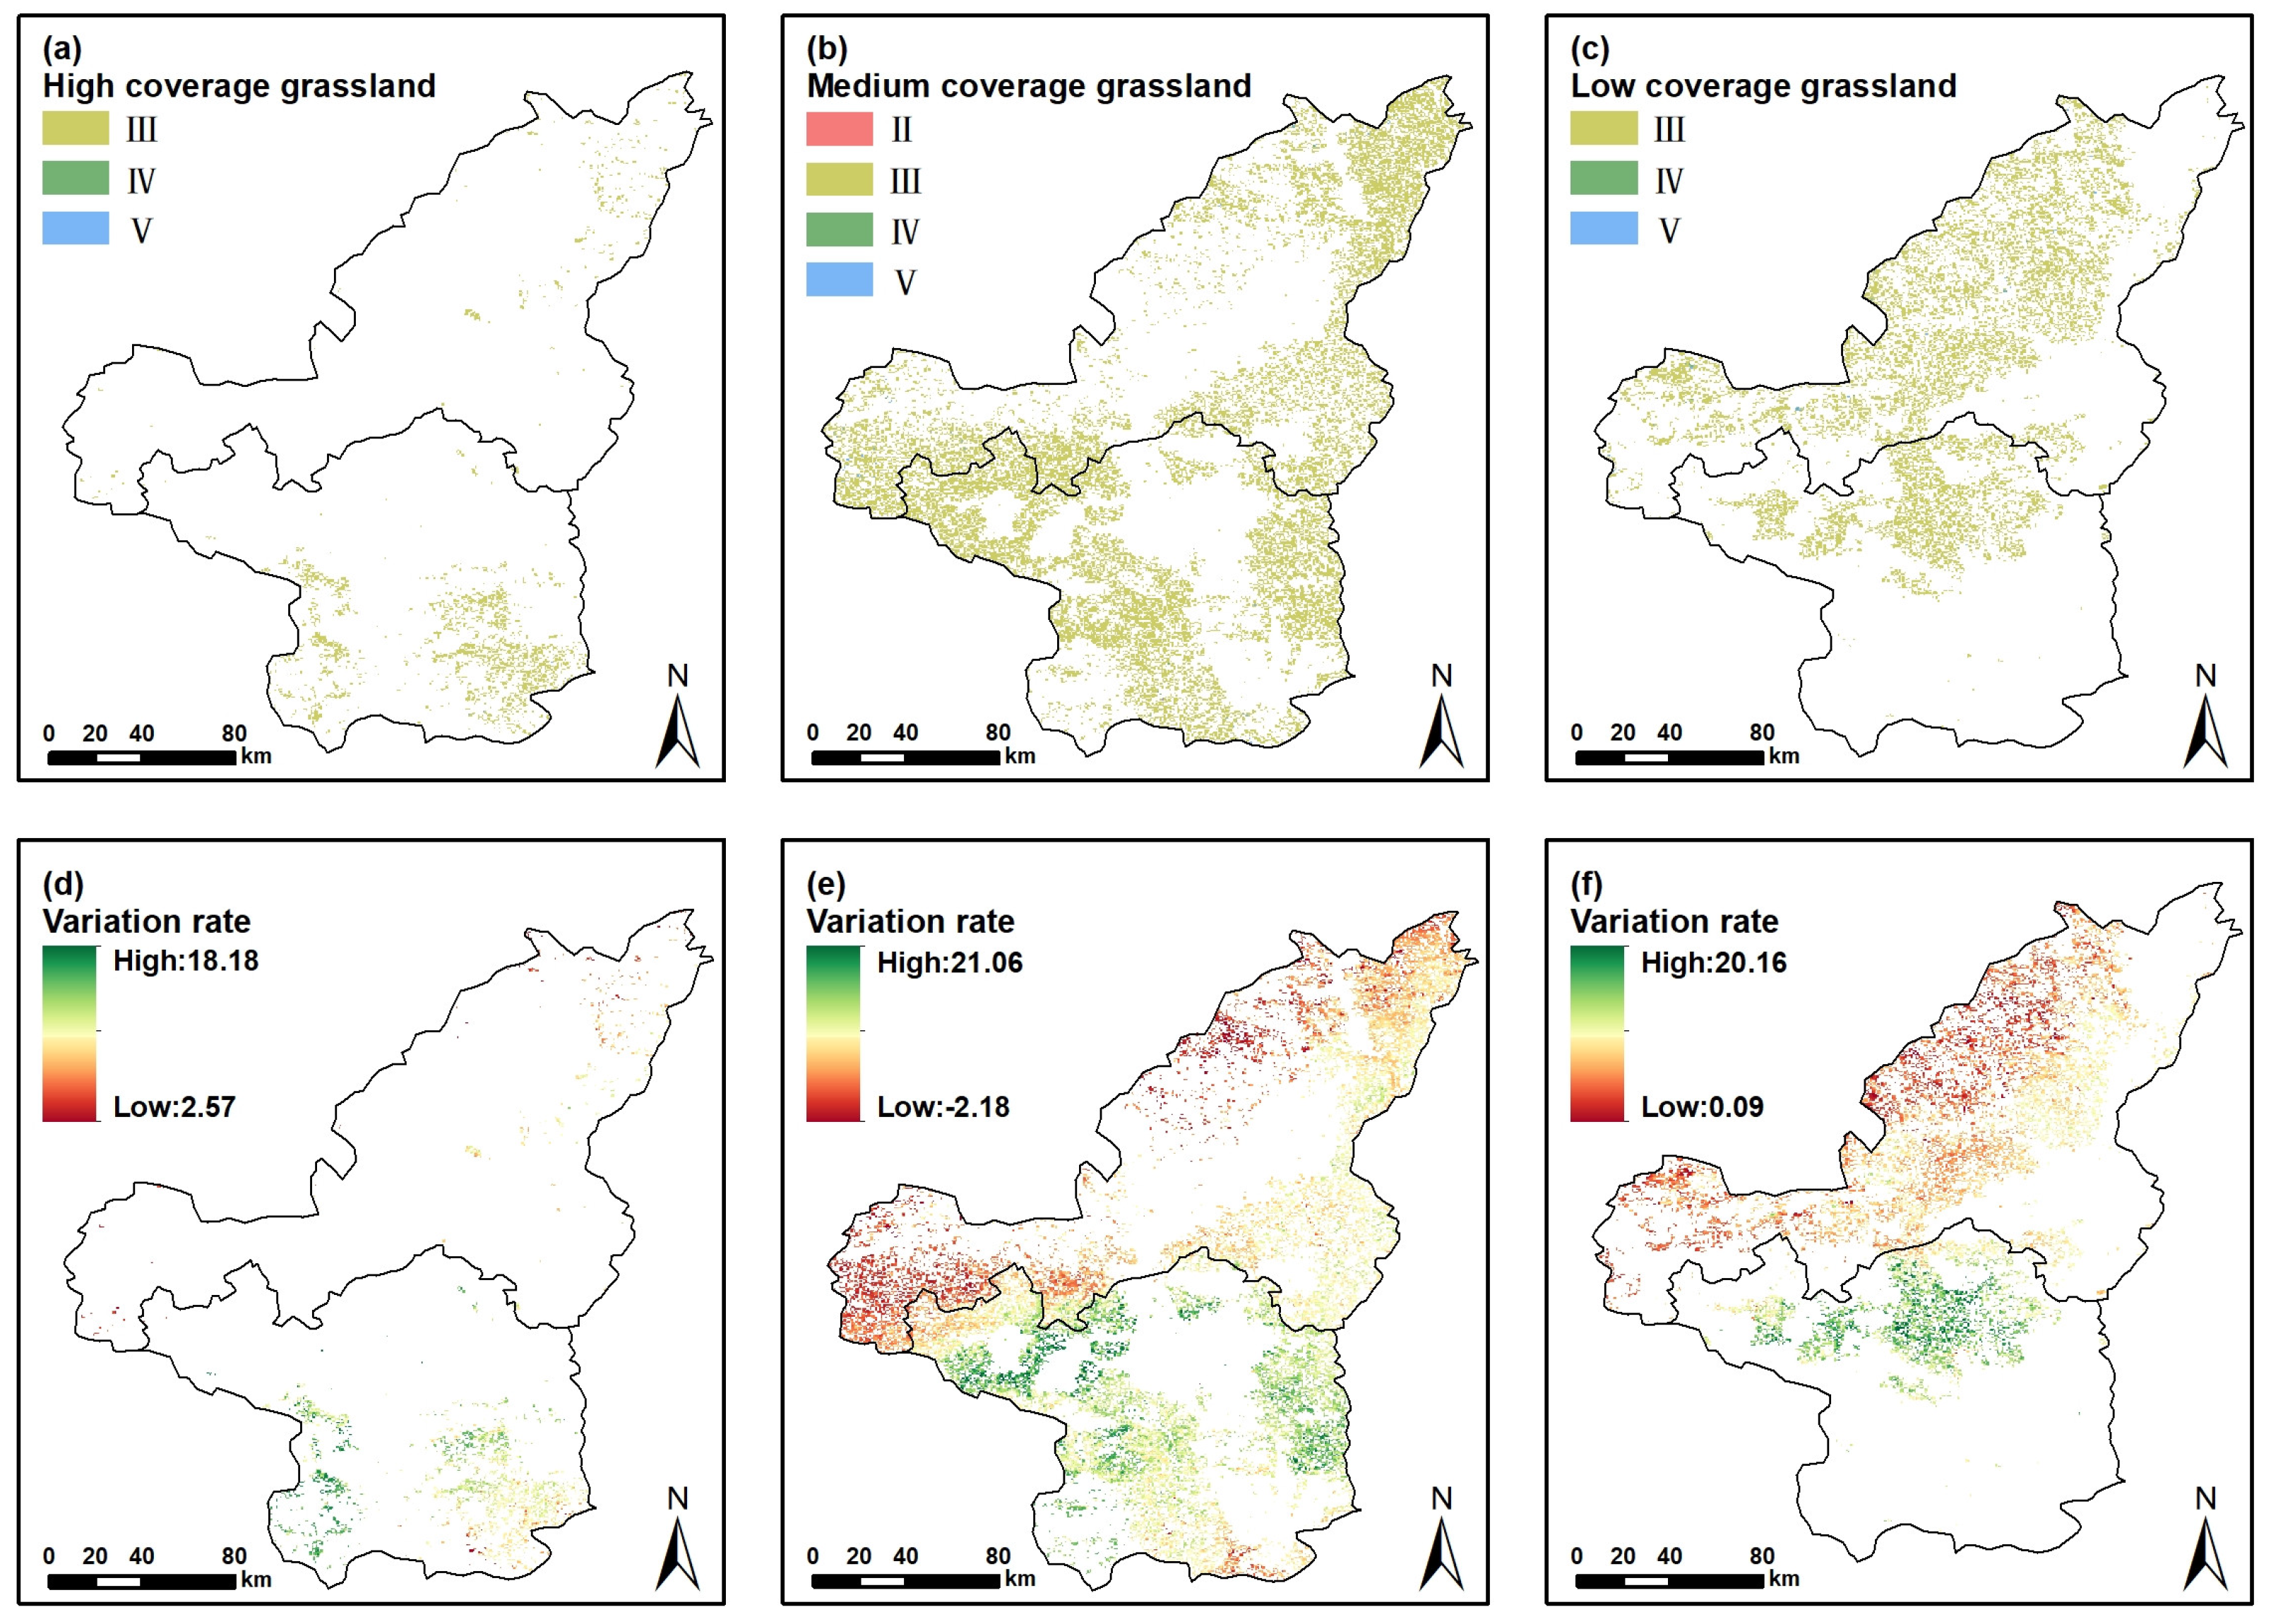
According to Figure 3, the Net Primary Productivity (NPP) for three types of grasslands in northern Shaanxi showed a remarkable upward trend from 2000 to 2020 (p < 0.01). The high-coverage grassland had a yearly average NPP value of 425.04 g C·m−2, which was significantly higher than the yearly average NPP values of 286.31 g C·m−2 and 225.22 g C·m−2 in medium and low coverage grasslands, respectively (p < 0.01). However, the values were still lower than China’s average annual net primary productivity of 325.11 g C·m−2·a−l from 2000 to 2020 [49]. The peak NPP values for all three grassland types were recorded in 2018, with the figures being 540.34 g C·m−2 for high coverage, 383.06 g C·m−2 for medium coverage, and 308.6 g C·m−2 for low coverage grasslands. However, a descending NPP appeared in the subsequent two years. The lowest NPP values in medium and low-coverage grasslands were recorded in 2000, with values of 161.25 g C·m−2 and 122.39 g C·m−2, respectively. The lowest NPP value for high-coverage grasslands was recorded in 2001, with a value of 235.96 g C·m−2, which is 31.8 g C·m−2 less than that in 2000. The increase rate of NPP in high-coverage grassland was 11.04 g C·m−2·a−l, which was significantly higher than the increase rates in medium and low-coverage grasslands, with differences of 1.43 g C·m−2·a−l and 2.32 g C·m−2·a−l, respectively. The data provided in Table 1 show that over 99% of the area of each type of grassland NPP experienced an increasing trend, although they were insignificant (p > 0.01). Among them, low-coverage grasslands had a slightly higher percentage (0.47%) of the area, showing a significant increase in NPP.
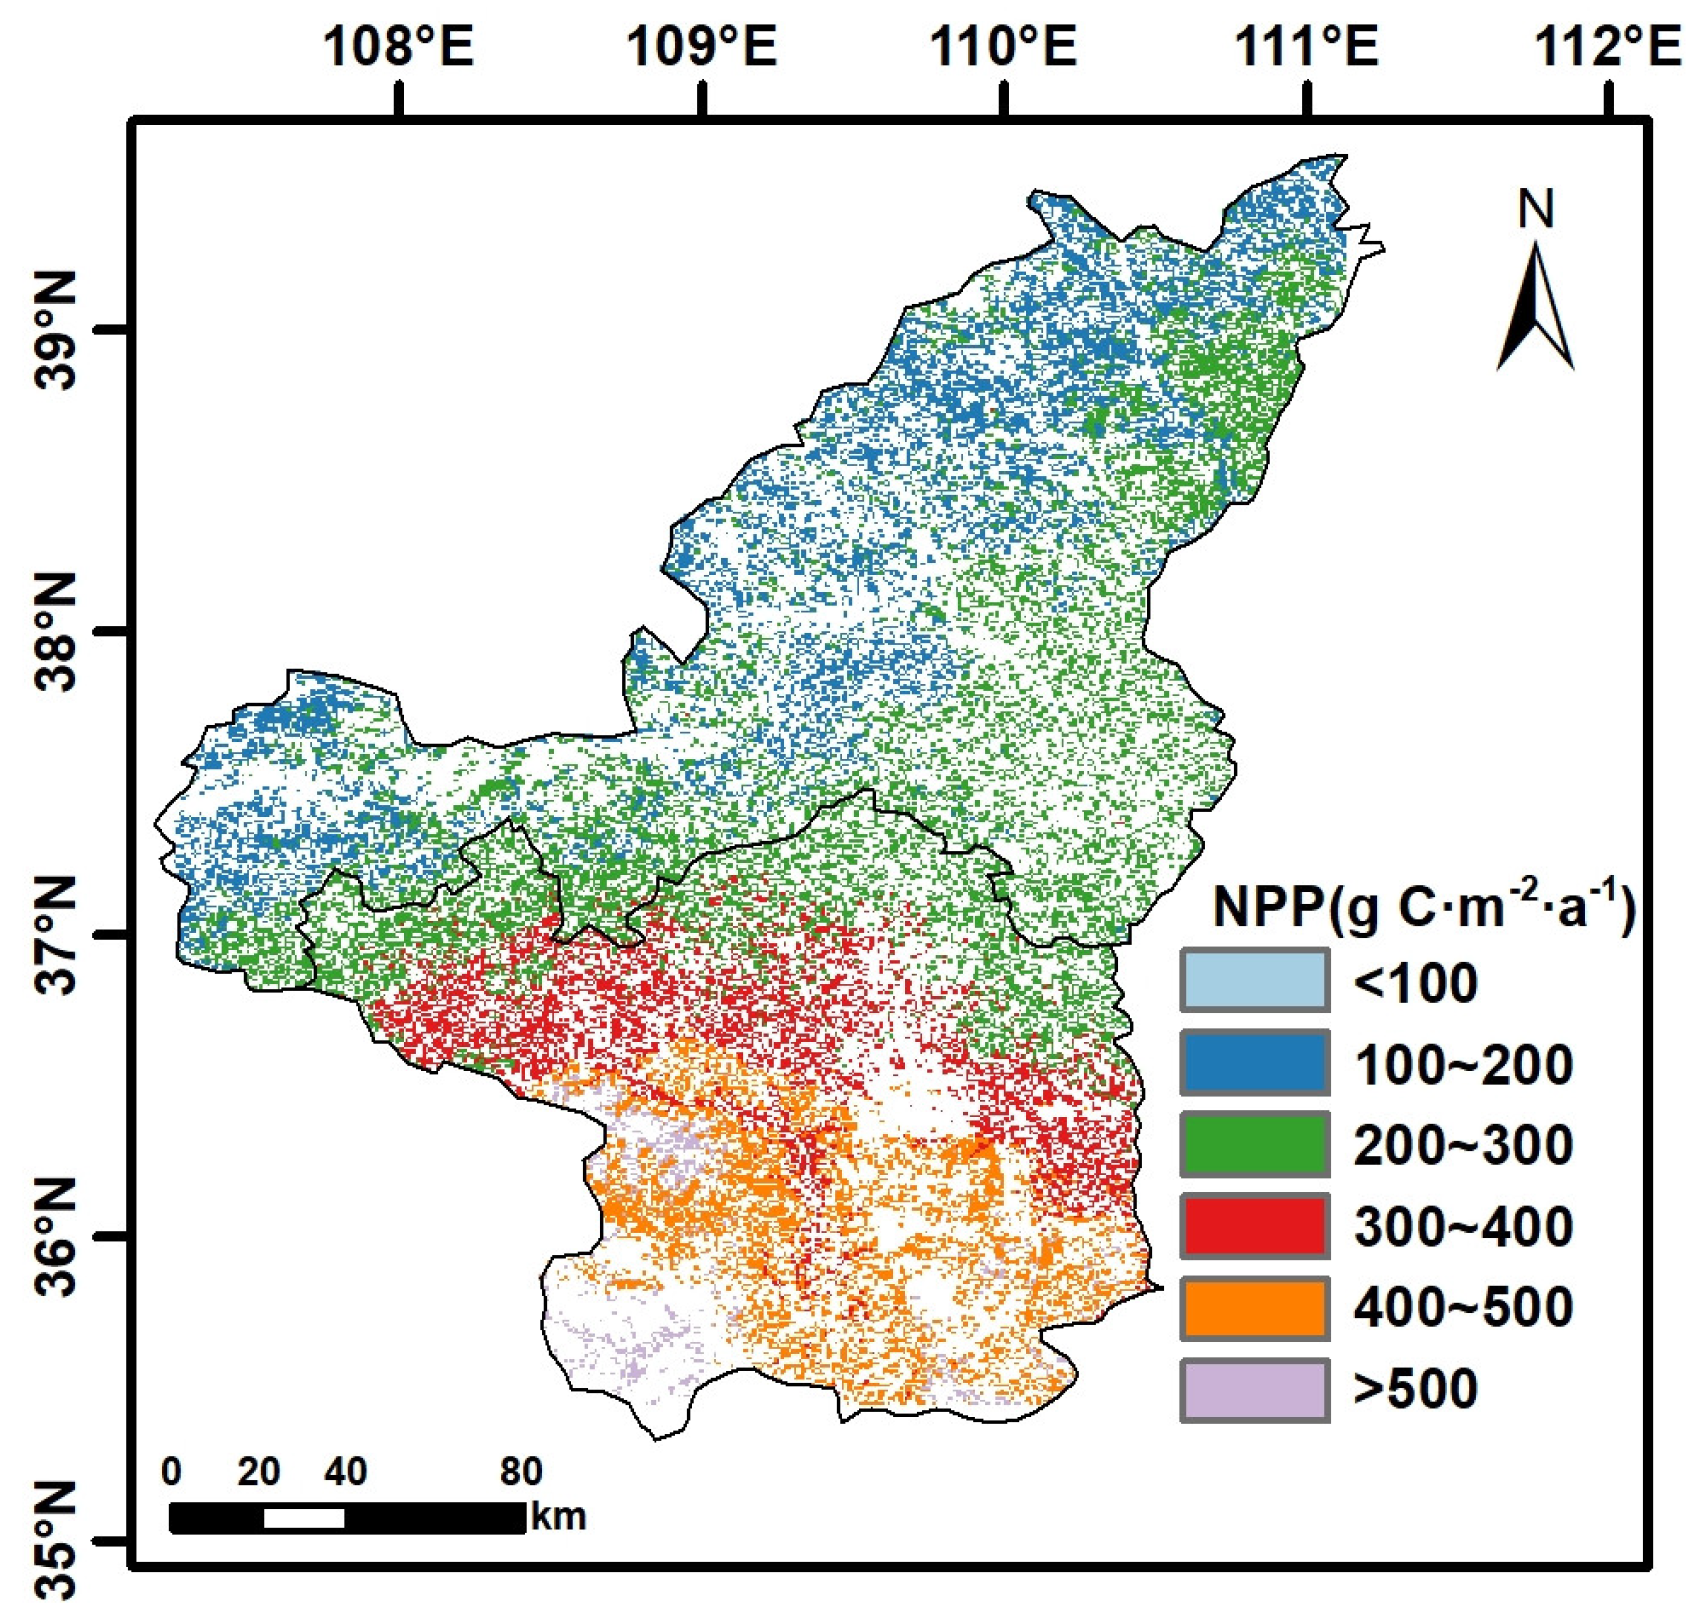
The NPP in the grasslands of northern Shaanxi is highly heterogeneous, influenced by factors such as meteorological conditions, human activities, and grassland classification. The results are shown in Figure 4, in a general pattern of higher NPP in the south and lower in the north. In Yulin, NPP decreased from the southeast to the northwest, while in the more southern Yan’an, the trend shifted from southwest to northeast. Around 67.45% of the grassland NPP in northern Shaanxi falls within the range of 100–300 g C·m−2·a−l, with a multi-year average of 275.12 g C·m−2·a−l. These grasslands are primarily located in northern Yulin and Yan’an. Grasslands with NPP of more than 300 g C·m−2·a−l are mainly found in Yan’an, with those exceeding 500 g C·m−2·a−l largely concentrated in the southwest end of Yan’an. Over half of the grassland NPP fell within the range of 100–200 g C·m−2·a−l above latitude 37° north, which is dominated by low-coverage grasslands (Figure 1e). These are mainly located on the northwestern side of Shaanxi, bordering Inner Mongolia and Ningxia. Nonetheless, the grasslands located predominantly under latitude 37° north with a range of 300~400 g C·m−2·a−l and 400~500 g C·m−2·a−l are mainly covered by the high coverage type. These areas cover about 0.54 km2 and 0.52 km2, respectively. The closer they are to the southwest, the more rainfall they received, leading to higher NPP.
Figure 5 illustrates the spatial dynamics of northern Shaanxi grassland NPP from 2000 to 2020, as determined by the 95% significant MK test result. Six levels of significant test results have been classified, and the area of NPP variation tendency for the three grassland types has been summarized in Table 1. According to Figure 3, the NPP of all three grassland types (>99.5%) presented an increasing trend, although the trends are not significant. Only a tiny fraction (0.007%) of the total medium-coverage grassland NPP (Figure 5b) showed a non-significant decline.

3.2. Stability of NPP in Three Types of Grasslands

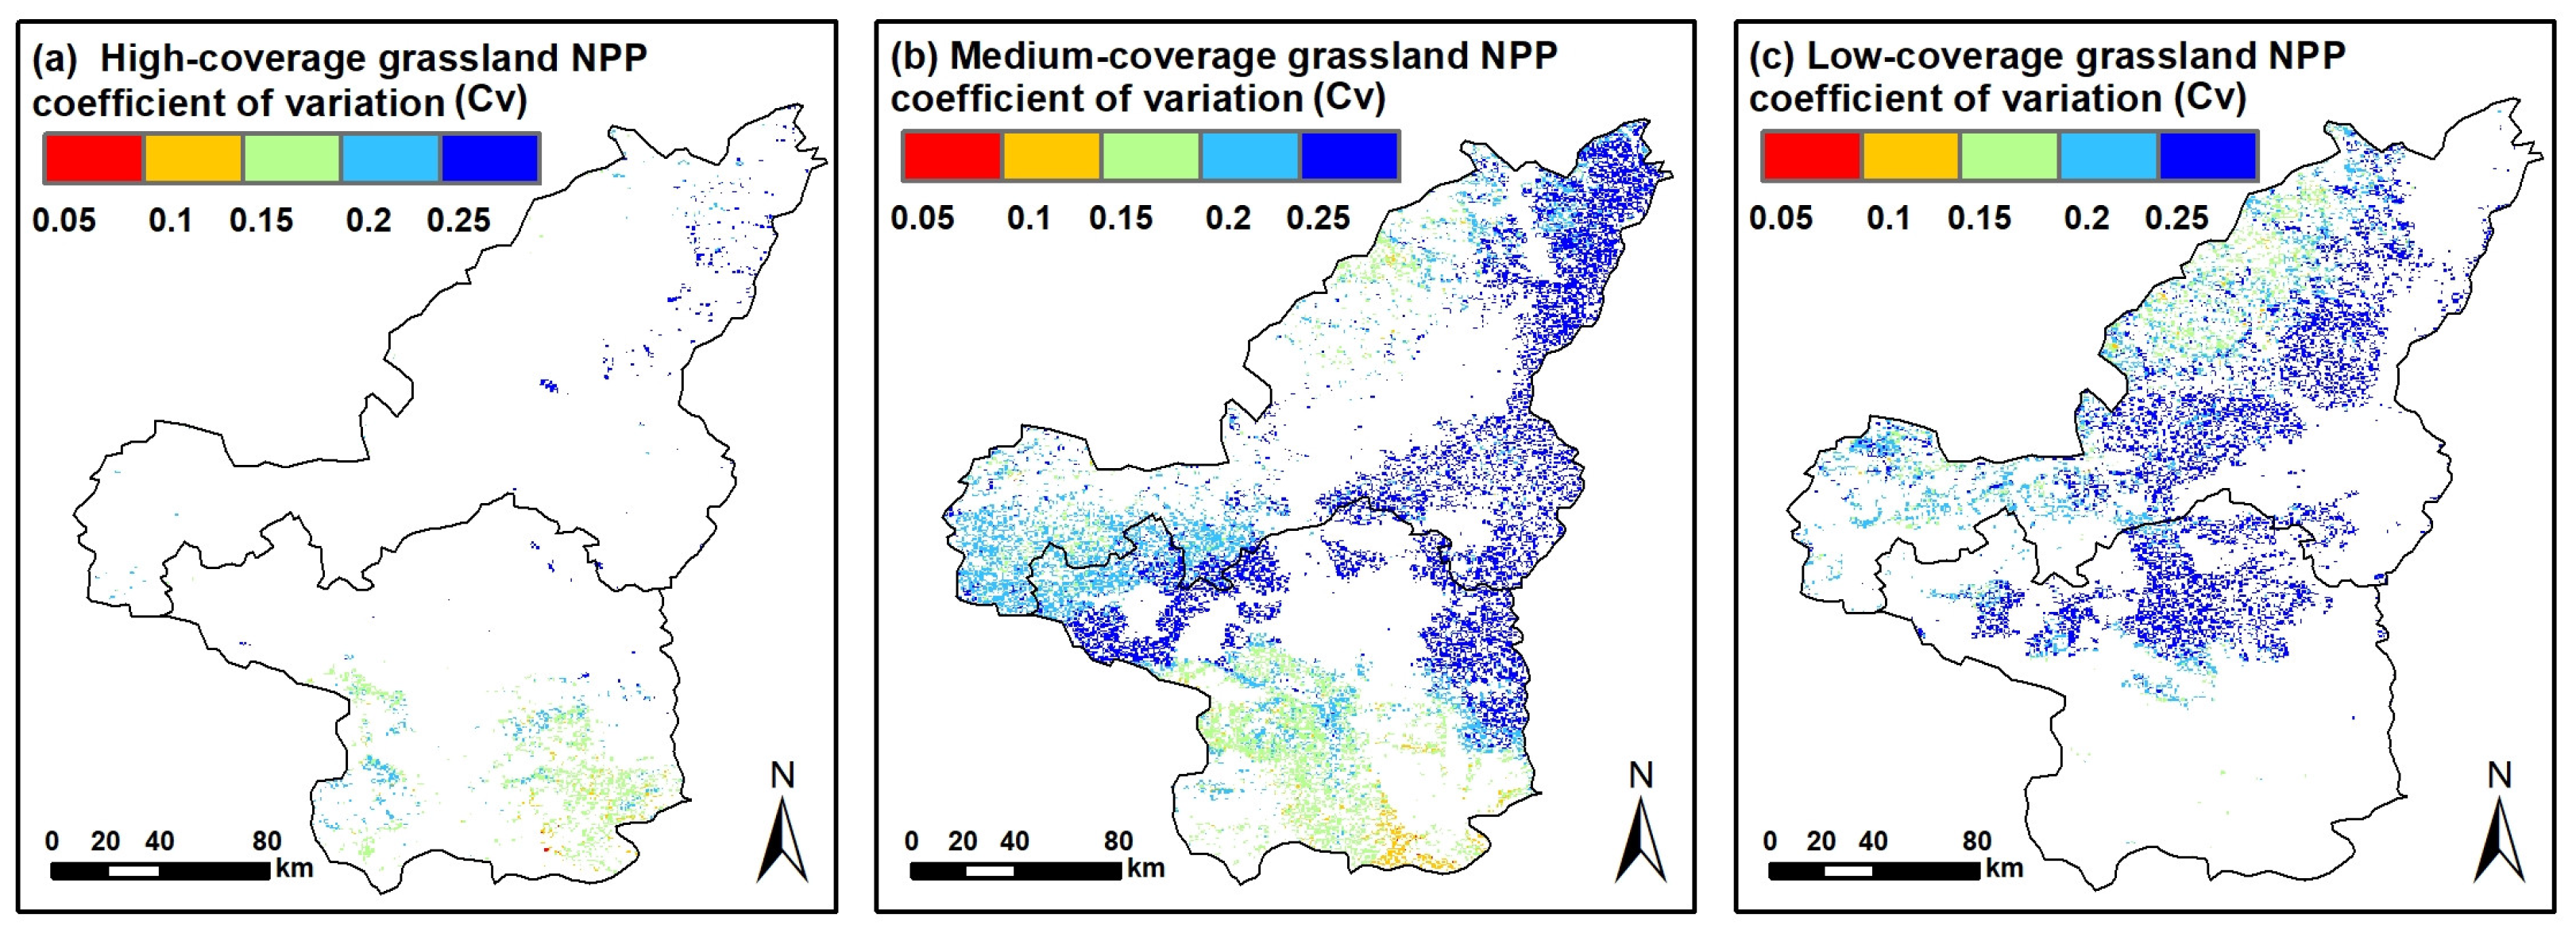
The fluctuation characteristics of the variation coefficient in NPP in northern Shaanxi grasslands from 2000 to 2020 were divided into five fluctuation levels, as depicted in Figure 6. The proportion of statistical results in each grassland type has been collated in Table 2. More than 90% of the total area fell into the categories of unstable (0.15 < Cv < 0.2) and very unstable (Cv > 0.2) due to fluctuations in meteorological factors. High-coverage grasslands exhibited moderate and low instability more than the other two types, accounting for 5.48% of the total. These were scattered in Yichuan and Huanglong. In contrast, the proportion of very unstable status in high-coverage grasslands is the least at 36.28%, all located in the north of Yulin. In low-coverage grasslands, the very unstable status (Cv > 0.2) constituted the majority, approximately 87.37%, predominantly located in northwestern Yulin and northern Yan’an.

3.3. Impact of Climate Change and Anthropogenic Influence on Grassland NPP

Temperature, precipitation, and radiation displayed significant spatial heterogeneity in northern Shaanxi from 2000 to 2020. The patterns of temperature and rainfall generally decreased from southeast to northwest, as shown in Figure 7a,b. The highest average temperature over the years in the grassland was 12.77 °C, and the lowest was 7.19 °C. Over 70% of the region’s annual average temperature is concentrated in the range of 8–10 °C, which is located at a higher altitude on the western side of northern Shaanxi. Meanwhile, the temperature in most of the central region is between 8.7 and 9.9 °C, accounting for 38.92% of the total. The annual average rainfall displayed an increasing trend from northwest to southeast, ranging from 319.72 mm to 600.27 mm, as shown in Figure 7b. The annual average total radiation increases from the periphery to the center, ranging from 457.09 MJ·m−2 to 484.24 MJ·m−2, with an annual average of 473.12 MJ·m−2, as depicted in Figure 7c. The total radiation between 468 and 478 MJ·m−2, which accounted for more than 80% of the area, is mainly concentrated in the central part of northern Shaanxi, as shown in Figure 7f.
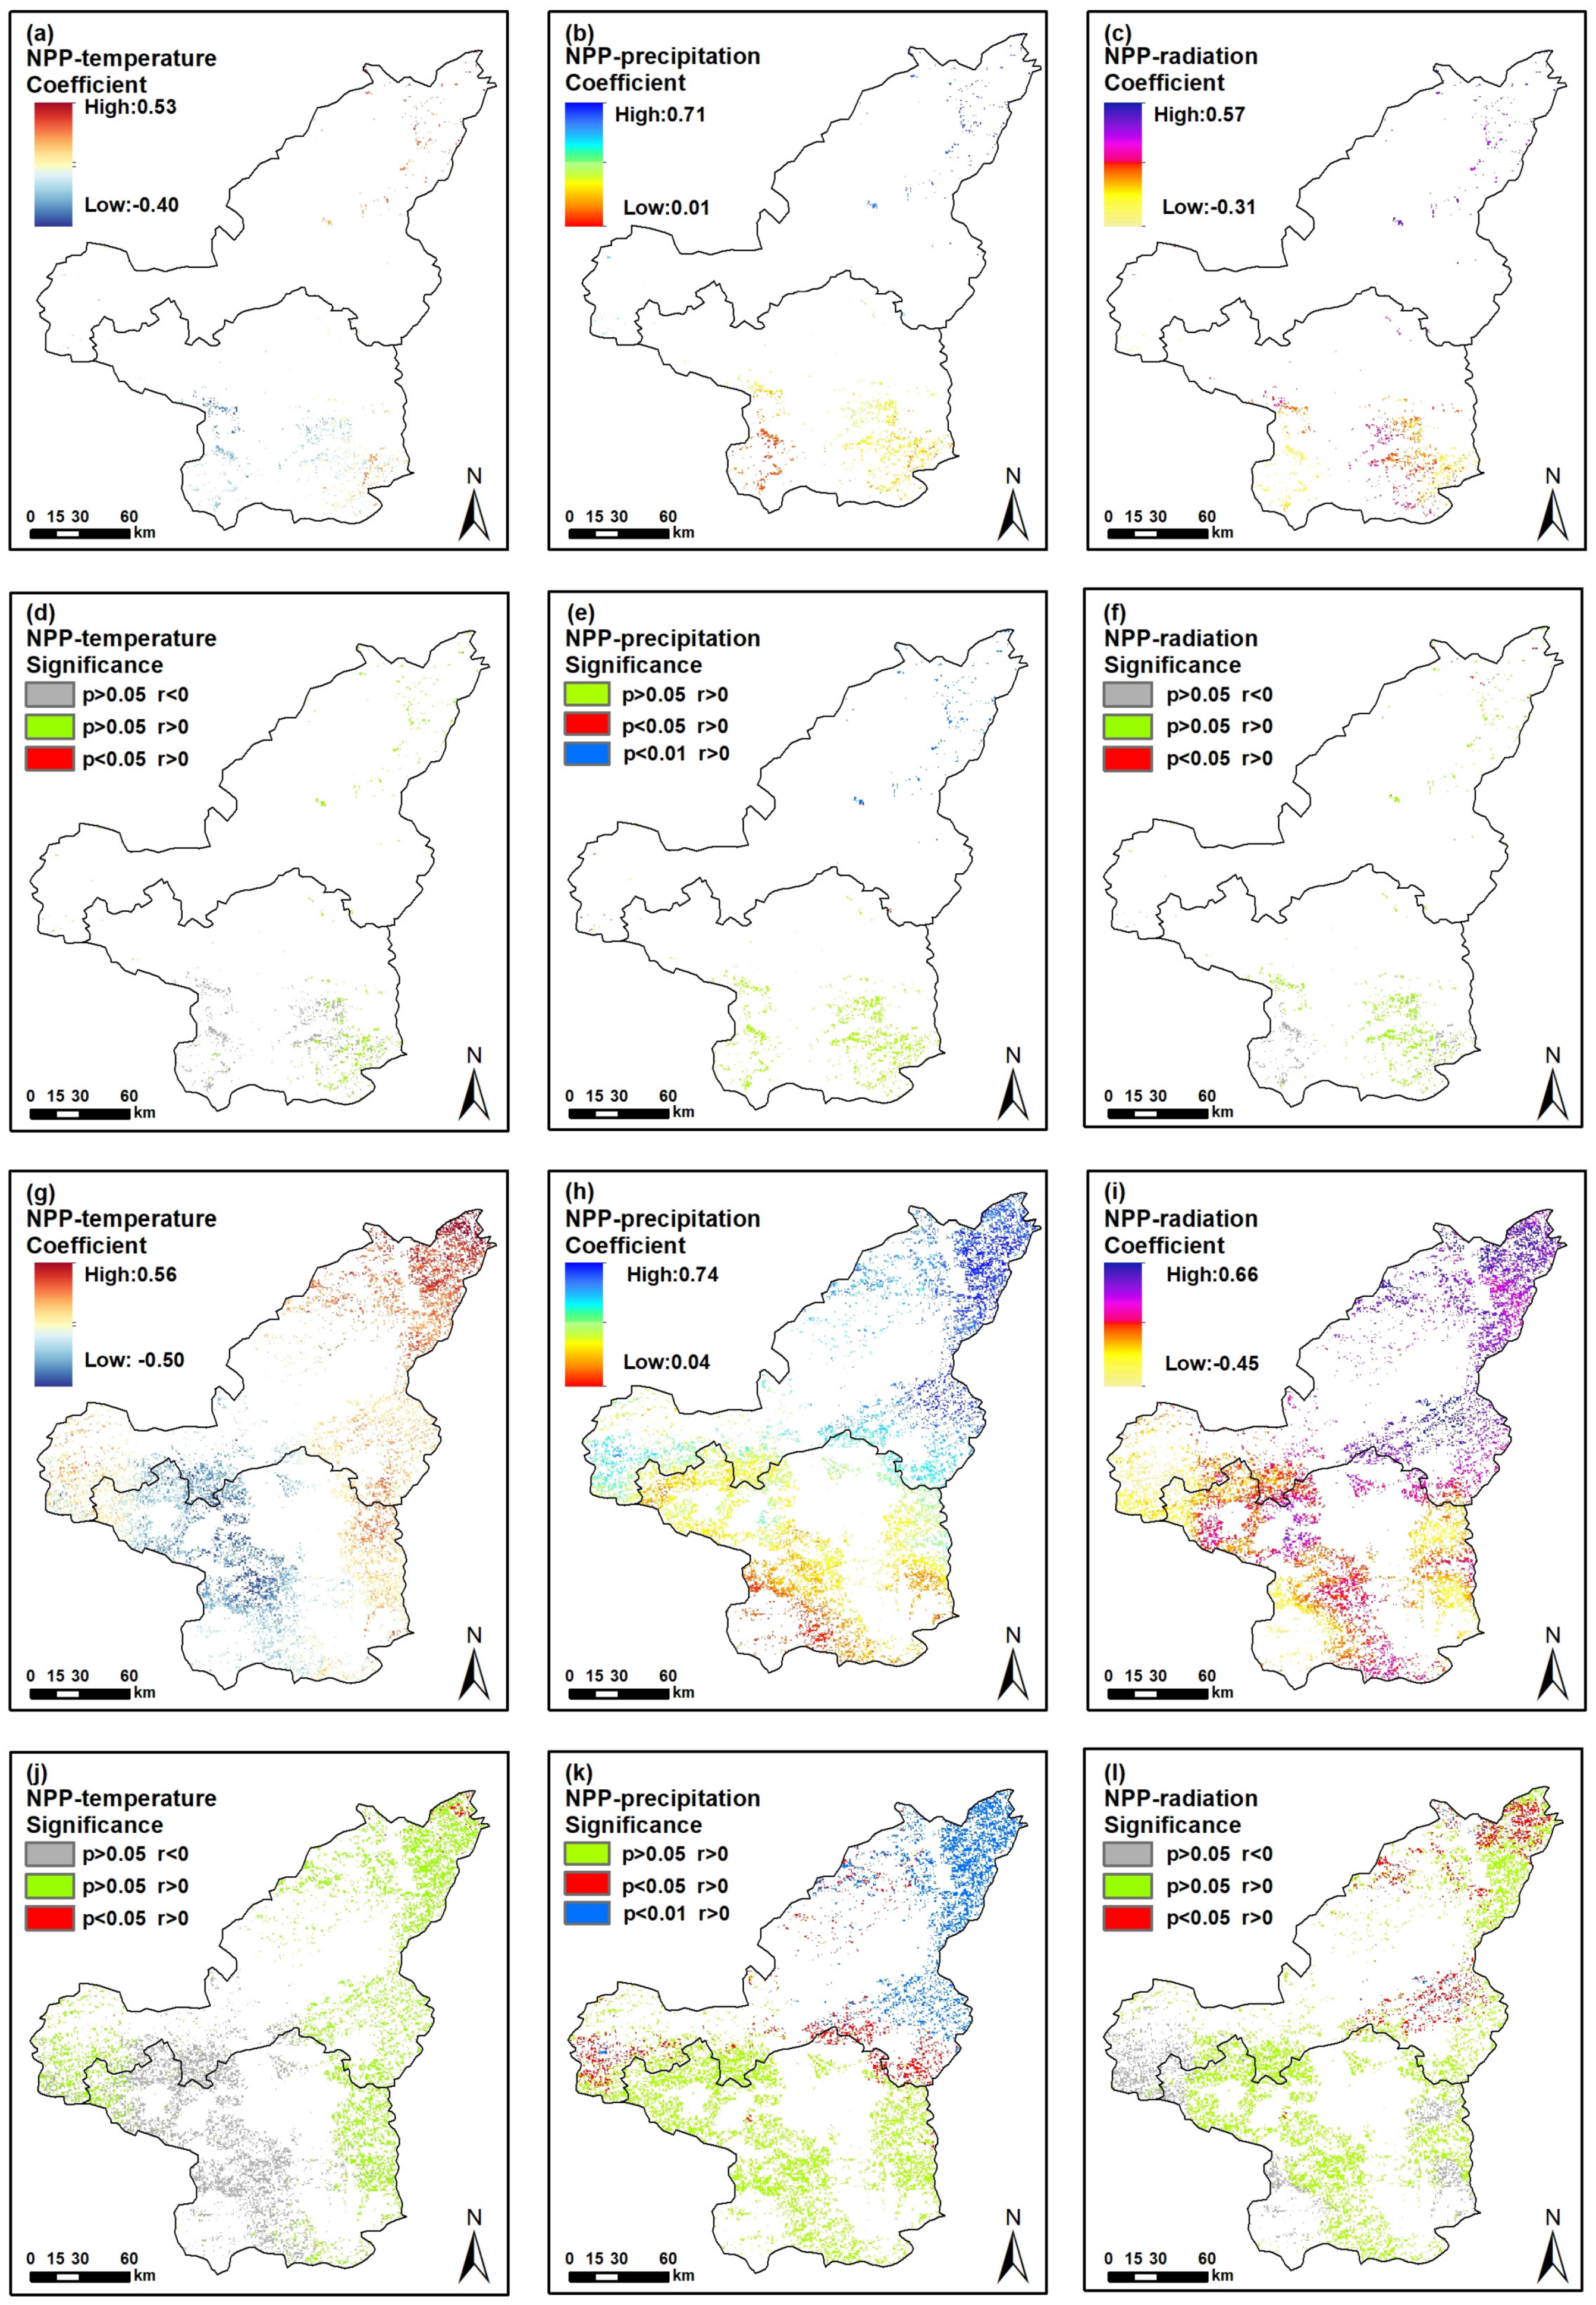
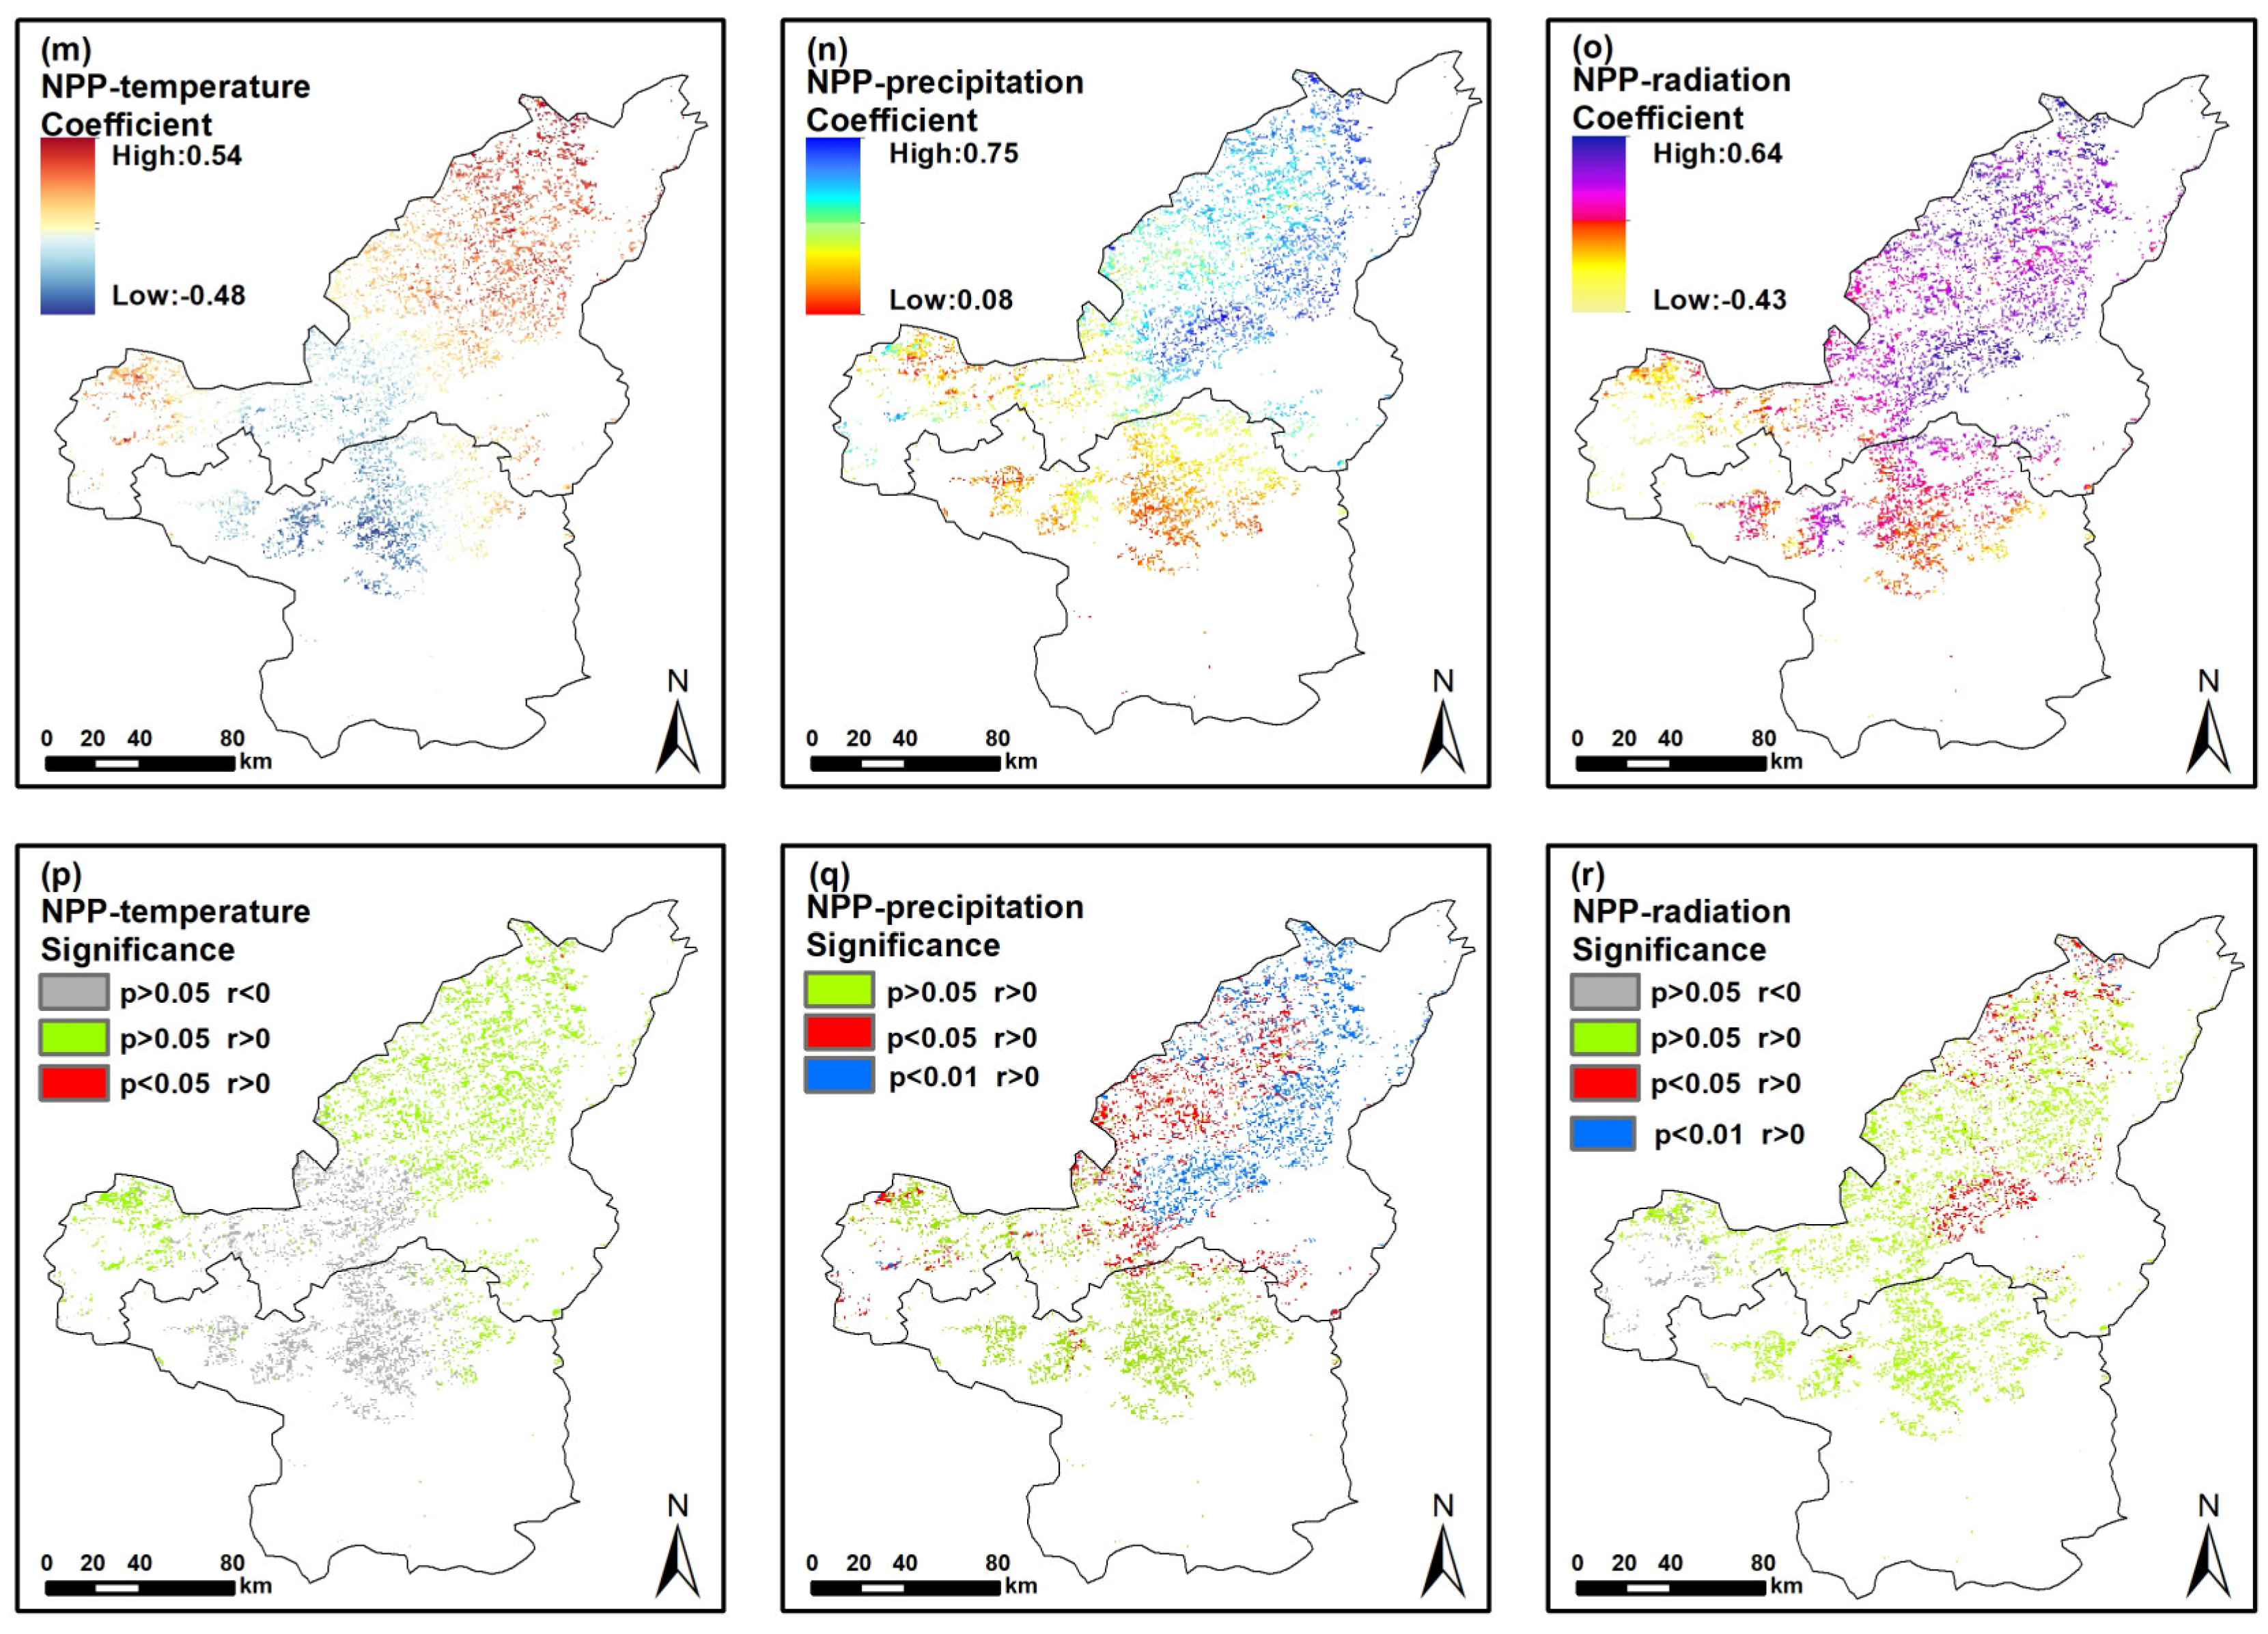
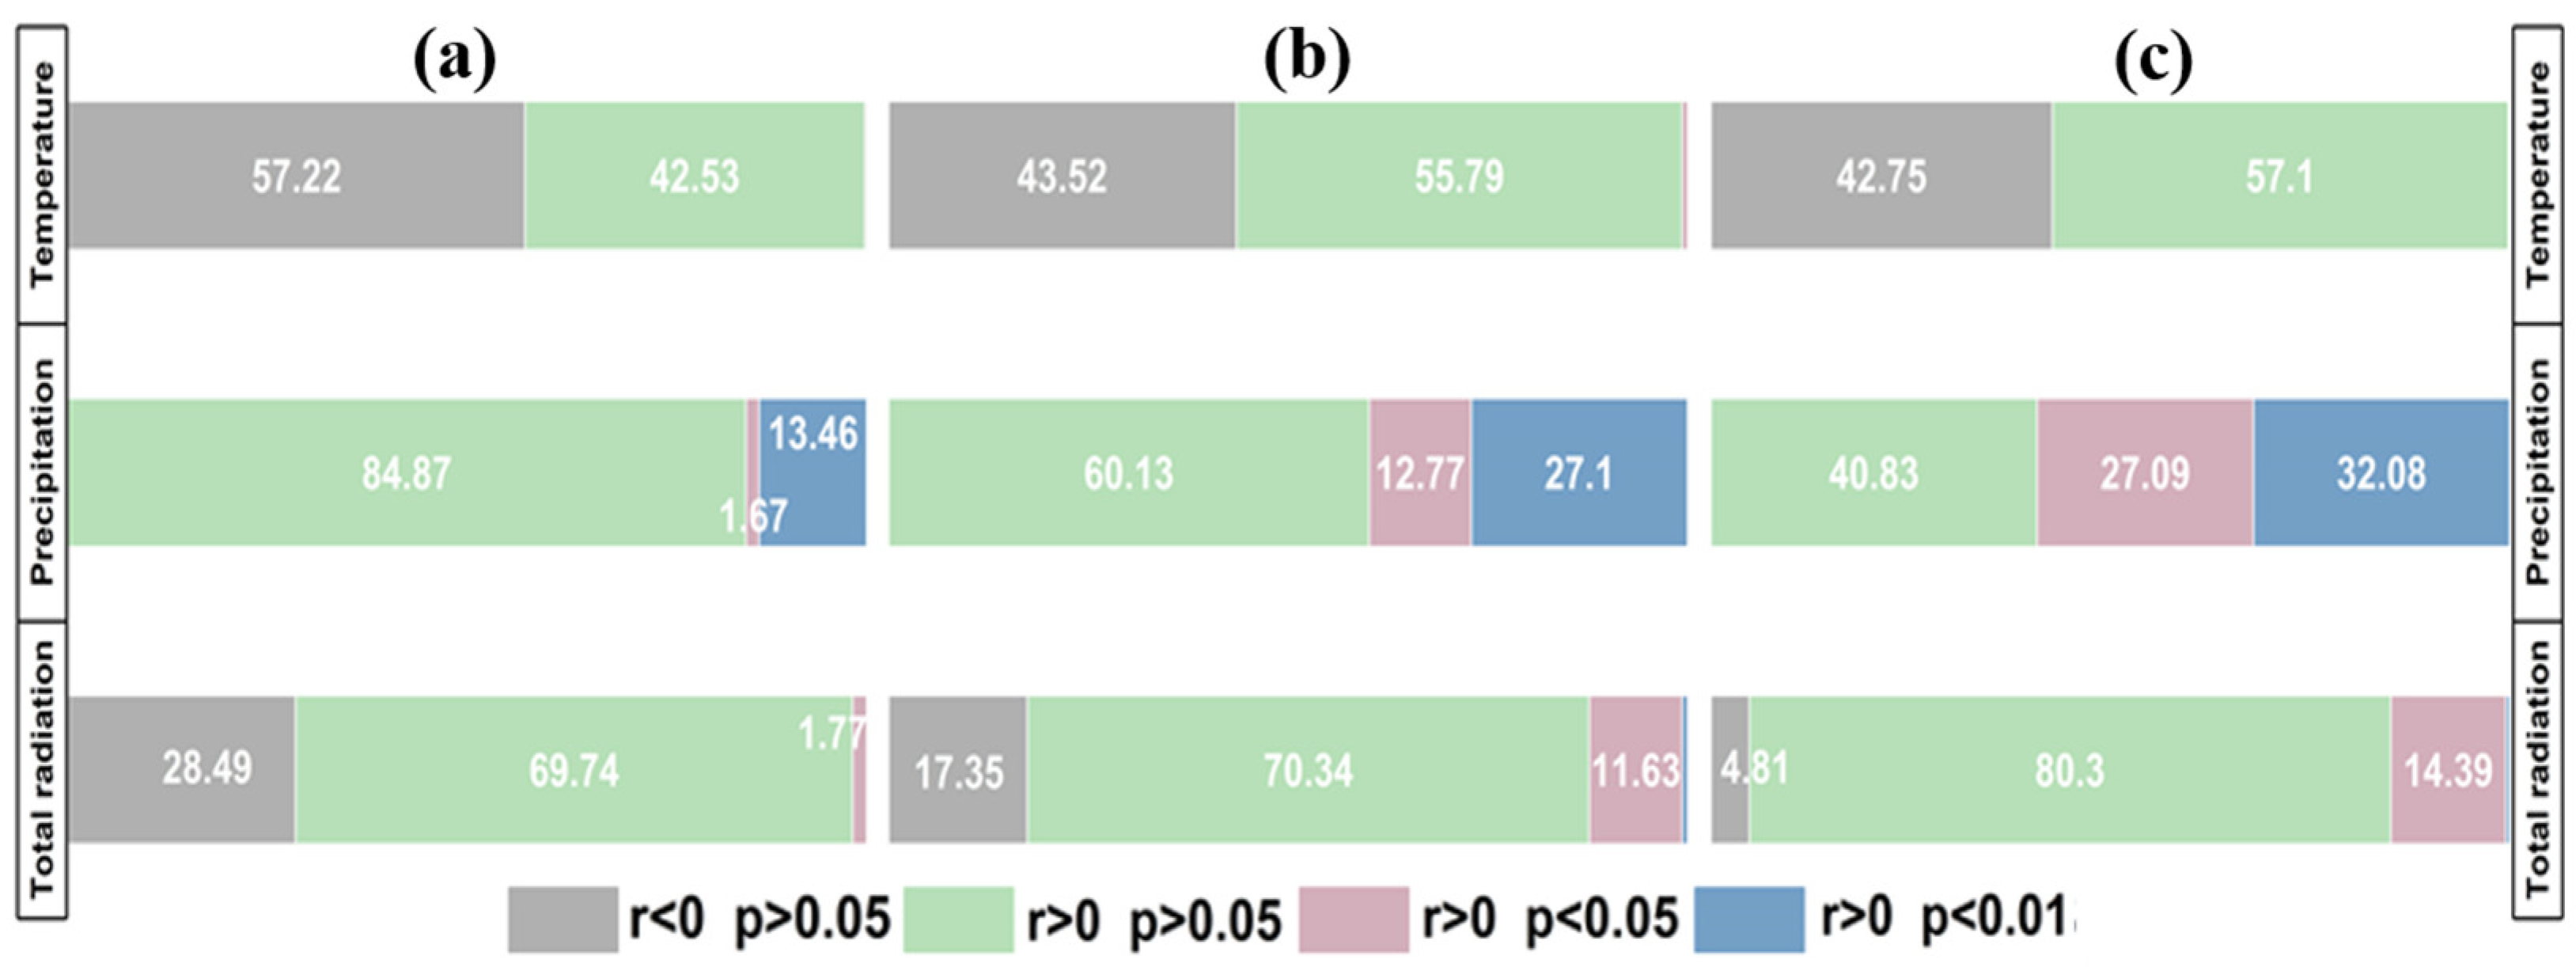
Partial correlation tests were conducted on the NPP of three types of grasslands with temperature, precipitation, and radiation from 2000 to 2020 (Figure 8). The significance proportion and partial correlation coefficients were summarized in Figure 9 and Table 3 respectively. The association between NPP and rainfall was the strongest, followed by total radiation, while temperature was almost irrelevant. A significant disparity in the partial correlation between three types of grassland NPP and rainfall has been displayed. The correlativity of rainfall and total radiation with NPP were similar, and as the grassland coverage decreased, the correlation coefficients of NPP with rainfall and radiation increased, with more significant and extremely significant regions and a stronger correlativity. The proportion of significant and extremely significant correlation between NPP and rainfall reached 59.17%, 39.87%, and 15.13% in low, medium, and high-coverage grasslands, respectively. The partial correlation coefficients were 0.49, 0.43, and 0.31 (p < 0.05), respectively, which were within the Yulin territory. The areas with extremely significant correlation were mainly scattered in 13 counties, including Fugu, Shenmu, Jiaxian, Wubao, Mizhi, Zizhou, etc., in the east and central part of Yulin. The areas where total radiation was significantly and extremely significantly correlated with NPP are 14.89%, 12.31%, and 1.77%, respectively. The partial correlation coefficient between total radiation and NPP was almost half of that between rainfall and NPP, mainly distributed in the northwest and central of Yulin, including Shenmu Yuyang, Hengshan, Mizhi, etc. The annual average total radiation in these areas was 470–480 MJ, close to the average radiation level in the northern Shaanxi region. More than 99% of regions were uncorrelated between NPP with temperature, with a lower partial correlation coefficient, which consisted of 50% negative correlation.
Through multivariate regression analysis, the contribution coefficients of climatic factors to grassland NPP were estimated, and the spatial distributions of the impacts of precipitation, temperature, and total radiation on NPP are shown in Figure 10. The total radiation was the predominant factor, occupying the largest part (65.5%), where NPP affected Fugu and Shenmu counties on the side bordering Inner Mongolia in the northwest, Hengshan in the central part, and some areas of Yanchuan and Yichuan in the southeast of northern Shaanxi. It was followed by rainfall as another dominant factor (33%), scattered in Shenmu, Dingbian, and Fufeng. Temperature was the faintest dominant factor, which affected grassland NPP in Zhidan County.
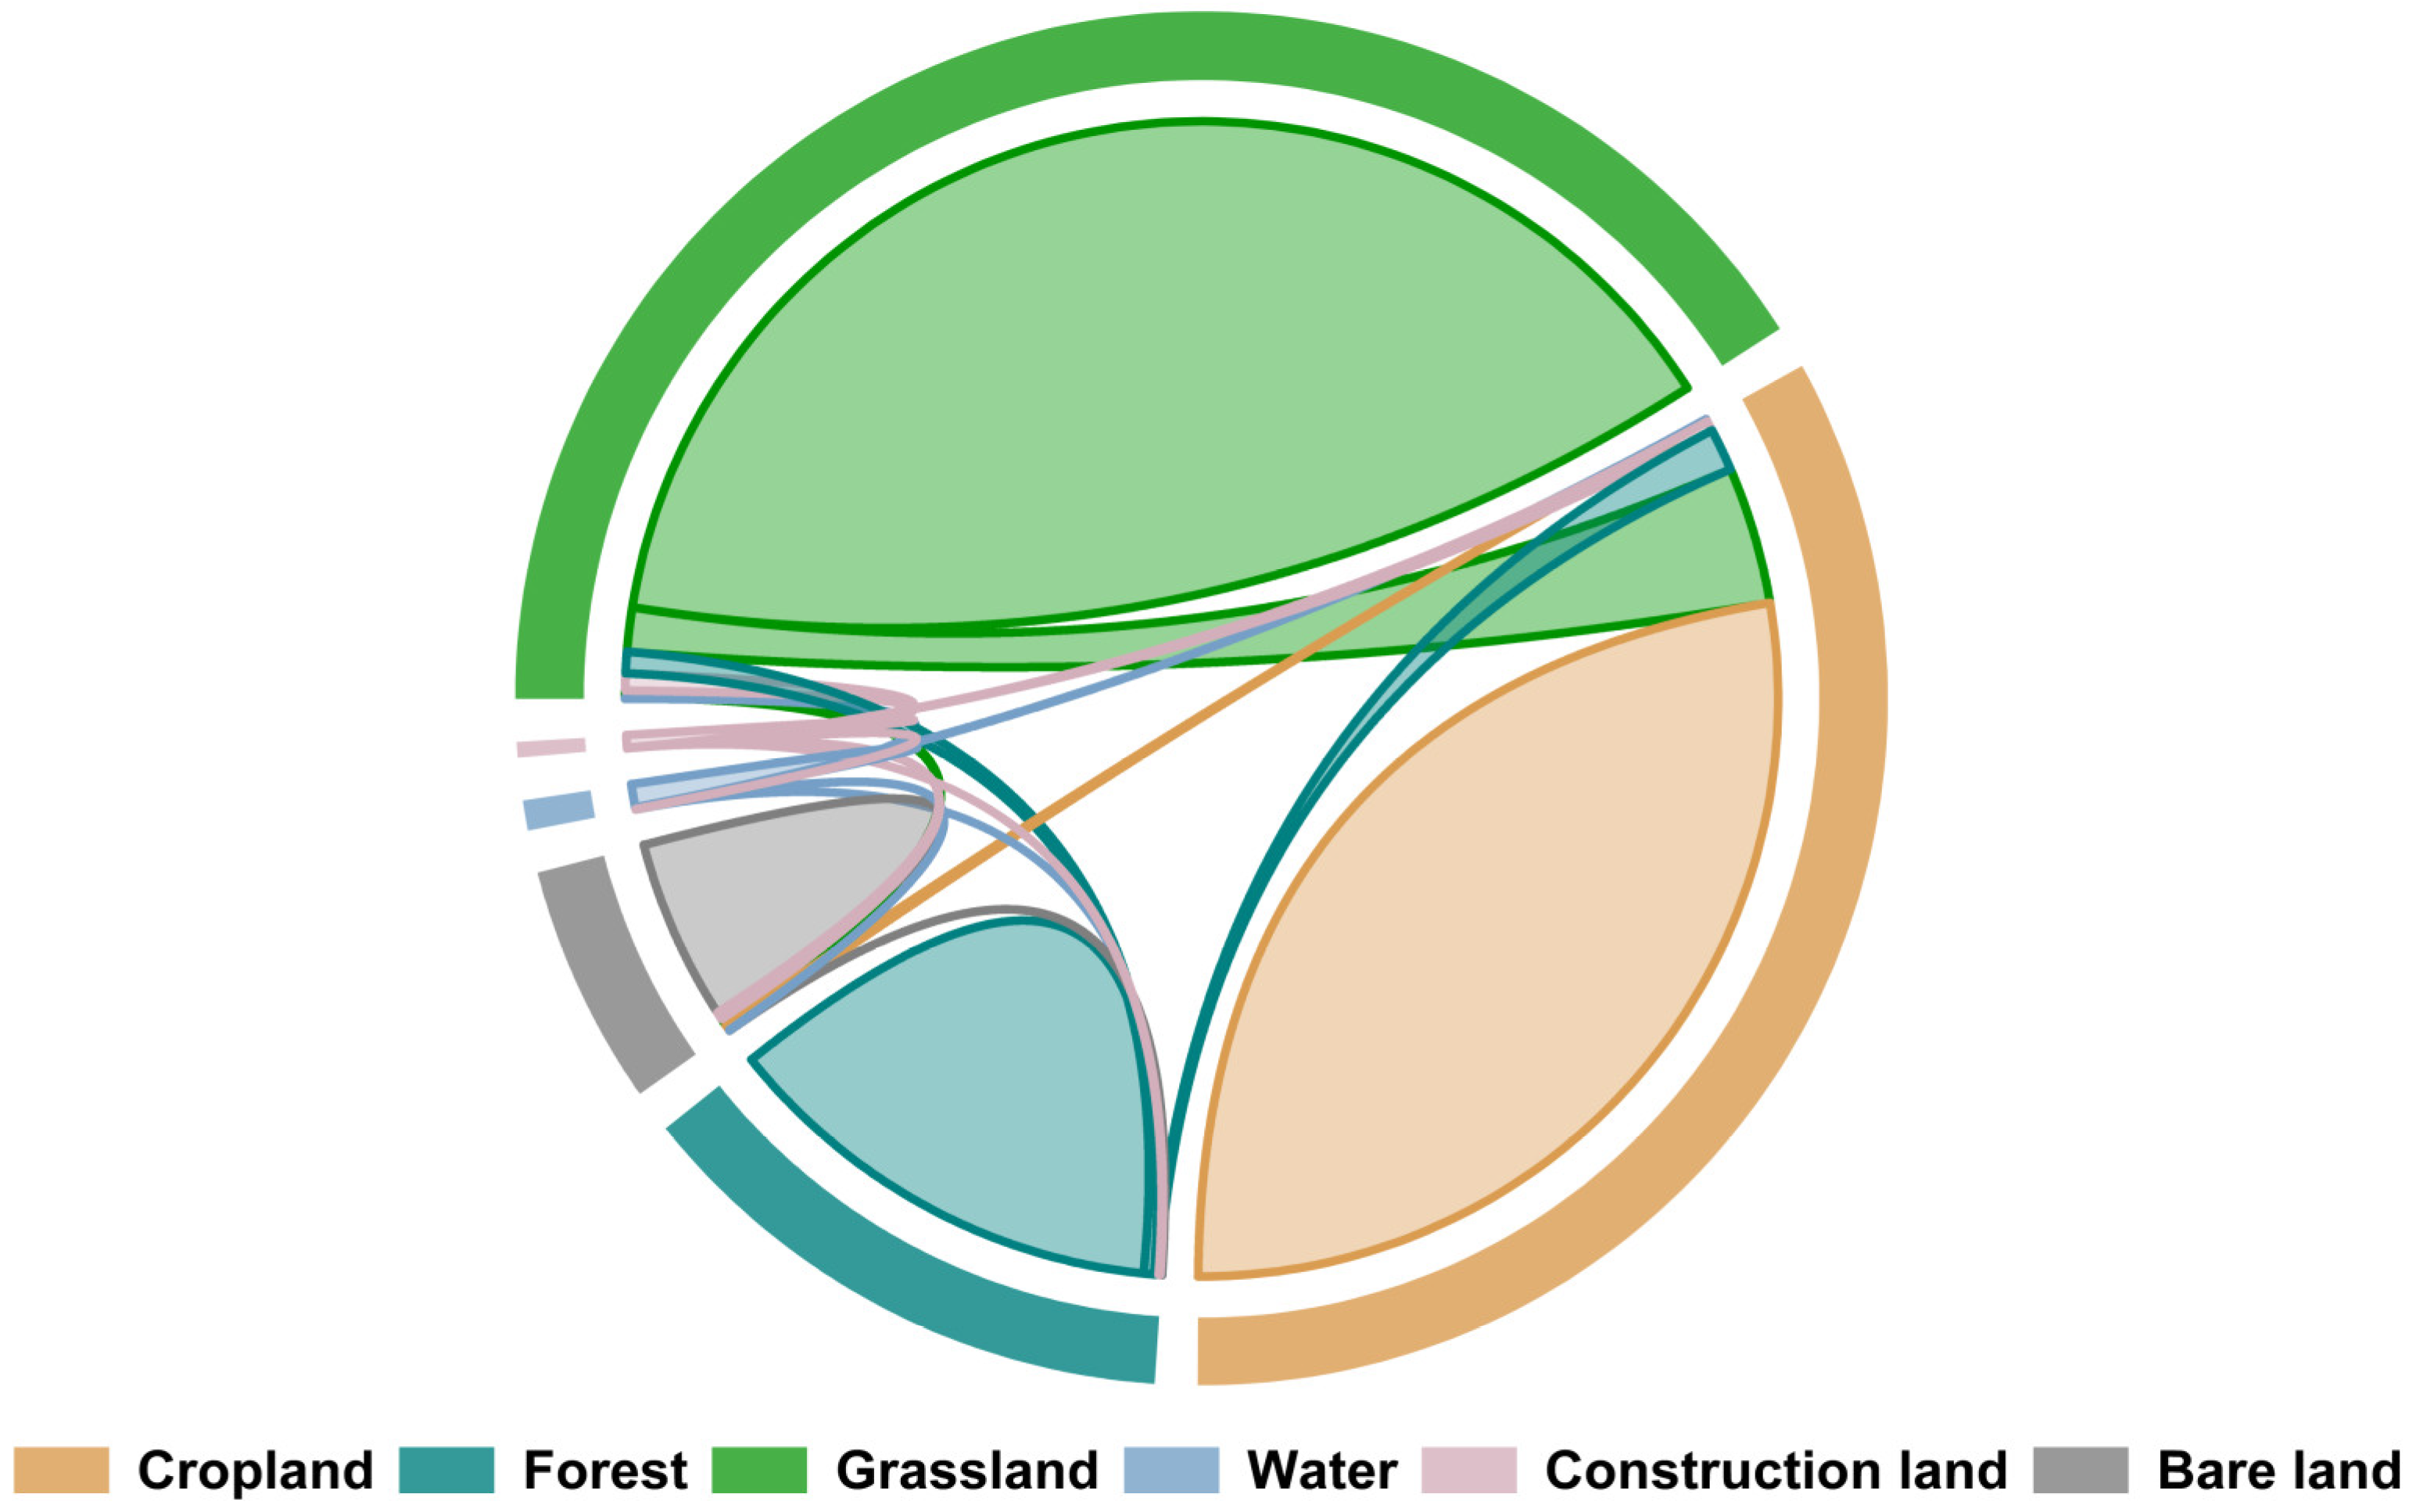
The percentage change in various types of land use over the last 21 years is displayed in Figure 11. Grassland accounted for the largest proportion, followed by cropland, forest, bare land, and water, while construction land made up the smallest proportion of the total area. The grassland increased most significantly, from 33,576.99 km2 to 35,149.19 km2, a 4.68% rise compared to 2000. This increase was primarily due to the conversion of cropland and bare land into grassland. There was also a notable growth in forest area, adding up to 1102.60 km2, which was transformed from cropland and grassland. The construction land increased by 861.48 km2, a 17.71% rise compared to 2000. In contrast, cropland and bare land decreased by 3277.93 km2 and 268.40 km2, respectively.
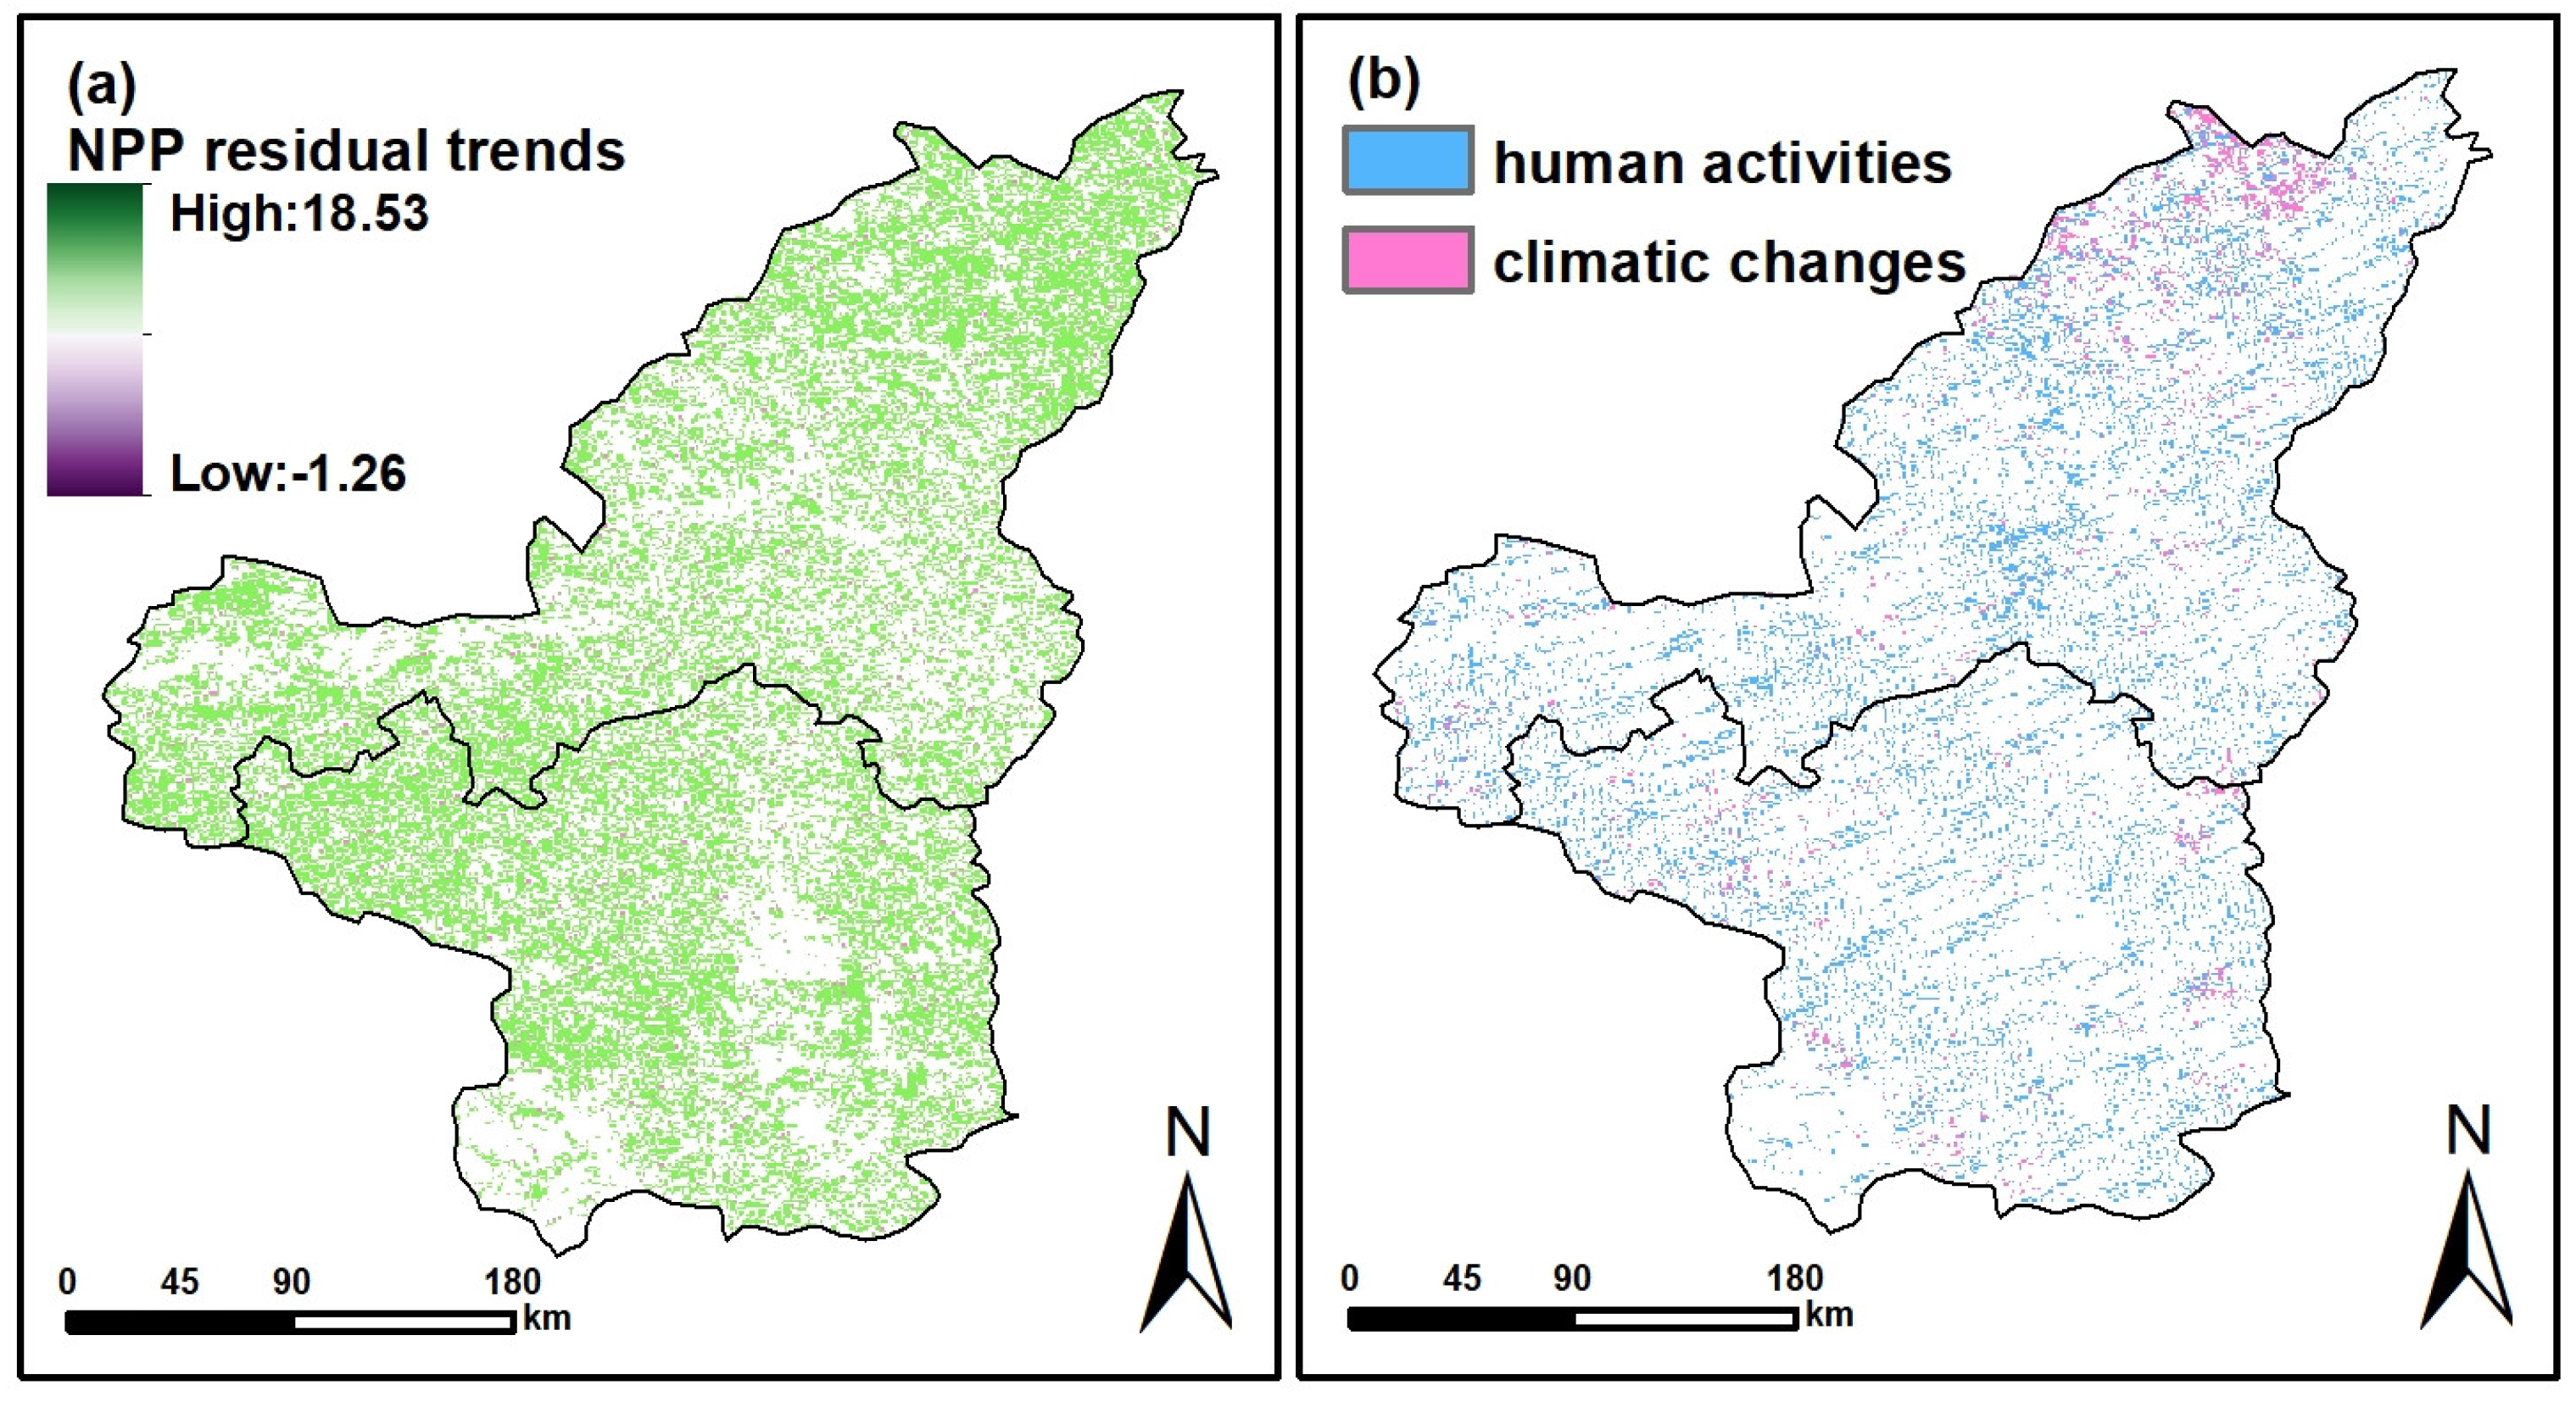
After removing the covariation of temperature, precipitation, and radiation through multiple regression analysis, the variation trend of NPP residual values was observed. The magnitude of the residual values ranged from −1.26 to 18.53 (the average value was 7.05). The region with a positive trend of grassland NPP residual values accounted for 96.95%, with Yan’an higher than Yulin City. Furthermore, 83.98% of grassland NPP was accelerated by human activities, while only 16.02% was slightly affected by climate change in the northeastern corner (Figure 12b).
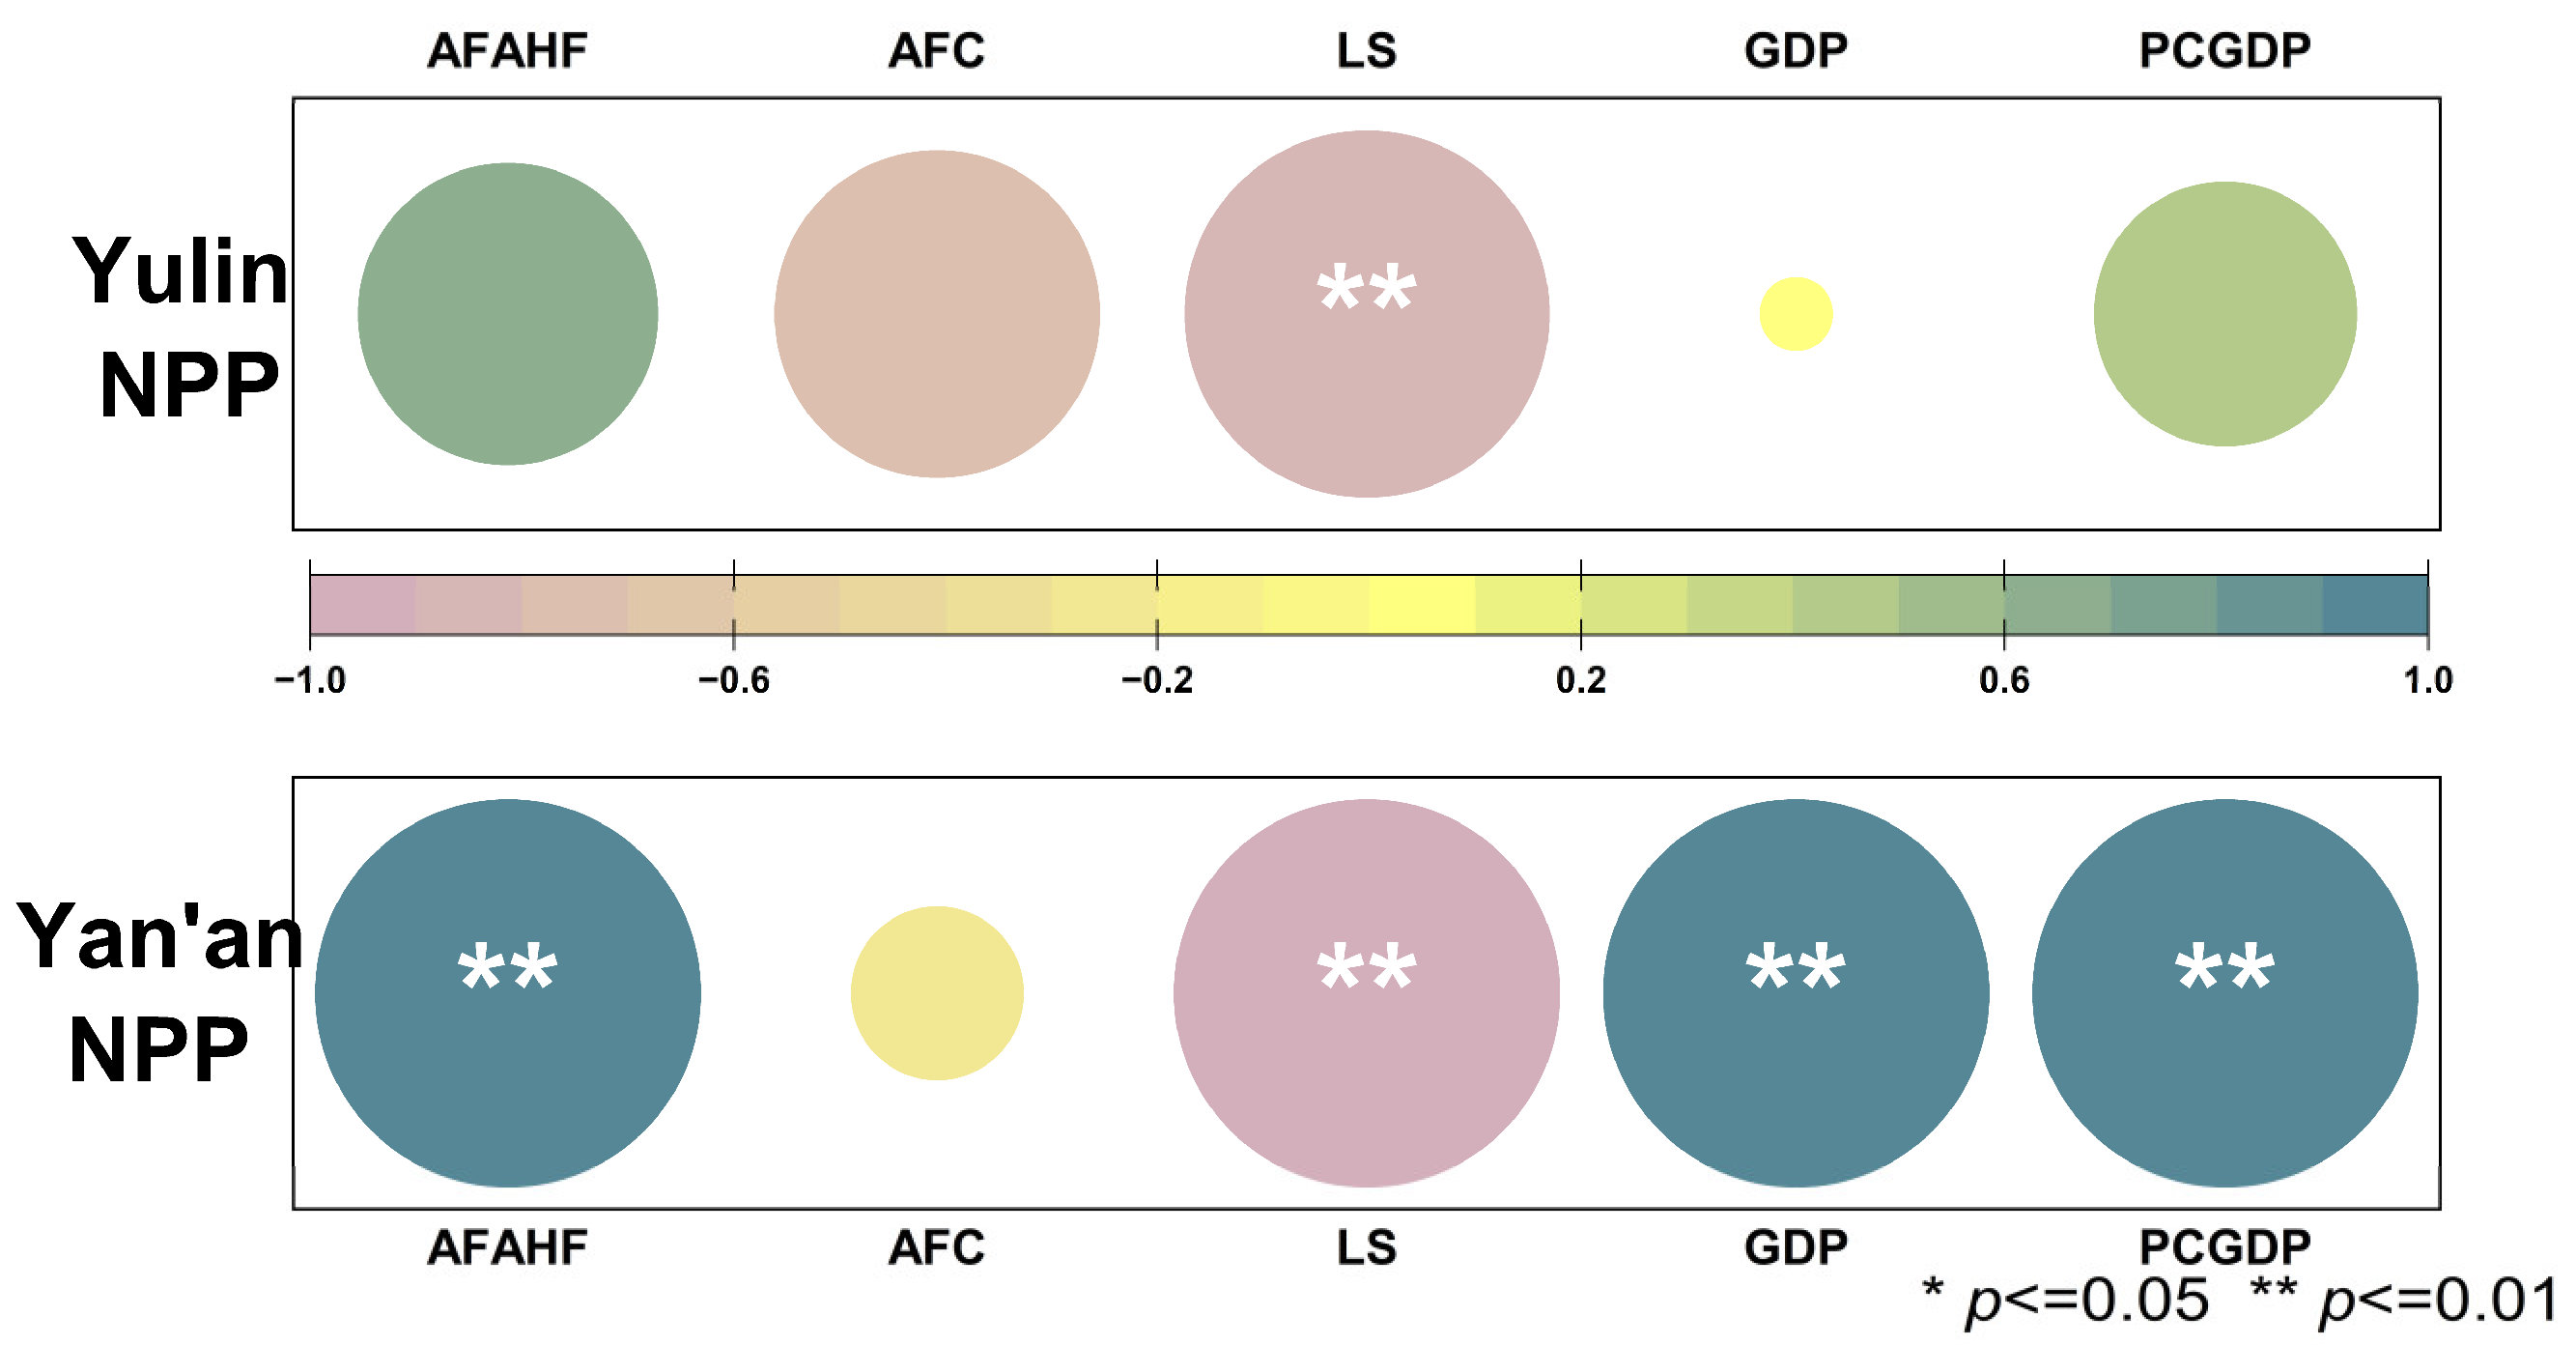
As shown in Figure 13, correlation analyses of grassland NPP with the output value of agriculture, forestry, animal husbandry, and fishery (AFAHF), area of food crops (AFC), livestock stocking (LS, the number of head of large livestock at the end of the year), gross domestic product (GDP), and per capita gross domestic product (PCGDP) were carried out in Yulin and Yan’an, respectively. The NPP in Yulin was found to be positively correlated with AFAHF and PCGDP, negatively correlated with AFC and LS, and hardly correlated with GDP. In contrast, in Yan’an, the grassland NPP was remarkably positively correlated with AFAHF, GDP, and PCGDP (p < 0.05), significantly negatively correlated with LS, and minimally correlated with AFC. In both Yulin and Yan’an, NPP and LS were negatively correlated.

4. Discussion

4.1. Distribution Characteristics and Dynamic Changes of Grassland NPP

We explored the spatiotemporal dynamics of grassland NPP and the responsive relationship between climatic and anthropogenic factors with NPP in northern Shaanxi from 2000 to 2020 by using a variety of analytical methods. On the spatial aspect, NPP showed a divergence pattern of south–high and north–low, and the grassland NPP in Yan’an was markedly higher than that in Yulin, which was consistent with the results explored by Xindong et al. [50]. More than 99% of the grassland NPP was increasing, but the variable tendency was not significant [27,51]. The rate of change of NPP of all three types of grassland displayed a south–high and north–low pattern, with those distributed in Yan’an City being higher than those in Yulin City. The difference in the rate of change of vegetation NPP was about two times. Temporally, the estimated NPP of grassland in northern Shaanxi Province provided by the CASA model ranged from 72 to 700 g C·m−2·a−l from 2000 to 2020. The mean value was 275.12 g C·m−2·a−l, which is close to the NPP of vegetation in northern Shaanxi Province in the NPP of Shaanxi Province in the years 2000–2019 calculated by Xindong Wei et al. However, since this study focuses on grasslands as vegetation, and the vegetation in the northern Shaanxi farming-pastoral zone is dominated by shrubs and grasslands, the estimated NPP value is smaller than the calculation result of Xindong Wei et al. [50]. It is higher than the average value of 242.02 g C·m−2·a−l for grassland NPP in northern China from 2000 to 2015 [52]. Further, it indicates that the NPP of grasslands in northern Shaanxi still increased significantly after 2015. In addition, the interannual growth for NPP estimated from the present study exhibited an increasing trend across the 21 years of the study period and passed the significance test (p ≤ 0.01), and the maximum interannual growth rate was found for high-cover grassland, which was in agreement with the estimation results of Xindong Wei and Yan [50,52]. The study observed that the high-coverage grassland distributed in the southern part of northern Shaanxi was the least proportion (7.28%) of the total but with the greatest average NPP of 425. 04 g C·m−2·a−l and the highest rate of growth. Low-coverage grassland, which took the largest proportion of the total, was distributed in the northwestern side of Yulin and the northern of Yan’an, with the lowest rate of increase in NPP, the greatest coefficient of variation, and the most pronounced fluctuation (Figure 5). The distribution of annual mean NPP values of different types of grassland NPP during 2000–2020 showed the characteristics of south–high and north–low. However, the interannual trend of NPP was quite the opposite, presenting a distribution pattern of north–high and south–low, which relates to the distribution of grassland with three coverage types (Figure 1e).

4.2. Effects of Climate Change on Grassland NPP

With the growth of time series, different types of grassland behaved distinctly in response to meteorology. As indicated in Figure 14, temperatures, precipitation and radiation of grasslands in northern Shaanxi were not appreciably ascending in 2000–2020 (p > 0.05), as the grassland environment warmed and humidified, where natural conditions became more suitable for grassland growing [25]. The multi-annual mean values of NPP were consistent with rainfall for all types of grasses, which were high-cover grasses > medium-cover grasses > low-cover grasses (Figure 14a), indicating that the grassland recovery was majorly attributed to the enhanced precipitation during the study period [28]. The higher the grassland coverage, the more evaporation and interception increase. This increase will interact with the precipitation link in the water cycle when plant transpiration changes, therefore affecting the local climate [35]. The lowest values of temperature and radiation appeared in 2003, the highest in 2006, while the lowest value of rainfall appeared in 2000. The lowest value of NPP for medium and low grassland types also appeared in 2000 (Figure 14b,c), indicating that rainfall was a major restriction on grassland growth when the implementation of the measures of returning ploughland to forest and grassland was first started. The observations revealed that the maximum value of NPP emerged in 2018 for each grassland type, and the following two years showed declines of varying degrees; also, both temperature and radiation declined with the growth of the time series, which indicated that, in recent years, as the rainfall rose, the temperature and radiation might manifest a greater constraint on the development of the grassland.
The spatial heterogeneity in the response of different types of grassland to meteorological variability can be observed. The lower the grass coverage, the greater the partial correlation coefficient between NPP and rainfall, and the greater the proportion of areas where NPP and rainfall were significant and extremely significant. The strongest partial correlation between low-coverage grassland and rainfall was found in Yulin, rather than in Yan’an, where rainfall was much heavier, because of sufficient precipitation in this region, which limits capacity for NPP to increase [53]. Radiation was the predominant factor in the multi-regression analysis (Figure 10), which encompassed both positive and negative influences. In an arid region with high solar radiation, excessive solar radiation can lead to greater surface evapotranspiration of the soil. Combined with poor water availability, this can adversely affect the growth of herbaceous plants and shallow-rooted systems [35]; on the other hand, remarkable facilitation also exists between solar radiation and grassland NPP, which improves the chlorophyll content of the plant, and consequently enhances photosynthesis [54]. As global warming continues, surface evapotranspiration increases markedly without a notable increase in precipitation. This results in water stress and drought, which promotes mechanisms for increasing autotrophic respiration and inhibiting photosynthesis [55]. However, persistent water shortages, increased temperature, and biomass could promote evaporation [56], consuming more precipitation and further exacerbating droughts. This could disrupt the direct mutual feedback between vegetation and water circulation in the ecosystem, forming a vicious cycle. Overall, NPP in grassland was mainly influenced by climate variations [57]; the degree of contribution of each meteorological factor to NPP showed that precipitation was the largest, radiation was the second largest, and temperature was the smallest. However, temperature showed a negative correlation to a portion of NPP, which is in line with studies on a wider scale [49].

4.3. Human Activities’ Effects on NPP Dynamics

The total influence of natural variables was significantly larger than that of human activities, approximately 7:3 [58]. In the early years, vegetation degradation was caused by extensive cultivation and the rapid development of husbandry industries, but fortunately, engineering construction has been vigorously promoted in the Loess Plateau; therefore, vegetation ecology has been improved [59]. Among numerous ecological projects, the “Grain for Green Project” has yielded the most significant ecological benefits, becoming a key factor in promoting NPP growth in northern Shaanxi grasslands [49]. From 2000 to 2020, there has been a considerable decrease in bare land [60], with land use change predominantly featuring grassland expansion (Figure 10). These areas, subject to low human activity intensity [61], have seen improved vegetation habitats and a continuous increase in the Leaf Area Index (LAI) [62]. However, some research indicates that certain ecological engineering measures, such as grassland fencing, have had negative impacts on grasslands [63,64]. This is attributed to long-term fencing preventing full utilization of grassland litter and the absence of positive effects from livestock trampling and manure [65], affecting photosynthesis and leading to reduced NPP. Proper use of livestock can promote vegetation recovery [66]. Furthermore, per capita gross domestic product (PCGDP) reflects the progress of human activities on grassland recovery to a certain extent. In Figure 15, the increase in the area of food crops (AFC) and livestock stock (LS) in Yulin, contrasted with the decline in LS in Yan’an, suggests that Yan’an has implemented stricter grazing ban policies, which is one reason why NPP in Yan’an grasslands is significantly higher than in Yulin. Although human activities have contributed significantly to NPP growth (Figure 12b), Yan’an and Yulin are characterized by different ecological conditions. The effectiveness of the implementation of all types of ecological projects has been considerable, whereas Yulin’s topography and ecological conditions are much more complex, and environmental engineering projects have been ongoing, but the effects are not as pronounced as in Yan’an (Figure 12a) [31]. Hence, we should utilize different technologies to explore the sustainable use of natural resources and breakthroughs in optimizing economic and social development.

4.4. Limitation and Future Work

In this study, we employed the CASA model to investigate the dynamic changes of grassland NPP in northern Shaanxi. The CASA model, for instance, does not delve into the mechanism of grassland response to water supply in arid and semi-arid regions. Given the water scarcity in these areas [67], NPP is more susceptible to water stress compared to humid regions [68]. By incorporating diverse precipitation scenarios into the CASA model, the accuracy of NPP values may be enhanced through further investigation, thereby enabling the prediction of future NPP outcomes. In addition, NPP dynamics, meteorological factors and their correlation analysis mostly showed an increasing trend, but this was not significant. This may be explained by the relatively short study period of only 21 years. Future studies utilising longer time series may unveil significant changes in trends.
Regression and residual trend analyses were used to better discriminate the effects of climatic and anthropogenic factors on grassland net primary production. However, overlapping contributions of drivers did exist [26]. Other potential drivers of NPP change, such as soil nutrients, fire history, and livestock load, were not considered in this study [25,69]. Therefore, future research should aim to integrate climatic, anthropogenic, and other variables with NPP to fully understand the impact of these factors on grassland NPP variation.

5. Conclusions

This study estimated the NPP of various types of grasslands and used multiple analytical methods to quantify their dynamic changes and responses to related factors. The following conclusions were drawn:
(1) From 2000 to 2020, the NPP of three types of grassland in northern Shaanxi increased significantly (p < 0.01) with a large fluctuation trend, and the increase rate of NPP in high-coverage grasslands was much higher than that in medium- and low-coverage grassland, which is mainly related to rainfall.
(2) The distribution of grassland NPP has spatial heterogeneity, showing a decreasing trend with the decline of latitude (p > 0.05). However, the annual change rate of NPP is the opposite, showing a north–high and south–low distribution pattern.
(3) The climatic factors fluctuate upwards despite being insignificant (p > 0.05). Precipitation is the predominant factor contributing to the rise of NPP, while radiation plays a role in enhancing grassland NPP, with both positive and negative effect.
(4) The implementation of ecological policies is crucial in the energy-intensive and fragile eco-environment of northern Shaanxi to facilitate grassland restoration.
Between 2000 and 2020, the NPP of grasslands in northern Shaanxi has increased by 181.02 g C·m−2. This escalation has improved the grass cover, reduced soil erosion, and indicated effective ecological management. The insights derived from our research provide a robust basis for informed decision making by Chinese government agencies, specifically concerning the future regression of grassland and the conservation of biodiversity in northern Shaanxi.

Author Contributions

Conceptualization and supervision: Y.L. and J.J.; Design and methodology: Y.L. and Y.C.; Data analysis: P.H. and Z.W.; Data curation: X.C. and W.Z.; Writing, original draft preparation: Y.C. and Y.L.; Writing, review and editing: Y.C. and Z.L. All authors have read and agreed to the published version of the manuscript.

Funding

This work was supported by the “Shaanxi Provincial Philosophy and Social Sciences Research Project-Shaanxi Ecological Space Governance Key Project” (No.2022HZ1836), the “National Natural Science Foundation of China” (No. 42107512), the “Open Foundation of the Key Laboratory of Coupling Process and Effect of Natural Resources Elements” (No.2022KFKTC004), the “Open Research Fund of Key Laboratory of Digital Earth Science, Chinese Academy of Sciences” (No.2022LDE003), the “Special project of science and technology innovation plan of Shaanxi Academy of Forestry Sciences” (No. SXLK2022–02-7 and No. SXLK2023–02-14).

Data Availability Statement

Data will be made available upon request.

Acknowledgments

We acknowledge for the data support from “Loess plateau science data center, National Earth System Science Data Sharing Infrastructure, National Science & Technology Infrastructure of China (http://loess.geodata.cn)”.

Conflicts of Interest

The authors declare no conflict of interest.

References

  1. Kang, L.; Han, X.; Zhang, Z.; Sun, O.J. Grassland ecosystems in China: Review of current knowledge and research advancement. Philos. Trans. R. Soc. A 2007, 362, 1008–1997. [Google Scholar] [CrossRef]
  2. Hafner, S.; Unteregelsbacher, S.; Seeber, E.; Lena, B.; Xu, X.; Li, X.; Guggenberger, G.; Miehe, G.; Kuzyakov, Y. Effect of grazing on carbon stocks and assimilate partitioning in a Tibetan montane pasture revealed by 13CO2 pulse labeling. Glob. Chang. Biol. 2011, 18, 528–538. [Google Scholar] [CrossRef]
  3. Turner, W.R.; Brandon, K.; Brooks, T.M.; Costanza, R.; da Fonseca, G.A.B.; Portela, R. Global Conservation of Biodiversity and Ecosystem Services. Bioscience 2007, 57, 868–873. [Google Scholar] [CrossRef]
  4. Grime, J.P.; Brown, V.K.; Thompson, K.; Masters, G.J.; Hillier, S.H.; Clarke, I.P.; Askew, A.P.; Corker, D.; Kielty, J.P. The Response of Two Contrasting Limestone Grasslands to Simulated Climate Change. Science 2000, 289, 762–765. [Google Scholar] [CrossRef]
  5. Gang, C.; Zhou, W.; Chen, Y.; Wang, Z.; Sun, Z.; Li, J.; Qi, J.; Odeh, I. Quantitative assessment of the contributions of climate change and human activities on global grassland degradation. Environ. Earth Sci. 2014, 72, 4273–4282. [Google Scholar] [CrossRef]
  6. Dong, S.; Shang, Z.; Gao, J.; Boone, R.B. Enhancing sustainability of grassland ecosystems through ecological restoration and grazing management in an era of climate change on Qinghai-Tibetan Plateau. Agric. Ecosyst. Environ. 2020, 287, 106684. [Google Scholar] [CrossRef]
  7. Han, J.G.; Zhang, Y.J.; Wang, C.J.; Bai, W.M.; Wang, Y.R.; Han, G.D.; Li, L.H. Rangeland degradation and restoration management in China. Rangel. J. 2008, 30, 233–239. [Google Scholar] [CrossRef]
  8. Eldridge, D.J.; Delgado-Baquerizo, M. Continental-scale Impacts of Livestock Grazing on Ecosystem Supporting and Regulating Services. Land Degrad. Dev. 2016, 28, 1473–1481. [Google Scholar] [CrossRef]
  9. Hu, Z.; Li, S.; Guo, Q.; Niu, S.; He, N.; Li, L.; Yu, G. A synthesis of the effect of grazing exclusion on carbon dynamics in grasslands in China. Glob. Change Biol. 2016, 22, 1385–1393. [Google Scholar] [CrossRef]
  10. Shaw, M.R.; Zavaleta, E.S.; Chiariello, N.R.; Cleland, E.E.; Mooney, H.A.; Field, C.B. Grassland responses to global environmental changes suppressed by elevated CO2. Science 2002, 298, 1987–1990. [Google Scholar] [CrossRef]
  11. Zavaleta, E.S.; Shaw, M.R.; Chiariello, N.R.; Thomas, B.D.; Cleland, E.E.; Field, C.B.; Mooney, H.A. Grassland responses to three years of elevated temperature, CO2, precipitation, and N deposition. Ecol. Monogr. 2003, 73, 585–604. [Google Scholar] [CrossRef]
  12. Scurlock, J.M.O.; Hall, D.O. The global carbon sink: A grassland perspective. Glob. Change Biol. 1998, 4, 220–233. [Google Scholar] [CrossRef]
  13. Zhou, W.; Gang, C.; Zhou, L.; Chen, Y.; Li, J.; Ju, W.; Odeh, I. Dynamic of grassland vegetation degradation and its quantitative assessment in the northwest China. Acta Oecol. 2014, 55, 86–96. [Google Scholar] [CrossRef]
  14. Zhou, W.; Yang, H.; Huang, L.; Chen, C.; Lin, X.; Hu, Z.; Li, J. Grassland degradation remote sensing monitoring and driving factors quantitative assessment in China from 1982 to 2010. Ecol. Indic. 2017, 83, 303–313. [Google Scholar] [CrossRef]
  15. Hoover, D.L.; Rogers, B.M. Not all droughts are created equal: The impacts of interannual drought pattern and magnitude on grassland carbon cycling. Glob. Change Biol. 2016, 22, 1809–1820. [Google Scholar] [CrossRef] [PubMed]
  16. McGuire, A.D.; Melillo, J.M.; Joyce, L.A.; Kicklighter, D.W.; Grace, A.L.; Moore, B.; Vorosmarty, C.J. Interactions between carbon and nitrogen dynamics in estimating net primary productivity for potential vegetation in North America. Glob. Biogeochem. Cycles 1992, 6, 101–124. [Google Scholar] [CrossRef]
  17. Feng, X.; Fu, B.; Lu, N.; Zeng, Y.; Wu, B. How ecological restoration alters ecosystem services: An analysis of carbon sequestration in China’s Loess Plateau. Sci. Rep. 2013, 3, 2846. [Google Scholar] [CrossRef] [PubMed]
  18. Cramer, W.; Kicklighter, D.W.; Bondeau, A.; Iii, B.M.; Churkina, G.; Nemry, B.; Ruimy, A.; Schloss, A.L.; The Participants of the Potsdam NPP Model Intercomparison. Comparing global models of terrestrial net primary productivity (NPP): Overview and key results. Glob. Change Biol. 2001, 5, 1–15. [Google Scholar] [CrossRef]
  19. Zhu, X.; Zheng, J.; An, Y.; Xin, X.; Xu, D.; Yan, R.; Xu, L.; Shen, B.; Hou, L. Grassland Ecosystem Progress: A Review and Bibliometric Analysis Based on Research Publication over the Last Three Decades. Agronomy 2023, 13, 614. [Google Scholar] [CrossRef]
  20. Su, C.; Fu, B. Evolution of ecosystem services in the Chinese Loess Plateau under climatic and land use changes. Glob. Planet. Change 2013, 101, 119–128. [Google Scholar] [CrossRef]
  21. Hector, A.; Bazeley-White, E.; Loreau, M.; Otway, S.; Schmid, B. Overyielding in grassland communities: Testing the sampling effect hypothesis with replicated biodiversity experiments. Ecol. Lett. 2002, 5, 502–511. [Google Scholar] [CrossRef]
  22. Dingaan, M.N.V.; Du Preez, P.J. Grassland communities of urban open spaces in Bloemfontein, Free State, South Africa. Koedoe 2013, 55, 1–6. [Google Scholar] [CrossRef]
  23. Liu, H.; Jia, J.; Lin, Z.; Wang, Z.; Gong, H. Relationship between net primary production and climate change in different vegetation zones based on EEMD detrending—A case study of Northwest China. Ecol. Indic. 2021, 122, 107276. [Google Scholar] [CrossRef]
  24. Qin, X.; Liu, W.; Mao, R.; Song, J.; Chen, Y.; Ma, C.; Li, M. Quantitative assessment of driving factors affecting human appropriation of net primary production (HANPP) in the Qilian Mountains, China. Ecol. Indic. 2021, 121, 106997. [Google Scholar] [CrossRef]
  25. Wang, Y.; Yue, H.; Peng, Q.; He, C.; Hong, S.; Bryan, B.A. Recent responses of grassland net primary productivity to climatic and anthropogenic factors in Kyrgyzstan. Land Degrad. Dev. 2020, 31, 2490–2506. [Google Scholar] [CrossRef]
  26. Zhang, F.; Hu, X.; Zhang, J.; Li, C.; Zhang, Y.; Li, X. Change in Alpine Grassland NPP in Response to Climate Variation and Human Activities in the Yellow River Source Zone from 2000 to 2020. Sustainability 2022, 14, 8790. [Google Scholar] [CrossRef]
  27. Jie, T.; Junnan, X.; Yichi, Z.; Weiming, C.; Yuchuan, H.; Chongchong, Y.; Wen, H. Quantitative Assessment of the Effects of Climate Change and Human Activities on Grassland NPP in Altay Prefecture. J. Resour. Ecol. 2021, 12, 743–756. [Google Scholar] [CrossRef]
  28. Liu, Y.; Zhang, Z.; Tong, L.; Khalifa, M.; Wang, Q.; Gang, C.; Wang, Z.; Li, J.; Sun, Z. Assessing the effects of climate variation and human activities on grassland degradation and restoration across the globe. Ecol. Indic. 2019, 106, 105504. [Google Scholar] [CrossRef]
  29. Zhang, M.L.; Liu, X.N.; Nazieh, S.; Wang, X.Y.; Nkrumah, T.; Hong, S.L. Spatiotemporal distribution of grassland NPP in Gansu province, China from 1982 to 2011 and its impact factors. PLoS ONE 2020, 15, e0242609. [Google Scholar] [CrossRef]
  30. Guo, D.; Song, X.; Hu, R.; Cai, S.; Zhu, X.; Hao, Y. Grassland type-dependent spatiotemporal characteristics of productivity in Inner Mongolia and its response to climate factors. Sci. Total Environ. 2021, 775, 145644. [Google Scholar] [CrossRef]
  31. Yang, Y.; Hu, D. Natural capital utilization based on a three-dimensional ecological footprint model: A case study in northern Shaanxi, China. Ecol. Indic. 2018, 87, 178–188. [Google Scholar] [CrossRef]
  32. Bei-dou, X.J.R.o.S.; Xing, H.C.; Chen, Z.S.; Wang, X.R.; Xu, Q.G.; Xia, X.F.; Gao, R.T. Analysis of Ecological Footprint of Yan’an from 2001 to 2006. Res. Soil Water Conserv. 2009, 16, 120–135. [Google Scholar]
  33. Liu, J.; Deng, X. Progress of the research methodologies on the temporal and spatial process of LUCC. Chin. Sci. Bull. 2010, 55, 1354–1362. [Google Scholar] [CrossRef]
  34. Yuan, J.; Niu, Z.; Wang, C. Vegetation NPP distribution based on MODIS data and CASA model—A case study of northern Hebei Province. Chin. Geogr. Sci. 2006, 16, 334–341. [Google Scholar] [CrossRef]
  35. Yang, H.; Zhong, X.; Deng, S.; Xu, H. Assessment of the impact of LUCC on NPP and its influencing factors in the Yangtze River basin, China. Catena 2021, 206, 105542. [Google Scholar] [CrossRef]
  36. Potter, C.S.; Randerson, J.T.; Field, C.B.; Matson, P.A.; Vitousek, P.M.; Mooney, H.A.; Klooster, S.A. Terrestrial ecosystem production: A process model based on global satellite and surface data. Glob. Biogeochem. Cycles 1993, 7, 811–841. [Google Scholar] [CrossRef]
  37. Field, C.B.; Behrenfeld, M.J.; Randerson, J.T.; Falkowski, P. Primary Production of the Biosphere: Integrating Terrestrial and Oceanic Components. Science 1998, 281, 237–240. [Google Scholar] [CrossRef]
  38. Zhu, W.; Pan, Y.; He, H.; Yu, D.; Hu, H. Simulation of maximum light use efficiency for some typical vegetation types in China. Chin. Sci. Bull. 2006, 51, 457–463. [Google Scholar] [CrossRef]
  39. Raich, J.; Rastetter, E.; Melillo, J.; Kicklighter, D.; Steudler, P.; Peterson, B.; Grace, A.; Mooreiii, B.; Vorosmarty, C. Potential Net Primary Productivity in South America: Application of a Global Model. Ecol. Appl. 1991, 1, 399–429. [Google Scholar] [CrossRef]
  40. Hirsch, R.M.; Slack, J.R.; Smith, R.A. Techniques of trend analysis for monthly water quality data. Water Resour. Res. 2010, 18, 107–121. [Google Scholar] [CrossRef]
  41. Wei, L.; Jiang, S.; Ren, L.; Tan, H.; Ta, W.; Liu, Y.; Yang, X.; Zhang, L.; Duan, Z. Spatiotemporal changes of terrestrial water storage and possible causes in the closed Qaidam Basin, China using GRACE and GRACE Follow-On data. J. Hydrol. 2021, 598, 126274. [Google Scholar] [CrossRef]
  42. Theil, H. A Rank-Invariant Method of Linear and Polynomial Regression Analysis. In Henri Theil’s Contributions to Economics and Econometrics; Raj, B., Koerts, J., Eds.; Advanced Studies in Theoretical and Applied Econometrics; Springer: Dordrecht, The Netherlands, 1992; pp. 345–381. [Google Scholar]
  43. Sen, P.K. Estimates of the regression coefficient based on Kendall’s tau. J. Am. Stat. Assoc. 1968, 63, 1379–1389. [Google Scholar] [CrossRef]
  44. Liu, Y.; Li, Y.; Zhang, H.; Li, C.; Zhang, Z.; Liu, A.; Chen, H.; Hu, B.; Luo, Q.; Lin, B.; et al. Polysaccharides from Cordyceps miltaris cultured at different pH: Sugar composition and antioxidant activity. Int. J. Biol. Macromol. 2020, 162, 349–358. [Google Scholar] [CrossRef] [PubMed]
  45. Huang, C.; Sun, C.; Nguyen, M.; Wu, Q.; He, C.; Yang, H.; Tu, P.; Hong, S. Spatio-temporal dynamics of terrestrial Net ecosystem productivity in the ASEAN from 2001 to 2020 based on remote sensing and improved CASA model. Ecol. Indic. 2023, 154, 110920. [Google Scholar] [CrossRef]
  46. Hardoon, D.R.; Szedmak, S.; Shawe-Taylor, J. Canonical Correlation Analysis: An Overview with Application to Learning Methods. Neural Comput. 2004, 16, 2639–2664. [Google Scholar] [CrossRef]
  47. Cleophas, T.J.; Zwinderman, A.H. Bayesian Unpaired T-Test. In Modern Bayesian Statistics in Clinical Research; Cleophas, T.J., Zwinderman, A.H., Eds.; Springer International Publishing: Cham, Switzerland, 2018; pp. 59–68. [Google Scholar]
  48. Ji, Y.; Zhou, G.; Luo, T.; Dan, Y.; Zhou, L.; Lv, X. Variation of net primary productivity and its drivers in China’s forests during 2000–2018. For. Ecosyst. 2020, 7, 15. [Google Scholar] [CrossRef]
  49. Li, Z.; Chen, J.; Chen, Z.; Sha, Z.; Yin, J.; Chen, Z. Quantifying the contributions of climate factors and human activities to variations of net primary productivity in China from 2000 to 2020. Front. Earth Sci. 2023, 11, 1084399. [Google Scholar] [CrossRef]
  50. Wei, X.; Yang, J.; Luo, P.; Lin, L.; Lin, K.; Guan, J. Assessment of the variation and influencing factors of vegetation NPP and carbon sink capacity under different natural conditions. Ecol. Indic. 2022, 138, 108834. [Google Scholar] [CrossRef]
  51. Sun, Y.; Yang, Y.; Zhang, Y.; Wang, Z. Assessing vegetation dynamics and their relationships with climatic variability in northern China. Phys. Chem. Earth Parts A/B/C 2015, 87–88, 79–86. [Google Scholar] [CrossRef]
  52. Yan, Y.; Liu, X.; Wen, Y.; Ou, J. Quantitative analysis of the contributions of climatic and human factors to grassland productivity in northern China. Ecol. Indic. 2019, 103, 542–553. [Google Scholar] [CrossRef]
  53. Jing, P.; Zhang, D.; Ai, Z.; Wu, H.; Zhang, D.; Ren, H.; Suo, L. Responses of Ecosystem Services to Climate Change: A Case Study of the Loess Plateau. Forests 2022, 13, 2011. [Google Scholar] [CrossRef]
  54. Meng, Z.; Liu, M.; Gao, C.; Zhang, Y.; She, Q.; Long, L.; Tu, Y.; Yang, Y. Greening and browning of the coastal areas in mainland China: Spatial heterogeneity, seasonal variation and its influential factors. Ecol. Indic. 2020, 110, 105888. [Google Scholar] [CrossRef]
  55. Brando, P.M.; Paolucci, L.; Ummenhofer, C.C.; Ordway, E.M.; Hartmann, H.; Cattau, M.E.; Rattis, L.; Medjibe, V.; Coe, M.T.; Balch, J. Droughts, Wildfires, and Forest Carbon Cycling: A Pantropical Synthesis. Annu. Rev. Earth Planet. Sci. 2019, 47, 555–581. [Google Scholar] [CrossRef]
  56. Wang, J.; Peng, J.; Zhao, M.; Liu, Y.; Chen, Y. Significant trade-off for the impact of Grain-for-Green Programme on ecosystem services in North-western Yunnan, China. Sci. Total Environ. 2017, 574, 57–64. [Google Scholar] [CrossRef]
  57. Ni, X.; Guo, W.; Li, X.; Li, S. Heterogeneity of Increases in Net Primary Production under Intensified Human Activity and Climate Variability on the Loess Plateau of China. Remote Sens. 2022, 14, 4706. [Google Scholar] [CrossRef]
  58. Gong, H.; Cao, L.; Duan, Y.; Jiao, F.; Xu, X.; Zhang, M.; Wang, K.; Liu, H. Multiple effects of climate changes and human activities on NPP increase in the Three-north Shelter Forest Program area. For. Ecol. Manag. 2023, 529, 120732. [Google Scholar] [CrossRef]
  59. Shi, P.; Zhang, Y.; Ren, Z.; Yu, Y.; Li, P.; Gong, J. Land-use changes and check dams reducing runoff and sediment yield on the Loess Plateau of China. Sci. Total Environ. 2019, 664, 984–994. [Google Scholar] [CrossRef]
  60. Ji, Y.; Yang, L.a.; Dong, Q.; Zhou, S.; Jia, L.; Xun, B. Construction of eco-security model in the agro-pastoral interconnected zone in northern Shaanxi. Ecol. Indic. 2023, 154, 110832. [Google Scholar] [CrossRef]
  61. Shang, X.; He, Z.; Chen, W.; He, L.; Yang, H. Changes and response mechanisms of leaf area index and evapotranspiration in the typical natural landscapes of the Loess Plateau in northern Shaanxi of China under the human intervention. Ecol. Indic. 2023, 154, 110517. [Google Scholar] [CrossRef]
  62. Deb Burman, P.K.; Sarma, D.; Williams, M.; Karipot, A.; Chakraborty, S. Estimating gross primary productivity of a tropical forest ecosystem over north-east India using LAI and meteorological variables. J. Earth Syst. Sci. 2017, 126, 99. [Google Scholar] [CrossRef]
  63. Sun, J.; Wang, Y.; Piao, S.; Liu, M.; Han, G.; Li, J.; Liang, E.; Lee, T.M.; Liu, G.; Wilkes, A.; et al. Toward a sustainable grassland ecosystem worldwide. Innovation 2022, 3, 100265. [Google Scholar] [CrossRef]
  64. Smith, D.; King, R.; Allen, B.L. Impacts of exclusion fencing on target and non-target fauna: A global review. Biol. Rev. 2020, 95, 1590–1606. [Google Scholar] [CrossRef]
  65. Wardle, D.A.; Bonner, K.I.; Barker, G.M.; Yeates, G.W.; Nicholson, K.S.; Bardgett, R.D.; Watson, R.N.; Ghani, A. Plant removals in perennial grassland: Vegetation dynamics, decomposers, soil biodiversity, and ecosystem properties. Ecol. Monogr. 1999, 69, 535–568. [Google Scholar] [CrossRef]
  66. Augustine, D.J.; Derner, J.D.; Fernández-Giménez, M.a.E.; Porensky, L.M.; Wilmer, H.; Briske, D.D. Adaptive, Multipaddock Rotational Grazing Management: A Ranch-Scale Assessment of Effects on Vegetation and Livestock Performance in Semiarid Rangeland. Rangel. Ecol. Manag. 2020, 73, 796–810. [Google Scholar] [CrossRef]
  67. Hou, G.; Wu, S.; Long, W.; Chen, C.; Zhang, Z.; Fang, Y.; Zhang, Y.; Luo, G. Quantitative analysis of the impact of climate change and oasification on changes in net primary productivity variation in mid-Tianshan Mountains from 2001 to 2020. Ecol. Indic. 2023, 154, 110820. [Google Scholar] [CrossRef]
  68. Zhang, L.X.; Zhou, D.C.; Fan, J.W.; Guo, Q.; Chen, S.P.; Wang, R.H.; Li, Y.Z. Contrasting the Performance of Eight Satellite-Based GPP Models in Water-Limited and Temperature-Limited Grassland Ecosystems. Remote Sens. 2019, 11, 1333. [Google Scholar] [CrossRef]
  69. Liu, Y.; Yang, P.; Zhang, Z.; Zhang, W.; Wang, Z.; Zhang, Z.; Ren, H.; Zhou, R.; Wen, Z.; Hu, T. Diverse responses of grassland dynamics to climatic and anthropogenic factors across the different time scale in China. Ecol. Indic. 2021, 132, 108341. [Google Scholar] [CrossRef]
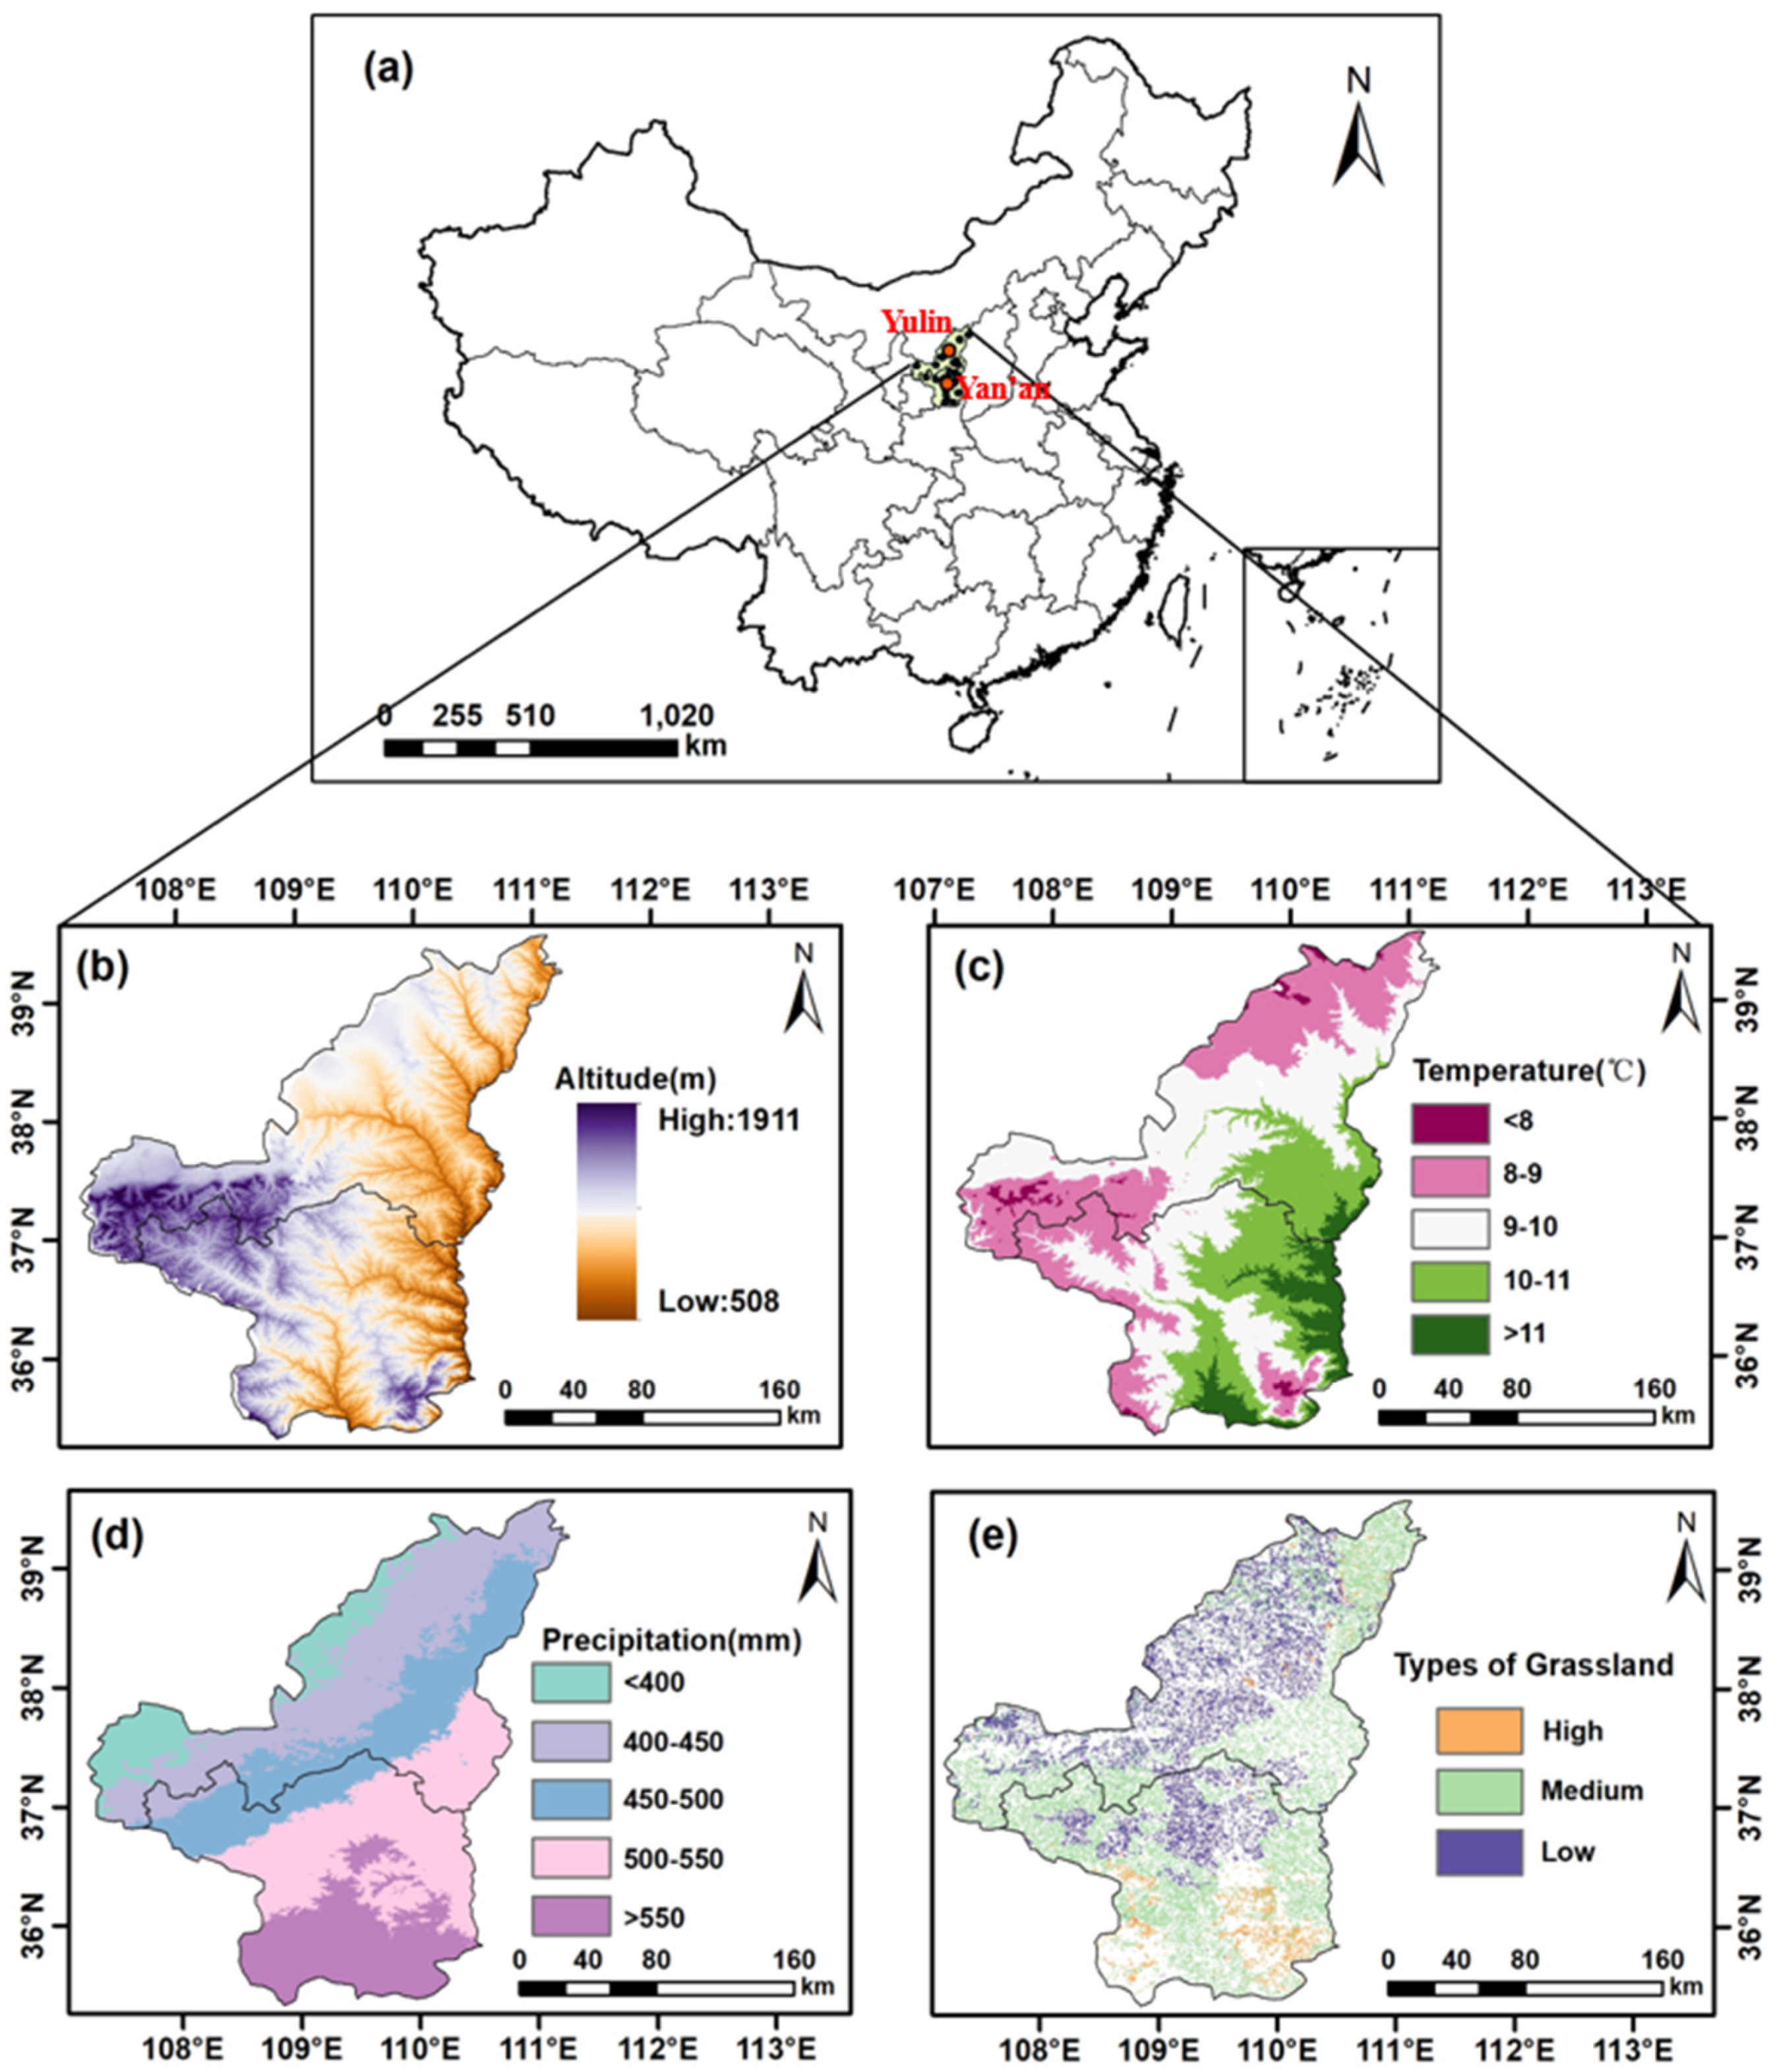
Figure 1. Location of study area: (a) geographical location, (b) elevation, (c) mean annual temperature, (d) mean annual precipitation, and (e) grassland types.
Agronomy 13 02684 g001
Figure 2. Measured and simulated NPP values for grassland in northern Shaanxi Province.
Agronomy 13 02684 g002
Figure 3. The interannual variation of grassland NPP.
Agronomy 13 02684 g003
Figure 4. Spatial distribution of the average grassland NPP.
Agronomy 13 02684 g004
Figure 5. Three types of grassland NPP spatial dynamics and significant test results. (a,d) High-coverage grassland, (b,e) medium-coverage grassland, and (c,f) low-coverage grassland.
Agronomy 13 02684 g005
Figure 6. Fluctuant features and variation coefficient of NPP. (a) High-coverage grassland, (b) medium-coverage grassland, and (c) low-coverage grassland.
Agronomy 13 02684 g006
Figure 7. Spatial distribution of three climate factors and changing rates. (a,d) Temperature, (b,e) precipitation, and (c,f) total radiation.
Agronomy 13 02684 g007
Figure 8. Spatial Partial correlation coefficients and significance between annual NPP, and temperature in high-coverage grassland (a,d), medium-coverage grassland (g,j), and low-coverage grassland (m,p); spatial partial correlation coefficients and significance between annual NPP, and precipitation in high-coverage grassland (b,e), medium-coverage grassland (h,k), and low-coverage grassland (n,q); spatial partial correlation coefficients and significance between annual NPP, and total radiation in high-coverage grassland (c,f), medium-coverage grassland (i,l), and low-coverage grassland (o,r).
Agronomy 13 02684 g008aAgronomy 13 02684 g008b
Figure 9. Significance proportion of partial correlation between NPP and temperature, precipitation and total radiation in high-coverage grassland (a), medium-coverage grassland (b), and low-coverage grassland (c).
Agronomy 13 02684 g009
Figure 10. Spatial patterns of grassland NPP in response to the total radiation, precipitation, and temperature.
Agronomy 13 02684 g010
Figure 11. The variation of land use types from 2000 to 2020 in northern Shannxi.
Agronomy 13 02684 g011
Figure 12. Spatial distributions of NPP residual trends (a). Contributions of climate changes and human activities to the dynamics of grassland NPP (b).
Agronomy 13 02684 g012
Figure 13. Correlation between NPP and human activity factors the output value of agriculture, forestry, animal husbandry, and fishery (AFAHF), area of food crops (AFC), livestock stocking (LS), gross domestic product (GDP), and gross domestic product per capita (PCGDP) in Yulin and Yan’an.
Agronomy 13 02684 g013
Figure 14. Interannual variation characteristics of precipitation (a), temperature (b), and total radiation (c) in 2000–2020.
Agronomy 13 02684 g014
Figure 15. Area of Food Crops (AFC) and Livestock Stocking (LS) in (a) Yulin (b) Yan’an.
Agronomy 13 02684 g015
Table 1. Proportion of variation of NPP in three types of grassland.
DegreeHigh-Coverage GrasslandMedium-Coverage GrasslandLow-Coverage Grassland
I. r < 0, p < 0.01---
II. r < 0, 0.01 < p < 0.05---
III. r < 0, p > 0.05-0.007-
IV. r > 0, p > 0.0599.8699.7299.53
V. r > 0, 0.01 < p < 0.050.120.0780.15
VI. r > 0, p < 0.010.080.1950.32
Table 2. Coefficient of variation of NPP in three types of grassland.
CvLevelHigh-Coverage GrasslandMedium-Coverage GrasslandLow-Coverage Grassland
Cv ≤ 0.05very stable---
0.05 < Cv ≤ 0.10stable0.220.0440.029
0.10 < Cv ≤ 0.15moderate stable5.262.461.59
0.15 < Cv ≤ 0.20unstable58.2419.7812.01
Cv > 0.20very unstable36.2877.7287.37
Cv ≤ 0.05very stable---
Table 3. Summary of partial correlation coefficients.
NPP-FactorHigh-Coverage GrasslandMedium-Coverage GrasslandLow-Coverage Grassland
NPP-Temperature0.0001420.0385110.036305
NPP-Precipitation0.3099810.4279730.486115
NPP-Total radiation0.081790.1913810.286138
Disclaimer/Publisher’s Note: The statements, opinions and data contained in all publications are solely those of the individual author(s) and contributor(s) and not of MDPI and/or the editor(s). MDPI and/or the editor(s) disclaim responsibility for any injury to people or property resulting from any ideas, methods, instructions or products referred to in the content.