Article

Climate Change and an Agronomic Journey from the Past to the Present for the Future: A Past Reference Investigation and Current Experiment (PRICE) Study

1
Crop Research Division, Jeonnam Agricultural Research and Extension Services, Naju 58213, Republic of Korea
2
National Institute of Crop Science, Rural Development Administration, Wanju 55365, Republic of Korea
3
Department of Rural and Bio-system Engineering, Chonnam National University, Gwangju 61186, Republic of Korea
4
AgriBio Institute of Climate Change Management, Chonnam National University, Gwangju 61186, Republic of Korea
5
Department of Applied Plant Sciences, Chonnam National University, Gwangju 61186, Republic of Korea
*
Author to whom correspondence should be addressed.
Agronomy 2023, 13(11), 2692; https://doi.org/10.3390/agronomy13112692
Submission received: 30 September 2023 / Revised: 15 October 2023 / Accepted: 24 October 2023 / Published: 26 October 2023

Abstract

:
According to numerous chamber and free-air CO2 enrichment (FACE) studies with artificially raised CO2 concentration and/or temperature, it appears that increasing atmospheric CO2 concentrations ([CO2]) stimulates crop yield. However, there is still controversy about the extent of the yield stimulation by elevating [CO2] and concern regarding the potential adverse effects when temperature rises concomitantly. Here, we tested the effects of natural elevated [CO2] (ca. 120 ppm above the ambient level in 100 years ago) and warming (ca. 1.7–3.2 °C above the ambient level 100 years ago) on rice growth and yield over three crop seasons via a past reference investigation and current experiment (PRICE) study. In 2020–2022, the rice cultivar Tamanishiki (Oryza sativa, ssp. japonica) was grown in Wagner’s pots (1/2000 a) at the experiment fields of Chonnam National University (35°10′ N, 126°53′ E), Gwangju, Korea, according to the pot trial methodology of the reference experiment conducted in 1920–1922. Elevated [CO2] and temperature over the last 100 years significantly stimulated plant height (13.4% on average), tiller number (11.5%), and shoot biomass (10.8%). In addition, elevated [CO2] and warming resulted in a marked acceleration of flowering phenology (6.8% or 5.1 days), potentially leading to adverse effects on tiller number and grain yield. While the harvest index exhibited a dramatic reduction (12.2%), grain yield remained unchanged with elevated [CO2] and warming over the last century. The response of these crop parameters to elevated [CO2] and warming was highly sensitive to sunshine duration during the period from transplanting to heading. Despite the pot-based observations, considering a piecewise response pattern of C3 crop productivity to [CO2] of <500 ppm, our observations demonstrate realistic responses of rice crops to elevated [CO2] (+120 ppm) and moderate warming (+1.7–3.2 °C) in the absence of adaptation measures (e.g., cultivars and agronomic management practices). Hence, our results suggest that the PRICE platform may provide a promising way to better understand and forecast the net impact of climate change on major crops that have historical and experimental archived data, like rice, wheat, and soybean.

1. Introduction

In 2021, the Intergovernmental Panel on Climate Change (IPCC) [1] released an AR6 reporting that the increase in global surface temperature from 2011–2020 was 1.09 °C higher than that from 1850–1900, reaffirming that the temperature increase was unequivocally caused by increasing greenhouse gases (GHGs) in the atmosphere due to human activities. Both the currently observed and predicted increases in temperatures and GHGs in the atmosphere can differ by region and socioeconomic condition [1]. On the Korean peninsula, the average air temperature has increased by 1.8 °C over the last century (1912–2017) [2], and the [CO2] now exceed 420 ppm [3]. This value is an increase of about 120 ppm compared to the early 1920s [4,5]. Similar increasing patterns of [CO2] and other GHGs are being observed across the globe, and with further global warming, every region is projected to increasingly experience concurrent and multiple changes in climatic impact drivers [1], consequently challenging global food security.
In the food and agricultural sector, studies to tackle the impacts of such climate changes on crop production have increased rapidly since the 1980s. In 1983, Kimball [6] reported in a literature review that C3 agricultural crop yield increased by 33% under the doubling of [CO2] (330 vs. 660 ppm). Since then, there has been an incentive to develop a variety of experimental approaches for studying the effects of increasing [CO2] on agricultural crops worldwide [7,8,9,10,11,12,13,14]. It has been widely reported that experimentally elevated [CO2] and/or temperatures will have a wide range of effects from stimulation to suppression of rice growth processes in sunlit chambers (SC) [15,16,17,18,19], temperature gradient chambers (TGC) [20,21,22,23,24,25], open-top chambers (OTC) [26,27,28], FACE experiments [29,30,31,32,33,34,35,36,37,38,39,40,41,42], free-air temperature increase (FATI) experiments [43], and FACE in combination with elevated temperature (T-FACE) [14,44,45,46].
Meanwhile, there has been a long-standing debate in the scientific community whether different methodologies of CO2 fumigation can lead to a difference in the extent of crop responses to elevated [CO2] [19,47,48,49,50,51,52,53,54,55]. For example, Long et al. [32] reported that elevated [CO2] in FACE experiments enhanced C3 crop yields (e.g., 12–14%) by ca. 50% less than yields in enclosure experiments, which usually have a small scale, as well as some limitations in abiotic and biotic environments. In a recent meta-analysis based on more than 180 independent studies of C3 crops, Ainsworth and Long [42] reported an 18% yield increase in FACE (ca. 200 ppm above ambient) experiments with ample water and nutrients. Allen et al. [19] reported greater oscillating and fluctuating elevated [CO2] in FACE experiments than in chambers and argued that the magnitudes of the [CO2] fluctuations in FACE systems are more than 10-fold higher than those in nature, and hence, exposures to elevated [CO2] in FACE studies are not representative of the exposure to atmospheric elevated [CO2] projected to occur in the future. As they pointed out, these systems for controlling [CO2] and other environments have pros and cons and may be complementary rather than competitive. While all of the previous findings from FACE and sunlit closed/OTC studies represent the facts under the given experimental conditions, they may fall short of the scientific truth. Further research is needed to reach the scientific truth about what will happen in crop production fields under the expected climate change in the future. In addition, we are yet to answer the question of how crop yield will respond to elevated [CO2] and warming in the real world if the crop responses are not limited by currently available technologies [19,32].
As already mentioned above, atmospheric [CO2] and temperature have been increasing steadily for more than a century in Korea [1,2,3]. We thought that the current natural environment under elevated [CO2] and a warmed climate compared with the climate one century ago could be the ideal experimental study for studying crop responses to climate change if we have a robust experimental dataset for crops cultivated over that time. With such an idea, in 2020, we commenced the world’s first project, to our knowledge, to study the responses of rice crops to climate change under the current natural environmental conditions. Because the natural environment is the research facility, we did not need artificial structures in the fields for [CO2] fumigation and temperature control, unlike in FACE [30,31,32,33,34,35,36,37,38,39,40,41,42,43] and chamber [15,16,17,18,19,20,21,22,23,24,25,26,27,28] studies. Instead, we only needed a past reference investigation (‘reference experiment’ hereafter) and current experiment (PRICE). We set three criteria to choose a reference experiment (RE) for a robust and reliable dataset: (1) the RE had to be completed over a sufficient time period (e.g., over 90–100 years) such that there would be obvious differences in atmospheric variables (e.g., [CO2] and temperature) from those at present, (2) the RE had to be replicated in the CE in terms of agronomic practices, and (3) the RE had to be conducted over more than three crop seasons.
In this study, we chose Omae’s study [56] conducted 100 years ago (1920–1922) as the RE because it fulfilled the above criteria, although it was completed using a pot (1/2000 a Wagner’s pot). Considering a piecewise linear response of C3 crop productivity to [CO2] of <500 ppm [15,48,57] and the pros and cons of FACE and chambers [14,15,16,17,18,19,20,21,22,23,24,25,26,27,28,29,30,31,32,33,34,35,36,37,38,39,40,41,42,43,44,45,46], we hypothesized that (1) the increase in [CO2] (ca. +120 ppm) during the last century in Korea will be large enough to make a difference in rice growth and yield between the past RE and CE; (2) the effects of increasing temperature on rice crops will be more realistic in a natural environment than in an experimental warming environment; if so, (3) the PRICE will provide a new and cost-effective approach to quantify the impact of climate change on crop production. To test these hypotheses, we conducted a PRICE study over three rice crop seasons (2020–2022). The objectives of the present study were (1) to examine whether the PRICE performs well in climate change research on crop production and (2) to determine the net effect of climate change over the last century on rice growth and yield in the absence of adaptation measures in cultivars and agronomic practices.

2. Materials and Methods

2.1. Site Descriptions of the PRICE

The sites of the RE and CE were located at the Model Farm (1906–1929) of the Japanese Government-General of Korea, Suwon, Korea (37°26′ N, 126°98′ E) and in the experiment fields of Chonnam National University, Gwangju, Korea (35°10′ N, 126°53′ E), respectively. Both the RE and the CE were conducted in open fields using 1/2000 a Wagner’s pots over three rice growing seasons in 1920–1922 and 2020–2022, respectively. The properties of the soils used for the pot experiment in RE and CE are summarized in Table 1. At both sites, the soils used were from a non-fertilized paddy field cropped for three seasons or longer, and so the contents of total nitrogen (TN) were similar at 0.10–0.11%, while other properties somewhat differed between the RE and CE site. For the RE site, except the TN, and because of the lack of background soil information [58], we presented the oldest soil information on the extant RE site [59,60] in Table 1. The soil series of the RE and CE sites were Gangseo and Seogcheon, respectively, and both were classified based on the soil taxonomy as the coarse loamy, mixed, mesic family of Fluvaquentic Endoaquepts (Table 1). The RE (Suwon) and CE (Gwangju) sites are subjected to the East Asian temperate monsoon climate system with an annual mean temperature/precipitation of 12.6 °C/1322 mm and 14.2 °C/1383 mm over the past 30 years (1991–2020), respectively. At these sites, approximately 55–60% of the annual precipitation occurs in the monsoon season (June to August).

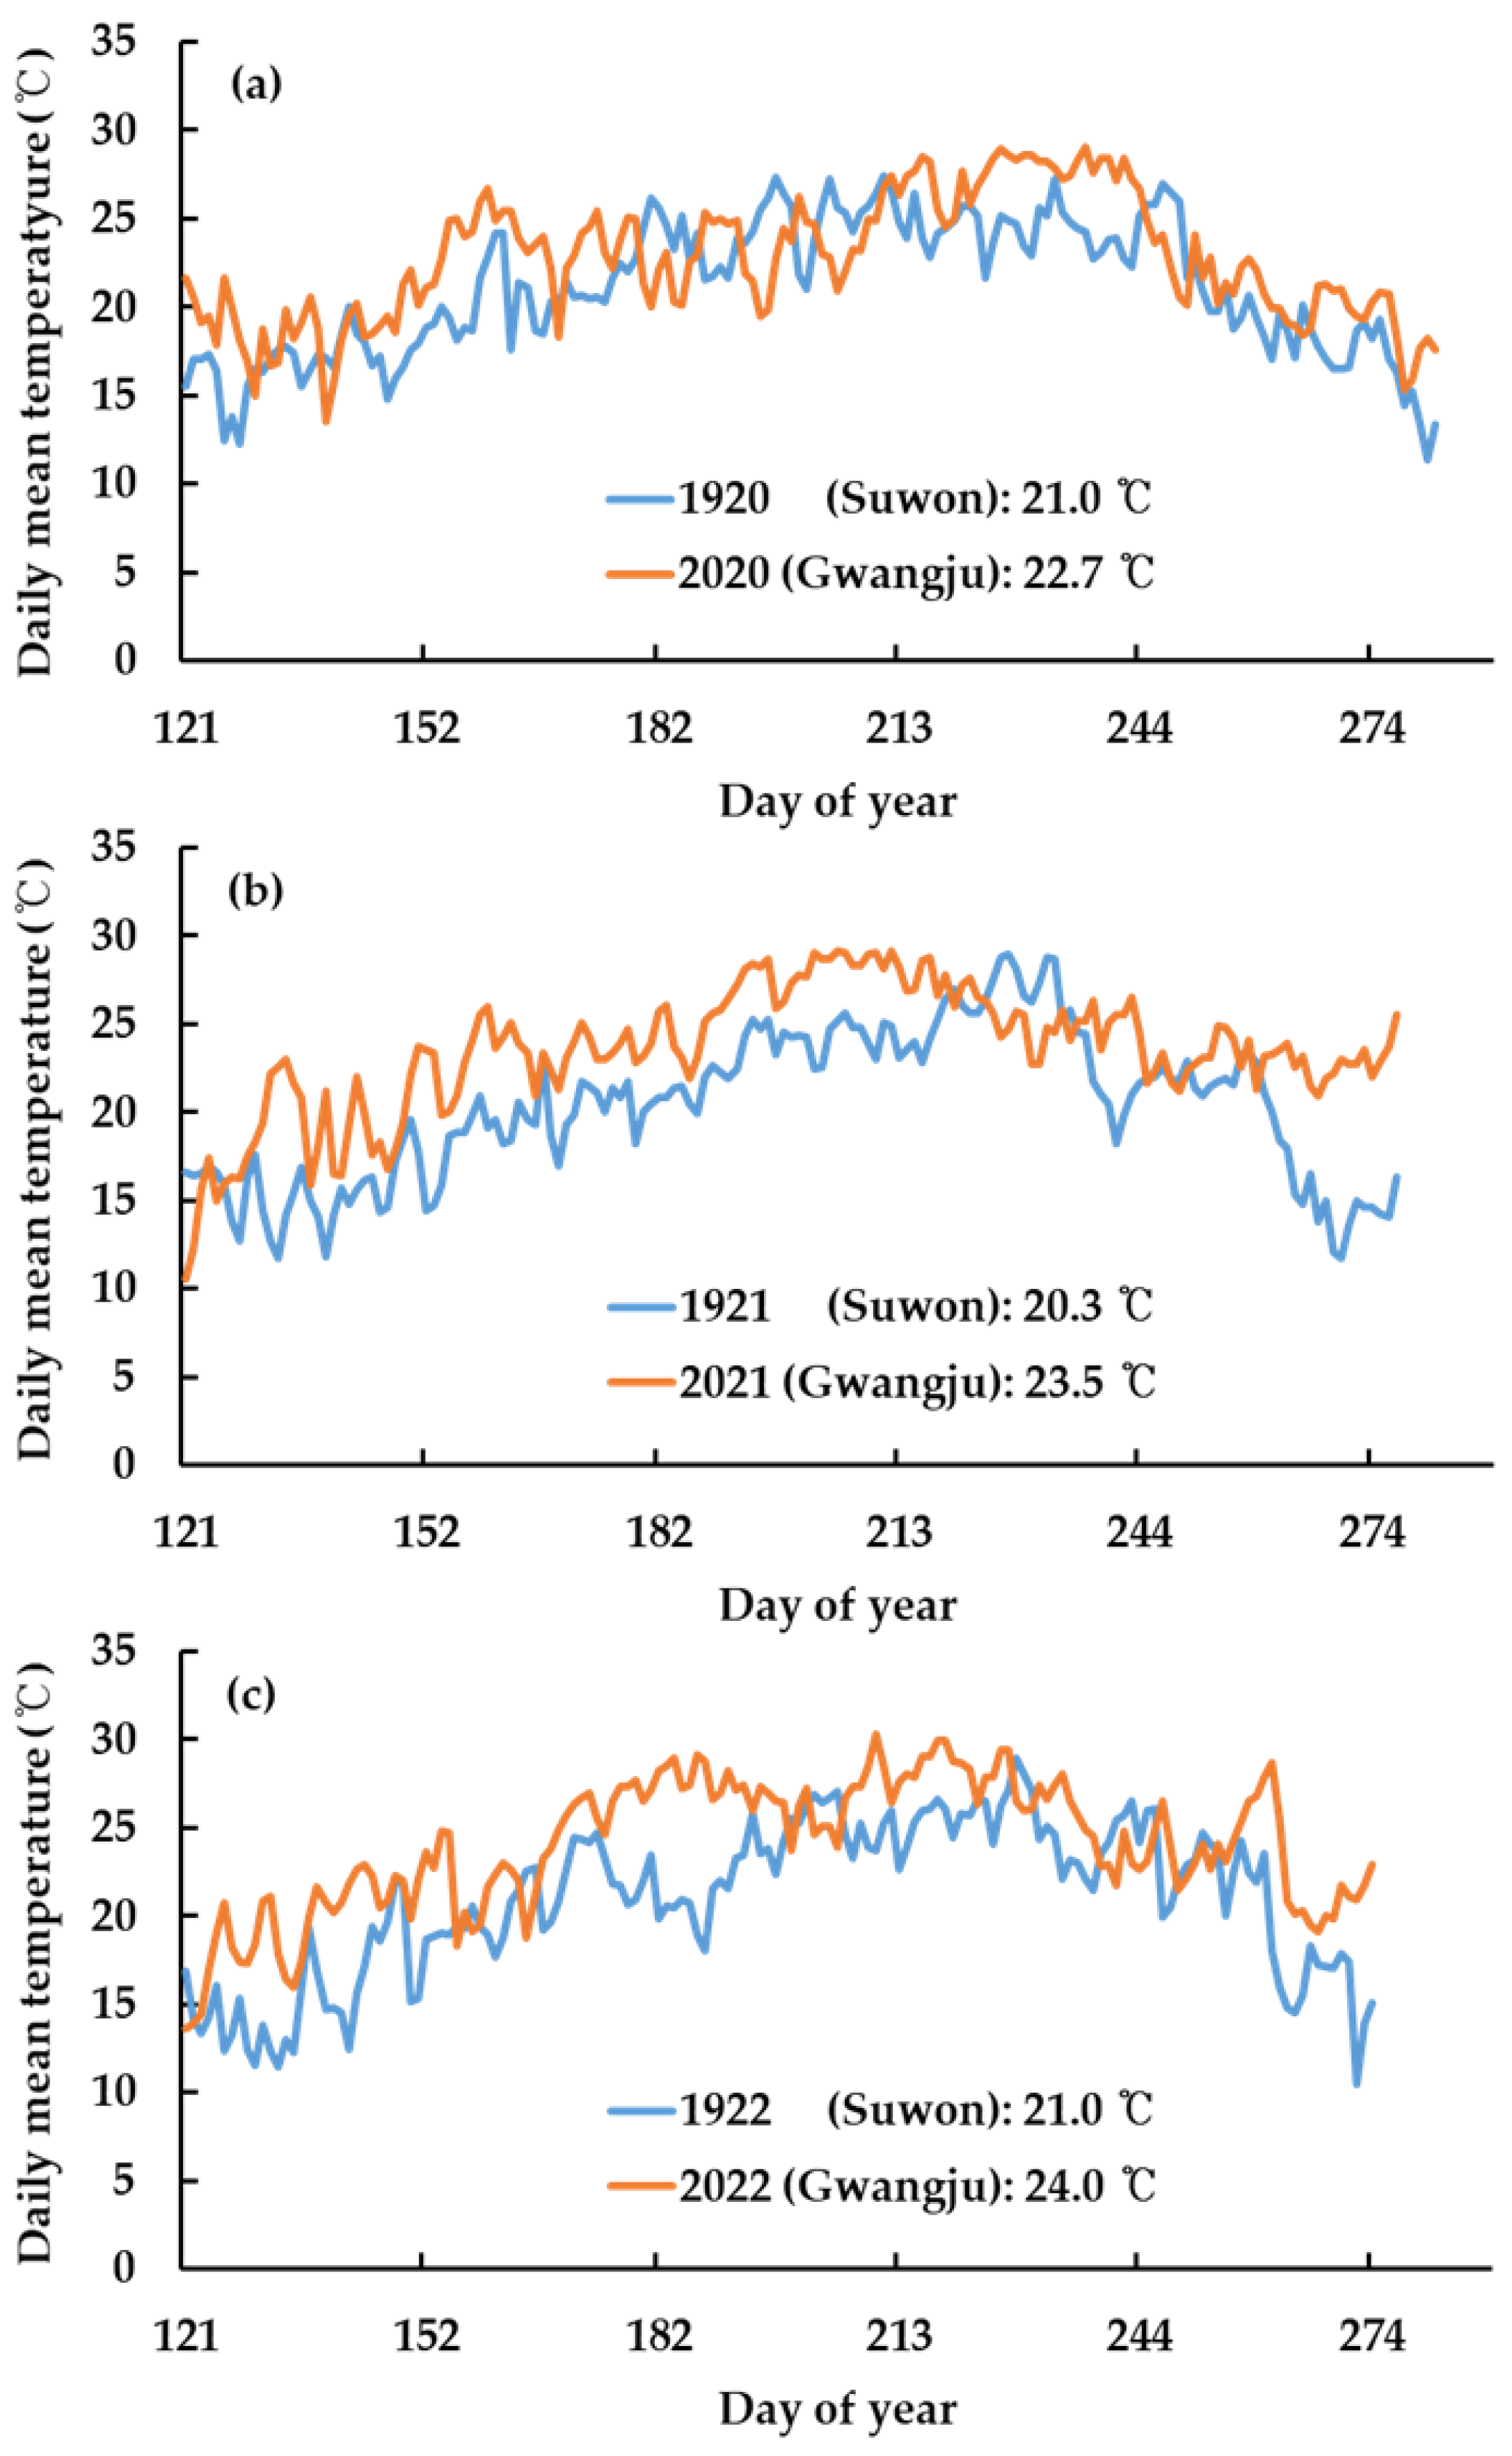
2.2. Atmospheric [CO2] and Temperature in the PRICE

In 1920–1922, when the RE was conducted, the global atmospheric [CO2] was about 300 ppm [4,5]. Since then, the atmospheric [CO2] has continued to increase [1], and it exceeded 420 ppm in 2023 [NOAA; https://gml.noaa.gov/ccgg/trends (accessed on 4 September 2023)]. In Korea, the atmospheric [CO2] exceeded 420 ppm in 2020 [3] when the CE commenced. The [CO2] has thus increased by 120 ppm over the past 100 years. On the Korean peninsula, the average air temperature has increased by 1.8 °C over the last century [2]. In the 1920s, however, no weather observations were made in Suwon where the RE was conducted in 1920–1922. Hence, to create temperature data for the RE site in 1920–1922, we estimated the temperature difference between Suwon and Seoul using both the oldest normal year temperature (1961–1990) available since weather records began at Suwon Station (ID 119, 37°26′ N, 126°98′ E) and the matching temperature (1961–1990) at Seoul Station (ID 108, 37°57′ N, 126°96′ E) from the Korean Meteorological Agency (KMA). Then, using the difference (0.666 °C) obtained by subtracting the temperature in Suwon from the temperature in Seoul, we created the temperature data for Suwon (1920–1922) from the temperatures observed in Seoul (1920–1922). For the CE (2020–2022), the temperature data were observations made at Gwangju Station (ID 156, 35°10′ N, 126°53′ E) of the KMA. This site is near our pot experimental fields (<600 m). The mean temperatures over the rice growing season (May to October) were 21.0, 20.3, and 21.0 °C in Suwon (RE site) in 1920, 1921, and 1922, respectively, and were 22.7, 23.5, and 24.0 °C in Gwangju (CE site) in 2020, 2021, and 2022, respectively (Figure 1). As a result, rice plants in the CE (2020–2022) were grown under a 120 ppm higher [CO2] (ca. 420 ppm) and 1.7–3.2 °C higher temperature (22.7–24.0 °C) compared with 1920–1922 (RE) (Figure 1). At the CE site, over three growing seasons, the daily mean sunshine duration (SD) ranged from 4.7 to 5.4, 3.9 to 5.5, and 4.6 to 5.9 h over the whole season, from transplanting to heading, and from heading to harvest, respectively (Figure 2), while there was no available record for SD at the RE site in the 1920s. Hereafter, we refer to RE in 1920, 1921, 1922, and 1920–1902 as RE1920, RE1921, RE1922, and RE1920–1922 and to CE in 2020, 2021, 2022, and 2020–2022 as CE2020, CE2021, CE2022, and CE2020–2022, respectively.

2.3. Agronomic Practices in the PRICE

The cultivar used (Oryza sativa, ssp. japonica, cv. Tamanishiki) and all agronomic practices in CE2020–2022 fully replicated those performed in RE1920–1922 and are summarized in Table 2. Because the rice cultivar used has not been cultivated in Korea since the 1940s, for the purpose of this study, 50 seeds of Tamanishiki (IT 005697) were distributed by the Plant Germplasm Center, National Institute of Agricultural Sciences, Rural Development Administration, Korea, and then multiplied in paddy fields at the CE site. In RE1920–1922, 15 nitrogen (N) sources (3 inorganic and 12 organic materials) were tested, whereas only 9 N sources (3 inorganic and 6 organic materials) that were able to be procured at the time of this study were used in CE2020–2022, as summarized in Table 3. Organic materials were often used in farmers’ fields as a N source due to a short supply of inorganic N in Korea in the 1920s. For both RE1920–1922 and CE2020–2022, the N application was 0.75 g pot−1 based on the N content of the materials, although the N content of the materials was somewhat different between RE1920–1922 and CE2020–2022. Phosphate and potassium were also supplied at 0.75 g pot−1 in the form of calcium superphosphate and potassium sulfate, respectively (Table 2 and Table 3). The total amount of the three fertilizers was applied as a basal dressing 3 days before transplanting [56].

2.4. Measurements of Crop Parameters and Yield

According to RE1920–1922 [56], on 20 July (ca. maximum tillering stage) and 1 September (ca. early ripening stage), plant height and tiller number were non-destructively measured in CE2020–2022. To determine crop phenology in terms of days to heading (DTH), the number of emerged panicles was counted daily over 10 days. A possible difference in DTH between the RE (Suwon) and CE (Gwangju) sites was adjusted by using the difference (2.1 days) derived from the quadratic regression for the response of DTH to daylength (May to August) at a given temperature [62]. At grain maturity, plants were dug up from the three pots per N source treatment in RE1920–1922 and nine pots in CE2020–2022, and soil was removed from the root systems by running water, and then the shoots were separated from the base of the roots. For all plants, the plant height, number of tillers, and panicles were determined in CE2020–2022 (but not in RE1920–1922), and then the dry mass of the shoot was measured after air drying for 5–6 days under outdoor natural conditions. To determine grain yield, the grains were threshed carefully, and the awns were removed. The fertile grains were selected based on weight using an airflow machine (FV-459, Fujiwara, Tokyo, Japan) in CE2020–2022 and in an unknown way in RE1920–1922. Grain yield was determined as the dry mass of fertile grains per hill after air drying, and the harvest index (HI) was calculated as the grain yield divided by the shoot dry mass after air drying. To quantify the impacts of climate change on rice over the past century, we presented the percentage (%) change in rice growth and yield parameters, defined as the percentage of the crop parameters in CE2020–2022 divided by the matching parameters in RE1920–1922 (Equation (1)):
% Change = [(crop parameter in CE/crop parameter in RE) − 1.0] × 100

2.5. Experimental Design and Statistical Analysis

In RE1920–1922 [56], three pots were allotted per N resource treatment, while nine pots (3 pots × 3 blocks) were used for every matching treatment in CE2020–2022 with a randomized complete block design. In both RE1920–1922 and CE2020–2022, the pots were placed in isolation in natural open fields. Despite the heterogeneity of the N sources, the treatment with the nine N sources could be treated statistically as a block in broad terms because the same amount of N (0.75 g N pot−1) was applied in all N source treatments, as well as phosphate and potassium. The average values of the crop parameters in the N source treatments were used for statistical analysis. A linear mixed model (Equation (2)) was used to estimate the effect of treatment (i.e., RE vs. CE) on the growth and yield parameters of rice grown in pots in natural open fields:
Zij = μ + Bi + Tj + (BT)ij + eij
where Zij is the response variable in block i (= 0, 1, 2,…,9), treatment j (= 0, 1); μ is the overall mean; B and T are the block and treatment, respectively; and eij is the error term. The model was fitted using the restricted maximum likelihood procedure using SAS PROC Mixed (SAS v. 9.4; SAS Institute, Inc., Cary, NC, USA). Treatment means for measured crop parameters were compared using Fisher’s least significant difference (LSD, α = 0.05) when needed. Crop growth and yield parameters were presented as boxplots in which lower and upper bounds represent the first and third quartiles, respectively. Interquartile ranges (space between the first and third quartiles) were plotted with both median and mean values. The percentage change in crop parameters due to treatment (CE2020–2022) was also presented with a 95% confidence interval.

3. Results

3.1. Plant Height and Tiller Number

On 20 July (ca. maximum tillering stage), plant height did not differ significantly between RE1920 and CE2020 and between RE1922 and CE2022 but was greater (6.5%) in CE2021 than in RE1921 (Figure 3a–c), but without significant changes when averaged across the three crop seasons (Figure 3d). However, on 1 September (ca. early ripening stage), when the plant height reached its maximum, it significantly increased in CE2021 and CE2022 compared to RE1921 and RE1922 (Figure 3f,g). On average, plant height ranged from 85.8 to 102.4 cm in RE1920–1922, and from 106.1 to 113.5 cm in CE2020–2022 (Figure 3e–g). When averaged across the three crop seasons, plant height increased by 13.4% in CE2020–2022 compared with RE1920–1922 (Figure 3h).
Tiller number on 20 July did not differ between RE1920–1921 and CE2020–2021, whereas it was greater (49.2%) in CE2022 than in RE1922 (Figure 4a–c), but without significant changes when averaged across the three crop seasons (Figure 4d). On 1 September, however, the tiller number significantly increased by 30.9% in CE2021 and by 21.6% in CE2022 compared with RE1921 and RE1922 (Figure 4f,g), respectively, but decreased in CE2020 (−15.4%, Figure 4e). Tiller number on 1 September, averaged across the three crop seasons, increased by 11.5% in CE2020–2022 compared with RE1920–1922 (Figure 4h).

3.2. Flowering Phenology and Shoot Biomass

Flowering phenology, in terms of DTH, was significantly advanced in CE2020–2022 compared with RE1920–1922 (Figure 5a–c). The magnitude of the advanced DTH in CE2020–2022 ranged from 1.7 days in CE2021 to 8.6 days in CE2020, resulting in an average advancing of 6.8% over the three crop seasons (Figure 5a–d). In CE2020–2022, the DTH was closely associated with SD from transplanting to heading and increased as SD increased (Figure 6). Similar to the tiller number, shoot biomass (after air drying) at the final harvest showed a significant increase in CE2021 (17.6%) and CE2022 (29.2%) compared with RE1921 and RE1922 but decreased in CE2020 (−14.5%) compared with RE1920 (Figure 7a–c). The shoot biomass averaged across the three crop seasons increased by 10.8% in CE2020–2022 relative to RE1920–1922 (Figure 7d).

3.3. Grain Yield and Harvest Index

Overall, grain yield (g hill−1) ranged from 49.7 to 56.1 in RE1920–1922 and from 41.5 to 55.5 in CE2020–2022. In CE 2020, grain yield was lower (19.0%) than that in RE1920 but higher (11.7%; p = 0.08) in CE2021 than in RE1921 and did not differ between RE1922 and CE2022 (Figure 8a–c). The grain yield, on average over the three crop seasons, was not different in CE2020–2022 when compared with RE1920–1922 (Figure 8d). Overall, the HI decreased in CE2020–2022 (range, 0.343–0.396) compared with RE1920–1922 (range, 0.417–0.448) (Figure 9a–c). When averaged across the three crop seasons, the HI decreased by 12.2% in CE2020–2022 relative to RE1920–1922 (Figure 9d).

4. Discussion

Our project began in 2020 as the first of its kind to study the responses of rice crops to climate change under the current natural environmental conditions. Here, in this study, we performed a novel experiment, which we have called the PRICE. Our results revealed a significant change in rice phenotypic traits, biomass, and HI, but not in grain yield over the last 100 years under the substantial increase in atmospheric [CO2] (ca. +120 ppm) and temperature (ca. +1.7–3.2 °C). We found that such changes in crop parameters can be susceptible to natural weather conditions like SD, with the direction of the changes varying from negative to positive. We discuss what has happened to the rice phenotypic traits, biomass, and yield parameters over the last 100 years, as well as what is required to successfully adapt to climate change in order to secure food production and supply in the future. For convenience, we defined the increased [CO2] of 120 ppm and temperature of 1.7–3.2 °C in CE2020–2022 relative to those in RE1920–1922 [56] as elevated [CO2] and warming.

4.1. Changes in Rice Phenotypic Traits over the Last 100 Years

Plant height is one of the important phenotypic traits closely associated with lodging tolerance and, thus, in turn, with stable rice production and quality. Over the last 100 years, maximum plant height has increased on average by 13.4% with a narrow 95% confidence interval (Figure 3h). The increase in plant height was significantly greater when climatic warming across seasons increased by 3.0–3.2 °C (CE2021–2022) than by 1.7 °C (CE2020; Figure 3e–g). This suggests that rising temperatures are probably the greater contributor to the increased plant height than increasing [CO2], which could practically be constant (422.5 ± 2.5 ppm) over CE2020–2022, even if recent increasing trends (ca. 2.5 ppm year−1) are considered [3]. Elevated [CO2] (+120 ppm) over the 100 years, however, could also more or less contribute to the increased plant height because increasing [CO2] is predicted to increase plant temperature by decreasing latent heat loss due to the reduced stomatal conductance under elevated [CO2] [63,64]. A number of factors are likely to affect the plant height of rice under elevated [CO2] and/or temperature [18,24,36,38,39,41]. For example, the plant height of a high-yielding hybrid and indica rice increased by 4.5–6.1% in FACE under elevated [CO2] (+200 ppm) [37,39], but not in japonica rice in both FACE [40] and chambers [18,24]. It appears that there would be a significant difference in the plant height response to elevated [CO2] among cultivars [39]. A recent meta-analysis [41] showed that rice plant height increased by 4.0% across cultivars with elevated [CO2] (e.g., +200 ppm) in FACE studies. In chamber studies [18,24], however, there was only a temperature effect on plant height; there was no [CO2] effect and no combined effect of [CO2] and temperature on plant height. Zaher et al. [24] also reported a significant increase (18%) and non-significant increase (6–7%) in rice plant height under separate warming (4.0 °C) and elevated [CO2] (200 ppm elevation, i.e., 615 ppm) treatments in chambers. Plant height is most likely more temperature-sensitive than [CO2]-sensitive across rice cultivars. In addition, we empirically observed that mature plants were often on the verge of lodging throughout CE2020–2022. Hence, it is important that going forward, rice breeding programs devote a substantial effort to reduce the risk of plant lodging in order to cope with a warming world.
It is well documented that elevated [CO2] has the potential to increase the tiller number of rice plants [15,30,34,39,41], and the tiller number is one of the most important phenotypic traits. It determines the panicle number per hill or unit area and, in turn, eventually determines spikelet density and grain yield [31,35,36,37,38,49]. Our results showed that elevated [CO2] (+120 ppm) and warming (+1.7–3.2 °C) over the last 100 years have altered the tiller number, leading to an 11.5% increase (averaged across three crop seasons) when determined at the early ripening stage (1 September) (Figure 4e–h). The magnitude of the response to elevated [CO2] and warming appeared to be overall in line with observations (e.g., 5–11%) made in FACE studies [30,39,41], despite heterogeneities in [CO2], growth temperatures, N applications, cultivars, and crop stages. However, both a far greater enhancement (e.g., 30%) than a 5–11% increase under FACE [34] and an unchanged or moderately enhanced tiller number (e.g., 12–16%) under elevated [CO2] in OTC [27] and TGC [24] studies have been reported. Such reports may further indicate that the tiller number of rice can also be susceptible to uncharted factors besides those mentioned above. For example, in CE2020, the lack of response of the tiller number (Figure 4a,d,e,h) at maximum tillering (e.g., unchanged) and at early ripening (e.g., −15.4%) to elevated [CO2] (+120 ppm) and warming (+1.7 °C) was most likely due to a low daily SD (especially from transplanting to heading), which was 31–41% less than that in CE2021–2022 (Figure 2). If so, this may have significant implications such that the beneficial effect of elevated [CO2] on the tiller number of rice [15,30,33,39,41] could be offset or even negated by a moderate temperature rise (e.g., +1.7 °C) under low sunshine conditions [23]. Climate change involves increasing temperatures but is also likely to alter precipitation patterns that sometimes cause very low sunshine [1]. Therefore, future research trajectories that incorporate such extreme events are needed to improve the resilience of food production systems to climate change [23].
Over the last 100 years, one of the most prominent changes in rice phenotypic traits was the phenological acceleration of flowering (Figure 5a–d). Our results demonstrated that elevated [CO2] and warming led to a reduced DTH (6.8%, 5.1 days) averaged across CE2020–2022. Interestingly, the response of DTH to elevated [CO2] and warming was greater as SD decreased during the period from transplanting to heading and was most noticeable in CE2020, which had the lowest SD (3.9 h) and a 0.8–1.3 °C lower temperature relative to those in CE2021–2022 (Figure 2 and Figure 5a–d). Perhaps this suggests that the SD (from transplanting to heading) may have a predominant effect on the flowering phenology of rice over the growth temperature when SD is extremely limited (Figure 7). Many studies have reported that rising temperatures resulted in a shortening of the rice DTH period [14,20,65,66,67]. In China, for example, rice phenology (e.g., from emergence to heading) was advanced by 2.9 days per °C rise [66], and the DTH was shortened by 0.4–4.0 days per °C rise during 1980–2010 [65]. In California, rice crop duration from planting to heading was shortened by 1.9 days per °C rise according to satellite-based observations [67]. It is also well documented that elevated [CO2] has the potential to reduce DTH [36,37,39,44], but the [CO2] effect seems small relative to the temperature effect [14,39]. High-yielding indica and hybrid rice shown an unchanged DTH even when exposed to elevated [CO2] (ca. +200 ppm) under FACE [35,38]. FACE experiments conducted by Cai et al. [14] showed that elevated [CO2] (ca. +200 ppm), increased temperature (e.g., 1.5–2.0 °C), and their combinations decreased DTH by 1–2 days (1.3–2.5%), 3 days (3.8%), and 4–5 days (5.0–6.3%), respectively. Overall, our PRICE result regarding rice flowering phenology was thought to well reflect the effects of rising temperatures, elevated [CO2], and their interactions on rice flowering phenology.

4.2. Changes in Rice Shoot Biomass, Grain Yield, and HI over the Last 100 Years

Crop biomass is a result of photosynthesis and the consumption of respiratory carbon (C), and these eco-physiological processes are highly [CO2]- and temperature-dependent [57]. It has been well documented that elevated [CO2] stimulates the shoot biomass of rice crops not only in chambers [15,20,22,24,26,27,68] but also in FACE experiments [30,32,33,37,38,39,41,44], although the extent of the [CO2]-induced stimulations varies between chambers and FACE studies [19,32,47,48,49,53,54,55,68]. Our PRICE results revealed that elevated [CO2] and warming over the last 100 years have resulted in a 10.8% increase in rice shoot biomass (air-dried) at harvest when averaged across three seasons (Figure 8a–d). The magnitude of the shoot biomass caused by elevated [CO2] and warming was somewhat small when compared with the 12–16% observed in FACE studies [30,32,34,39], and 17–40% in chambers [20,22,24,26]. In most cases, the FACE and chamber experiments used 200 and 300 ppm above ambient, respectively, as elevated [CO2] [47,48,68]. Apart from anything else, taking into account the gap in [CO2] fumigation [47,48,68] and a piecewise linear response of C3 crop productivity to [CO2] at <500 ppm [15,48,57], our results exhibiting a 10.8% increase in shoot biomass under elevated [CO2] (+120 ppm) with warming (1.7–3.2 °C) are thought to be a realistic change over the last 100 years. In a recent meta-analysis of FACE studies, Hu et al. [42] reported a 19% increase in the shoot biomass of hybrid and high-yielding indica rice, which had a large response (e.g., 30%) to elevated [CO2] (+200 ppm), and for inbred japonica rice. However, contrasting results have often been reported with respect to temperature and/or the combined effects of [CO2] and temperature on shoot biomass [22,23,24,27,44]. Some studies report negative [27,44] or positive [22,24] temperature effects, and others report negative [24,44] or positive [22] interactions in chambers [22,24,27] and in FACE combined with rising temperature [44]. In a meta-analysis, Bishop et al. [69] reported that the biomass of C3 crop plants (e.g., seven species, including rice) had a linear relationship with the growth temperature in OTC but not in FACE studies (eight species, including rice). Here, in our study, the shoot biomass responded in a similar manner to that of tiller number to elevated [CO2] and warming (Figure 4 and Figure 7), indicating that the increased shoot biomass due to elevated [CO2] and warming over the last 100 years largely resulted from the increased tiller number. Especially, the shoot biomass in CE2020 well mirrored the reduced tiller number, which was probably caused by the short SD (31–41% compared with CE2021–2022) during the period from transplanting to heading, resulting in a 14.5% decrease relative to RE1920 (Figure 7a,d). Choi et al. [23] reported that a short SD could even offset a positive effect of moderate warming (e.g., 1.2–2.4 °C) on the shoot biomass of rice, and, moreover, could eliminate the positive interaction between warming and elevated [CO2]. An increase in respiratory C consumption is a commonly predicted result of warming with a lack of sunlight [26,57], possibly suggesting that the negative responses of the tiller number and shoot biomass to moderate warming (1.7 °C) with short SD in CE2020 are likely to have resulted from greater respiratory C consumption [18,70,71]. Consequently, the increased respiratory C consumption with warming in CE2020 is likely to have negated the positive interaction between elevated [CO2] and warming on tiller number and shoot biomass, as observed in CE2021–2022 (Figure 4f–h and Figure 7b–d). Hence, our results suggest that elevated [CO2] (ca. +120 ppm) and warming (ca. 1.7–3.2 °C) over the last 100 years could not only have an advantage for shoot biomass but could also have the potential to cancel or negate the advantage by stimulating respiratory C consumption under short SD conditions.
Because rice grain yield can be defined as shoot biomass × HI, unless there is a dramatic change in HI, it was expected that grain yield would increase about as much as shoot biomass (e.g., 10.8%) with elevated [CO2] and warming over the last century. Contrary to expectations, however, our results revealed that grain yield remained unchanged with elevated [CO2] and warming when averaged across three seasons (Figure 8a–d), and HI decreased dramatically (Figure 9a–d) even though there was no warming-induced spikelet sterility [21,68,72,73]. Some TGC experiments showed that extreme heatwaves during the flowering stage cause spikelet sterility in rice, potentially leading to a cancelling of the stimulation of grain yield by elevated [CO2] [21,68,72,73]. The rice cultivar Tamanishiki used in this study is an old conventional japonica rice, which was once widely cultivated in Korea around 1920–1940s and has a low yield potential of about 350–420 g m−2 under ample N supply [58] compared to the yield potential of more than 700 g m−2 in the latest japonica rice cultivars released in Korea [24], Japan [37,39], and China [33]. In general, it is most likely that rice cultivars with a high-yielding potential have a greater yield response to FACE (+200 ppm), as reported in indica and hybrid rice, which displayed a yield increase greater than 30% [35,36,37]. However, the [CO2]-induced yield increase in some conventional rice cultivars, which were released 90–140 years ago and have lower yield potential, was as high as 19–30% under FACE and modern agronomic management [39] and was comparable to that in modern cultivars or hybrid rice. Therefore, the negligible yield response of our old rice cultivar to elevated [CO2] and warming is unlikely to be directly associated with the low yield potential of the cultivar. Rather, this could be directly associated with a seasonally unbalanced nutrient availability [30,31] and other likely problems [74], as will be further discussed later. Taken together, our results suggest that modern crop management practices (i.e., adaptation) to sink capacity are likely much better able to parlay elevated [CO2] into yield increases than the traditional practices (i.e., non-adaptation) we used in this study, as well as modern elite cultivars.
Conversely, in CE2020, the reduced grain yield (ca. 19.0%) can most likely be explained by the reduced tiller number (15.4%; Figure 4e,h) and shoot biomass (14.5%) caused by short SD (3.9 h, 31–41% less than that in CE2021–2022) during the period from transplanting to heading, when the productive tiller number and the potential shoot biomass are determined. When the SD exceeded 5 h (Figure 2), however, the grain yield showed either a marginal increase (11.7%; p = 0.084) with the SD of 5.5 h in CE2021 (Figure 8b,d) or remained unchanged with the SD of 5.1 h in CE2022 (Figure 8c,d). This probably indicates that the SD is one of the key weather variables limiting the potential beneficial effect of elevated [CO2] on rice yield. In addition, the changes in grain yield varied in a similar manner to those in DHT and tiller number (Figure 4e–h and Figure 5a–d), suggesting a potential adverse effect of the accelerated crop phenology on grain yield under elevated [CO2] and warming as well. More interestingly, we found a significant reduction in HI (12.2% on average), whereas grain yield remained unchanged over the last 100 years. Given that the tiller number and shoot biomass increased over the last 100 years, this result suggests that there might not be enough sink capacity (e.g., spikelet density, size, or its physiological activity) to accommodate the extra biomass (i.e., photosynthates) produced with elevated [CO2] and warming over the last century. There may be two reasons for the limited sink capacity: (1) late-season nutrient limitations due to basal dressing only of total nutrients (in accordance with RE1920–1922), which is highly likely to cause vigorous early growth but a negative effect on subsequent growth, (2) root growth restriction by the limited pot volume. Because we used a large pot (1/2000 a) in CE2020–2022 in accordance with RE1920–1922, there was unlikely to be a heavy constraint on rice root growth as in small pots (1/5000 a) [74]. Hence, the first reason is now thought to be more reasonable than the second one.
It is well known that the key contributor to rice yield increase under elevated [CO2] (200–300 ppm above ambient) is the increased spikelet density (i.e., sink capacity) [15,21,33,35,36,37,38,39,40,49]. Nevertheless, the increased spikelet density is unlikely necessary to ensure a high HI under elevated [CO2] [29,31]. This is probably associated with the advanced crop phenology under elevated [CO2] [36,37,39,44], which usually leads to a reduced photosynthetic ability late in the growing season [17,30,34], and eventually results in a negative effect on HI [29,31]. Especially, the HI under elevated [CO2] shows a greater reduction under low N availability than under moderate or high N availability [29,31]. In addition, a rising temperature has a great potential to reduce HI under elevated [CO2] by causing a spikelet density reduction, spikelet sterility, low filled-grain percentage, and low grain mass [21,40,44,45]. In recent FACE studies, some striking results showed that even when the temperature was elevated by only a 1.4 °C, rice yield significantly decreased by 4–21% due to the reduced spikelet density, whereas it increased by 13–15% in FACE with ambient temperature [44,45]. Likewise, elevated [CO2] in combination with even a moderate temperature increase (e.g., 1–2 °C) appeared to cause a significant reduction in the [CO2] fertilization effect on grain yield, which decreased from 16.7 to 10.1% due to the negative responses of the filled-grain percentage and grain mass [40]. In this study, although we observed a significant reduction in HI (12.2%), no warming-induced spikelet sterility that could cause an HI reduction was found under elevated [CO2] (+120 ppm) and warming (+1.7–3.2 °C). However, there was likely a combined effect of elevated [CO2] and warming on flowering phenology (i.e., DTH), which was significantly advanced (6.8%), as discussed earlier, and as a result, the shortened crop duration may have adversely affected grain filling and, in turn, HI and grain yield [37].

5. Conclusions

Our results clearly revealed that elevated [CO2] (+120 ppm) and warming (+1.7–3.2 °C) over the last 100 years have increased rice plant height by 13.4%, tiller number by 11.5%, and shoot biomass by 10.8%, and have accelerated rice flowering phenology by 6.8% when averaged across three crop seasons. While grain yield remained unchanged with the elevated [CO2] and warming over the last century, HI decreased dramatically (12.2%) even without an extreme event, like warming-induced spikelet sterility. More interestingly, the extent to which elevated [CO2] and warming affected these crop parameters was highly sensitive to the SD during the period from transplanting to heading, ranging from −15.4% to +21.6–30.9% in tiller number and from −14.5% to +17.6–29.2% in shoot biomass. Despite the pot-based observations, considering a piecewise linear response pattern of C3 crop productivity to [CO2] (<500 ppm), our observations demonstrated realistic responses of rice crops to elevated [CO2] (+120 ppm) and moderate warming (+1.7–3.2 °C) in the absence of adaptation measures (e.g., cultivars and agronomic practices). Hence, our results suggest that the PRICE platform may provide a promising way to better understand and forecast the net impact of climate change on major crops that have historical and experimental archived data, like rice, wheat, and soybean, without the requirements for a facility and its running costs, as in FACE and chamber experiments. Nevertheless, the PRICE platform has a drawback when historical and experimental archived data are limited because this makes it hard to make a proper comparison between current and reference results.

Author Contributions

H.-Y.K. conceptualized the study and designed an outline; H.M. prepared the original draft; H.-S.L., B.-K.H. and C.-K.L. co-organized the project, W.-J.C., H.L., J.K., J.C., S.-H.S., K.-N.A., D.-K.K. and O.-D.K. critically reviewed, edited, and finalized the manuscript. All authors have read and agreed to the published version of the manuscript.

Funding

This research was supported by a Cooperative Research Program for Agricultural Science & Technology Development (Project No. PJ01501302 & RS-2020-RD-009243) funded by the Rural Development Administration, Korea.

Data Availability Statement

Not applicable.

Acknowledgments

The authors would like to thank the Institute for Agricultural Practices Education of Chonnam National University for supporting general field management. The authors would also like to acknowledge the Korean Meteorological Administration for opening the meteorological data portal.

Conflicts of Interest

The authors have no conflict of interest relevant to this study to disclose.

References

  1. IPCC. Climate Change 2021: The Physical Science Basis. In Contribution of Working Group I to the Sixth Assessment Report of the Intergovernmental Panel on Climate Change; Masson-Delmotte, V., Zhai, P., Pirani, A., Connors, S.L., Péan, C., Berger, S., Caud, N., Chen, Y., Goldfarb, L., Gomis, M.I., et al., Eds.; Cambridge University Press: Cambridge, UK; New York, NY, USA, 2021. [Google Scholar]
  2. KMA. Korean Climate Change Assessment Report 2020: Summary for Policymakers. In The Physical Science Basis; Kim, N.W., Lee, J.H., Cho, G.H., Kim, S.H., Eds.; Korean Meteorology Administration: Seoul, Republic of Korea, 2020; ISBN 978-89-654715-7-9. [Google Scholar]
  3. NIMS. Report of Global Atmosphere Watch 2022: The Greenhouse Gases. In Atmospheric CO2 Concentrations; Lee, S.R., Lee, S.J., Kim, J., Eds.; National Institute of Meteorological Sciences: Jeju-do, Republic of Korea, 2023; pp. 6–13. ISBN 11-1360000-000991-10. [Google Scholar]
  4. Neftel, A.; Moor, E.; Oeschger, H.; Stauffer, B. Evidence from polar ice cores for the increase in atmospheric CO2 in the past two centuries. Nature 1985, 315, 45–47. [Google Scholar] [CrossRef]
  5. Etheridge, D.M.; Steele, L.P.; Langenfelds, R.L.; Francey, R.J.; Barnola, J.-M.; Morgan, V.I. Historical CO2 records from the Law Dome DE08, DE08-2, and DSS ice cores. In Trends a Compendium of Data on Global Change; Carbon Dioxide Information Analysis Centre, Oak Ridge National Laboratory, US Department of Energy: Oak Ridge, TN, USA, 1998. [Google Scholar]
  6. Kimball, B.A. Carbon dioxide and agricultural yield: An assemblage and analysis of 430 prior observations. Agron. J. 1983, 75, 779–788. [Google Scholar] [CrossRef]
  7. Allen, L.H.; Boote, K.J.; Jones, J.W.; Jones, P.H.; Valle, R.R.; Acock, B.; Rogers, H.H.; Dahlman, R.C. Response of vegetation to rising carbon dioxide: Photosynthesis, biomass, and yield of soybean. Glob. Biogeochem. Cycles 1987, 1, 1–14. [Google Scholar] [CrossRef]
  8. Allen, L.H. Free-air CO2 enrichment field experiments: An historical overview. Crit. Rev. Plant Sci. 1992, 11, 121–134. [Google Scholar] [CrossRef]
  9. Horie, T.; Nakagawa, H.; Nakano, J.; Hamotani, K.; Kim, H.Y. Temperature gradient chambers for research on global environment change. III. A system designed for rice in Kyoto, Japan. Plant Cell Environ. 1995, 18, 1064–1069. [Google Scholar] [CrossRef]
  10. Moya, T.B.; Ziska, L.H.; Weldon, C.; Quilang, J.E.P.; Jones, P. Microclimate in open-top chambers: Implications for predicting climate change effects on rice production. Trans. ASABE 1997, 40, 739–747. [Google Scholar] [CrossRef]
  11. Leadley, P.W.; Niklaus, P.; Stocker, R.; Körner, C. Screen-aided CO2 control (SACC): A middle ground between FACE and open-top chambers. Acta Oecol. 1997, 18, 207–219. [Google Scholar] [CrossRef]
  12. Okada, M.; Lieffering, H.; Nakamura, H.; Yoshimoto, M.; Kim, H.Y.; Kobayashi, K. Free-air CO2 enrichment (FACE) using pure CO2 injection: System description. New Phytol. 2001, 150, 251–260. [Google Scholar] [CrossRef]
  13. Kimball, B.A.; Conley, M.M.; Wang, S.; Lin, X.; Luo, C.; Morgan, J.; Smith, D. Infrared heater arrays for warming ecosystem field plots. Glob. Chang. Biol. 2008, 14, 309–320. [Google Scholar] [CrossRef]
  14. Cai, C.; Yin, X.; He, S.; Jiang, W.; Si, C.; Struik, P.C.; Luo, W.; Li, G.; Xie, Y.; Xiong, Y.; et al. Responses of wheat and rice to factorial combinations of ambient and elevated CO2 and temperature in FACE experiments. Glob. Chang. Biol. 2016, 22, 856–874. [Google Scholar] [CrossRef]
  15. Baker, J.T.; Allen, L.H.; Boote, K.J. Growth and yield response of rice to carbon dioxide concentration. J. Agri. Sci. 1990, 115, 313–320. [Google Scholar] [CrossRef]
  16. Baker, J.T.; Allen, L.H.; Boote, K.J. Temperature effects on rice at elevated CO2 concentration. J. Exp. Bot. 1992, 43, 959–964. [Google Scholar] [CrossRef]
  17. Sakai, H.; Yagi, K.; Kobayashi, K.; Kawashima, S. Rice carbon balance under elevated CO2. New Phytol. 2001, 150, 241–249. [Google Scholar] [CrossRef]
  18. Cheng, W.; Sakai, H.; Yagi, K.; Hasegawa, T. Interactions of elevated [CO2] and night temperature on rice growth and yield. Agri. For. Met. 2009, 149, 51–58. [Google Scholar] [CrossRef]
  19. Allen, L.H.; Kimball, B.A.; Bunce, J.A.; Yoshimoto, M.; Harazono, Y.; Baker, J.T.; Boote, K.J.; White, J.W. Fluctuations of CO2 in Free-Air CO2 Enrichment (FACE) depress plant photosynthesis, growth, and yield. Agric. For. Meteorol. 2020, 284, 107899. [Google Scholar] [CrossRef]
  20. Kim, H.-Y.; Horie, T.; Nakagawa, H.; Wada, K. Effects of elevated CO2 concentration and high temperature on growth and yield. 1. The effect on development, dry matter production and some growth characteristics. Jpn. J. Crop Sci. 1996, 65, 634–643. [Google Scholar] [CrossRef]
  21. Kim, H.-Y.; Horie, T.; Nakagawa, H.; Wada, K. Effects of elevated CO2 concentration and high temperature on growth and yield. 2. The effect on yield and its components of Ahihikari rice. Jpn. J. Crop Sci. 1996, 65, 644–651. [Google Scholar] [CrossRef]
  22. Kim, H.-Y.; Lim, S.-S.; Kwak, J.-H.; Lee, D.-S.; Lee, S.-M.; Ro, H.-M.; Choi, W.-J. Dry matter and nitrogen accumulation and partitioning in rice (Oryza sativa L.) exposed to experimental warming with elevated CO2. Plant Soil 2011, 342, 59–71. [Google Scholar] [CrossRef]
  23. Choi, W.J.; Lee, M.S.; Choi, J.E.; Yoon, S.; Kim, H.-Y. How do weather extremes affect rice productivity in a changing climate? An answer to episodic lack of sunshine. Glob. Chang. Boil. 2013, 19, 1300–1310. [Google Scholar] [CrossRef]
  24. Zaher, M.A.B.; Kumagai, E.; Yabiku, T.; Nakajima, M.; Matsunami, T.; Matsuyama, N.; Thinh, N.C.; Hasegawa, T.; Kawasaki, M. Effects of elevated atmospheric CO2 concentration on growth and photosynthesis in eddo at two different air temperatures. Plant Prod. Sci. 2021, 24, 363–373. [Google Scholar] [CrossRef]
  25. Oh-e, I.; Saitoh, K.; Kuroda, T. Effects of high temperature on growth, yield and dry-matter production of rice grown in the paddy field. Plant Prod. Sci. 2007, 10, 412–422. [Google Scholar] [CrossRef]
  26. Ziska, L.H.; Namuco, O.; Moya, T.; Quilang, J. Growth and yield response of field-grown tropical rice to increasing carbon dioxide and air temperature. Agron. J. 1997, 89, 45–53. [Google Scholar] [CrossRef]
  27. Chaturvedi, A.K.; Bahuguna, R.N.; Shah, D.; Pal, M.; Jagadish, S.V.K. High temperature stress during flowering and grain filling offsets beneficial impact of elevated CO2 on assimilate partitioning and sink strength in rice. Sci. Rep. 2017, 7, 8277. [Google Scholar] [CrossRef] [PubMed]
  28. Zhang, C.; Li, Y.; Yu, Z.; Wang, G.; Liu, X.; Liu, J.; Liu, J.; Zhang, X.; Yin, K.; Jin, J. Co-elevation of atmospheric [CO2] and temperature alters photosynthetic capacity and instantaneous water use efficiency in rice cultivars in a cold-temperature region. Front. Plant Sci. 2022, 13, 1037720. [Google Scholar] [CrossRef]
  29. Kim, H.-Y.; Lieffering, M.; Miura, S.; Kobayashi, K.; Okada, M. Growth and nitrogen uptake of CO2-enriched rice under field conditions. New Phytol. 2001, 150, 223–229. [Google Scholar] [CrossRef]
  30. Kim, H.-Y.; Lieffering, M.; Kobayashi, K.; Okada, M.; Miura, S. Seasonal changes in the effects of elevated CO2 on rice atthree levels of nitrogen supply: A free air CO2 enrichment(FACE) experiment. Glob. Chang. Biol. 2003, 9, 826–837. [Google Scholar] [CrossRef]
  31. Kim, H.-Y.; Lieffering, M.; Kobayashi, K.; Okada, M.; Mitchell, M.W.; Gumpertz, M. Effects of free-air CO2 enrichment and nitrogen supply on the yield of temperate paddy rice crops. Field Crops Res. 2003, 83, 261–270. [Google Scholar] [CrossRef]
  32. Long, S.P.; Ainsworth, E.A.; Leakey, A.D.B.; Nösberger, J.; Ort, D.R. Food for thought: Lower-than-expected crop yield stimulation with rising CO2 concentrations. Science 2006, 312, 1918–1921. [Google Scholar] [CrossRef]
  33. Yang, L.; Huang, J.; Yang, H.; Zhu, J.; Liu, H.; Dong, G.; Liu, G.; Han, Y.; Wang, Y. The impact of free-air CO2 enrichment (FACE) and N supply on yield formation of rice crops with large panicle. Field Crops Res. 2006, 98, 141–150. [Google Scholar] [CrossRef]
  34. Yang, L.; Huang, J.; Yang, H.; Dong, G.; Liu, G.; Zhu, J.; Wang, Y. Seasonal changes in the effects of free-air CO2 enrichment (FACE) on dry matter production and distribution of rice (Oryza sativa L.). Field Crops Res. 2006, 98, 12–19. [Google Scholar] [CrossRef]
  35. Liu, H.; Yang, L.; Wang, Y.; Huang, J.; Zhu, J.; Yunxia, W.; Dong, G.; Liu, G. Yield formation of CO2-enriched hybrid cultivar Shanyou 63 under fully open-air field conditions. Field Crops Res. 2008, 108, 93–100. [Google Scholar] [CrossRef]
  36. Yang, L.; Liu, H.; Wang, Y.; Zhu, J.; Hung, J.; Liu, G.; Dong, G.; Wang, Y. Yield formation of CO2-enriched inter-subspecific hybrid rice cultivar Liangyoupeijiu under fully open-air field condition in a warm sub-tropical climate. Agric. Ecosyst. Environ. 2009, 129, 193–200. [Google Scholar] [CrossRef]
  37. Hasegawa, T.; Sakai, H.; Tokida, T.; Nakamura, H.; Zhu, C.; Usui, Y.; Yoshimoto, M.; Fukuoka, M.; Wakatsuki, H.; Katayanagi, N.; et al. Rice cultivar responses to elevated CO2 at two free-air CO2 enrichment (FACE) sites in Japan. Funct. Plant Biol. 2013, 40, 148–159. [Google Scholar] [CrossRef]
  38. Zhu, C.; Xu, X.; Wang, D.; Zhu, J.; Liu, G. An indica rice genotype showed a similar yield enhancement to that of hybrid rice under free air carbon dioxide enrichment. Sci. Rep. 2015, 5, 12719. [Google Scholar] [CrossRef]
  39. Sakai, H.; Tokida, T.; Usui, Y.; Nakamura, H.; Hasegawa, T. Yield responses to elevated CO2 concentration among Japanese rice cultivars released since 1882. Plant Prod. Sci. 2019, 22, 352–366. [Google Scholar] [CrossRef]
  40. Hu, S.; Wang, Y.; Yang, L. Response of rice yield traits to elevated atmospheric CO2 concentration and its interaction with cultivar, nitrogen application rate and temperature: A meta-analysis of 20 years FACE studies. Sci. Total Environ. 2021, 764, 142797. [Google Scholar] [CrossRef]
  41. Hu, S.; Chen, W.; Tong, K.; Wang, Y.; Jing, L.; Wang, Y.; Yang, L. Response of rice growth and leaf physiology to elevated CO2 concentrations: A meta-analysis of 20-year FACE studies. Sci. Total Environ. 2022, 807, 151017. [Google Scholar] [CrossRef] [PubMed]
  42. Ainsworth, E.A.; Long, S.P. 30 years of free-air carbon dioxide enrichment (FACE): What have we learned about future crop productivity and its potential for adaptation? Glob. Chang. Biol. 2021, 27, 27–49. [Google Scholar] [CrossRef] [PubMed]
  43. Wang, H.; Yang, T.; Chen, J.; Bell, S.M.; Wu, S.; Jiang, Y.; Sun, Y.; Zeng, Y.; Zeng, Y.; Pan, X.; et al. Effects of free-air temperature increase on grain yield and greenhouse gas emissions in a double rice cropping system. Field Crops Res. 2022, 281, 108489. [Google Scholar] [CrossRef]
  44. Wang, W.; Cai, C.; Lam, S.K.; Liu, G.; Zhu, J. Elevated CO2 cannot compensate for japonica grain yield losses under increasing air temperature because of the decrease in spikelet density. Eur. J. Agron. 2018, 99, 21–29. [Google Scholar] [CrossRef]
  45. Wang, W.; Cai, C.; He, J.; Gu, J.; Zhu, G.; Zhang, W.; Zhu, J.; Liu, G. Yield, dry matter distribution and photosynthetic characteristics of rice under elevated CO2 and increased temperature conditions. Field Crops Res. 2020, 248, 107605. [Google Scholar] [CrossRef]
  46. Yuan, M.; Cai, C.; Wang, X.; Li, G.; Wu, G.; Wang, J.; Geng, W.; Liu, G.; Zhu, J.; Sun, X. Warm air temperatures increase photosynthetic acclimation to elevated CO2 concentrations in rice under field conditions. Field Crops Res. 2021, 262, 108036. [Google Scholar] [CrossRef]
  47. Ziska, L.H.; Bunce, J.A. Predicting the impact of changing CO2 on crop yields: Some thoughts on food. New Phytol. 2007, 175, 607–618. [Google Scholar] [CrossRef] [PubMed]
  48. Tubiello, F.N.; Amthor, J.S.; Boote, K.J.; Donatelli, M.; Easterling, W.; Fischer, G.; Gifford, R.M.; Howden, M.; Reilly, J.; Rosenzweig, C. Crop response to elevated CO2 and world food supply. A comment on “Food for Thought…” by Long et al., Science 312, 1918–1921 2006. Eur. J. Agron. 2007, 26, 215–223. [Google Scholar] [CrossRef]
  49. Ainsworth, E.A. Rice production in a changing climate: A meta-analysis of responses to elevated carbon dioxide and elevated ozone concentration. Glob. Chang. Biol. 2008, 14, 1642–1650. [Google Scholar] [CrossRef]
  50. Aronson, E.L.; McNulty, S.G. Appropriate experimental ecosystem warming methods by ecosystem, objective, and practicality. Agric. For. Meteorol. 2009, 149, 1791–1799. [Google Scholar] [CrossRef]
  51. Amthor, J.S.; Hanson, P.J.; Norby, R.J.; Wullschleger, S.D. A comment on ‘‘Appropriate experimental ecosystem warming methods by ecosystem, objective, and practicality’’ by Aronson and McNulty. Agric. For. Meteorol. 2010, 150, 497–498. [Google Scholar] [CrossRef]
  52. Aronson, E.L.; McNulty, S.G. Reply to comment on ‘‘Appropriate experimental ecosystem warming methods by ecosystem, objective, and practicality’’ by Aronson and McNulty. Agric. For. Meteorol. 2010, 150, 499–500. [Google Scholar] [CrossRef]
  53. Kimball, B.A. Comment on the comment by Amthor et al. on “Appropriate experimental ecosystem warming methods” by Aronson and McNulty. Agric. For. Meteorol. 2011, 151, 420–424. [Google Scholar] [CrossRef]
  54. Wang, J.; Wang, C.; Chen, N.; Xiong, Z.; Wolfe, D.; Zou, J. Response of rice production to elevated [CO2] and its interaction with rising temperature or nitrogen supply: A meta-analysis. Clim. Chang. 2015, 130, 529–543. [Google Scholar] [CrossRef]
  55. Allen, L.H.; Boote, K.J.; Jones, J.W.; Jones, P.H.; Pickering, N.B.; Baker, J.T.; Vu1, J.C.V.; Gesch, R.W.; Thomas, J.M.G.; Prasad, P.V.V. Sunlit, controlled-environment chambers are essential for comparing plant responses to various climates. Agron. J. 2020, 112, 4531–4549. [Google Scholar] [CrossRef]
  56. Omae, I. Effect of various nitrogen fertilizers on rice. Bull. Model Farm 1926, 6, 491–512. [Google Scholar]
  57. Dusenge, M.E.; Duarte, A.G.; Way, D.A. Plant carbon metabolism and climate change: Elevated CO2 and temperature impacts on photosynthesis, photorespiration and respiration. New Phytol. 2019, 221, 32–49. [Google Scholar] [CrossRef] [PubMed]
  58. Misu, H.; Shirosida, T. Nitrogen application study on rice (Tamanishiki and Nakate Ginbouzu). Bull. Agric. Expt. Station 1938, 10, 470–475. [Google Scholar]
  59. Experimental and Research Report. In Agricultural Chemistry, Soil Survey, and Soil Fertility in 1972; Part 1; RDA: Suwon, Republic of Korea, 1973; p. 32.
  60. NAIST (National Institute of Agricultural Science and Technology). Taxonomical Classification of Korean Soil; RDA: Suwon, Republic of Korea, 2000. [Google Scholar]
  61. Rice in Chosen. In Chosen Product; Part 1 (4); Chosen Shokusan Bank: Seoul, Republic of Korea, 1928; pp. 33–36.
  62. Lee, H.S.; Hwang, W.H.; Jeong, J.H.; Yang, S.Y.; Lim, Y.H.; Choi, M.G.; Jeong, N.J.; Lee, C.G.; Choi, K.J. Studies on the temperature response and critical day-length affecting the heading date of major cultivating rice varieties in recent Korean paddy field. Korean J. Crop Sci. 2019, 64, 323–336. [Google Scholar] [CrossRef]
  63. Long, S.P.; Elizabith, A.A.; Rogers, A.; Ort, D.R. Rising atmospheric carbon dioxide: Plants FACE the future. Annu. Rev. Plant Biol. 2004, 55, 591–628. [Google Scholar] [CrossRef]
  64. Kimball, B.A. Crop responses to elevated CO2 and interactions with H2O, N, and temperature. Curr. Opin. Plant Biol. 2016, 31, 36–43. [Google Scholar] [CrossRef]
  65. Chen, J.; Liu, Y.; Zhou, W.; Zhang, J.; Pan, T. Effects of climate change and crop management on changes in rice phenology in China from 1981 to 2010. J. Sci. Food Agric. 2021, 101, 6311–6319. [Google Scholar] [CrossRef]
  66. Zhang, T.; Huang, Y.; Yang, X. Climate warming over the past three decades has shortened rice growth duration in China and cultivar shifts have further accelerated process for late rice. Glob. Chang. Biol. 2013, 19, 563–570. [Google Scholar] [CrossRef]
  67. Wang, H.; Ghosh, A.; Linquist, B.A.; Hijmans, R.J. Satellite-based observations reveal effects of weather variation on rice phenology. Remote Sens. 2020, 12, 1522. [Google Scholar] [CrossRef]
  68. Horie, T. Global warming and rice production in Asia: Modeling, impact prediction and adaptation. Proc. Jpn. Acad. Ser. 2019, 95, 211–245. [Google Scholar] [CrossRef]
  69. Bishop, K.A.; Leakey, A.D.B.; Ainsworth, E.A. How seasonal temperature or water inputs affect the relative response of C3 crops to elevated [CO2]: A global analysis of open top chamber and free air CO2 enrichment studies. Food Energy Secur. 2014, 3, 33–45. [Google Scholar] [CrossRef]
  70. Peng, S.; Huang, J.; Sheehy, J.E.; Cassman, K.G. Rice yields decline with higher night temperature from global warming. Proc. Natl. Acad. Sci. USA 2004, 101, 9971–9975. [Google Scholar] [CrossRef] [PubMed]
  71. Lewis, J.D.; Olszyk, D.; Tingey, D.T. Seasonal patterns of photosynthetic light response in Douglas-fir seedlings subjected to elevated atmospheric CO2 and temperature. Tree Physiol. 1999, 19, 243–252. [Google Scholar] [CrossRef] [PubMed]
  72. Matsui, T.; Omasa, K.; Horie, T. High temperature-induced spikelet sterility of japonica rice at flowering in relation to air temperature, humidity and wind velocity conditions. Jpn. J. Crop. Sci. 1997, 66, 449–455. [Google Scholar] [CrossRef]
  73. Nakagawa, H.; Horie, T.; Matsui, T. Effects of climate change on rice production and adaptive technologies. In Rice Science: Innovations and Impacts for Livelihood; Mew, T.W., Brar, D.S., Peng, S., Dawe, D., Hardy, B., Eds.; IRRI: Los Banos, Philippines, 2003; pp. 635–658. [Google Scholar]
  74. Poorter, H.; Fiorani, F.; Pieruschka, R.; Wojciechowski, T.; van der Putten, W.H.; Kleyer, M.; Schurr, U.; Postma, J. Pampered inside, pestered outside? Differences and similarities between plants growing in controlled conditions and in the field. New Phytol. 2016, 212, 838–855. [Google Scholar] [CrossRef]
Figure 1. Daily mean air temperatures over the rice growing seasons at the RE site (Suwon) in 1920 (a), 1921 (b), and 1922 (c) and CE site (Gwangju) in 2020 (a), 2021 (b), and 2022 (c).
Agronomy 13 02692 g001
Figure 2. Daily mean sunshine duration over the whole season (from transplanting to harvest) and during the period from transplanting to heading and from heading to harvest in the CE (2020−2022).
Agronomy 13 02692 g002
Figure 3. Plant height of rice at the approximate maximum tillering stage (20 July; (ac)) and early ripening stage (1 September; (eg)) in the RE (RE1920–1922) and CE (CE2020–2022) and percentage changes (d,h) with the 95% confidence interval in plant height over the last 100 years during which [CO2] increased by 120 ppm and temperature warmed by 1.7–3.2 °C. In the figure, ns, *, **, and *** stand for non-significant, p < 0.05, p < 0.01, and p < 0.001, respectively.
Agronomy 13 02692 g003
Figure 4. Tiller number of rice at the approximate maximum tillering stage (20 July; (ac)) and early ripening stage (1 September; (eg)) in the RE (RE1920–1922) and CE (CE2020–2022), and percentage changes (d,h) with the 95% confidence interval in the tiller number over the last 100 years during which [CO2] increased by 120 ppm and temperature warmed by 1.7–3.2 °C. In the figure, ns, *, and ** stand for non-significant, p < 0.05, and p < 0.01, respectively.
Agronomy 13 02692 g004
Figure 5. Days to heading (DTH) of rice in the RE (RE1920–1922; (ac)) and CE (CE2020–2022; (ac)) and percentage changes (d) with the 95% confidence interval in DTH over the last 100 years during which [CO2] increased by 120 ppm and temperature warmed by 1.7–3.2 °C. In the figure, *** stands for p < 0.001.
Agronomy 13 02692 g005
Figure 6. Rice response (days to heading) to sunshine duration during the period from transplanting to heading in the CE (CE2020–2022).
Agronomy 13 02692 g006
Figure 7. Shoot biomass of rice in the RE (RE1920–1922; (ac)) and CE (CE2020–2022; (ac)) and percentage changes (d) with the 95% confidence interval in shoot biomass over the last 100 years during which [CO2] increased by 120 ppm and temperature warmed by 1.7–3.2 °C. In the figure, * and *** stand for p < 0.05 and p < 0.001, respectively.
Agronomy 13 02692 g007
Figure 8. Grain yield of rice in the RE (RE1920–1922; (ac)) and CE (CE2020–2022; (ac)) and percentage changes (d) with the 95% confidence interval in grain yield over the last 100 years during which [CO2] increased by 120 ppm and temperature warmed by 1.7–3.2 °C. In the figure, ns and ** stand for non-significant and p < 0.01, respectively.
Agronomy 13 02692 g008
Figure 9. Harvest index (HI) of rice in the RE (RE1920–1922; (ac)) and CE (CE2020–2022; (ac)) and percentage changes (d) with the 95% confidence interval in HI over the last 100 years during which [CO2] increased by 120 ppm and temperature warmed by 1.7–3.2 °C. In the figure, ns, * and *** stand for non-significant, p < 0.05, and p < 0.001, respectively.
Agronomy 13 02692 g009
Table 1. Properties of soils used for the RE and CE.
ParametersRE1920–1922CE2020–2022
pH5.3 b6.3
Total C (g kg−1)11.5 b13.0
Total N (g kg−1)1.10 a1.04
Available P (mg P2O5 kg−1)5.9 b1.9
CEC (cmol kg−1)7.8 b12.8
SeriesGangseoSeogcheon
TextureCoarse LoamyCoarse Loamy
a Data from Misu et al. [58]; b Data from a 1970s survey [59,60] at the same site as RE1920–1922.
Table 2. Descriptions of agronomic practices in both the RE [56,61] and the CE.
Agronomic PracticesDescriptions
RE1920–1922CE2020–2022
Cultivar usedTamanishiki (Oryza sativa L.)Used the same cultivar as that in the RE1920–1922
Seed selectionUsed salt solution with a density of 1.13Conducted using the same methodology as that in the RE1920–1922
Nursery bed preparation in paddy fieldOn 25–28 April, applied compost (N 0.6%) at 1.10 kg m−2 and soybean meal (N 6.78%) at 113.6 g m−2On 25–28 April, applied compost (N 1.5%) at 0.45 kg m−2 and soybean meal (N 8.06%) at 95.6 g m−2
Sowing dateUnclear, but given that the duration of raising the seedlings at this time was around 40 days and that planting date ranged from 13 to 16 June, it was estimated to be approximately 5 MayOn 5 May across 2020–2022
Sowing density273 mL m−2 (presoaked and germinated seed)Conducted using the same methodology as that in the RE1920–1922
Raising of seedlingsIn a traditional flooded nursery in a paddy fieldConducted using the same methodology as that in the RE1920–1922
Additional fertilizer for raising seedlings3 weeks after sowing, applied N
at 3.5 g m−2 in the form of (NH4)2SO4 and
human manure at 1.6 L m−2
3 weeks after sowing, applied N at 3.5 g m−2 in the form of (NH4)2SO4, 1.5 g N m−2 added as a proxy of human manure, which we failed to procure due to coronavirus disease 2019
Soil preparationSoils from paddy field under non-fertilized conditions cropped for several yearsSoils from paddy fields under non-fertilized conditions cropped for 3 years
Pot preparation and preconditioningIn 1/2000 a Wagner’s pots, filled with gravel up to 3.0 cm from the bottom, and then filled with soil (11.2 kg pot−1) mixed with limestone powder (10 g pot−1) in late May. These pots were kept flooded for 2 weeksConducted using the same methodology as that in the RE1920–1922
Fertilizing3 days before transplanting, all fertilizers (N:P:K = 0.75:0.75:0.75 g pot−1) were well mixed with flooded soil in pots
Total amount of fertilizers applied only as a basal dressing
Conducted using the same methodology as that in the RE1920–1922
Transplanting date and densityOn 16 June 1920–1921 and on 13 June 1922; 5 seedlings hill−1 (1 hill pot−1)Conducted using the same methodology as that in the RE1920–1922
Irrigation and weedingCarefully managed both the water and the weedsKept flooded up to 5 days before harvest and weeding frequently
Table 3. Fertilizer contents (%) and application amount of nine nitrogen (N) sources, phosphate (P), and potassium (K) used for the RE [56] and CE.
FertilizersSourcesRE1920–1922CE2020–2022
Content
(%)
Application
(g N–P–K pot−1)
Content
(%)
Application
(g N–P–K pot−1)
NAmmonium sulfate20.770.7522.430.75
Chile saltpeter15.240.7515.980.75
Calcium cyanamide17.540.7524.730.75
Rice bran2.190.752.930.75
Bone meal4.140.752.790.75
Soybean meal6.780.758.060.75
Perilla seed meal5.100.754.920.75
Cottonseed meal6.320.758.030.75
Blood meal11.940.7516.140.75
PCalcium superphosphate0.7516.00.75
KPotassium sulfate0.7548.00.75
−: Unidentified.
Disclaimer/Publisher’s Note: The statements, opinions and data contained in all publications are solely those of the individual author(s) and contributor(s) and not of MDPI and/or the editor(s). MDPI and/or the editor(s) disclaim responsibility for any injury to people or property resulting from any ideas, methods, instructions or products referred to in the content.

