Article

Valorizing Traditional Greek Wheat Varieties: Phylogenetic Profile and Biochemical Analysis of Their Nutritional Value

1
Institute of Applied Biosciences, Centre for Research and Technology Hellas, Thermi, 57001 Thessaloniki, Greece
2
Department of Food Science and Nutrition, University of the Aegean, Myrina, 81400 Lemnos, Greece
3
Department of Medicine, Aristotle University of Thessaloniki, 54154 Thessaloniki, Greece
4
Department of Chemical Engineering, University of Patras, 26504 Patras, Greece
5
Institute of Plant Breeding and Genetic Resources, Hellenic Agricultural Organization—“Demeter”, 57001 Thessaloniki, Greece
*
Author to whom correspondence should be addressed.
Agronomy 2023, 13(11), 2703; https://doi.org/10.3390/agronomy13112703
Submission received: 6 October 2023 / Revised: 24 October 2023 / Accepted: 25 October 2023 / Published: 27 October 2023
(This article belongs to the Section Crop Breeding and Genetics)

Abstract

:
Research has highlighted the nutritional benefits of ancient grains, especially emmer (Triticum turgidum ssp. dicoccum) and einkorn (Triticum monococcum), compared to modern varieties of common and durum wheat, focusing on their higher levels of antioxidants and phytochemicals. In this study, grains from old Greek landraces of einkorn, emmer, durum and common wheat were compared to modern wheat cultivars, as well as barley, oats and rye grains, to investigate their unique genetic profile and nutritional properties. Genotyping of Triticum species was performed using SSR markers, which allowed differentiation up to cultivar level. Nutritional factors like the total content of bound and free polyphenols, flavonoids, antioxidant activity and fatty acid profile were assessed. The results showed that emmer and einkorn had the highest total polyphenol, flavonoid and mono-unsaturated fatty acids content, as well as higher antioxidant activity than common and durum wheat. Local landraces of common and durum wheat also exhibited higher values than commercial cultivars. The results of this study demonstrate the high nutritional value of ancient wheat varieties. Many of these cultivars have been put aside by more productive, yet with lower qualitative characteristics, commercial cultivars, underlining the importance of maintaining sustainable agricultural practices to ensure their continued cultivation.

1. Introduction

Wheat (Triticum aestivum L. ssp. aestivum, or ‘common’ wheat, and Triticum turgidum L. ssp. durum, or ‘durum’ wheat) is the third most cultivated crop in the world, after maize and rice [1]. It covers the largest surface among cereals, 220.7 million hectares with a total yield of 771 million tons, worldwide in 2021 [2]. Wheat species have a fascinating domestication history, closely following human agricultural evolution. Durum or hard wheat, Triticum turgidum, commonly used for pasta production, is a tetraploid species (genomes AABB), while Triticum aestivum, or common wheat, used for bread making, is hexaploid (genomes AABBDD). Hybridization of the wild einkorn, T. urartu (genome AA), with Aegilops speltoides (genome BB), gave rise to Triticum turgidum [3]. In the Fertile Crescent, about 12,000 years ago, farmers selected among cultivated forms of wild emmer (Triticum turgidum ssp. dicoccoides) a naked type that was easier to thresh (Triticum turgidum ssp. dicoccum). Triticum turgidum ssp. durum appeared almost 2000 years later as a result of further selection for its larger grains and higher productivity, becoming the major cultivated form of tetraploid wheat [4,5]. About 8000 years ago, a cross between durum wheat and goatgrass, Aegilops tauschii, the donor of the D genome, gave rise to the common wheat, Triticum aestivum [6].
Currently, the most common commercially available old wheat species are diploid einkorn (Triticum monococcum), tetraploid emmer (T. turgidum ssp. dicoccum), also known as farro in Italy, teraploid khorasan (T. turgidum ssp. turanicum) and hexaploid spelt or dinkel (T. aestivum ssp. spelta) [7,8]. These species have a more primitive grain morphology with hulls, compared to common and durum wheat, meaning that the glumes remain tightly closed over the grain and are not removed by threshing [9]. Emmer is used for bread, pasta and beer making, while einkorn and dinkel are mostly used for bread making [8].
Modern trends in nutrition, consumers’ concern for foods rich in antioxidants and other health-beneficial compounds, combined with the need for low or gluten-free products, have created new interest in ancient wheat varieties. It is a common misunderstanding that einkorn and emmer are gluten free; einkorn’s gluten has a different protein structure to common wheat gluten, making it more tolerant for celiac people [8]; however, both emmer and einkorn are rich in gluten proteins [10]. There is some skepticism about whether ancient wheat varieties are richer in bioactive compounds than modern cultivars. Some researchers suggest that these differences are limited and mostly attributed to different genotypes and cultivation practices [9]. Other studies indicate that ancient wheat species, like einkorn, emmer and dinkel, are richer in carotenoids, tocols, oleic acid and minerals compared to modern wheat cultivars, with proven health benefits after consumption [11,12]. Moreover, studies on Triticum species showed that emmer and einkorn grains are richer in alkylresorcinols than common and durum wheat, as well as the flour and processed products produced by their grains [13]. Alkylresorcinols are an important class of phytochemicals found in wheat, especially in the outer layers of the grain. They have been linked with anti-inflammatory activity and protective activity against obesity, cardiovascular diseases and cancer, and they are considered to be the most bioactive class of compounds in wheat [14].
Local durum wheat landraces are traditionally cropped in Greece, as they are better adapted to the environmental stresses and produce high-quality crops, although they may be less productive [15]. A few producers cultivate emmer and einkorn landraces, despite their lower yield, as there is a special market for these products. The aim of the current study was to genetically and nutritionally characterize a local landrace of emmer and a local landrace of einkorn, cultivated on a certified farm in Greece. We compared these landraces to cultivars of common and durum wheat as well as other cereals, using molecular markers, and then quantified the concentration of polyphenols, flavonoids, antioxidants and fatty-acid methyl esters in all the samples. These nutritional factors were evaluated since they are of great interest to the food industry and to consumers, for adding quality characteristics and elevated market value to the final product [16]. Within each group of common and durum wheat samples, we included two local ancient cultivars of each species, cultivated on the same farm as emmer and einkorn, and three modern commercial cultivars to compare their genetic profile and nutritional properties. Results highlighted the high nutritional value of ancient wheat cultivars of emmer and einkorn, as well as of local landraces of common and durum wheat, compared to commercial cultivars. The comprehensive assessment of biochemical and nutritional attributes of landraces, followed by their comparison with commercial cultivars to gauge their competitiveness under contemporary environmental conditions, stands as the cornerstone of innovation and practical significance of the project. This evaluation may facilitate the decision regarding the feasibility of reintroducing these traditional varieties into extensive cultivation, serving as a pivotal step toward their preservation and revival.

2. Materials and Methods

2.1. Samples

Seven different cereal species were used in the current study: Triticum aestivum (common wheat), T. turgidum ssp. durum (durum wheat), T. turgidum ssp. dicoccum (emmer), T. monococcum ssp. monococcum (einkorn), Hordeum vulgare (barley), Avena sativa (oat) and Secale cereale (rye), (Table 1). Grains from samples 1, 2, 6, 7 and 11–15 were obtained from a certified producer in Greece (Antonopoulos farm, Dilofos) and are considered old local landraces. Grains from the rest of the samples (3–5, 8–10), which are typical commercial cultivars of Greece, were kindly provided by the Institute of Plant Breeding and Genetic Resources, ELGO-Demeter. All plants were grown in the same location (Dilofos/Larisa/Greece) in the growing season November 2020–June 2021. The meteorological data for the relevant period are shown in Table 2. The evaluation was performed in an organic field that in the previous year was cultivated with vetch, e.g., rotation with vetch, without any other fertilization. Agricultural practices include ploughing, secondary tillage and no irrigation.

2.2. DNA Barcoding

DNA was extracted from 200 mg seeds of each sample using the NucleoSpin Food, Macherey-Nagel kit (Dueren, Germany), following the manufacturer’s protocol. DNA quality and quantity were assessed by gel electrophoresis and spectrophotometry, respectively. For species identification, the Internal Transcribed Spacer 2 (ITS2) region of each sample was PCR amplified using the primers ITS2_F (ATGCGATACTTGGTGTGAAT) and ITS2_R (GACGCTTCTCCAGACTACAAT) [19]. For each PCR reaction of total volume of 20 µL, 100 ng of genomic DNA was amplified using 1 unit of Xpert Fast DNA polymerase (Grisp, Porto, Portugal), 5× Xpert Fast Reaction Buffer, 0.4 µL of each 10 µM primer, and the following cycling conditions: 95 °C for 1 min, 40 cycles of 95 °C for 15 s, 15 s at 45 °C, 72 °C for 3 s, and one final extension step at 72 °C for 3 min on a Thermocycler (Thermo Fisher Scientific, Waltham, MA, USA). PCR products were cleaned using the PureLink™ PCR Purification Kit (Thermo Fisher Scientific, Waltham, MA, USA), before being subjected to Sanger sequencing using ITS2_F primer on the ABI3730xl platform (Cemia, SA, Larissa, Greece). The sequences were aligned by Muscle with MEGA, version X software (https://www.megasoftware.net (accessed on 26 May 2023)) [20] and identified using the Nucleotide Blast feature of NCBI. A Neighbor-Joining phylogenetic tree [21] was created using Molecular Evolutionary Genetics Analysis (MEGA, version X) software and reference sequences retrieved from NCBI.

2.3. SSR Analysis

For the SSR analysis, PCRs were performed in a volume of 20 µL including 200 ng genomic DNA extracted as described in Section 2.2, 0.4 µL of each 10 μM primer, 1 unit of Xpert Fast DNA polymerase (Grisp, Porto, Portugal) and 4 µL of 5× Xpert Fast Reaction Buffer (that includes 5 mM dNTPs), using the following cycling program: 95 °C for 1 min, 40 cycles of 95 °C for 15 s, 15 s at annealing temperature (Ta) (Table 2), 72 °C for 3 s, and one final extension step at 72 °C for 20 min, on a Thermocycler (Thermo Fisher Scientific, Waltham, MA, USA). Ten pairs of primers were used: Xgwm148, Xgwm153, Xgwm350, Xgwm389, Xgwm544, Xgwm614, Xgwm637 [22] and Xwmc254, Xwmc415, Xwmc597 [23] (Table 3). Forward primers were 5′-end fluorescently labeled with either FAM, HEX, ATTO550 or ATT0565 according to each dye’s absorption and emission wavelength and the size of the amplified product, in order to avoid overlapping during fragment analysis. PCR products were analyzed with an ABI 3500 Genetic Analyzer (Applied Biosystems, Waltham, MA, USA) by capillary electrophoresis. Fragment detection was performed using the Peak Scanner (version 4.0) software (Thermo Fisher Scientific, Waltham, MA, USA). The size of each fragment was used to create a table for GenAlex (version 6.5) [24], which was used for the construction of a Neighbor-Joining phylogenetic tree [21], with Molecular Evolutionary Genetics Analysis (MEGA-X) software [20] and for the calculation of the total number of alleles, number of polymorphic alleles, effective number of alleles (Ne), Shannon’s Information Index (I), observed heterozygosity (Ho), and expected heterozygosity (He). Then, the SSR alleles were converted to a 1/0 matrix, with the presence of an allele being scored as 1 and the absence as 0, which was used to calculate the information content of each primer (PIC, Polymorphism Information Content), based on the formula PICi = 2fi (1 − fi) [25], where PICi is the polymorphism information content of marker ‘i’, fi is the frequency of the amplified allele and 1 − fi is the frequency of the null allele (band absent).

2.4. Extraction of Free and Bound Phenolic Compounds

The free and bound phenolic compounds were extracted according to Kaur et al., 2021 with minor modifications [26]. Briefly, for free phenolics, 0.5 g of grounded wheat grains was homogenized with 5 mL of 80% methanol and sonicated in an ultrasonic water bath. After centrifugation at 4000 rpm for 10 min, the supernatant was removed and the residue was resuspended in 80% methanol (5 mL) and extraction was repeated twice. Supernatants were pooled and dried at 45 °C using rotavapor under reduced pressure. The residue was further digested with 10 mL of NaOH (2 M) at room temperature for 2 h for the extraction of bound phenolic compounds. The pH was adjusted to 2 and the mixture was centrifuged at 4000 rpm for 5 min. The supernatant was extracted with 10 mL of ethyl acetate/diethyl ether solution (1:1 v/v) three times. The organic layer was collected and evaporated to dryness. Both free and bound phenolics dry residue were re-dissolved in 2 mL of 80% methanol, filtered through a 0.45 μm filter. The extracts were used for the determination of free and bound phenolics and flavonoids, as well as to assess antioxidant activity.

2.5. Total Phenolic Content (TPC)

The total phenolic content of each extract was estimated spectrophotometrically using a modified Folin–Ciocalteu colorimetric method [27,28]. Briefly, 50 μL of the appropriate diluted extracts was mixed with 600 μL of distilled water followed by the addition of 50 μL Folin–Ciocalteu reagent. The samples were mixed well and allowed to stand for 8 min. The reaction was neutralized by adding 300 μL of 20% sodium carbonate and the absorbance of the solution was recorded at 760 nm on UV-Vis spectrophotometer (Shimadzu UV-2600, Kyoto, Japan) after 60 min. Total polyphenols were estimated as the sum of free and bound values. The free, bound and total phenolics were reported as mg gallic acid equivalent (GAE)/100 g of grain.

2.6. Total Flavonoid Content (TFC)

The TFC of free and bound extracts was quantified using a colorimetric method described previously by Liu et al. (2002) [29] with some modifications. Dilutions of sample extracts reacted with sodium nitrite (5%), followed by reaction with aluminum chloride hydrate solution (10%) to form a flavonoid–aluminum complex. Solution absorbance at 510 nm was immediately measured using a UV-VIS spectrophotometer (Shimadzu UV-2600, Kyoto, Japan). Total flavonoids were estimated as the sum of free and bound values. The free, bound and total flavonoids were expressed as mg quercetin/100 g of grain.

2.7. Determination of Antioxidant Activity

The ability of the extracts to react with the free radical 2,2′-diphenyl-1-picrylhydrazyl (DPPH) was used to determine their antioxidant activity [30]. Briefly, 25 μL of free and bound extracts was left to react with 975 μL freshly prepared DPPH solution (6 × 10⁻⁹ mol L−1) for 30 min at room temperature. The absorbance of the solution was measured at 515 nm using a UV-VIS spectrophotometer. Results were expressed as a percentage of DPPH neutralization.

2.8. Analysis of Fatty-Acid Methyl Esters (FAMEs)

Fatty acids were extracted and determined according to the direct FAME synthesis method described by O’Fallon et al. (2007) [31]. Fatty acid composition was determined using a GCMS-QP2010 Ultra Gas chromatograph mass spectrometer (Shimadzu Europe, GmbH, Duisburg, Germany) equipped with an SP-2340 capillary column (60 m × 0.25 mm, 0.20 μm film thickness) (Supelco, Bellefonte, PA, USA). The temperature of the injector and the flame ionization detector was set at 250 °C. The oven temperature was initially set at 100 °C for 5 min and was slowly increased up to 240 °C with a rate of 4 °C/min and held at this temperature for 30 min. The carrier gas used for the analysis was helium at a flow rate of 20 cm/min. For identification and calibration purposes, the Supelco 37 Component FAME Mix was used (Sigma-Aldrich, St. Louis, MO, USA). The composition of FAMEs was expressed in relative percentage of each fatty acid, calculated by internal normalization of the chromatographic peak area.

2.9. Statistical Analysis

For each biochemical analysis, triplicate measurements were conducted, and data were expressed as mean value ± standard deviation (n = 3). Statistical analysis was performed using the t-test (GraphPad, San Diego, CA, USA), while the p-value significant threshold was 0.05 (p ≤ 0.05).

3. Results

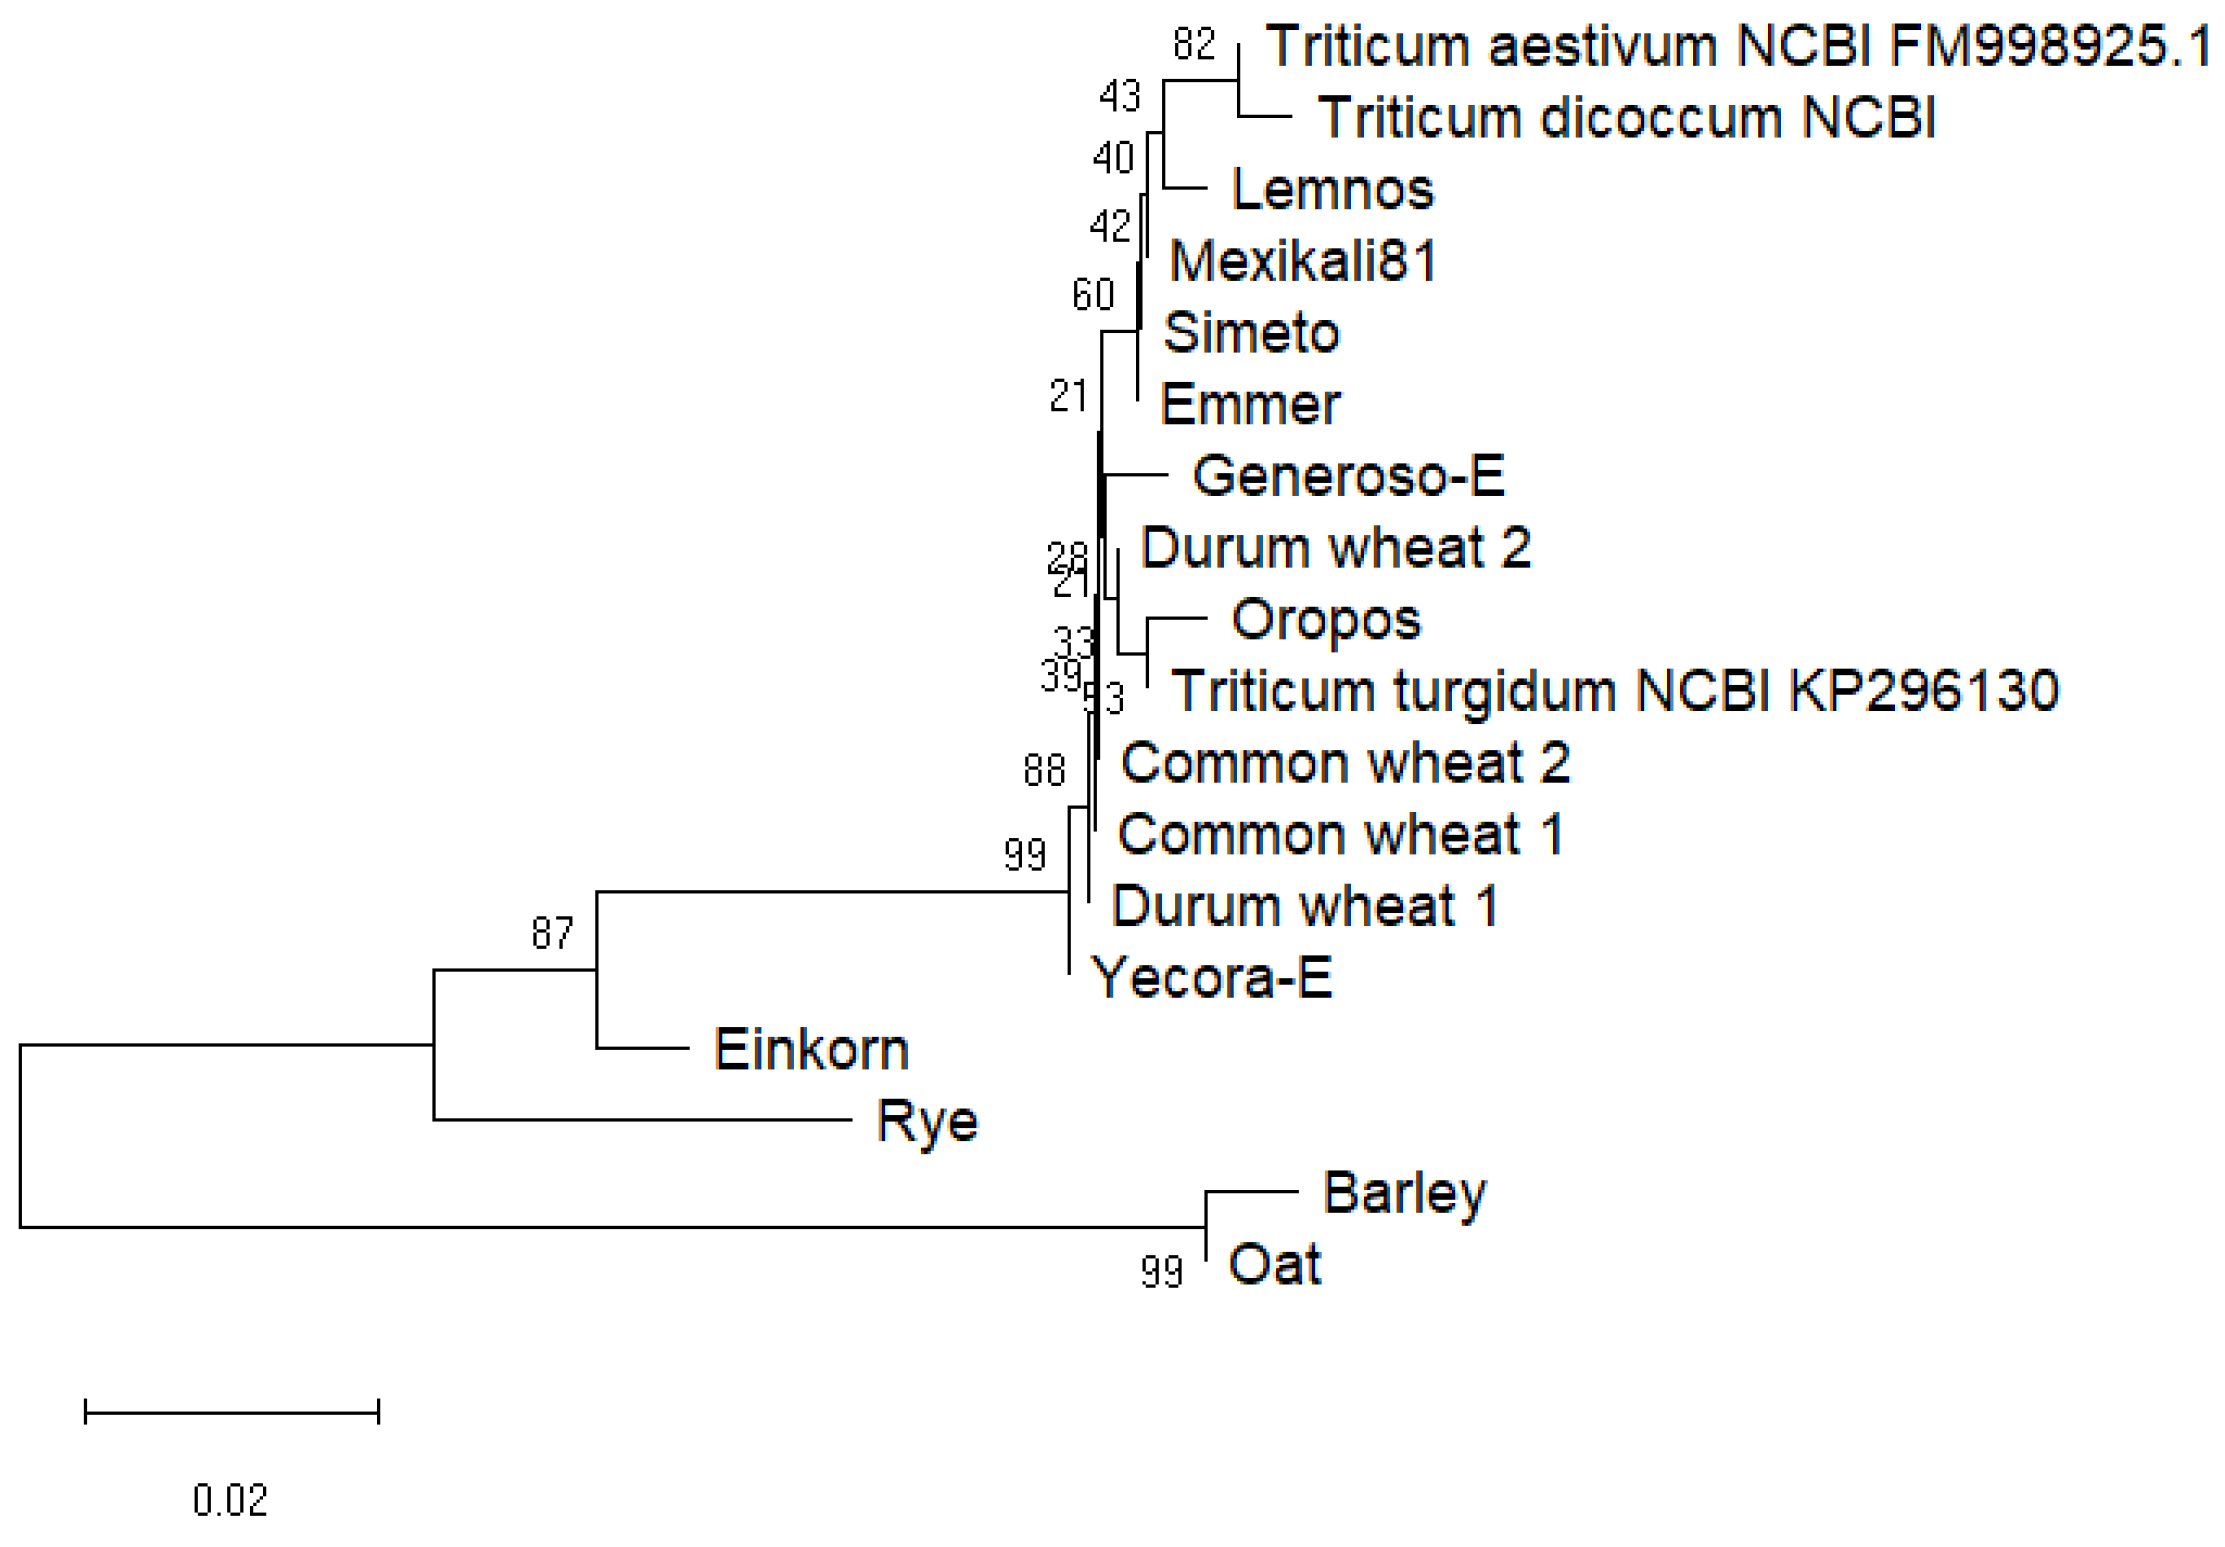
3.1. Phylogenetic Analysis

ITS2 sequencing results revealed that all the samples except einkorn, barley, oat and rye shared the same sequence, with a few discrepancies attributed to the sequencing quality. This is clearly depicted in the phylogenetic tree of the ITS2 sequencing results (Figure 1), where all the samples except einkorn, barley, oat and rye are placed on the same branch. As a result, the samples of common wheat, durum wheat and emmer could not be distinguished based on ITS2 barcoding.
For this reason, genotyping using SSR molecular markers was performed for the 12 wheat samples of emmer, einkorn common and durum wheat. The use of 10 markers resulted in a total of 71 alleles, all of them being polymorphic among wheat cultivars. The genetic variation in the ten SSR loci was calculated based on the number of alleles, the number of effective alleles, Shannon’s Information Index, observed heterozygosity (Ho), expected heterozygosity (He) and Polymorphism Information Content (PIC) (Table 4).
The values of observed heterozygosity (Ho) ranged from 0 to 92%, with a mean of 54%. Ho is defined as the number of individual heterozygotes per locus [32]; the higher the Ho values, the higher the genetic variability. Expected heterozygosity, He, which assesses genetic variation within populations [33], had values of 48–89%, with a mean value of 73%. Markers Xgwm153 and Xgwm389 amplified the highest number of alleles (N = 11), while Xwmc254 and Xwmc415 amplified the lowest (N = 3). PIC values are determined by the number of known alleles and their frequency distribution, reflecting the discriminating ability of the marker. The highest PIC value was observed for the markers Xgwm153 and Xgwm389, while the lowest was observed for Xwmc254 and Xwmc415. The highest Shannon’s Information Index was observed for the marker Xgwm389, suggesting that the samples were most diverse when assessed with this marker and less diverse when assessed with Xwmc254, which exhibited the lowest Shannon’s Information Index. The phylogenetic relationships between the samples, as determined by the SSR markers, are depicted in a Neighbor-Joining tree (Figure 2).
As shown in the phylogenetic tree (Figure 2), two branches were formed. All the common wheat samples were placed on one branch, with all the other samples on the other. Durum wheat samples formed a tight cluster within the branch, while emmer and einkorn samples were found in close proximity to durum wheat.

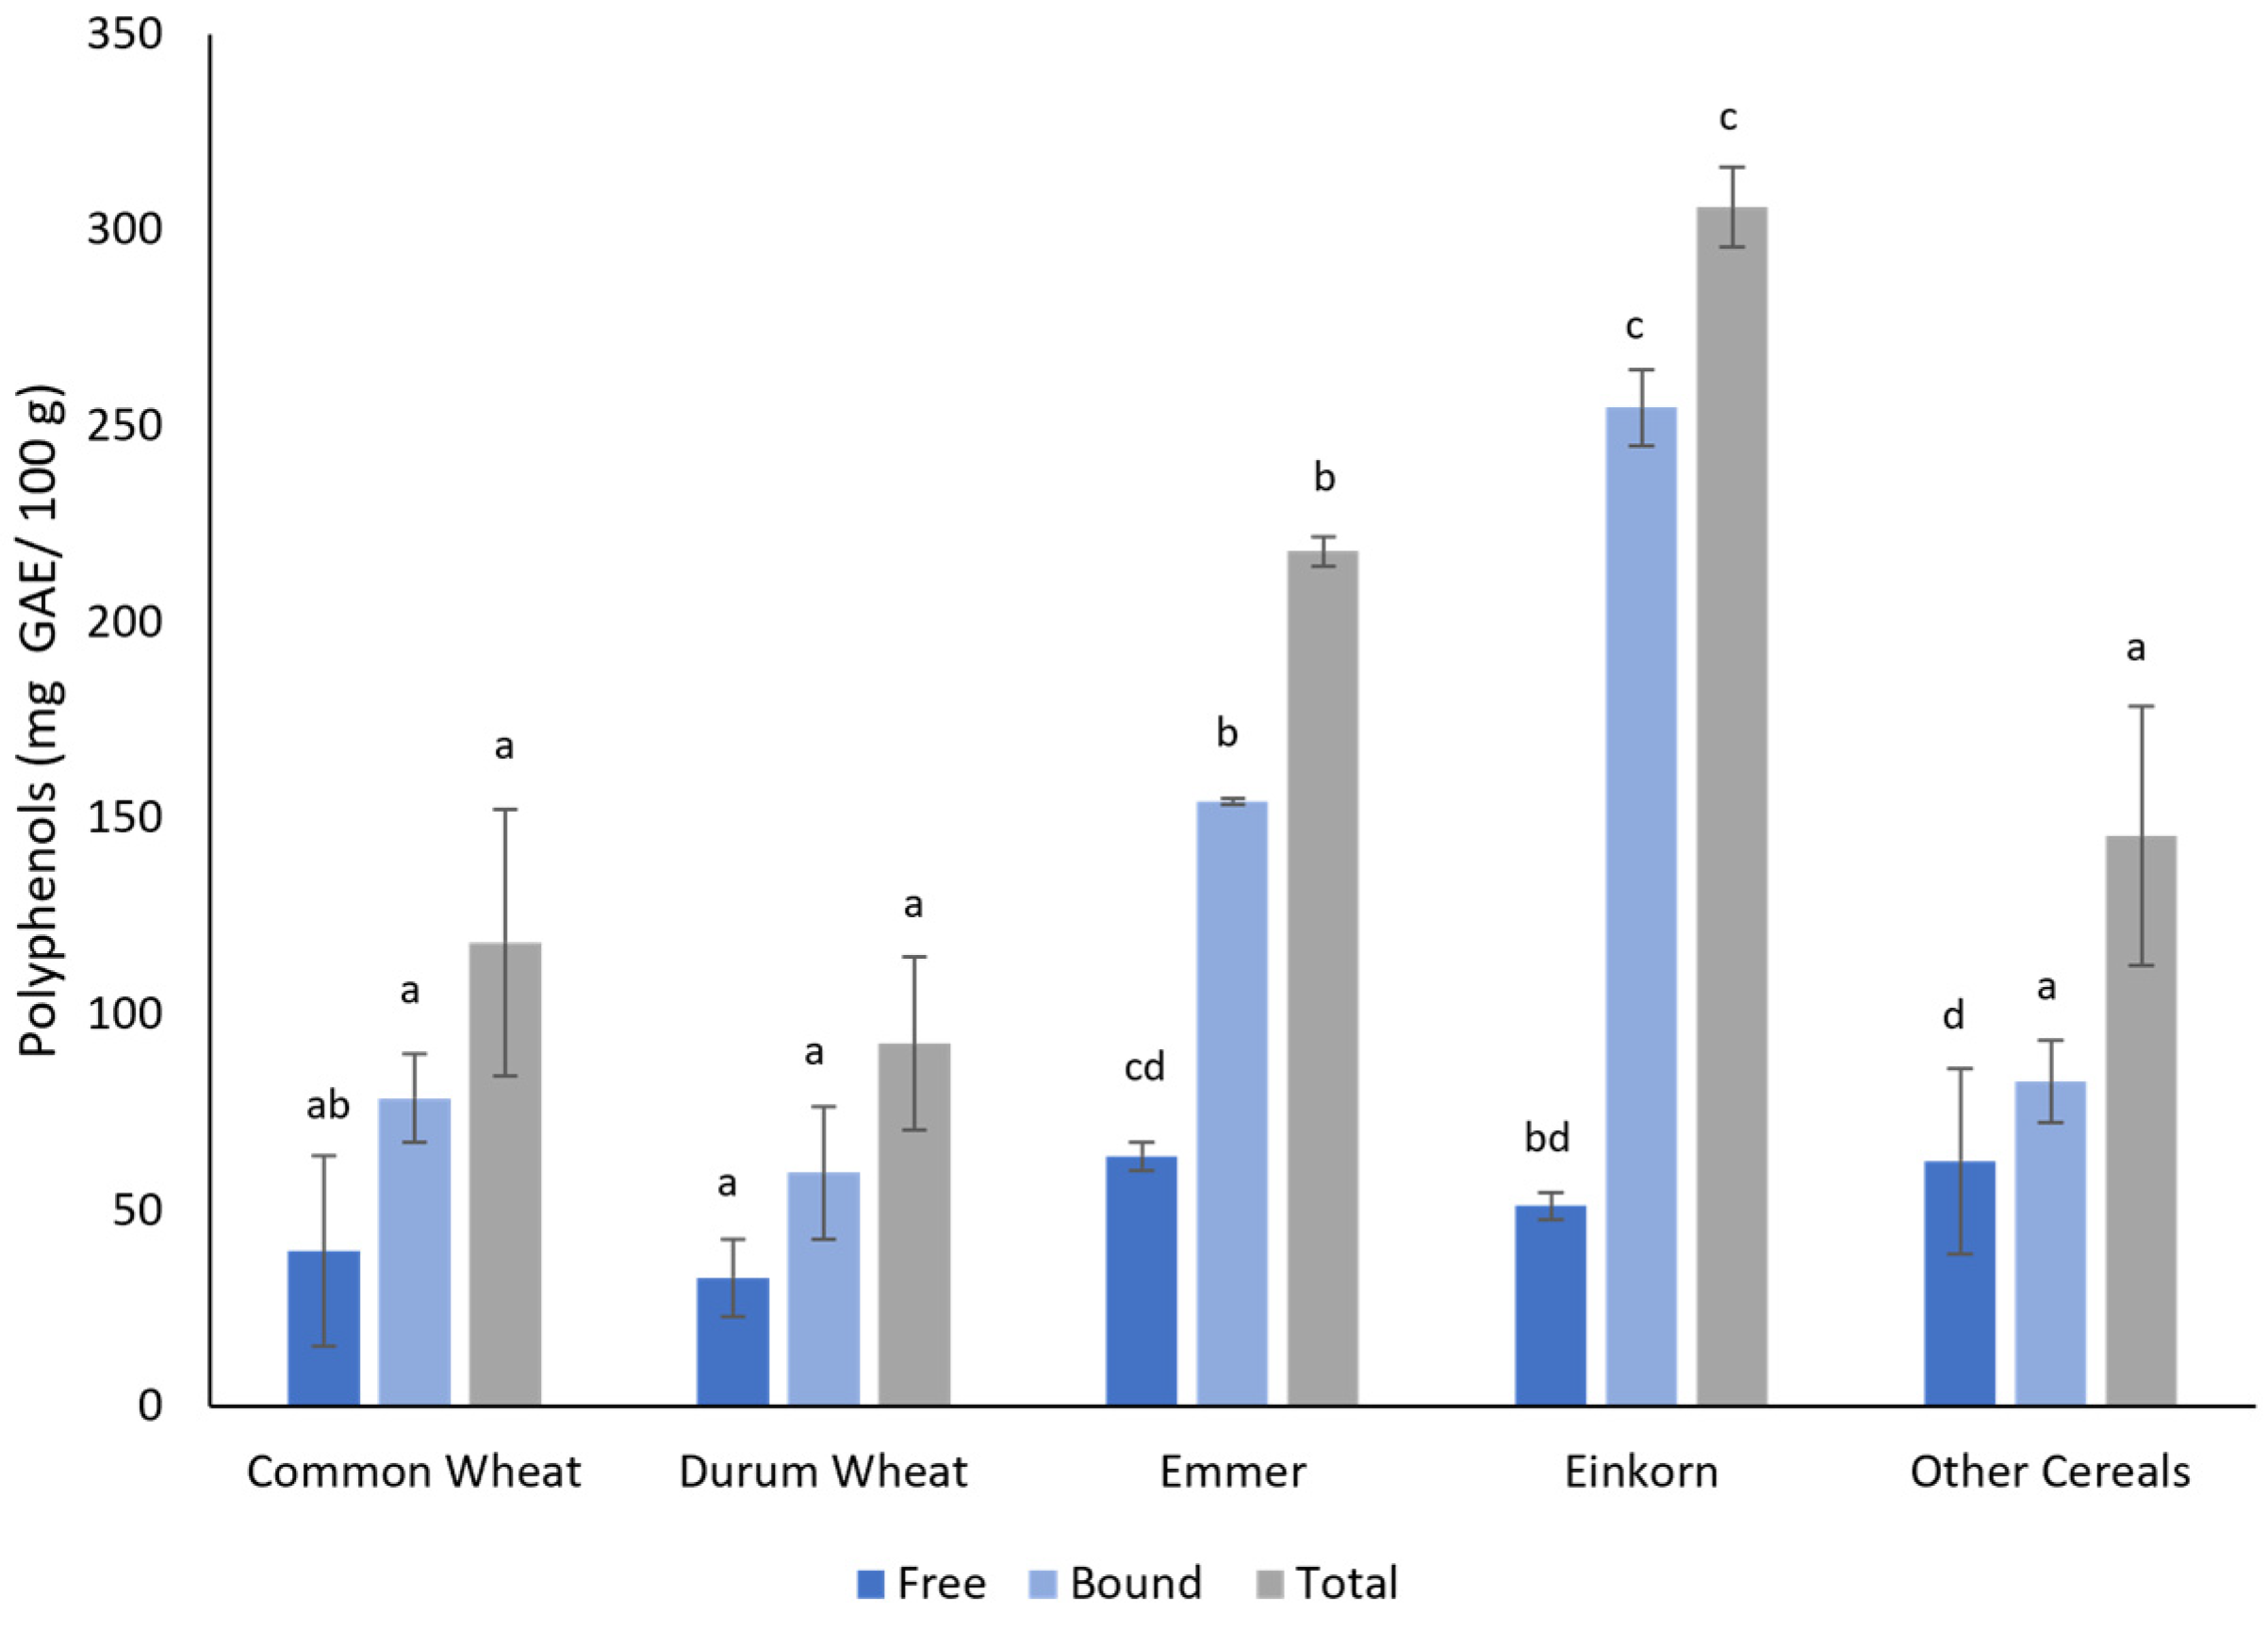
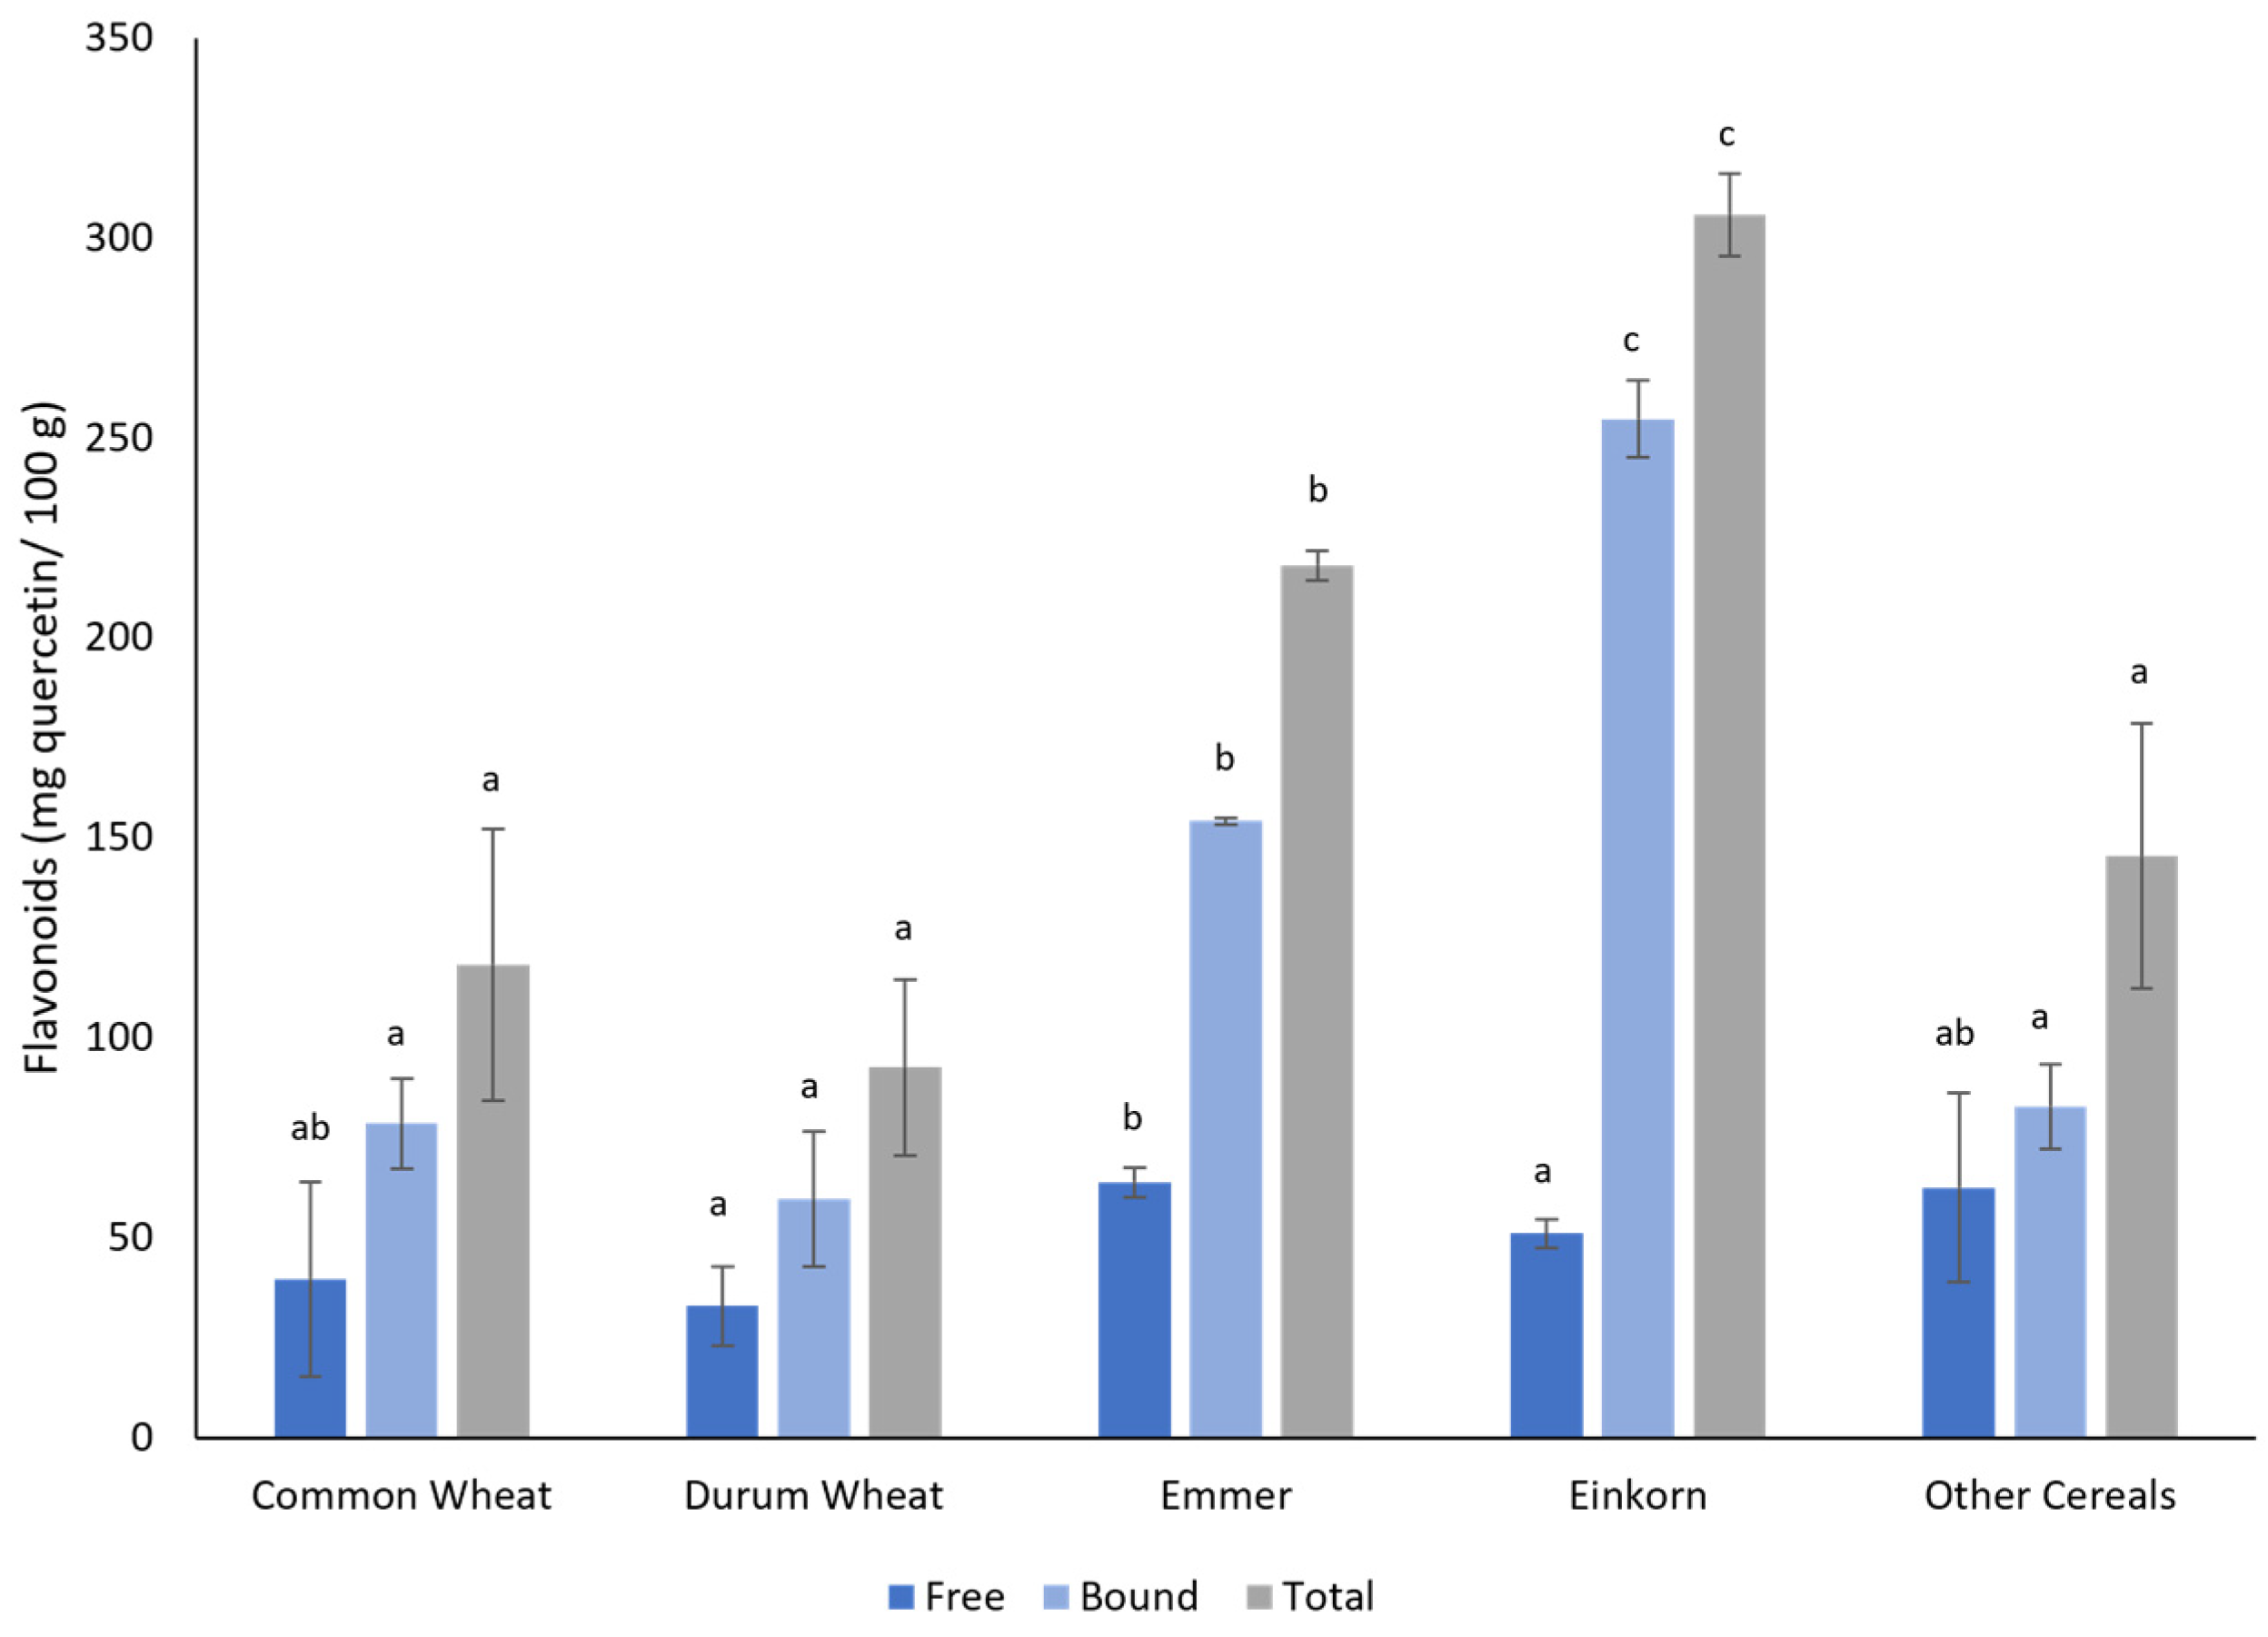
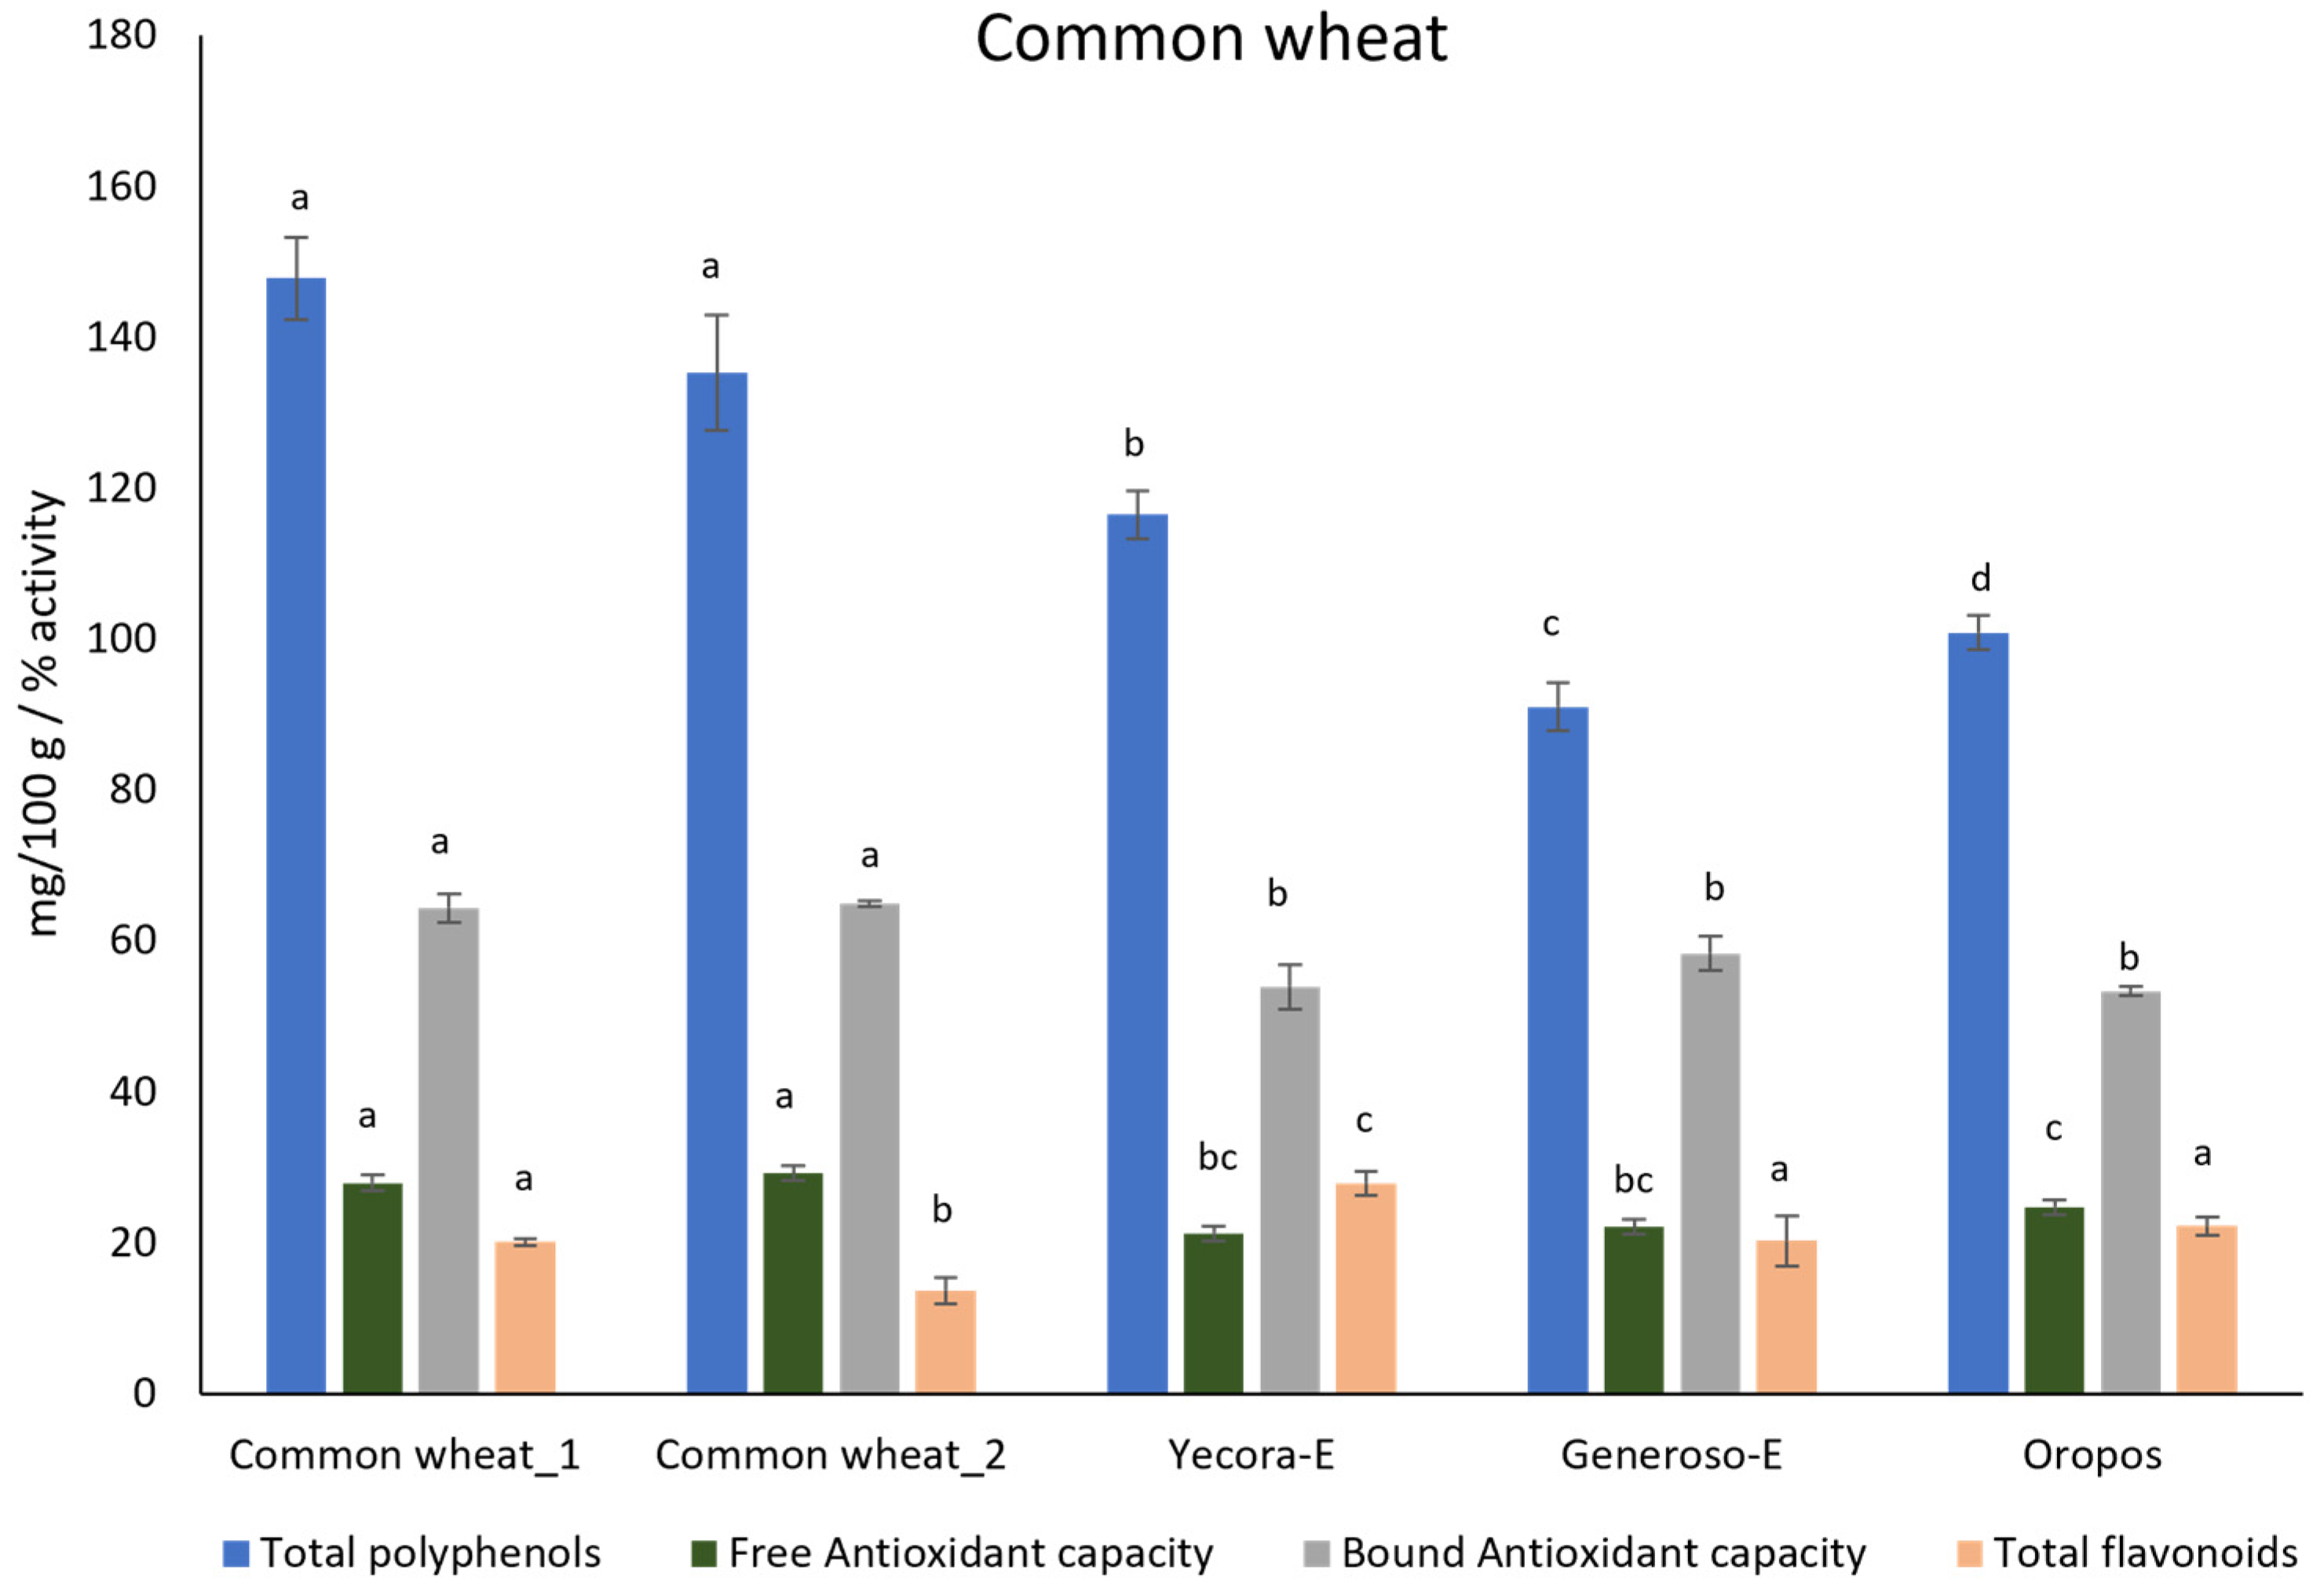
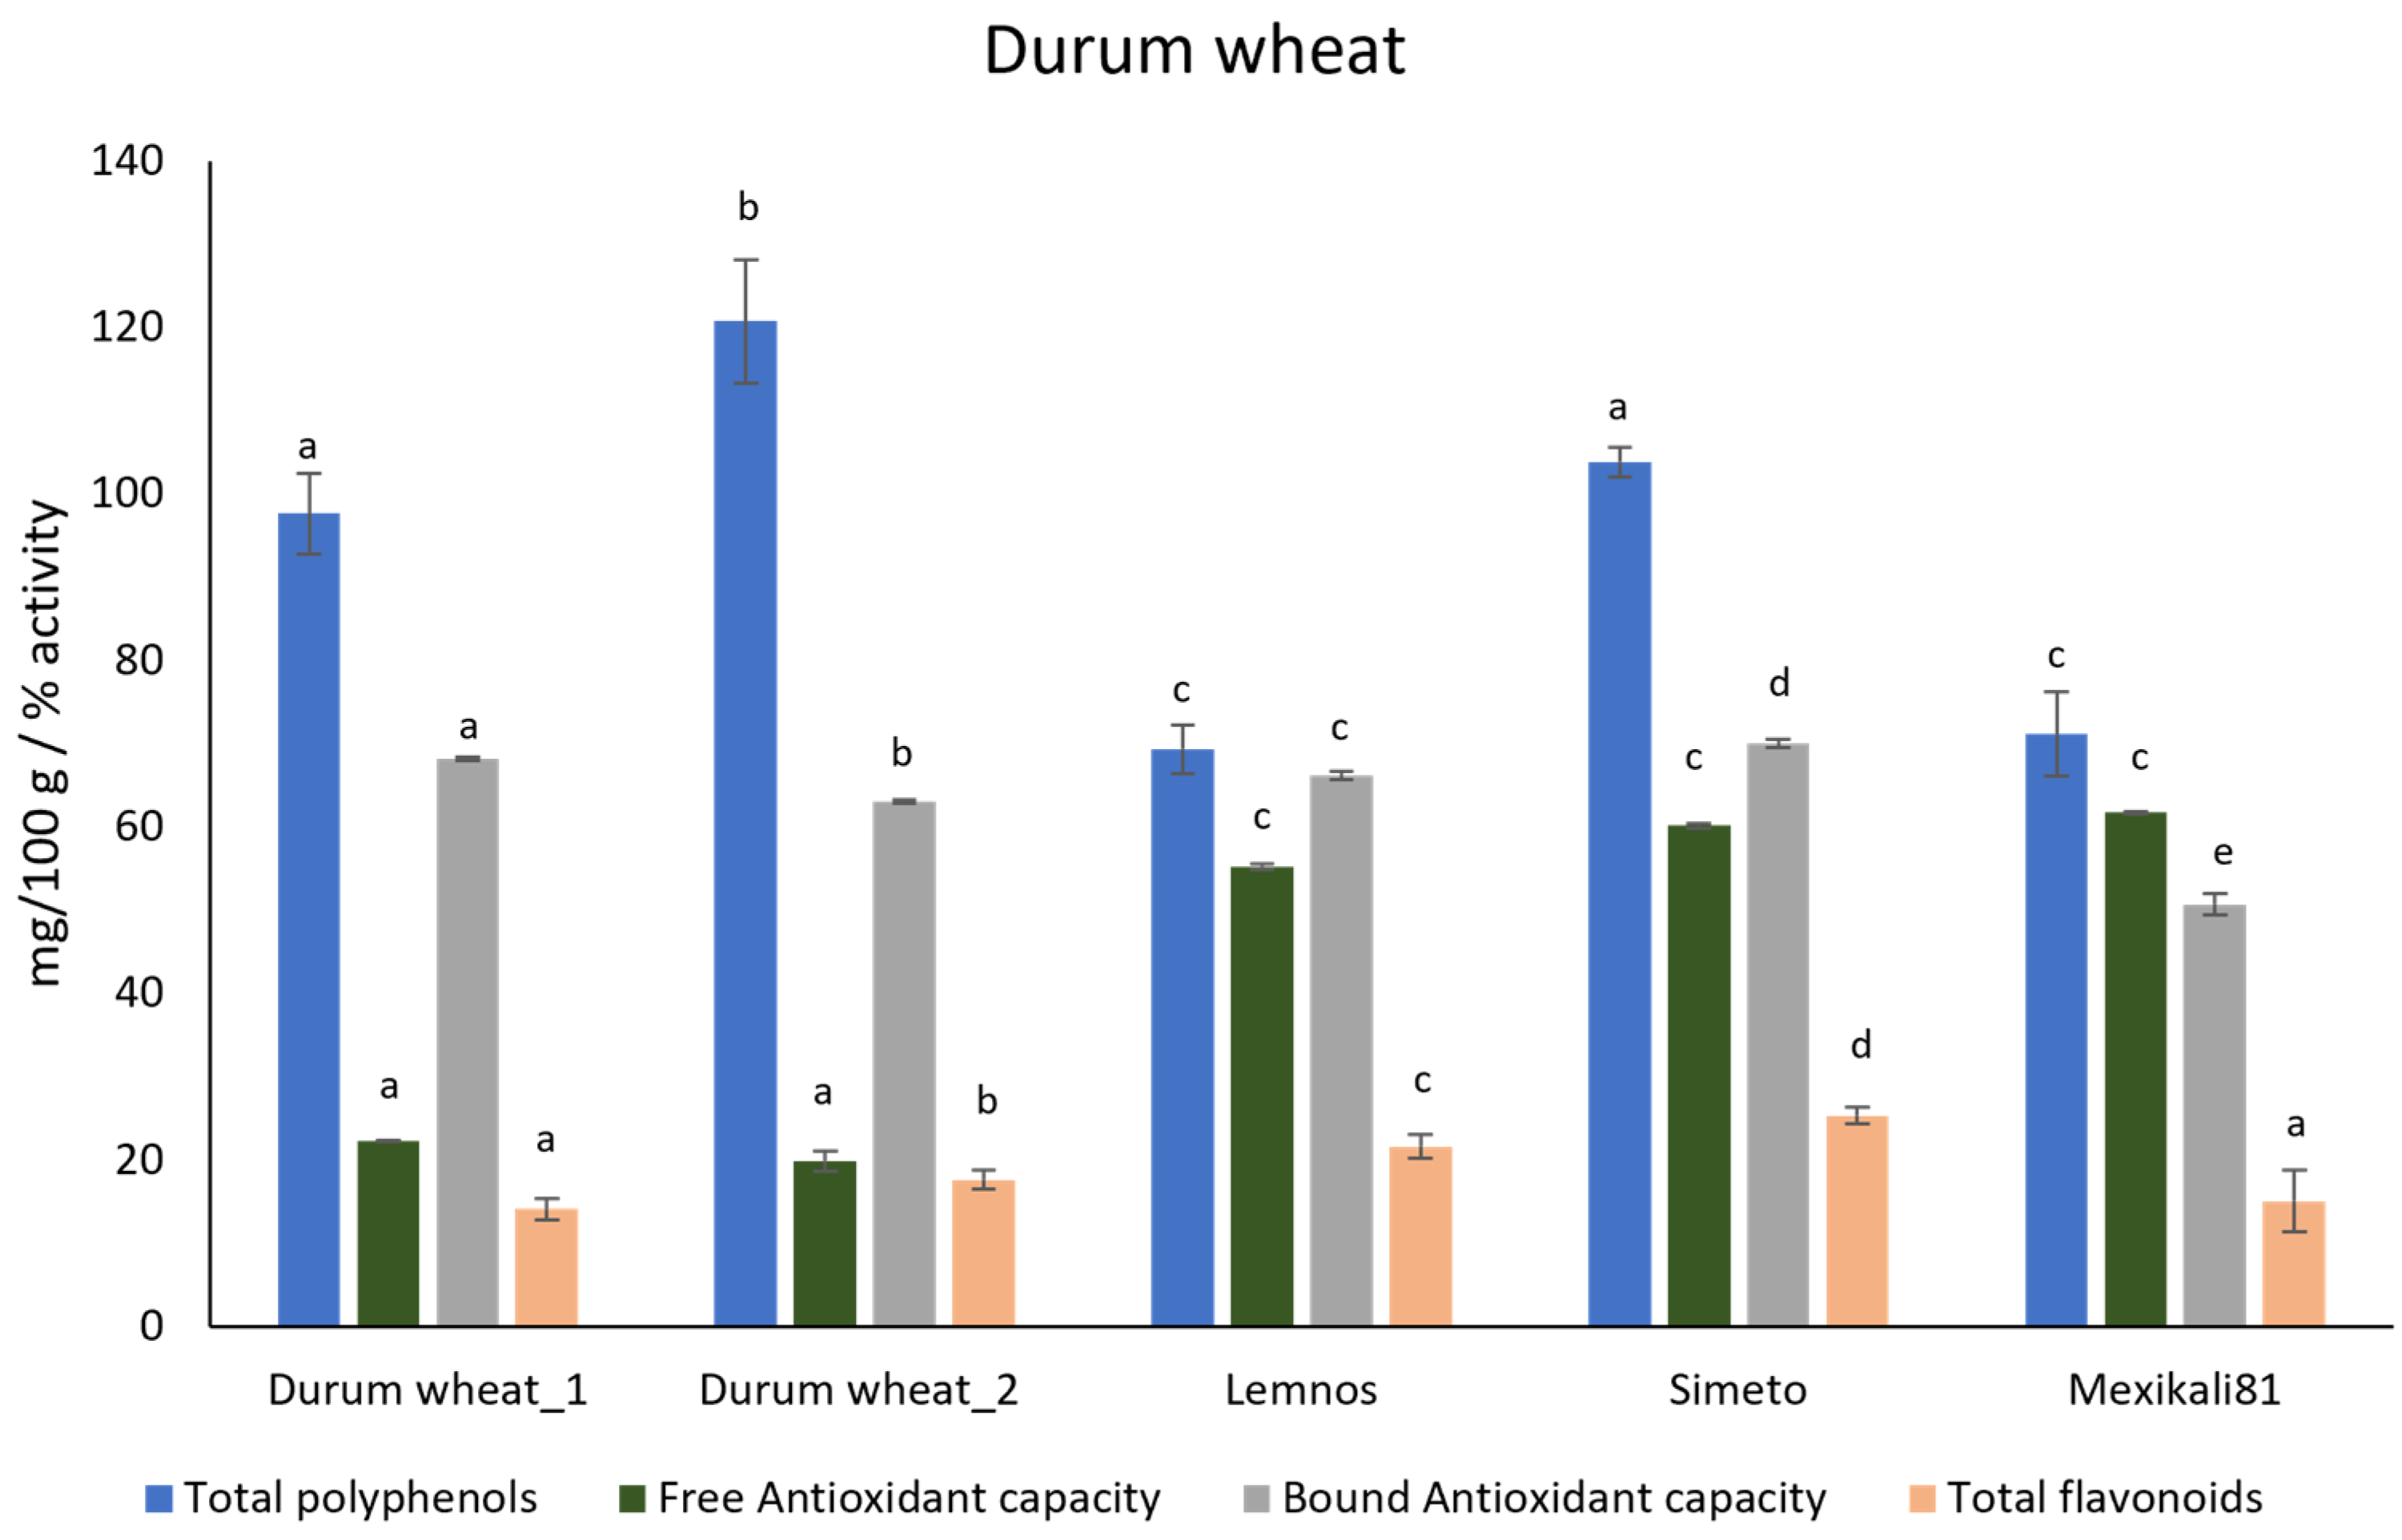
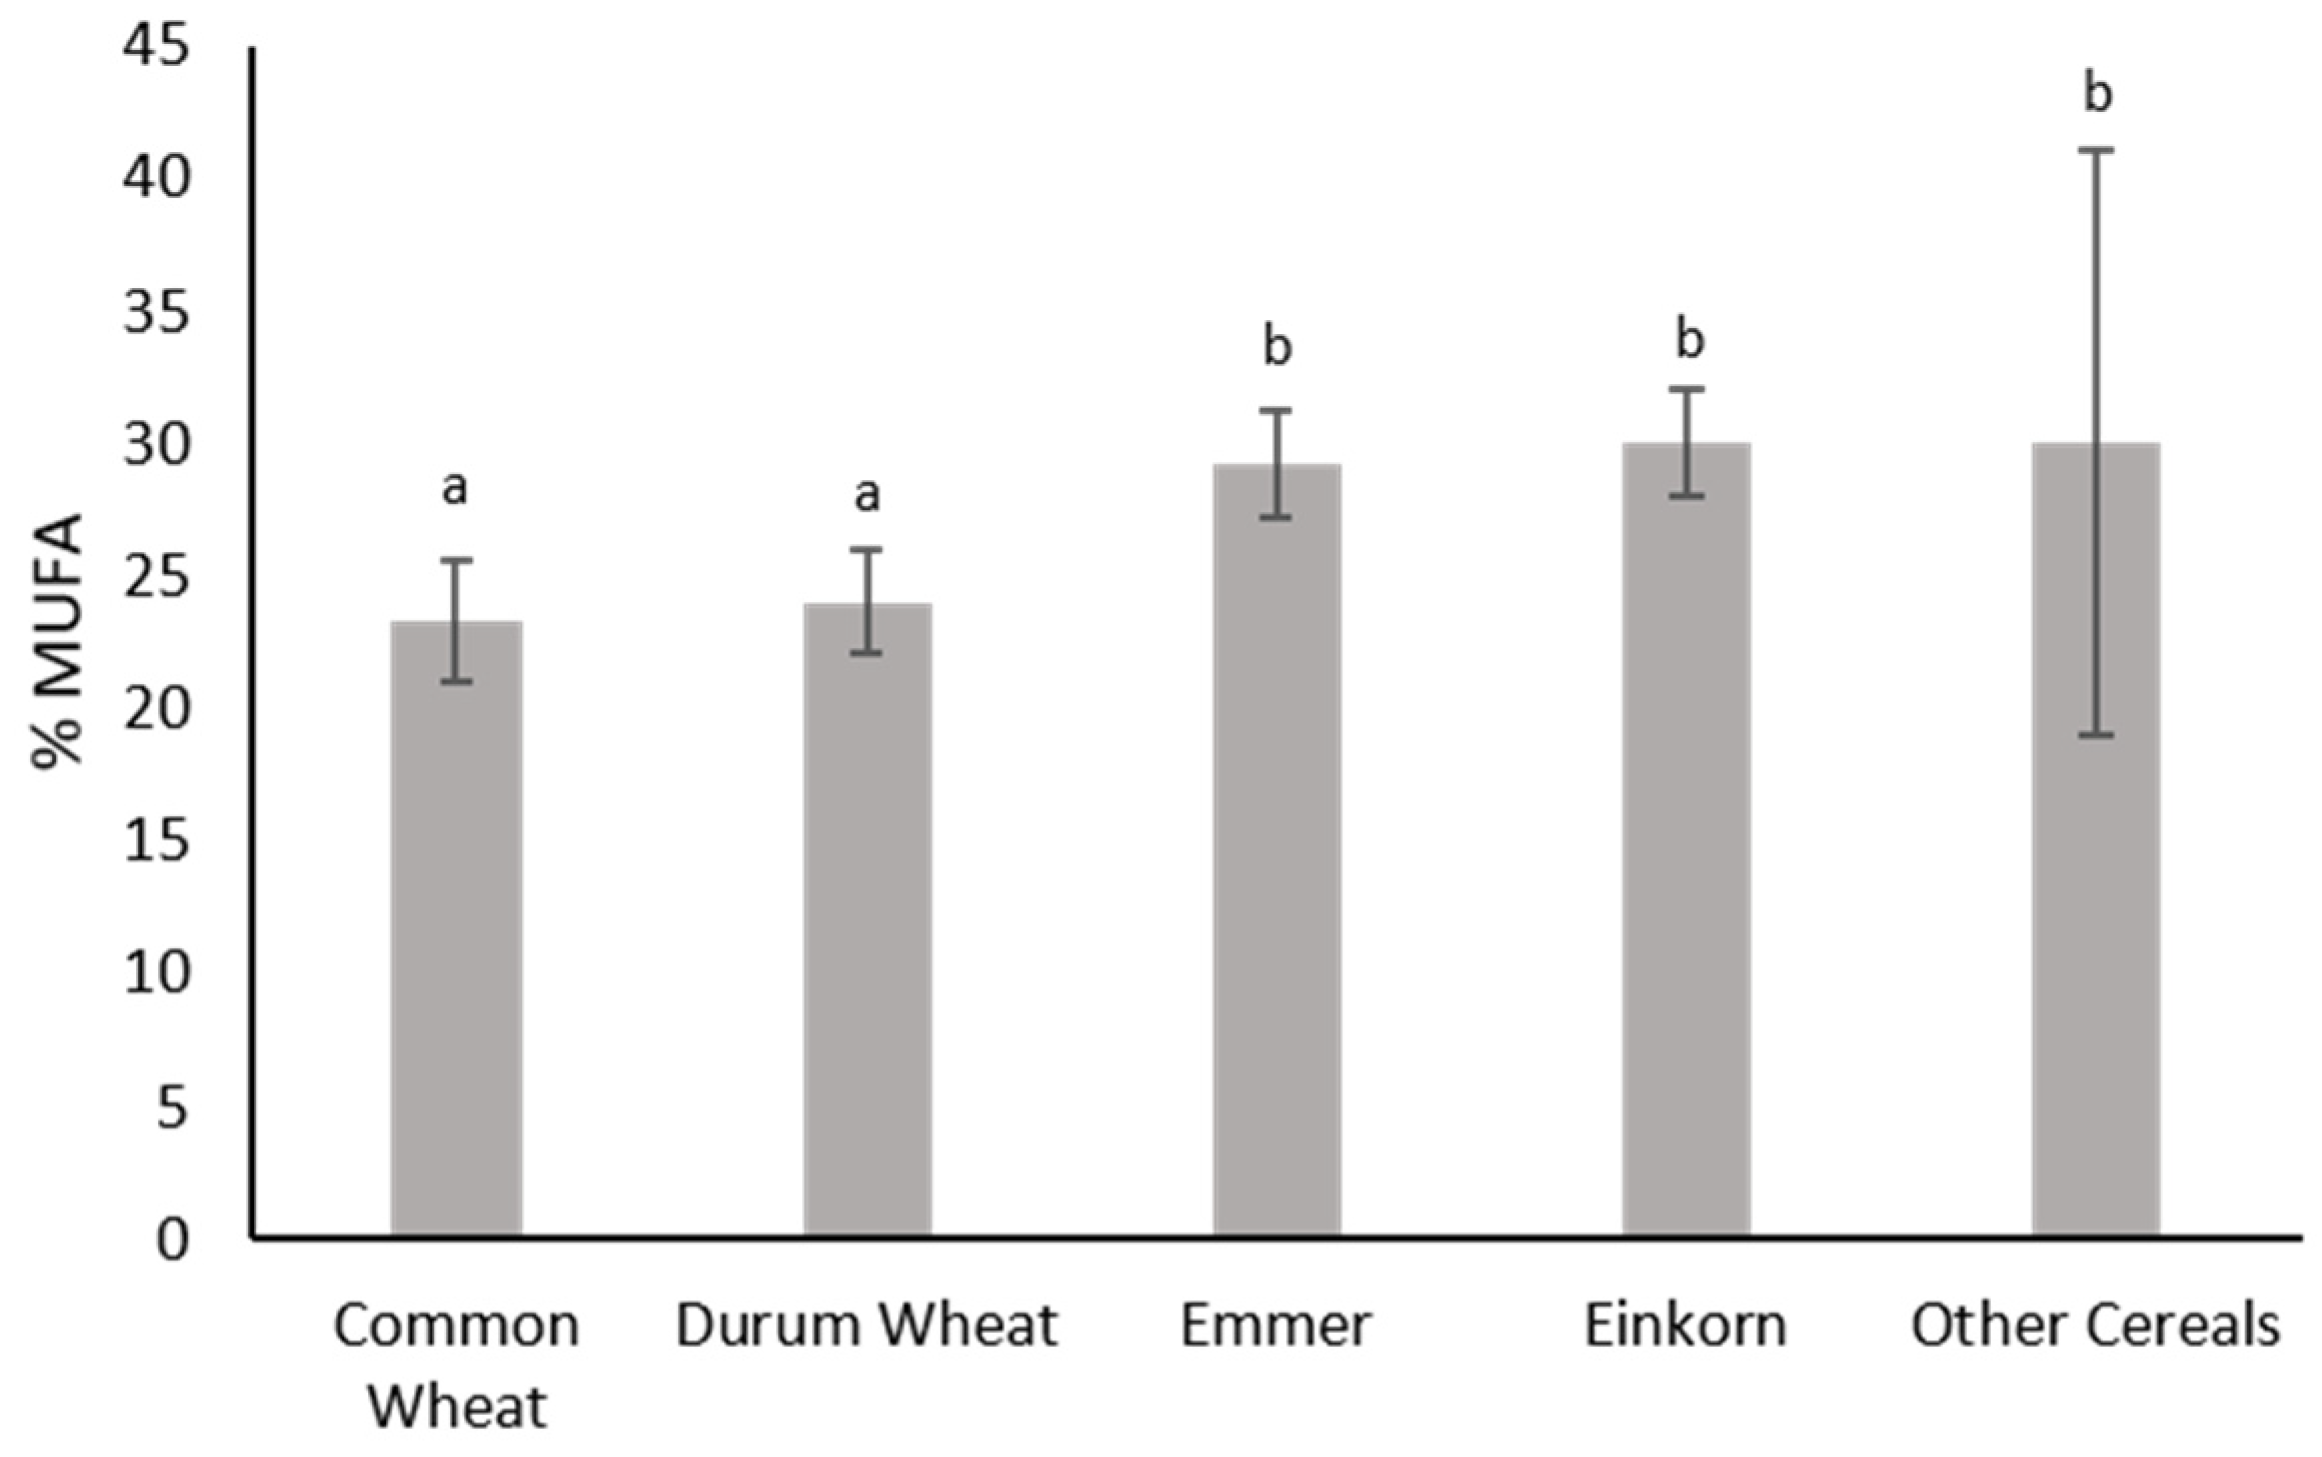
3.2. Biochemical Analysis

Biochemical analysis revealed variation between the different samples (Table S1), which were grouped as common wheat (samples 1–5), durum wheat (samples 6–10) and other cereals (samples 13–15). Total polyphenol content and total flavonoids of the 15 samples were estimated as free and bound values, by means of gallic acid equivalents (Figure 3) and quercetin (Figure 4), respectively.
The concentration of polyphenols and flavonoids followed the same pattern, where emmer and einkorn samples exhibited significantly higher values of bound and total content. The concentration of free polyphenols ranged from 32.88 to 62.57 mg of gallic acid equivalent/100 g, exhibiting the highest value in other cereals, and more specifically in barley, and the lowest in durum wheat. Bound polyphenols had values of 59.68–254.74 mg of gallic acid equivalent/100 g, with the highest value measured in einkorn and the lowest in durum wheat. Total polyphenols, estimated as the sum of free and bound values, ranged from 92.56 (durum wheat) to 305.86 (einkorn) mg of gallic acid equivalent/100 g. The concentration of free polyphenols and flavonoids did not vary significantly between emmer, einkorn and other wheat or cereal samples. Free flavonoid values ranged from 5.63 to 10 mg of quercetin/100 g, with the highest value measured in emmer and the lowest in durum wheat. Bound flavonoids were measured higher than free in all the samples, at 11.59 (other cereals) and 37.34 (einkorn) mg of quercetin/100 g, while total flavonoids were found at 18.77 and 43.5 mg of quercetin/100 g in durum wheat and einkorn, respectively. Both polyphenols and flavonoids showed great variation in common wheat and other cereals, as a result of the differences observed within each group (Table S1).
Regarding the concentration of antioxidants, expressed as percentage of scavenging activity, no statistically significant differences were observed between wheat species (Figure 5). In more detail, free scavenging activity was measured higher in durum wheat but not significantly higher than common wheat or emmer, as great variability was observed between cultivars. Bound scavenging activity was quantified at 59–88%, with the highest value measured in the einkorn sample. Only common wheat had significantly lower scavenging activity than emmer and einkorn, while durum wheat did not differ significantly. Scavenging activity exhibited great variance in other cereals since barley had three times higher free scavenging activity (Table S1).
It is worth noting that among common wheat samples, the two Greek local landraces, common wheat_1 and 2, exhibited the highest percentage of total polyphenols and of free and bound antioxidant capacity, while flavonoid concentration was at the same level as the commercial cultivars, Yecora-E, Generoso-E and Oropos (Figure 6). Between durum wheat samples, the two Greek local landraces, durum wheat_1 and 2, did not exhibit higher values in the biochemical aspects assessed (Figure 7). Only durum wheat_2 had a significantly higher concentration of total polyphenols than every other sample.
The fatty acid analysis revealed five main fatty acids present in all samples. These were, in order of decreasing amounts, linoleic acid (C18:2) > palmitic acid (C16:0) ≈ oleic acid (C18:1) > eicosenoic acid (C20:1, cis-11) > stearic acid (C18:0) (data not shown). Linoleic acid ranged from 49 to 57.52% of total fatty acids, with the lowest value observed in other cereals and the highest in common wheat. Einkorn and emmer had linoleic acid at a percentage of approx. 51%. The percentage content of mono-unsaturated fatty acids (MUFA) is shown in Figure 8. Emmer (29.20%) and einkorn (30%) had significantly higher % MUFA than common and durum wheat, measured at 23.26% and 24%, respectively. Interestingly, oat had the highest percentage of all samples, at 42.26% (Table S1), two times higher than other cereals, due to the great variation observed within this group.

4. Discussion

Modern wheat cultivars have been developed after years of extensive breeding, leading to higher-yielding crops with pest and disease resistance [34]. However, old local landraces are better adapted to the local environment, exhibiting resistance to harsh environmental conditions, are better adapted to poor soils, require lower input of water and fertilizers, and in many cases exhibit better quality characteristics [35]. Thus, their genetic and nutritional evaluation is of special interest.
In the current study, genetic variability was observed among the samples analyzed. The use of ITS2 barcoding allowed, as expected, the separation of rye, oat and barley from wheat samples. Within Triticum species, only einkorn, T. monococcm, had a different ITS2 sequence from T. aestivum and T. turgidum, which could not be differentiated. The inability of the ITS2 barcode to distinguish Triticum species has been explained by Hollingsworth et al., 2011 [36] and attributed to the polyploidy of the wheat species and the hybridization events that happened during their domestication. More research showed that the ITS2 barcode failed to discriminate T. aestivum and T. turgidum species alone, as the hexaploid wheat (T. aestivum) was originated from the tetraploid wheat T. turgidum [37,38].
The use of SSR markers for the discrimination of common from durum wheat, and also between cultivars within each species, has been well established in the literature [23,39,40,41,42,43,44,45,46]. Consistent with that, in the current study, the SSR markers used were able to separate not only T. aestivum from T. turgidum but also the subspecies T. turgidum ssp. durum and Triticum turgidum ssp. dicoccum. Moreover, the different cultivars within each wheat species exhibited a different allele pattern, resulting in a unique genetic profile for each sample, as depicted in the phylogenetic tree (Figure 2). The average number of alleles per marker detected in our study (7.1) was in accordance with other studies that reported 7.2 and 6.32 alleles per marker [44,47], respectively. The range of amplification products in this study is similar to the values reported by Mangini et al., 2010 [42], while the number of alleles and PIC values show some discrepancies, possibly due to sample size differences.
The health benefits provided by cereal consumption has led to an increased interest in the bioactive compounds of wheat cultivars, since wheat consumption counts for 20% of human caloric intake (FAOSTAT) [48]. A renewed interest in ancient grains is also observed, as they seem to have unique nutraceutical properties [27]. Therefore, after determining the genetic profile of each sample, we assessed its nutritional value by measuring certain biochemical factors.
Studies have suggested that the largest phytochemical content of grains is in bound rather than free form, since these compounds are attached to the cell walls [49]. For this reason, we evaluated both free and bound compounds, by performing alkaline digestion in the samples after the estimation of free compounds. Indeed, bound polyphenols, flavonoids and antioxidant activity were significantly higher than the free form. There is a suggestion that the bound form of bioactive compounds may survive stomach and intestinal digestion and finally reach the colon, possibly explaining the protective mechanism of grain consumption against colon cancer, other digestive cancers and even breast cancer and prostate cancer [27,50]. Interestingly, other studies showed a better absorption of the free form of ferulic acid, the most abundant phenolic acid of wheat, compared to its bound form, suggesting that the binding of ferulic acid to polysaccharides prevented its release to the small intestine [51]. The values of free, bound and total polyphenols and flavonoids reported in this study were very similar to the concentrations reported by Leoncini et al., 2012 [34], where it was shown that polyphenols and flavonoids were higher in old Italian wheat genotypes compared to a modern common wheat cultivar. Another study comparing wild H. vulgare, T. monococcum and T. dicoccum species to the cultivated forms showed a reduction in the total quantity of phenolics in the latter species [8]. In our study, total polyphenols and free antioxidant capacity were measured higher in the two local landraces of common wheat compared to the modern cultivars of Yecora-E, Generoso-E and Oropos. In durum wheat, this was only observed in the total polyphenols of the local landrace durum wheat_2, while all the other values were at the same levels with the modern cultivars.
The fatty acid profile of the samples of this study was in accordance with other samples of common and durum wheat, where linoleic acid was the most abundant fatty acid [52]. Moreover, the percentage of MUFA found in our study for common and durum wheat was in the same range as in the study mentioned above, where it was found at 16–24% [52]. The MUFA percentage of einkorn was in accordance with a study of a Turkish cultivar, reporting it at 32% [53]. The statistically higher percentage of MUFA in einkorn and emmer, compared to common wheat, was also reported by Suchowilska et al., 2009 [54], who found that einkorn had significantly higher MUFA % than emmer, which was not observed in our dataset. It is well established that dietary mono-unsaturated fatty acids promote a healthy blood lipid profile, may control blood pressure, and favorably modulate insulin sensitivity and glycemic control [55]; thus, it is generally advisable to consume foods with high MUFA %.
Our results clearly showed that emmer and einkorn samples had higher concentrations of polyphenols and flavonoids compared to common and durum wheat, with einkorn exhibiting the highest concentrations. This agrees with a study on different Triticum species that also observed higher total phenolic values in einkorn samples compared to emmer, khorasan, spelt, durum and common wheat, in concentrations similar to our study [56]. Other studies have found that emmer contains 60–65% more phenolics than einkorn, while no clear concentration pattern regarding phenolics was observed between common, durum wheat, emmer and einkorn [57], with the latter being also observed by Grausgruber et al., 2004 [58]. It is worth noting that the samples of emmer and einkorn used in the current study were also evaluated by Tsirivakou et al., 2020 regarding alkylresorcinols content and were found to have high concentrations of alkylresorcinols (455–1148 mg/kg), while the same compounds were found in significantly lower amounts in grains of common and durum wheat [13]. The biochemical profile of each sample cannot be solely attributed to its genotype, since research has shown that genotype-by-environment interactions shape the content of secondary metabolites [52]. A larger dataset, including more genotypes and environmental conditions could shed light on this phenomenon.

5. Conclusions

In conclusion, all the cultivars and landraces evaluated in this study exhibited a unique genetic profile, which led to their being grouped according to their species. The biochemical analysis revealed that ancient wheat varieties of einkorn and emmer had higher concentrations of bioactive compounds than common and durum wheat, while old landraces of common and durum wheat showed higher phenolic content than modern cultivars. These results highlight the importance of maintaining and cultivating landraces that may be lower yielding than commercial cultivars but exhibit excellent quality characteristics. Studies like the current one may help researchers and producers to decide on the feasibility of reintroducing traditional varieties into extensive cultivation, serving as a pivotal step toward their preservation and revival.

Supplementary Materials

The following supporting information can be downloaded at: https://www.mdpi.com/article/10.3390/agronomy13112703/s1; Table S1: Values of all the biochemical factors assessed.

Author Contributions

Conceptualization, A.T. and A.A.; methodology, S.D. and I.B.; formal analysis, S.D. and N.M.; investigation, S.D. and N.M.; data curation, S.D., I.M. and N.M.; writing—original draft preparation, N.M.; writing—review and editing, N.M. and A.A.; supervision, M.K. and A.A.; project administration, I.M. and A.A.; funding acquisition, A.A. All authors have read and agreed to the published version of the manuscript.

Funding

This research is implemented in the framework of the GrWheat research project (project code MIS 5072523), which was co-funded by the European Union and Greek National Funds through the Operational Program Competitiveness, Entrepreneurship and Innovation, under the call Research-Create-Innovate.

Data Availability Statement

Data are only available on request due to privacy restrictions.

Acknowledgments

We would like to thank Evangelos Papaspyros, Department of Chemical Engineering, University of Patras, 26504 Patras, Greece, for his insights into biochemical analysis.

Conflicts of Interest

The authors declare no conflict of interest.

References

  1. Abdellatif, K.F.; AbouZeid, H.M. Assessment of Genetic Diversity of Mediterranean Bread Wheat Using Randomly Amplified Polymorphic DNA (RAPD) Markers. J. Genet. Eng. Biotechnol. 2011, 9, 157–163. [Google Scholar] [CrossRef]
  2. FAOSTAT. Crops and Livestock Products; FAOSTAT: Rome, Italy, 2022. [Google Scholar]
  3. Lukaszewski, A.J.; Alberti, A.; Sharpe, A.; Kilian, A.; Stanca, A.M.; Keller, B.; Clavijo, B.J.; Friebe, B.; Gill, B.; Wulff, B.; et al. A Chromosome-Based Draft Sequence of the Hexaploid Bread Wheat (Triticum aestivum) Genome. Science 2014, 345, 1251788. [Google Scholar] [CrossRef]
  4. Kabbaj, H.; Sall, A.T.; Al-Abdallat, A.; Geleta, M.; Amri, A.; Filali-Maltouf, A.; Belkadi, B.; Ortiz, R.; Bassi, F.M. Genetic Diversity within a Global Panel of Durum Wheat (Triticum durum) Landraces and Modern Germplasm Reveals the History of Alleles Exchange. Front. Plant Sci. 2017, 8, 1277. [Google Scholar] [CrossRef]
  5. Zohary, D.; Hopf, M. Domestication of Plants in the Old World: The Origin and Spread of Cultivated Plants in West Asia, Europe and the Nile Valley, 3rd ed.; Zohary, D., Hopf, M., Eds.; Oxford University Press: Oxford, UK, 2000. [Google Scholar]
  6. Akhunov, E.D.; Akhunova, A.R.; Dvořák, J. BAC Libraries of Triticum Urartu, Aegilops Speltoides and Ae. Tauschii, the Diploid Ancestors of Polyploid Wheat. Theor. Appl. Genet. 2005, 111, 1617–1622. [Google Scholar] [CrossRef]
  7. Di Francesco, A.; Cunsolo, V.; Saletti, R.; Svensson, B.; Muccilli, V.; De Vita, P.; Foti, S. Quantitative Label-Free Comparison of the Metabolic Protein Fraction in Old and Modern Italian Wheat Genotypes by a Shotgun Approach. Molecules 2021, 26, 2596. [Google Scholar] [CrossRef]
  8. Cooper, R. Re-Discovering Ancient Wheat Varieties as Functional Foods. J. Tradit. Complement Med. 2015, 5, 138–143. [Google Scholar] [CrossRef] [PubMed]
  9. Shewry, P.R.; Hey, S. Do “Ancient” Wheat Species Differ from Modern Bread Wheat in Their Contents of Bioactive Components? J. Cereal Sci. 2015, 65, 236–243. [Google Scholar] [CrossRef]
  10. Geisslitz, S.; Longin, C.F.H.; Scherf, K.A.; Koehler, P. Comparative Study on Gluten Protein Composition of Ancient (Einkorn, Emmer and Spelt) and Modern Wheat Species (Durum and Common Wheat). Foods 2019, 8, 409. [Google Scholar] [CrossRef]
  11. Lachman, J.; Hejtmánková, K.; Kotíková, Z. Tocols and Carotenoids of Einkorn, Emmer and Spring Wheat Varieties: Selection for Breeding and Production. J. Cereal Sci. 2013, 57, 207–214. [Google Scholar] [CrossRef]
  12. Ruibal-Mendieta, N.L.; Delacroix, D.L.; Mignolet, E.; Pycke, J.M.; Marques, C.; Rozenberg, R.; Petitjean, G.; Habib-Jiwan, J.L.; Meurens, M.; Quetin-Leclercq, J.; et al. Spelt (Triticum aestivum ssp. Spelta) as a Source of Breadmaking Flours and Bran Naturally Enriched in Oleic Acid and Minerals but Not Phytic Acid. J. Agric. Food Chem. 2005, 53, 2751–2759. [Google Scholar] [CrossRef]
  13. Tsirivakou, A.; Melliou, E.; Magiatis, P. A Method for the Rapid Measurement of Alkylresorcinols in Flour, Bread and Related Products Based on 1H QNMR. Foods 2020, 9, 1025. [Google Scholar] [CrossRef]
  14. Liu, J.; Hao, Y.; Wang, Z.; Ni, F.; Wang, Y.; Gong, L.; Sun, B.; Wang, J. Identification, Quantification, and Anti-Inflammatory Activity of 5-n-Alkylresorcinols from 21 Different Wheat Varieties. J. Agric. Food Chem. 2018, 66, 9241–9247. [Google Scholar] [CrossRef] [PubMed]
  15. Agorastos, A.G.; Goulas, C.K. Line Selection for Exploiting Durum Wheat (T. turgidum L. Var. Durum) Local Landraces in Modern Variety Development Program. Euphytica 2005, 146, 117–124. [Google Scholar] [CrossRef]
  16. Fatkullin, R.; Naumenko, N.; Popova, N.; Ruskina, A.; Kalinina, I.; Potoroko, I. Explaining Consumer Intentions for Foods with Antioxidant Properties: Predictors of Choice and Purchase Barriers. Int. J. Food Sci. 2021, 2021, 9971425. [Google Scholar] [CrossRef] [PubMed]
  17. Abouzied, H.; Eldemery, S.; Abdellatif, K. SSR-Based Genetic Diversity Assessment in Tetraploid and Hexaploid Wheat Populations. Br. Biotechnol. J. 2013, 3, 390–404. [Google Scholar] [CrossRef]
  18. Xynias, I.N.; Mylonas, I.; Korpetis, E.G.; Ninou, E.; Tsaballa, A.; Avdikos, I.D.; Mavromatis, A.G. Durum Wheat Breeding in the Mediterranean Region: Current Status and Future Prospects. Agronomy 2020, 10, 432. [Google Scholar] [CrossRef]
  19. Yao, H.; Song, J.; Liu, C.; Luo, K.; Han, J.; Li, Y.; Pang, X.; Xu, H.; Zhu, Y.; Xiao, P.; et al. Use of ITS2 Region as the Universal DNA Barcode for Plants and Animals. PLoS ONE 2010, 5, e13102. [Google Scholar] [CrossRef]
  20. Kumar, S.; Stecher, G.; Li, M.; Knyaz, C.; Tamura, K. MEGA X: Molecular Evolutionary Genetics Analysis across Computing Platforms. Mol. Biol. Evol. 2018, 35, 1547–1549. [Google Scholar] [CrossRef]
  21. Saitou, N.; Nei, M. The Neighbor-Joining Method: A New Method for Reconstructing Phylogenetic Trees. Mol. Biol. Evol. 1987, 4, 406–425. [Google Scholar] [CrossRef]
  22. Röder, M.S.; Korzun, V.; Wendehake, K.; Plaschke, J.; Tixier, M.H.; Leroy, P.; Ganal, M.W. A Microsatellite Map of Wheat. Genetics 1998, 149, 2007. [Google Scholar] [CrossRef]
  23. Gupta, P.K.; Balyan, H.S.; Edwards, K.J.; Isaac, P.; Korzun, V.; Röder, M.; Gautier, M.F.; Joudrier, P.; Schlatter, A.R.; Dubcovsky, J.; et al. Genetic Mapping of 66 New Microsatellite (SSR) Loci in Bread Wheat. Theor. Appl. Genet. 2002, 105, 413–422. [Google Scholar] [CrossRef] [PubMed]
  24. Peakall, R.; Smouse, P.E. GenAlEx 6.5: Genetic Analysis in Excel. Population Genetic Software for Teaching and Research—An Update. Bioinform. Appl. 2012, 28, 2537–2539. [Google Scholar] [CrossRef] [PubMed]
  25. Roldán-Ruiz, I.; Dendauw, J.; Van Bockstaele, E.; Depicker, A.; De Loose, M. AFLP Markers Reveal High Polymorphic Rates in Ryegrasses (Lolium spp.). Mol. Breed. 2000, 6, 125–134. [Google Scholar] [CrossRef]
  26. Kaur, N.; Singh, B.; Kaur, A.; Yadav, M.P.; Singh, N.; Ahlawat, A.K.; Singh, A.M. Effect of Growing Conditions on Proximate, Mineral, Amino Acid, Phenolic Composition and Antioxidant Properties of Wheatgrass from Different Wheat (Triticum aestivum L.) Varieties. Food Chem. 2021, 341, 128201. [Google Scholar] [CrossRef]
  27. Adom, K.K.; Sorrells, M.E.; Liu, R.H. Phytochemical Profiles and Antioxidant Activity of Wheat Varieties. J. Agric. Food Chem. 2003, 51, 7825–7834. [Google Scholar] [CrossRef]
  28. Singleton, V.L.; Orthofer, R.; Lamuela-Raventós, R.M. Analysis of Total Phenols and Other Oxidation Substrates and Antioxidants by Means of Folin-Ciocalteu Reagent. Methods Enzymol. 1999, 299, 152–178. [Google Scholar] [CrossRef]
  29. Liu, M.; Li, X.Q.; Weber, C.; Lee, C.Y.; Brown, J.; Liu, R.H. Antioxidant and Antiproliferative Activities of Raspberries. J. Agric. Food Chem. 2002, 50, 2926–2930. [Google Scholar] [CrossRef]
  30. Bhinder, S.; Singh, B.; Kaur, A.; Singh, N.; Kaur, M.; Kumari, S.; Yadav, M.P. Effect of Infrared Roasting on Antioxidant Activity, Phenolic Composition and Maillard Reaction Products of Tartary Buckwheat Varieties. Food Chem. 2019, 285, 240–251. [Google Scholar] [CrossRef]
  31. O’Fallon, J.V.; Busboom, J.R.; Nelson, M.L.; Gaskins, C.T. A Direct Method for Fatty Acid Methyl Ester Synthesis: Application to Wet Meat Tissues, Oils, and Feedstuffs. J. Anim. Sci. 2007, 85, 1511–1521. [Google Scholar] [CrossRef]
  32. Avise, J. Molecular Markers, Natural History and Evolution; Springer Science and Business Media, LLC: New York, NY, USA, 1994; ISBN 0-412-03771-8. [Google Scholar]
  33. Harris, A.M.; DeGiorgio, M. An Unbiased Estimator of Gene Diversity with Improved Variance for Samples Containing Related and Inbred Individuals of Any Ploidy. G3 2017, 7, 671–691. [Google Scholar] [CrossRef]
  34. Leoncini, E.; Prata, C.; Malaguti, M.; Marotti, I.; Segura-Carretero, A.; Catizone, P.; Dinelli, G.; Hrelia, S. Phytochemical Profile and Nutraceutical Value of Old and Modern Common Wheat Cultivars. PLoS ONE 2012, 7, e45997. [Google Scholar] [CrossRef]
  35. Ruisi, P.; Frangipane, B.; Amato, G.; Frenda, A.S.; Plaia, A.; Giambalvo, D.; Saia, S. Nitrogen Uptake and Nitrogen Fertilizer Recovery in Old and Modern Wheat Genotypes Grown in the Presence or Absence of Interspecific Competition. Front. Plant Sci. 2015, 6, 185. [Google Scholar] [CrossRef] [PubMed]
  36. Hollingsworth, P.M.; Graham, S.W.; Little, D.P. Choosing and Using a Plant DNA Barcode. PLoS ONE 2011, 6, e19254. [Google Scholar] [CrossRef]
  37. Raveendar, S.; Lee, G.A.; Lee, K.J.; Shin, M.J.; Kim, S.H.; Lee, J.R.; Cho, G.T.; Hyun, D.Y. DNA Barcoding for Efficient Identification of Triticum Subspecies: Evaluation of Four Candidate Loci on Phylogenetic Relationships. Plant Breed. Biotechnol. 2019, 7, 220–228. [Google Scholar] [CrossRef]
  38. Ganopoulos, I.; Kapazoglou, A.; Bosmali, I.; Xanthopoulou, A.; Nianiou-Obeidat, I.; Tsaftaris, A.; Madesis, P. Application of the Its2 Region for Barcoding Plants of the Genus Triticum L. and Aegilops L. Cereal Res. Commun. 2017, 45, 381–389. [Google Scholar] [CrossRef]
  39. Roussel, V.; Leisova, L.; Exbrayat, F.; Stehno, Z.; Balfourier, F. SSR Allelic Diversity Changes in 480 European Bread Wheat Varieties Released from 1840 to 2000. Theor. Appl. Genet. 2005, 111, 162–170. [Google Scholar] [CrossRef]
  40. Landjeva, S.; Korzun, V.; Ganeva, G. Evaluation of Genetic Diversity among Bulgarian Winter Wheat (Triticum aestivum L.) Varieties during the Period 1925-2003 Using Microsatellites. Genet. Resour. Crop. Evol. 2006, 53, 1605–1614. [Google Scholar] [CrossRef]
  41. Röder, M.S.; Wendehake, K.; Korzun, V.; Bredemeijer, G.; Laborie, D.; Bertrand, L.; Isaac, P.; Rendell, S.; Jackson, J.; Cooke, R.J.; et al. Construction and Analysis of a Microsatellite-Based Database of European Wheat Varieties. Theor. Appl. Genet. 2002, 106, 67–73. [Google Scholar] [CrossRef]
  42. Mangini, G.; Taranto, F.; Giove, S.L.; Gadaleta, A.; Blanco, A. Identification of Durum Wheat Cultivars by a Minimum Number of Microsatellite Markers. Cereal Res. Commun. 2010, 38, 155–162. [Google Scholar] [CrossRef]
  43. Pasqualone, A.; Alba, V.; Mangini, G.; Blanco, A.; Montemurro, C. Durum Wheat Cultivar Traceability in PDO Altamura Bread by Analysis of DNA Microsatellites. Eur. Food Res. Technol. 2010, 230, 723–729. [Google Scholar] [CrossRef]
  44. Wang, Y.; Wang, C.; Zhang, H.; Yue, Z.; Liu, X.; Ji, W. Genetic Analysis of Wheat (Triticum aestivum L.) and Related Species with SSR Markers. Genet. Resour. Crop. Evol. 2013, 60, 1105–1117. [Google Scholar] [CrossRef]
  45. Song, Q.J.; Shi, A.J.R.; Singh, A.S.; Fickus, A.E.W.; Costa, J.M.; Lewis, A.J.; Gill, A.B.S.; Ward, A.R.; Cregan, P.B. Development and Mapping of Microsatellite (SSR) Markers in Wheat. Theor. Appl. Genet. 2005, 110, 550–560. [Google Scholar] [CrossRef]
  46. Torada, A.; Koike, M.; Mochida, K.; Ogihara, Y. SSR-Based Linkage Map with New Markers Using an Intraspecific Population of Common Wheat. Theor. Appl. Genet. 2006, 112, 1042–1051. [Google Scholar] [CrossRef]
  47. Chao, S.; Zhang, W.; Dubcovsky, J.; Sorrells, M. Evaluation of Genetic Diversity and Genome-Wide Linkage Disequilibrium among U.S. Wheat (Triticum aestivum L.) Germplasm Representing Different Market Classes. Crop. Sci. 2007, 47, 1018–1030. [Google Scholar] [CrossRef]
  48. FAOSTAT FAO Cereal Supply and Demand Brief | World Food Situation | Food and Agriculture Organization of the United Nations. Available online: https://www.fao.org/worldfoodsituation/csdb/en/ (accessed on 18 July 2022).
  49. Adom, K.K.; Liu, R.H. Antioxidant Activity of Grains. J. Agric. Food Chem. 2002, 50, 6182–6187. [Google Scholar] [CrossRef]
  50. Laddomada, B.; Caretto, S.; Mita, G. Wheat Bran Phenolic Acids: Bioavailability and Stability in Whole Wheat-Based Foods. Molecules 2015, 20, 15666–15685. [Google Scholar] [CrossRef] [PubMed]
  51. Anson, N.M.; van den Berg, R.; Havenaar, R.; Bast, A.; Haenen, G.R.M.M. Bioavailability of Ferulic Acid Is Determined by Its Bioaccessibility. J. Cereal Sci. 2009, 49, 296–300. [Google Scholar] [CrossRef]
  52. Shamloo, M.; Babawale, E.A.; Furtado, A.; Henry, R.J.; Eck, P.K.; Jones, P.J.H. Effects of Genotype and Temperature on Accumulation of Plant Secondary Metabolites in Canadian and Australian Wheat Grown under Controlled Environments. Sci. Rep. 2017, 7, 9133. [Google Scholar] [CrossRef]
  53. Ayaşan, T.; Kader Esen, V.; Kader Esen, V.; Eseceli, H.; Cabi, E. Arbuscular Mycorrhizae Inoculation of Einkorn Wheat Affects Fatty Acid, Nutrient and Mineral Concentrations. S. Afr. J. Anim. Sci. 2020, 50, 600–606. [Google Scholar] [CrossRef]
  54. Suchowilska, E.; Wiwart, M.; Borejszo, Z.; Packa, D.; Kandler, W.; Krska, R. Discriminant Analysis of Selected Yield Components and Fatty Acid Composition of Chosen Triticum Monococcum, Triticum Dicoccum and Triticum Spelta Accessions. J. Cereal Sci. 2009, 49, 310–315. [Google Scholar] [CrossRef]
  55. Gillingham, L.G.; Harris-Janz, S.; Jones, P.J.H. Dietary Monounsaturated Fatty Acids Are Protective against Metabolic Syndrome and Cardiovascular Disease Risk Factors. Lipids 2011, 46, 209–228. [Google Scholar] [CrossRef] [PubMed]
  56. Abdel-Aal, E.-S.M.; Rabalski, I. Bioactive Compounds and Their Antioxidant Capacity in Selected Primitive and Modern Wheat Species. Open Agric. J. 2008, 2, 7–14. [Google Scholar] [CrossRef]
  57. Giambanelli, E.; Ferioli, F.; Koçaoglu, B.; Jorjadze, M.; Alexieva, I.; Darbinyan, N.; D’Antuono, L.F. A Comparative Study of Bioactive Compounds in Primitive Wheat Populations from Italy, Turkey, Georgia, Bulgaria and Armenia. J. Sci. Food Agric. 2013, 93, 3490–3501. [Google Scholar] [CrossRef]
  58. Grausgruber, H.; Scheiblauer, J.; Schonlechner, R.; Ruckenbauer, P.; Berghofer, E. Variability in Chemical Composition and Biologically Active Constituents of Cereals. In Genetic Variation for Plant Breeding; Vollmann, J., Grausgruber, H., Ruckenbauer, P., Eds.; University of Natural Resources and Applied Life Sciences: Vienna, Austria, 2004; pp. 23–26. [Google Scholar]
Figure 1. Phylogenetic tree of all the ITS2 sequences, using the Neighbor-Joining method. The percentage of replicate trees in which the associated taxa clustered together in the bootstrap test (1000 replicates) is shown next to the branches.
Agronomy 13 02703 g001
Figure 2. Neighbor-Joining phylogenetic tree representing the evolutionary relationships between wheat samples.
Agronomy 13 02703 g002
Figure 3. Concentration of free, bound and total phenolic compounds expressed as gallic acid equivalents per 100 g. Different letters within each value (free, bound or total) indicate statistically important difference (p ≤ 0.05).
Agronomy 13 02703 g003
Figure 4. Concentration of free, bound and total flavonoid compounds expressed as quercetin equivalents per 100 g. Different letters within each value (free, bound or total) indicate statistically important difference (p ≤ 0.05).
Agronomy 13 02703 g004
Figure 5. Scavenging activity (%) of free and bound extracts. Different letters within each value (free or bound) indicate statistically important difference (p ≤ 0.05).
Agronomy 13 02703 g005
Figure 6. Concentration of total polyphenols (GAE mg/100 g), total flavonoids (quercetin mg/100 g), free and bound antioxidant capacity (% scavenging activity) of the 5 samples of common wheat. Different letters within each value (total polyphenols, free antioxidant capacity, bound antioxidant capacity, total flavonoids) indicate statistically important difference (p ≤ 0.05).
Agronomy 13 02703 g006
Figure 7. Concentration of total polyphenols (GAE mg/100 g), total flavonoids (quercetin mg/100 g), free and bound antioxidant capacity (% scavenging activity) of the 5 samples of durum wheat. Different letters within each value (total polyphenols, free antioxidant capacity, bound antioxidant capacity, total flavonoids) indicate statistically important difference (p ≤ 0.05).
Agronomy 13 02703 g007
Figure 8. Percentage content of mono-unsaturated fatty acids (MUFA). Different letters indicate statistically important difference (p ≤ 0.05).
Agronomy 13 02703 g008
Table 1. Samples used in this study.
SampleSpeciesInformation
1Common wheat_1Triticum aestivumLocal landrace; low yielding
2Common wheat_2Triticum aestivumLocal landrace; registered in the national list of indigenous landraces
3Yecora-ETriticum aestivum cv. Yecora-EIndividual selection from CIMMYT’s variety Gecora 70 [17]
4Generoso-ETriticum aestivum cv. Generoso-EIndividual selection from the Italian variety Generoso [17]
5OroposTriticum aestivum cv. OroposGreek spring variety (registration no. CV-975, PI639687). Cross of Siete Cerros × YG-3927.
6Durum wheat_1Triticum turgidum ssp. durumLocal landrace
7Durum wheat_2Triticum turgidum ssp. durumLocal landrace; registered in the national list of indigenous landraces
8LemnosTriticum turgidum ssp. durumSelection from the landrace Akbasak [18]
9SimetoTriticum turgidum ssp. durum cv. SimetoItalian modern durum wheat, cross of Capeti 8 × Valnova [17]
10Mexikali 81Triticum turgidum ssp. durum cv. Mexikali 81Selection from CIMMYT‘s variety Mexicali 75 [17]
11EmmerTriticum turgidum ssp. dicoccumAncient Greek cultivar
12EinkornTriticum monococcum ssp. MonococcumAncient Greek cultivar
13BarleyHordeum vulgareLocal landrace
14OatAvena sativaLocal landrace
15RyeSecale cerealeLocal landrace; registered in the national list of indigenous landraces
Table 2. Meteorological data in the area of Larissa, Greece for the growing season 2020–2021. Data were kindly provided by the Hellenic National Meteorological Service.
Precipitation per Month (mm)Mean Month Temperature (°C)
November 202017.411.5
December 202044.810.0
January 2021857.5
February 2021327.9
March 2021899.3
April 20212522.8
May 202134.421.0
June 202154.224.2
Table 3. List of SSR primers used. F: forward. R: reverse. Ta: annealing temperature. Sequence of Xgwm primers was from Roder et al., 1998 [22] and of Xwmc primers from Gupta et al., 2002 [23].
MarkerChromosomeSequence of f PrimerSequence of r PrimerTa
Xgwm1482BGTGAGGCAGCAAGAGAGAAACAAAGCTTGACTCAGACCAAA55 °C
Xgwm1531BGATCTCGTCACCCGGAATTCTGGTAGAGAAGGACGGAGAG57 °C
Xgwm3507B, 7DACCTCATCCACATGTTCTACGGGATGGATAGGACGCCC55 °C
Xgwm3893BATCATGTCGATCTCCTTGACGTGCCATGCACATTAGCAGAT53 °C
Xgwm5445BTAGAATTCTTTATGGGGTCTGCAGGATTCCAATCCTTCAAAATT50 °C
Xgwm6142AGATCACATGCATGCGTCATGTTTTACCGTTCCGGCCTT51 °C
Xgwm6374AAAAGAGGTCTGGCGCTAACATATACGGTTTTGTGAGGGGG55 °C
Xwmc2541AAGTAATCTGGTCCTCTCTTCTTCTAGGTAATCTCCGAGTGCACTTCAT57 °C
Xwmc4155BGATCTCCCATGTCCGCCCGACAGTCGTCACTTGCCTA55 °C
Xwmc5972BAACACACCTTGCTTCTCTGGGAGACTAGGGTTTCGGTTGTTGGC58 °C
Table 4. Indices of genetic diversity calculated for each primer used in the analysis. Ne: number of effective alleles; I: Shannon’s Information Index; Ho: observed heterozygosity; He: expected heterozygosity; PIC: Polymorphism Information Content.
SSR MarkerAllele Size RangeNo. of BandsNeIHoHePIC
TotalPolymorphic
Xgwm148138–167885.141.840.580.810.24
Xgwm153162–21011117.022.160.920.860.31
Xgwm350134–148553.651.420.580.730.16
Xgwm389112–14111118.732.280.330.890.31
Xgwm544168–198775.561.820.500.820.21
Xgwm614123–148661.921.060.330.480.19
Xgwm637140–17610108.072.190.730.880.29
Xwmc254158–188332.330.950.630.570.10
Xwmc415126–134332.691.040.000.630.10
Xwmc597221–243772.941.440.750.660.21
Mean 7.17.14.801.620.540.730.21
Disclaimer/Publisher’s Note: The statements, opinions and data contained in all publications are solely those of the individual author(s) and contributor(s) and not of MDPI and/or the editor(s). MDPI and/or the editor(s) disclaim responsibility for any injury to people or property resulting from any ideas, methods, instructions or products referred to in the content.

