Abstract
In the context of growing environmental challenges and the push for sustainable agriculture, this study delves into the eco-efficiency of three-season indica rice across 16 key provinces in China from 2004 to 2021. Utilizing the super-efficiency Slacks-Based Measure (SBM) model coupled with the Malmquist index, our approach uniquely incorporates undesirable outputs, focusing on carbon emissions from chemical and plastic inputs. Findings indicate that while the overall efficiency hinged around a modest mean, periods like 2005–2006 and 2017–2018 spotlighted the pivotal role of technological advancements and judicious resource use. The Malmquist Index revealed an intricate interplay between technological change and efficiency, notably when accounting for environmental impact. Diverse provincial efficiencies spotlighted the need for bespoke strategies harmonizing efficiency objectives with ecological sustainability. This study emphasizes the indispensable role of technological innovation in advancing eco-efficiency and fostering sustainable agricultural practices, urging for policy changes that prioritize both technology adoption and ecological awareness.
1. Introduction
China stands as a major producer of agricultural crops, with rice being one of the primary food staples. Under the multifaceted pressures of climate change, water scarcity, and accelerating urbanization, global food security is increasingly under threat [1,2,3,4]. Particularly in recent years, concerns have emerged surrounding the diminishing sustainability of cereal production within China [5,6,7]. In the context of rice production, a myriad of inputs play a significant role, including seeds, pesticides, fertilizers, agricultural films, machinery, land, and irrigation. Notably, the excessive application of certain inputs, particularly fertilizers, and the associated use of agricultural films, can negatively influence the quality of the agricultural produce. More critically, these practices contribute significantly to carbon emissions, thereby exacerbating the challenges of climate change. Given this backdrop, while it is crucial to prioritize environmental protection, enhancing the eco-efficiency of rice production, especially in terms of its carbon footprint linked to chemical and plastic inputs, becomes an indispensable aspect of ensuring food production sustainability and endorsing green farming practices. Therefore, this study specifically delves into the eco-efficiency (considering carbon emissions caused by chemical fertilizers and plastic films) of rice production in China, with a keen focus on the carbon emissions implications of fertilizers, pesticides, and agricultural film usage.
The most commonly used methods for estimating rice productivity are Stochastic Frontier Analysis (SFA) and Data Envelopment Analysis (DEA) [8,9,10]. In contrast to parametric methods, DEA is based on the input-output perspective that does not necessitate the specification of a particular functional form, circumventing potential biases that might arise from choosing an inappropriate production function. Grain production efficiency and its subsequent assessment have gained a monumental scholarly focus. For instance, the concept of utilizing data envelopment analysis (DEA) to assess efficiency, as Houshyar et al. [11] did for maize production in southwest Iran, has become quite prevalent. Several scholars have utilized DEA to assess regional variations and trends in the production efficiency of rice and other cereals [12]. For instance, Dolgikh [13] applied the DEA methodology to evaluate and analyze the dynamic changes in the technical efficiency of grain production in Ukraine. Expanding on this, some researchers have harnessed DEA to pinpoint the determinants of growth in food crop production efficiency, identifying prevailing challenges and potential avenues for efficiency enhancement [14,15].
From an input-output perspective, many studies assess rice eco-efficiency using data derived from micro-farmer research [16,17]. Input metrics emphasize the incorporation of production factors such as land, labor, machinery, water, fertilizers, pesticides, and other fundamental elements crucial to rice cultivation. Output metrics are bifurcated into desired and non-desired indicators. While the desired outputs typically pertain to rice yields or the overall output values, the non-desired outputs denote the environmental repercussions stemming from rice cultivation. These encompass environmental burdens associated with the utilization and expenditure of pesticides, fertilizers, and agricultural films throughout the rice lifecycle [16].
The indica subspecies occupies over 80% of the global rice cultivation footprint [18]. Similarly, in China, indica rice encompasses three-quarters of the total rice cultivation area [19]. Distinct from other rice varieties, indica rice, a variant of Oryza sativa, boasts several unique attributes. Primarily, indica rice dominates production, particularly in numerous Asian nations, contributing substantially to global rice output. This predominance highlights its indispensable role in ensuring food security and bolstering the economies of populous regions. Furthermore, in terms of climatic adaptability, indica varieties exhibit robust resilience to warmer tropical and subtropical conditions, often flourishing in waterlogged or deep-water habitats [20,21,22]. This resilience sets them apart from subspecies like japonica, which favor temperate or colder environments. Culinary characteristics further differentiate indica rice. The grains are elongated and slender, and when cooked, they maintain a distinct, non-sticky consistency, in stark contrast to the tackier texture of japonica varieties. These traits not only guide culinary selections but also shape post-harvest treatment and market inclinations.
Considering the predominant role of indica rice in worldwide rice cultivation, particularly in densely populated nations like China, delving into its eco-efficiency is of paramount importance for food security, ecological conservation, and agricultural economic dynamics. Analyzing the productivity of indica rice can offer valuable perspectives emblematic of wider trends and obstacles in rice farming, thereby marking it as an essential research avenue. Being a crucial facet of rice production, elevating the management standards of indica rice cultivation is instrumental in fortifying the comprehensive security framework of rice production. Sun and Li (2021) [23] conducted an analysis of the technical efficiency of fertilizer application across early, middle, and late indica rice variants in China from 1997 to 2018 on a provincial basis. Their findings illuminated marked regional disparities in the technical proficiency of fertilizer application among these indica rice classifications. Nonetheless, there’s a conspicuous dearth of studies that holistically address the environmental repercussions triggered by the consumption of pesticides, fertilizers, and other inputs in the cultivation processes of these indica rice types on a larger regional scale. Consequently, the spatial-temporal nuances in eco-efficiency and its progressive evolution within this context remain elusive.
Notably, traditional efficiency measurement techniques, grounded in static analyses, often need to improve when confronting dynamic shifts and developments. Addressing this limitation, Färe et al. [24] introduced the Malmquist productivity index, an innovative model designed to discern sources of productivity growth. Later augmentations by Chung et al. [25] birthed the Malmquist-Luenberger (ML) productivity index, a derivation that uses the directional distance function (DDF) to account for undesirable outputs. The Malmquist index stands out in this domain for its capacity to dynamically gauge total factor productivity (TFP) [26]. The trend of leveraging the Malmquist index in agricultural studies has continued, as seen in research by Newman and Matthews [27], where the tool has effectively discerned factors like scale effects, efficiency changes, and technological progressions.
Over the last two decades, global agricultural paradigms have evolved, driven by technological advances, shifts in labor dynamics, and increasing environmental concerns. In this context, the period from 2004 to 2021 offers a rich tapestry of data to understand the eco-efficiency of early, medium, and late indica rice across 16 Chinese provinces, each bringing its microcosmic challenges and strategies.
This study seeks to bridge a critical knowledge gap. While there exists a wealth of research focusing on rice eco-efficiency, few studies have delved into a comprehensive analysis of the three-season indica rice in China, especially with a dual focus on desirable and undesirable outputs. By selecting tangible inputs like direct production cost, land and labor costs, and the total agricultural mechanical power, juxtaposed against desirable outputs like indica rice production and undesirable outputs such as carbon emissions from fertilizers and agricultural film, we offer a holistic view of the efficiency paradigm.
Using the super-efficiency Slacks-Based Measure (SBM) model, we aim to furnish a nuanced understanding of the annual eco-efficiency for each rice variety and province. Subsequently, the Malmquist Index (MI) analysis, a robust tool to decipher temporal dynamics, is employed to dissect the efficiency changes over the 17 periods from 2004 to 2021. The decomposition of MI into technical efficiency change (EC) and technical change (TC) further augments our insights into the underpinnings of efficiency trajectories.
In the broader realm of agricultural research, this study can provide policymakers, agronomists, and stakeholders with a compass to navigate the future challenges and opportunities in the indica rice cultivation landscape of China.
Because our paper involves many abbreviations, we summarize them in Table 1 below.

Table 1.
Full names of abbreviations.
2. Methodology and Materials
2.1. Study Area
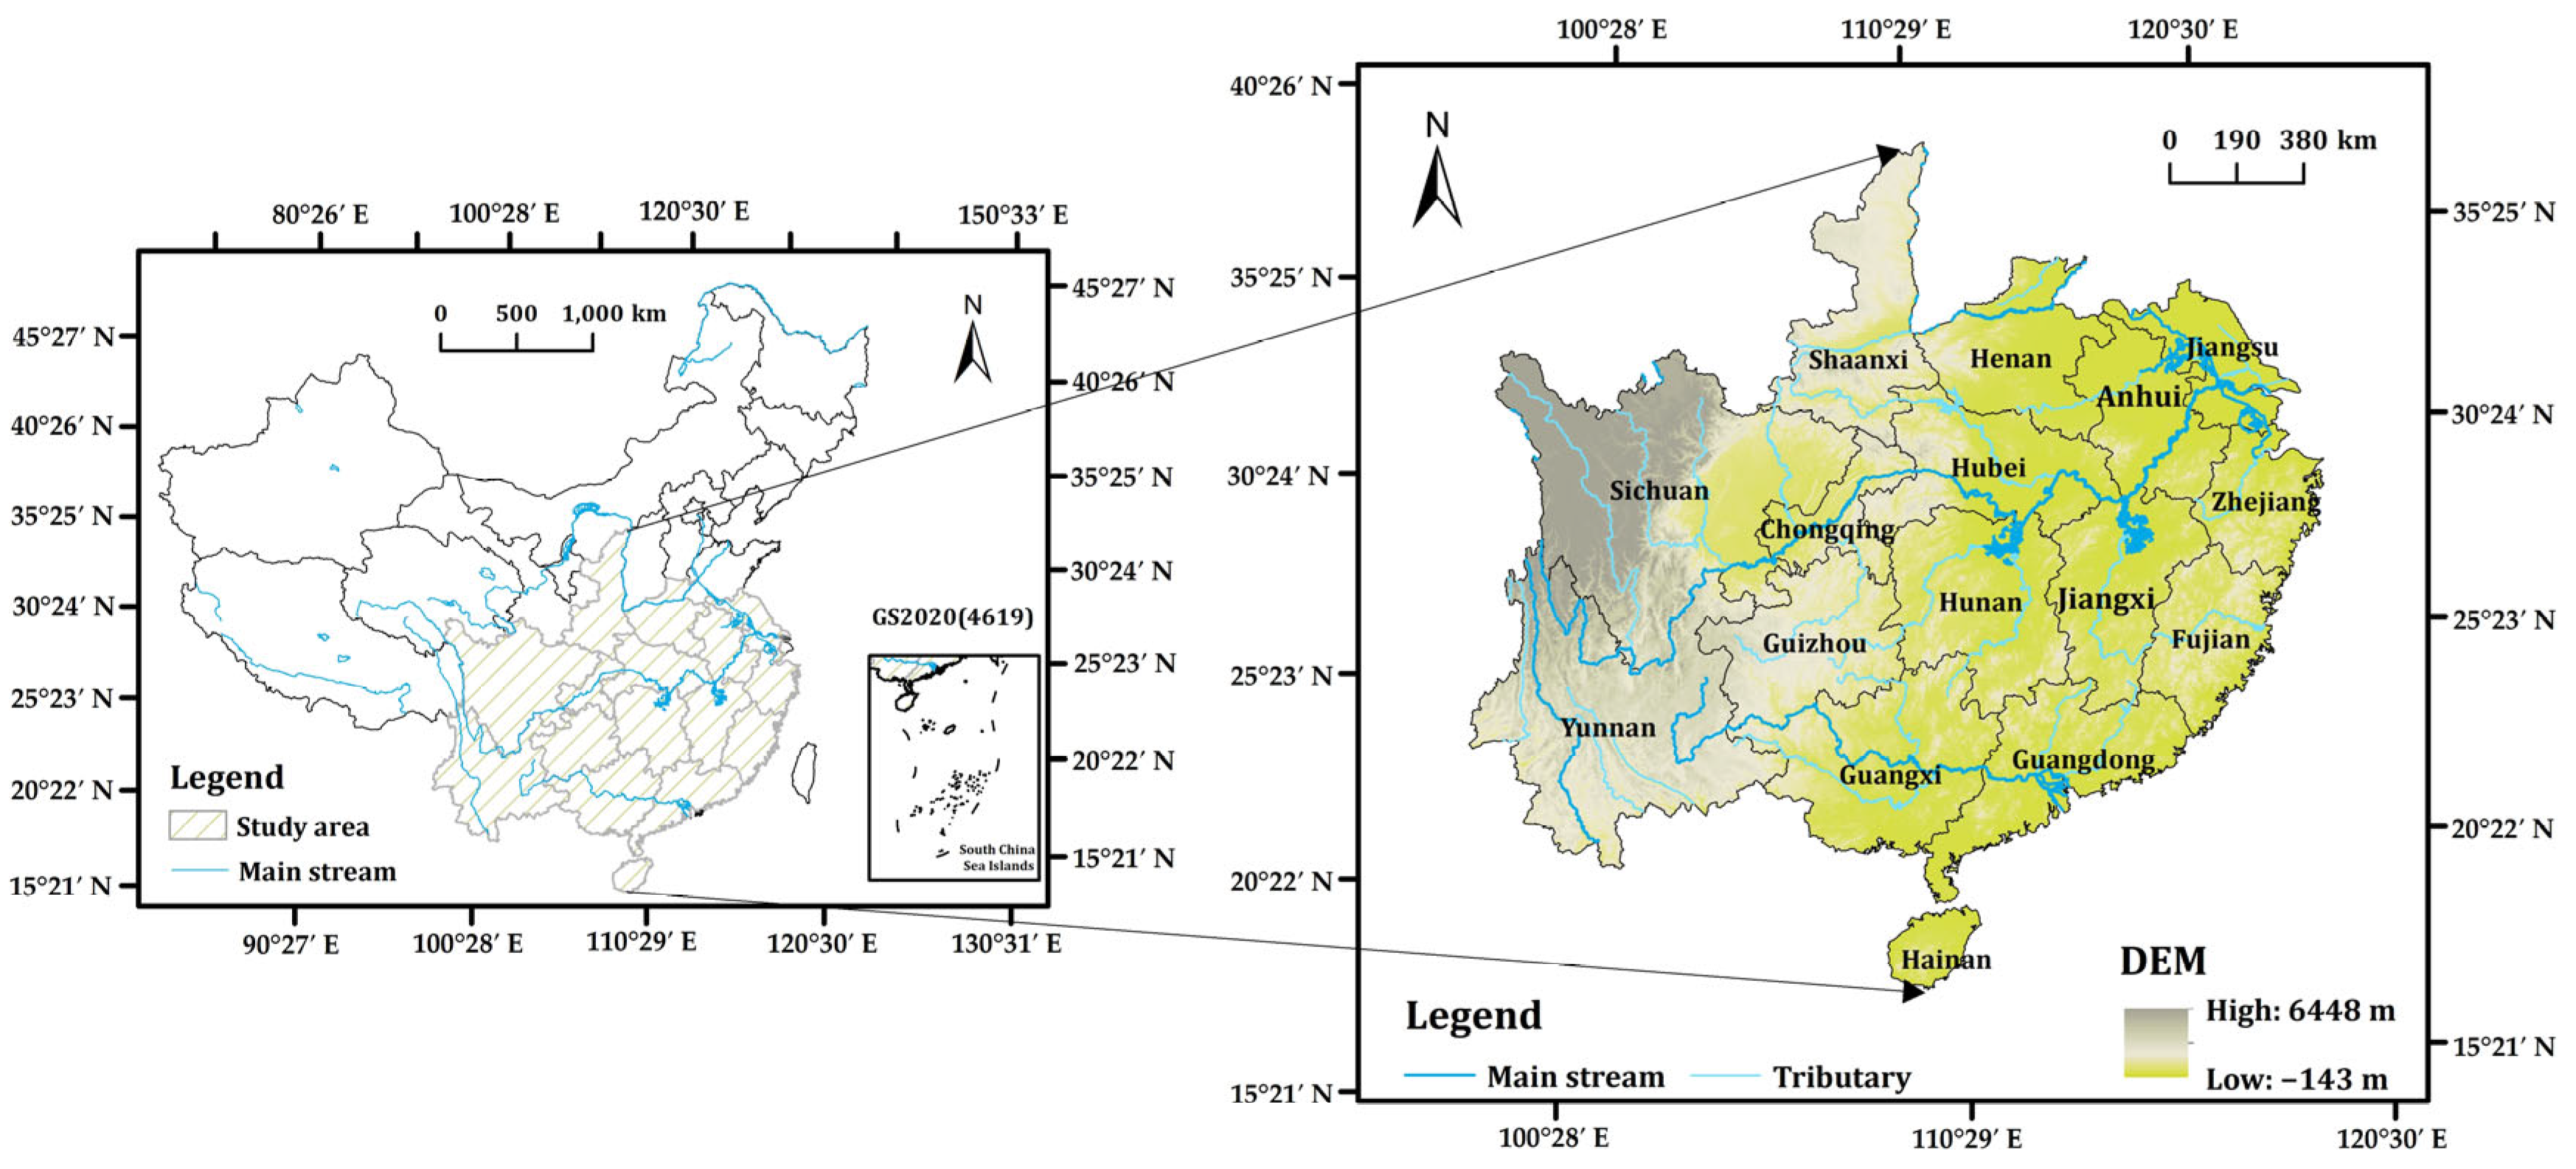
In this study, the provinces selected for analyzing the eco-efficiency of the three-season indica rice span a wide geographical swath across China, each chosen for their prominence in cultivating specific rice varieties and the availability of pertinent data (Figure 1). Specifically, for early and late indica rice, the research primarily focuses on Zhejiang, Anhui, Fujian, Jiangxi, Hubei, Hunan, Guangdong, Guangxi, and the southernmost island province of Hainan. In contrast, the cultivation of middle indica rice is examined in a slightly broader range of provinces, encompassing Jiangsu, Anhui, Fujian, Henan, Hubei, Hunan, Chongqing, Sichuan, Guizhou, Yunnan, and Shaanxi.
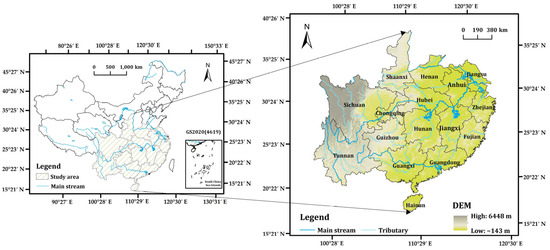
Figure 1.
Study area covering 16 provinces in China.
Collectively, the geographical expanse of this research, defined by its latitudinal and longitudinal bounds, stretches from about 18°10′ N in the tropical south to as far north as 39°35′ N, while longitudinally it ranges from approximately 97°31′ E in the western fringes to 123°10′ E in the eastern coast. This vast area encapsulates diverse climatic and ecological zones, each offering unique conditions conducive to the cultivation of the distinct indica rice varieties under investigation.
2.2. Static and Dynamic Analysis Models
2.2.1. Super-Efficiency SBM Model
Our study leverages the super-efficiency SBM model for a nuanced efficiency analysis of rice-producing entities in China. This model, a refinement of the standard SBM, evaluates the performance of each rice-producing entity or Decision-Making Unit (DMU) in relation to others. A key advantage of the super-efficiency SBM model is its ability to differentiate between DMUs that are efficient. Whereas most standard models plateau once a DMU is deemed efficient, this variant offers a nuanced scoring system. In the model’s context, an efficiency value of “1” is pivotal. Values exceeding “1” indicate a DMU’s performance surpassing the best-performing reference unit, while those below “1” signify a performance lagging behind the reference. This distinction aids in not only identifying efficient units but also ranking them, providing a more granular view of their relative efficiencies. Given the competitive and varied nature of rice production in China, such detailed insights are instrumental in tailoring specific policies and strategies for each rice-producing DMU.
For readers interested in the technical intricacies and mathematical formulations of super-efficiency SBM, we have provided a detailed exposition in Appendix A.1.
2.2.2. Malmquist Index (MI) Model
This model is instrumental in tracing the temporal evolution of productivity over distinct periods. Specifically, the Malmquist index gauges the total factor productivity change by decomposing it into efficiency change (catch-up effect) and technological change (frontier shift). This bifurcation is essential in our study, as it helps discern whether observed changes in productivity stem from advancements in technology or from improvements in efficiency.
For readers interested in the technical intricacies and mathematical formulations of the Malmquist index, we have provided a detailed exposition in Appendix A.2.
2.3. Data Source and Selection of Variables
In this paper, 16 major indica rice-producing provinces (autonomous regions and municipalities directly under the Central Government) in China were selected as the study sample. The data for each input and expected output indicator comes from the National Compilation of Cost and Benefit Data of Agricultural Products (hereinafter referred to as the “Compilation”) and China Rural Statistical Yearbook for the years 2004–2021. Compilation counts data of indica rice under different planting patterns, and the data on the total power of agricultural machinery (TPM) of each province was obtained from the China Rural Statistical Yearbook.
The selection of input indicators in our study reflects crucial aspects of rice production, particularly in the context of China’s agricultural landscape. Direct costs incorporate several pivotal sub-factors. The choice and quality of seeds are of utmost importance, with high-quality seeds being more resistant to pests and diseases, ensuring optimal yield rates. The widespread use of fertilizers in China has significantly bolstered food production, with research affirming their contribution to yield increments [28]. However, appropriate fertilization is paramount, as over-fertilization can degrade soil health over time. The judicious employment of pesticides safeguards crop yields without detriment to the ecosystem, yet its misuse may compromise soil health and future eco-efficiency. Research by some scholars shows that plastic film mulching, which has led to yield improvements of 20–35% for grains and 20–60% for cash crops [29], facilitates seed germination, although its disposal requires careful management to prevent soil contamination. Water use is a linchpin in crop growth; efficient irrigation can notably enhance rice productivity, especially under the constraints of water scarcity in certain regions [30]. Yield in a surface water irrigated plot increases significantly when farmers apply more fertilizer, irrigation, and seed [31]. Land costs encompass the intrinsic value of arable land. The quality of such land critically influences yield as it determines the balanced nutrient supply essential for crop growth [32]. As China undergoes rapid urbanization, the shrinkage of arable land underscores the urgency to optimize yield efficiencies on the extant cultivable tracts. Labor costs play an intrinsic role in the rice production process. There is evidence suggesting that with adequate labor input and moderated insecticide use, the efficiency of rice farming surges [33]. Lastly, the total agricultural machinery power reflects the ongoing transformation in China’s agrarian realm. The burgeoning growth of agricultural mechanization and the rise of customized machine services are forecasted to have a consequential impact on the future efficiency of rice production [34]. Based on the above analysis, in this study, we identified four input indicators: direct costs [35], land costs [36], labor costs [37], and total agricultural machinery power [38]. The output metrics encompass the desirable output of indica rice yield and the undesirable output of indica rice carbon emissions (Table 2).
Table 2.
Selection and composition of input-output indicators for vegetables.
In assessing the carbon emissions associated with indica rice production, we focused on the carbon footprints of chemical fertilizers and agricultural films, primarily due to their prominent roles in the overall emissions profile of rice cultivation inputs. Chemical fertilizers and plastic films contribute notably to greenhouse gas emissions. While other inputs such as pesticides and diesel undoubtedly contribute to the emissions profile, the data available to us did not provide comprehensive insights into their specific emissions. Thus, given the pronounced impact and the data accessibility of chemical fertilizers and agricultural films, we chose to represent the carbon emissions of indica rice input factors through these two key contributors. This approach, while not exhaustive, offers a meaningful approximation of the emissions dynamics associated with indica rice production.
The calculation for indica rice carbon emissions is as follows: indica rice carbon emissions = fertilizer carbon emissions + agricultural film carbon emissions. Here, fertilizer carbon emissions = fertilizer usage × carbon emission coefficient of 0.8956 kg·kg−1 [39], while agricultural film carbon emissions = agricultural film usage × carbon emission coefficient of 5.18 kg·kg−1 [40]. The carbon emission coefficient for fertilizer is sourced from the Oak Ridge National Laboratory in the United States, while the coefficient for agricultural film is attributed to the Institute of Agricultural Resources and Ecological Environment at Nanjing Agricultural University. Descriptive statistics for the selected variables can be found in Table 3.
Table 3.
Descriptive statistical analysis of input-output variables of indica rice in China.
3. Results and Discussion
3.1. Calculation Results of Eco-Efficiency Based on the Super-Efficiency SBM Model
3.1.1. Overview of General Traits
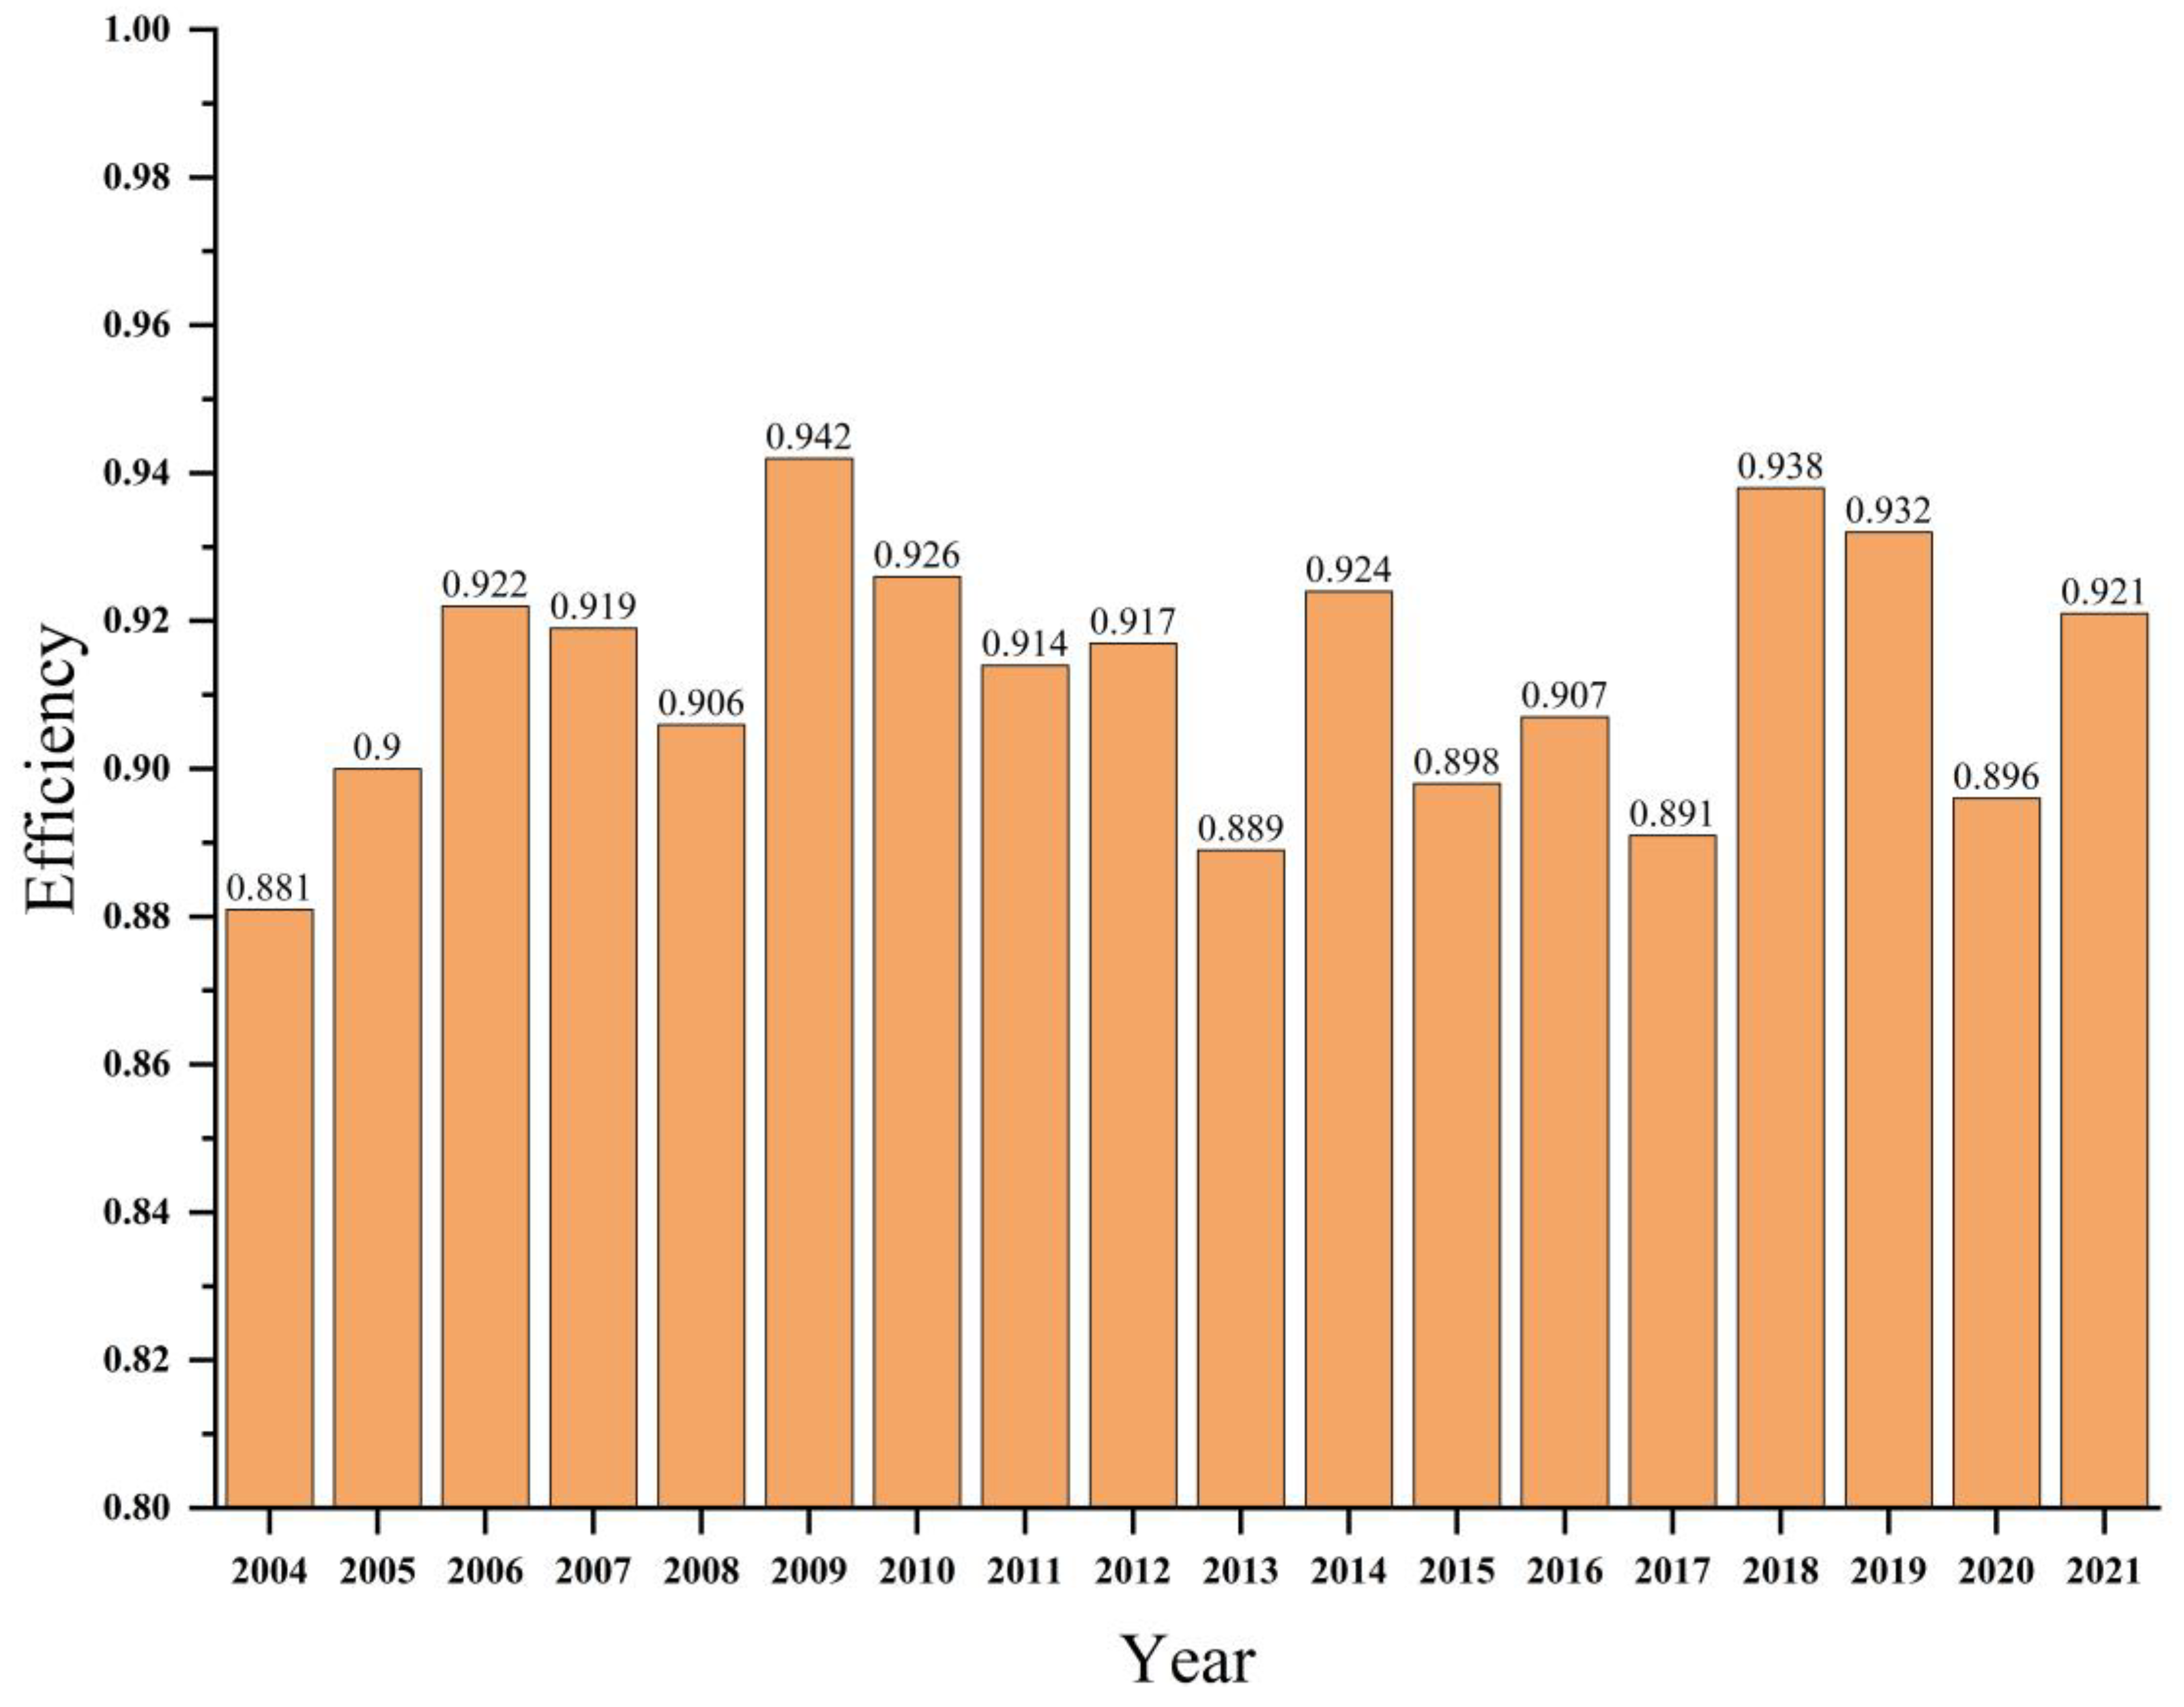
The eco-efficiency of indica rice in 16 Chinese provinces, as assessed using the super-efficiency SBM model, offers vital insights into the multifaceted dimensions of rice cultivation in China from 2004 to 2021 (Figure 2). Tracing the efficiency scores, we can delineate notable patterns, which, when viewed in light of China’s socio-political landscape, global economic shifts, and climatic changes, provide a holistic comprehension of the situation.

Figure 2.
Average eco-efficiency of indica rice in China from 2004 to 2021.
Between 2004 and 2009, China experienced a consistent rise in eco-efficiency, with scores increasing from 0.881 to 0.942. This period of growth aligns with China’s agricultural modernization initiatives, which included the introduction of high-yield rice varieties, the strengthening of rural infrastructure, and the expansion of market access. Further bolstering this progress was the government’s 2004 decree that mandated an agricultural tax exemption for a span of three years. Concurrently, the Agricultural Mechanization Promotion Law was enacted, accentuating the merits of mechanization in trimming agricultural production expenses, especially in the context of large-scale cultivation [41]. To add another feather to its cap, in 2005, the government rolled out a minimum protective price purchasing strategy in predominant rice-producing regions, ensuring stability in indica rice prices. However, the eco-efficiency for rice production dipped to 0.906 in 2008. This downturn resonated with the catastrophic winter storms, referred to as the “2008 Chinese winter storms,” that gripped China between January and February. Labelled as the harshest in half a century, these storms wreaked havoc across southern China, particularly impacting provinces such as Hunan, Hubei, Guizhou, Guangxi, Jiangxi, and Anhui, and institutions like the Xinjiang Construction Corps. The aftermath saw disrupted transport networks, widespread power blackouts, and considerable agricultural setbacks. The calamity’s onset could not have been more ill-timed, coinciding with the lead-up to the Lunar New Year—a pivotal juncture for agricultural endeavors, especially in gearing up for the spring sowing season. However, the years from 2010 to 2013 saw a decline and fluctuations in efficiency, starting with a score of 0.926 in 2010 and dropping to 0.889 by 2013. This downturn might be attributed to the global economic crisis that started in 2008 and its subsequent impact on China’s agricultural sector. Additionally, internal economic restructuring and periodic extreme weather incidents might have compounded these challenges. In 2017, the eco-efficiency of indica rice dropped to 0.891. That year, China’s climate conditions were generally inconsistent, with frequent floods, droughts, and typhoons. China faced severe flooding in 2017, particularly in the southern regions. The Yangtze River basin, which is critical for rice production, experienced significant flooding events that year. Such water-related natural disasters can heavily impact rice yields and quality. By 2017–2018, there was a marked improvement in efficiency, with scores rebounding from 0.891 to 0.938. The agricultural system is often affected by both climate change and the local ecological environment [42]. Some scholars measured the eco-efficiency of crops, vegetables, and fruits and found that the percentage increases of yield and irrigation water productivity (IWP) in regions with annual average temperature < 12 °C were 4.94% and 4.18%, respectively, which were significantly lower than those with an annual average temperature ≥ 12 °C (14.69% and 10.41%) [43]. Studies have demonstrated the eco–efficiency of crops, vegetables, and fruits to be sensitive to temperature variations. In 2018, the average temperature In eastern China was 19.1 °C and 18.0 °C in the west, both of which were higher than normal. The yield level of indica rice has been significantly improved. This elevation in temperature is believed to have contributed to the significant improvement in the yield level of indica rice for that year. However, this progress was short-lived as a decline was observed from 2018, with an efficiency score of 0.938, to 2020, bottoming out at 0.896. This downtrend coincided with the beginnings of the U.S.–China trade conflict and the emergence of the COVID-19 pandemic towards the end of 2019, both of which substantially disrupted global trade dynamics and could have influenced agricultural production processes. Remarkably, 2021 witnessed a modest recovery, registering an efficiency score of 0.921. This is particularly significant given ongoing global adversities, primarily the enduring effects of the pandemic. Such resilience might emanate from China’s effective pandemic management, its agile adaptation to the changing circumstances, and strengthened policy frameworks aiming for self-reliance in crucial resources, including rice.
In synthesis, the dynamic efficiency trends of indica rice production in China’s 16 provinces illuminate the sector’s adaptability against a backdrop of domestic policy shifts, global economic tremors, and unpredictable climatic changes. A deep dive into these trajectories helps formulate forward-looking strategies, ensuring that rice cultivation remains resilient and sustainable amidst evolving challenges.
3.1.2. Analysis of Eco-Efficiency of Indica Rice under Different Cultivation Patterns
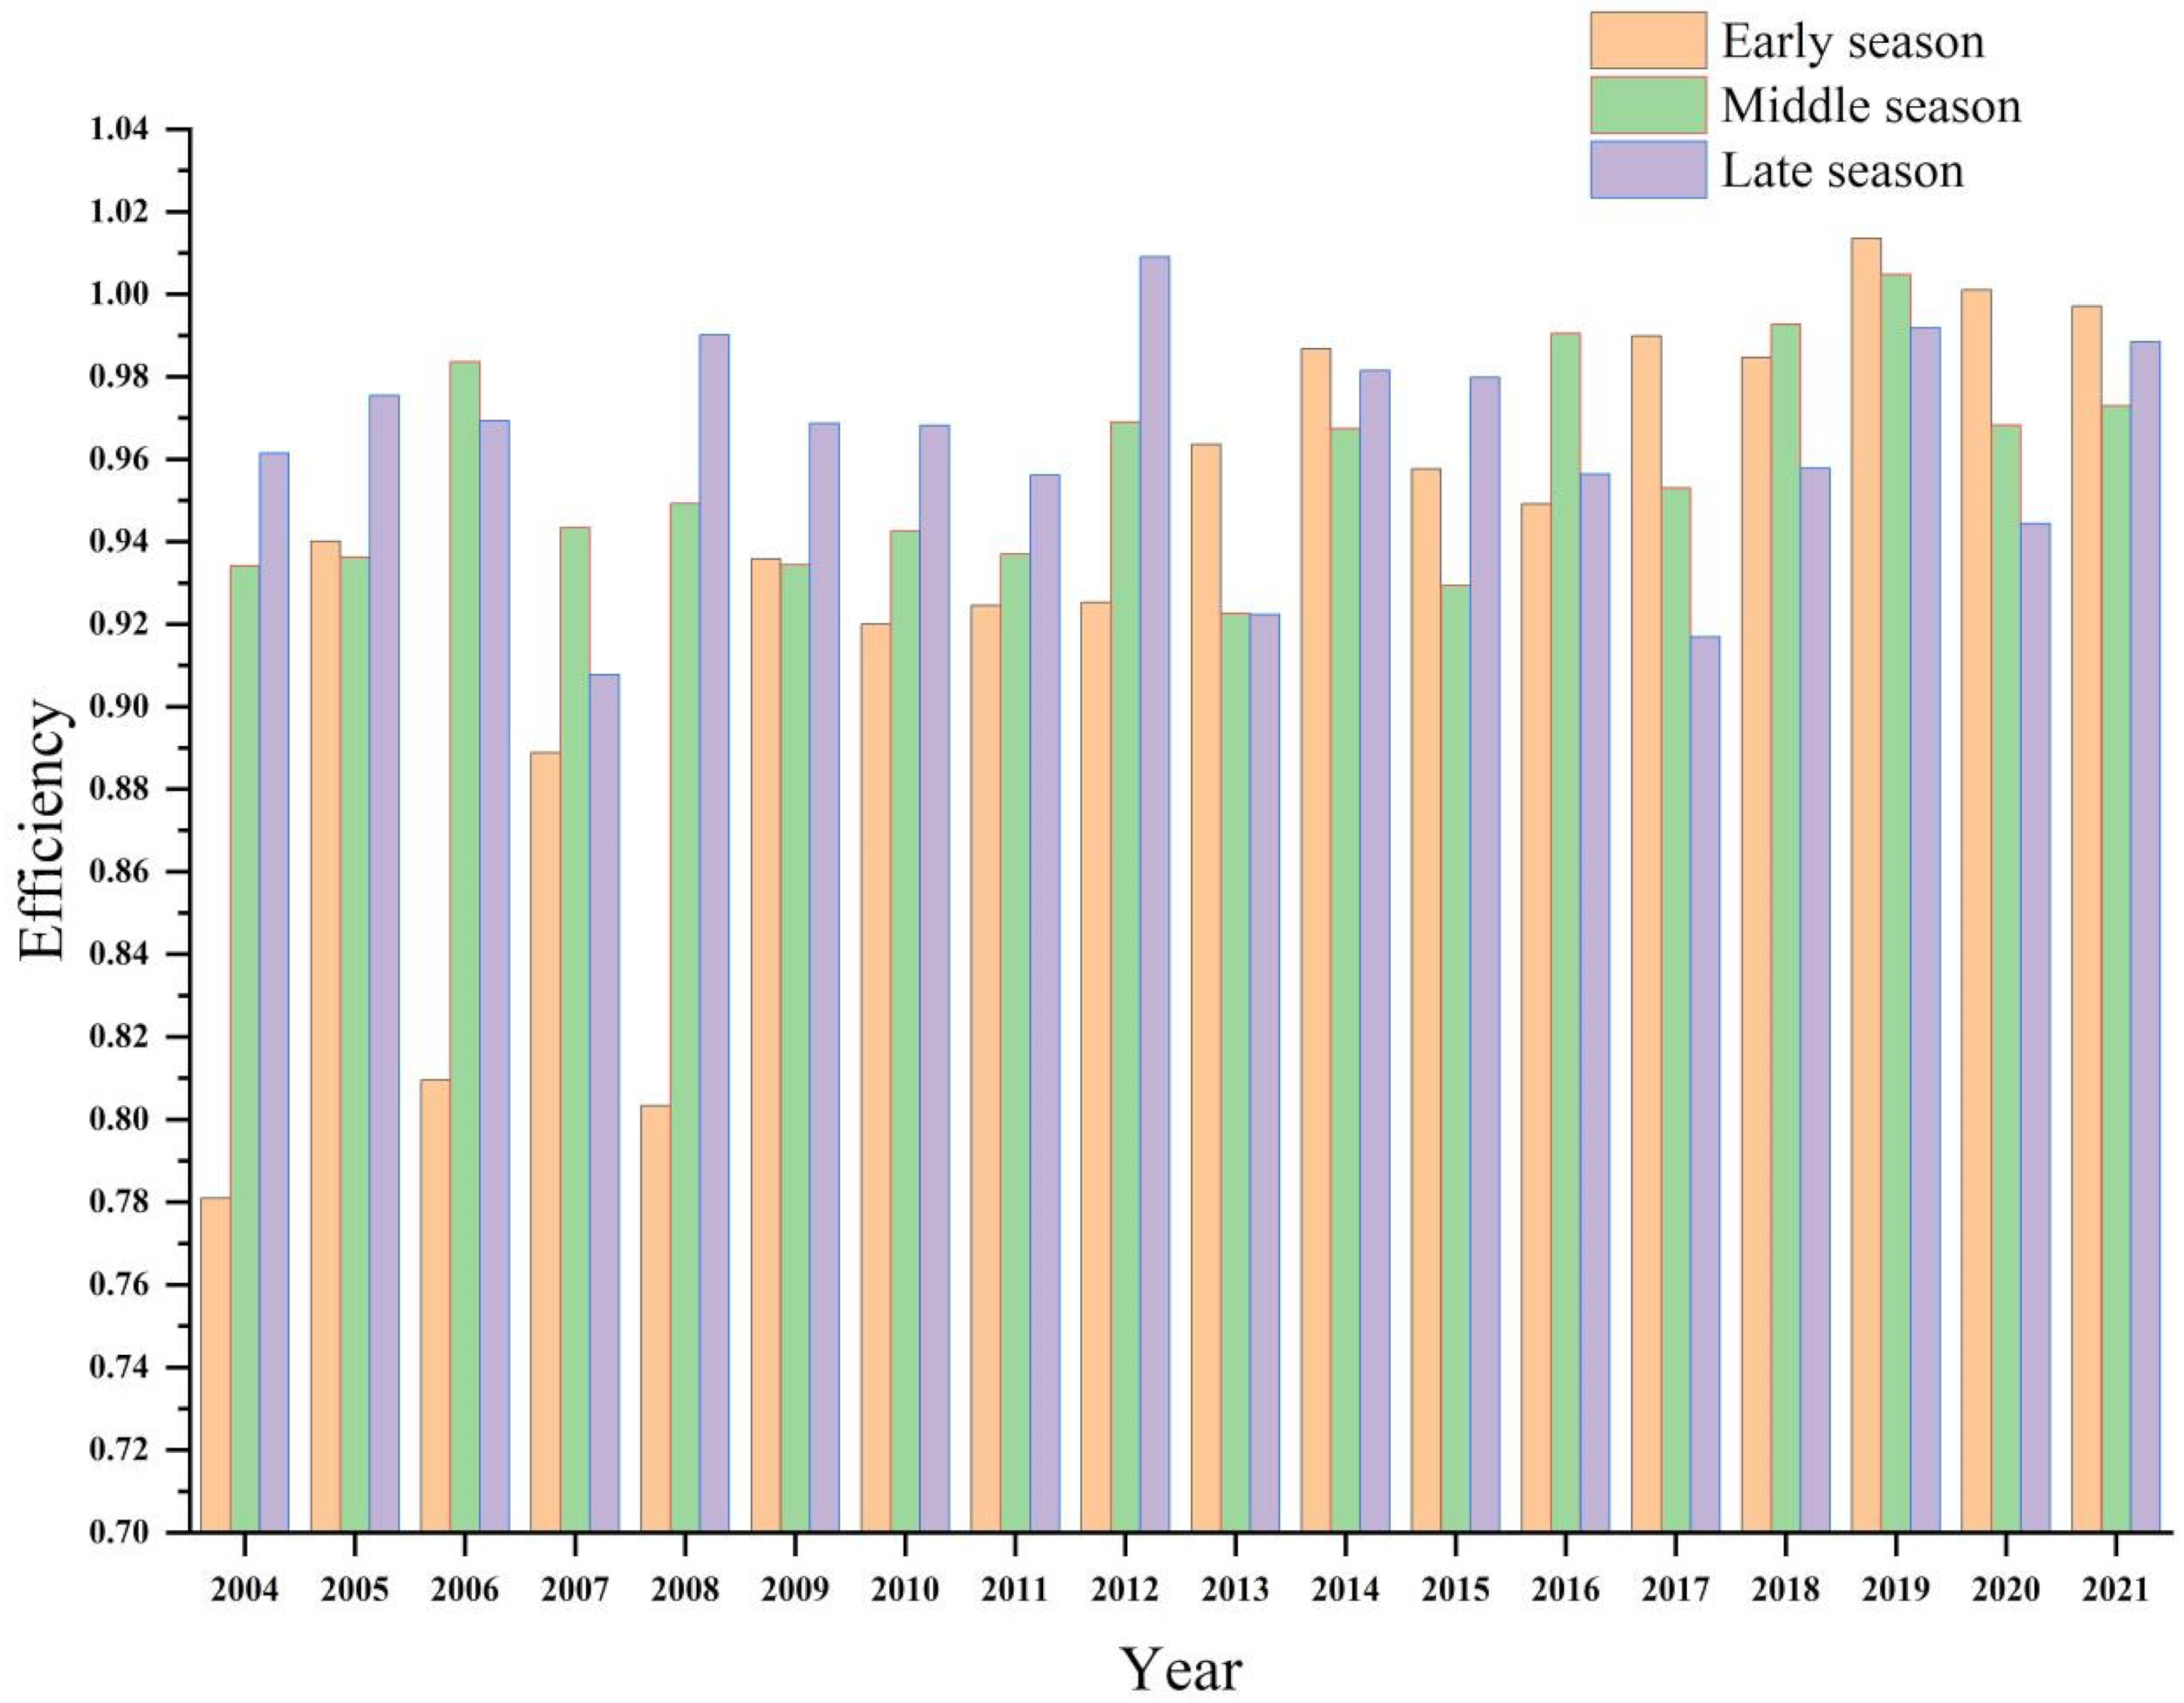
The efficiency scores derived from the super-efficiency SBM model for the three-crop indica rice—early, medium, and late indica—over the period from 2004 to 2021 provide a detailed look into their respective production patterns and how they interact with the larger agricultural and socio-political environment in China (Figure 3).
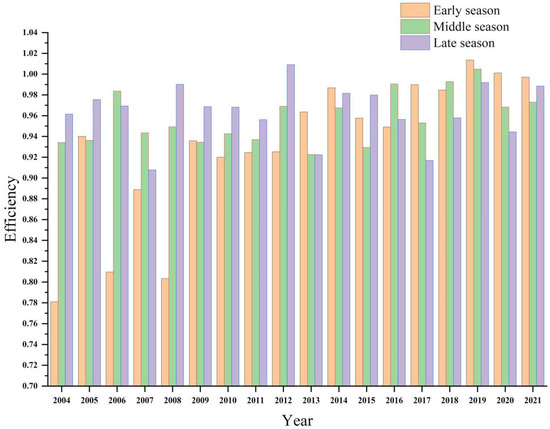
Figure 3.
Average eco-efficiency of early indica rice, medium indica rice, and late indica rice in the 16 provinces of China from 2004 to 2021.
The efficiency of early indica rice exhibited considerable volatility, especially from 2004 to 2009. Beginning at a modest score of 0.781 in 2004, it surged to 0.94 in 2005, only to see a sharp downturn to 0.81 in 2006. Yet, starting from 2009, the efficiency of this rice variety witnessed a more consistent upward trajectory, culminating in scores exceeding unity in 2019 and 2020, registering 1.014 and 1.001, respectively. These initial fluctuations might be understood in the context of multiple factors—adjustment to innovative farming techniques, climatic shifts, and evolving market conditions. Given its faster maturation, early indica rice could have permitted cultivators to rapidly integrate modifications, resulting in the succeeding phases of heightened efficiency. Furthermore, the dramatic oscillations in efficiency from 2004 to 2009 underscore the variety’s inherent sensitivity to external shifts. The stark rise in 2005, juxtaposed with the decline in the subsequent year, points towards its dynamic response to emerging agricultural practices and environmental subtleties. The profound agricultural reforms and market transitions in China during this time likely posed both impediments and openings for cultivators of early indica rice, catalyzing these variations. In our analysis, an eco-efficiency value of 1 serves as the benchmark, representing optimal performance. Values greater than 1 indicate a performance that surpasses this benchmark, suggesting a particularly commendable efficiency level. With this in mind, the eco-efficiency of early indica rice for the years 2019 and 2020 were recorded as 1.014 and 1.001, respectively. This means that in 2019, early indica rice production surpassed our benchmark, showcasing its resilience and adaptability. Similarly, the 2020 value, being just above the benchmark, further emphasizes the consistent and promising trajectory of early indica rice production.
Medium indica rice has exhibited commendable stability in its efficiency throughout the years. From 2004 to 2015, it lagged slightly behind late indica rice, but the tables turned as it surpassed the latter from 2016 to 2020. This trend culminated in an efficiency score that peaked beyond the benchmark, registering 1.005 in 2019. The persistent consistency of medium indica rice can be ascribed to its balanced growth period, potentially rendering it less vulnerable to short-term climatic fluctuations compared to its early indica counterpart. This enduring robustness is a testament to its ability to sustain high efficiency levels, reflecting a refined and optimized production process. The impressive efficiency metric in 2019 epitomizes the resilience inherent in this rice variety, likely a consequence of its equilibrated growth span and capacity to acclimatize to a range of agricultural environments.
Late indica rice, with the longest maturation period among the three rice types, has consistently manifested high efficiency in its production, reaching a remarkable peak of 1.009 in 2012. This trajectory is a testament to its inherent resilience and refined cultivation practices over the years, reinforcing its robust adaptability in diverse agricultural landscapes. Nonetheless, a discernible drop in its efficiency relative to medium indica rice between 2016 and 2020 warrants a more in-depth investigation. This decline may shed light on particular challenges or shifts in farming practices that specifically influenced the cultivation cycle of late indica rice during those years. In recent years, mechanical transplanting has emerged as a favored mechanized method for rice production in China [44]. The schedule for transplanting double-cropping late rice is rather constricted. This tight timeline necessitates the use of longer seedlings (longer seedling age and height) during the transplanting process. However, the prevailing mechanical transplanting technology has been optimized primarily for smaller- to medium-sized seedlings. Its efficacy diminishes when applied to the transplanting of longer seedlings, thereby curtailing its adaptability and broad use in the cultivation of late rice.
The period from 2016 to 2020 marked a pivotal shift in rice cultivation trends, as medium indica rice outperformed late indica rice in efficiency. This discernible transition highlights the emergent prominence of medium indica rice, potentially in response to advanced agronomic techniques, shifting market preferences, or targeted policy incentives for this particular variety.
3.1.3. Provincial Assessment of Indica Rice Eco-Efficiency
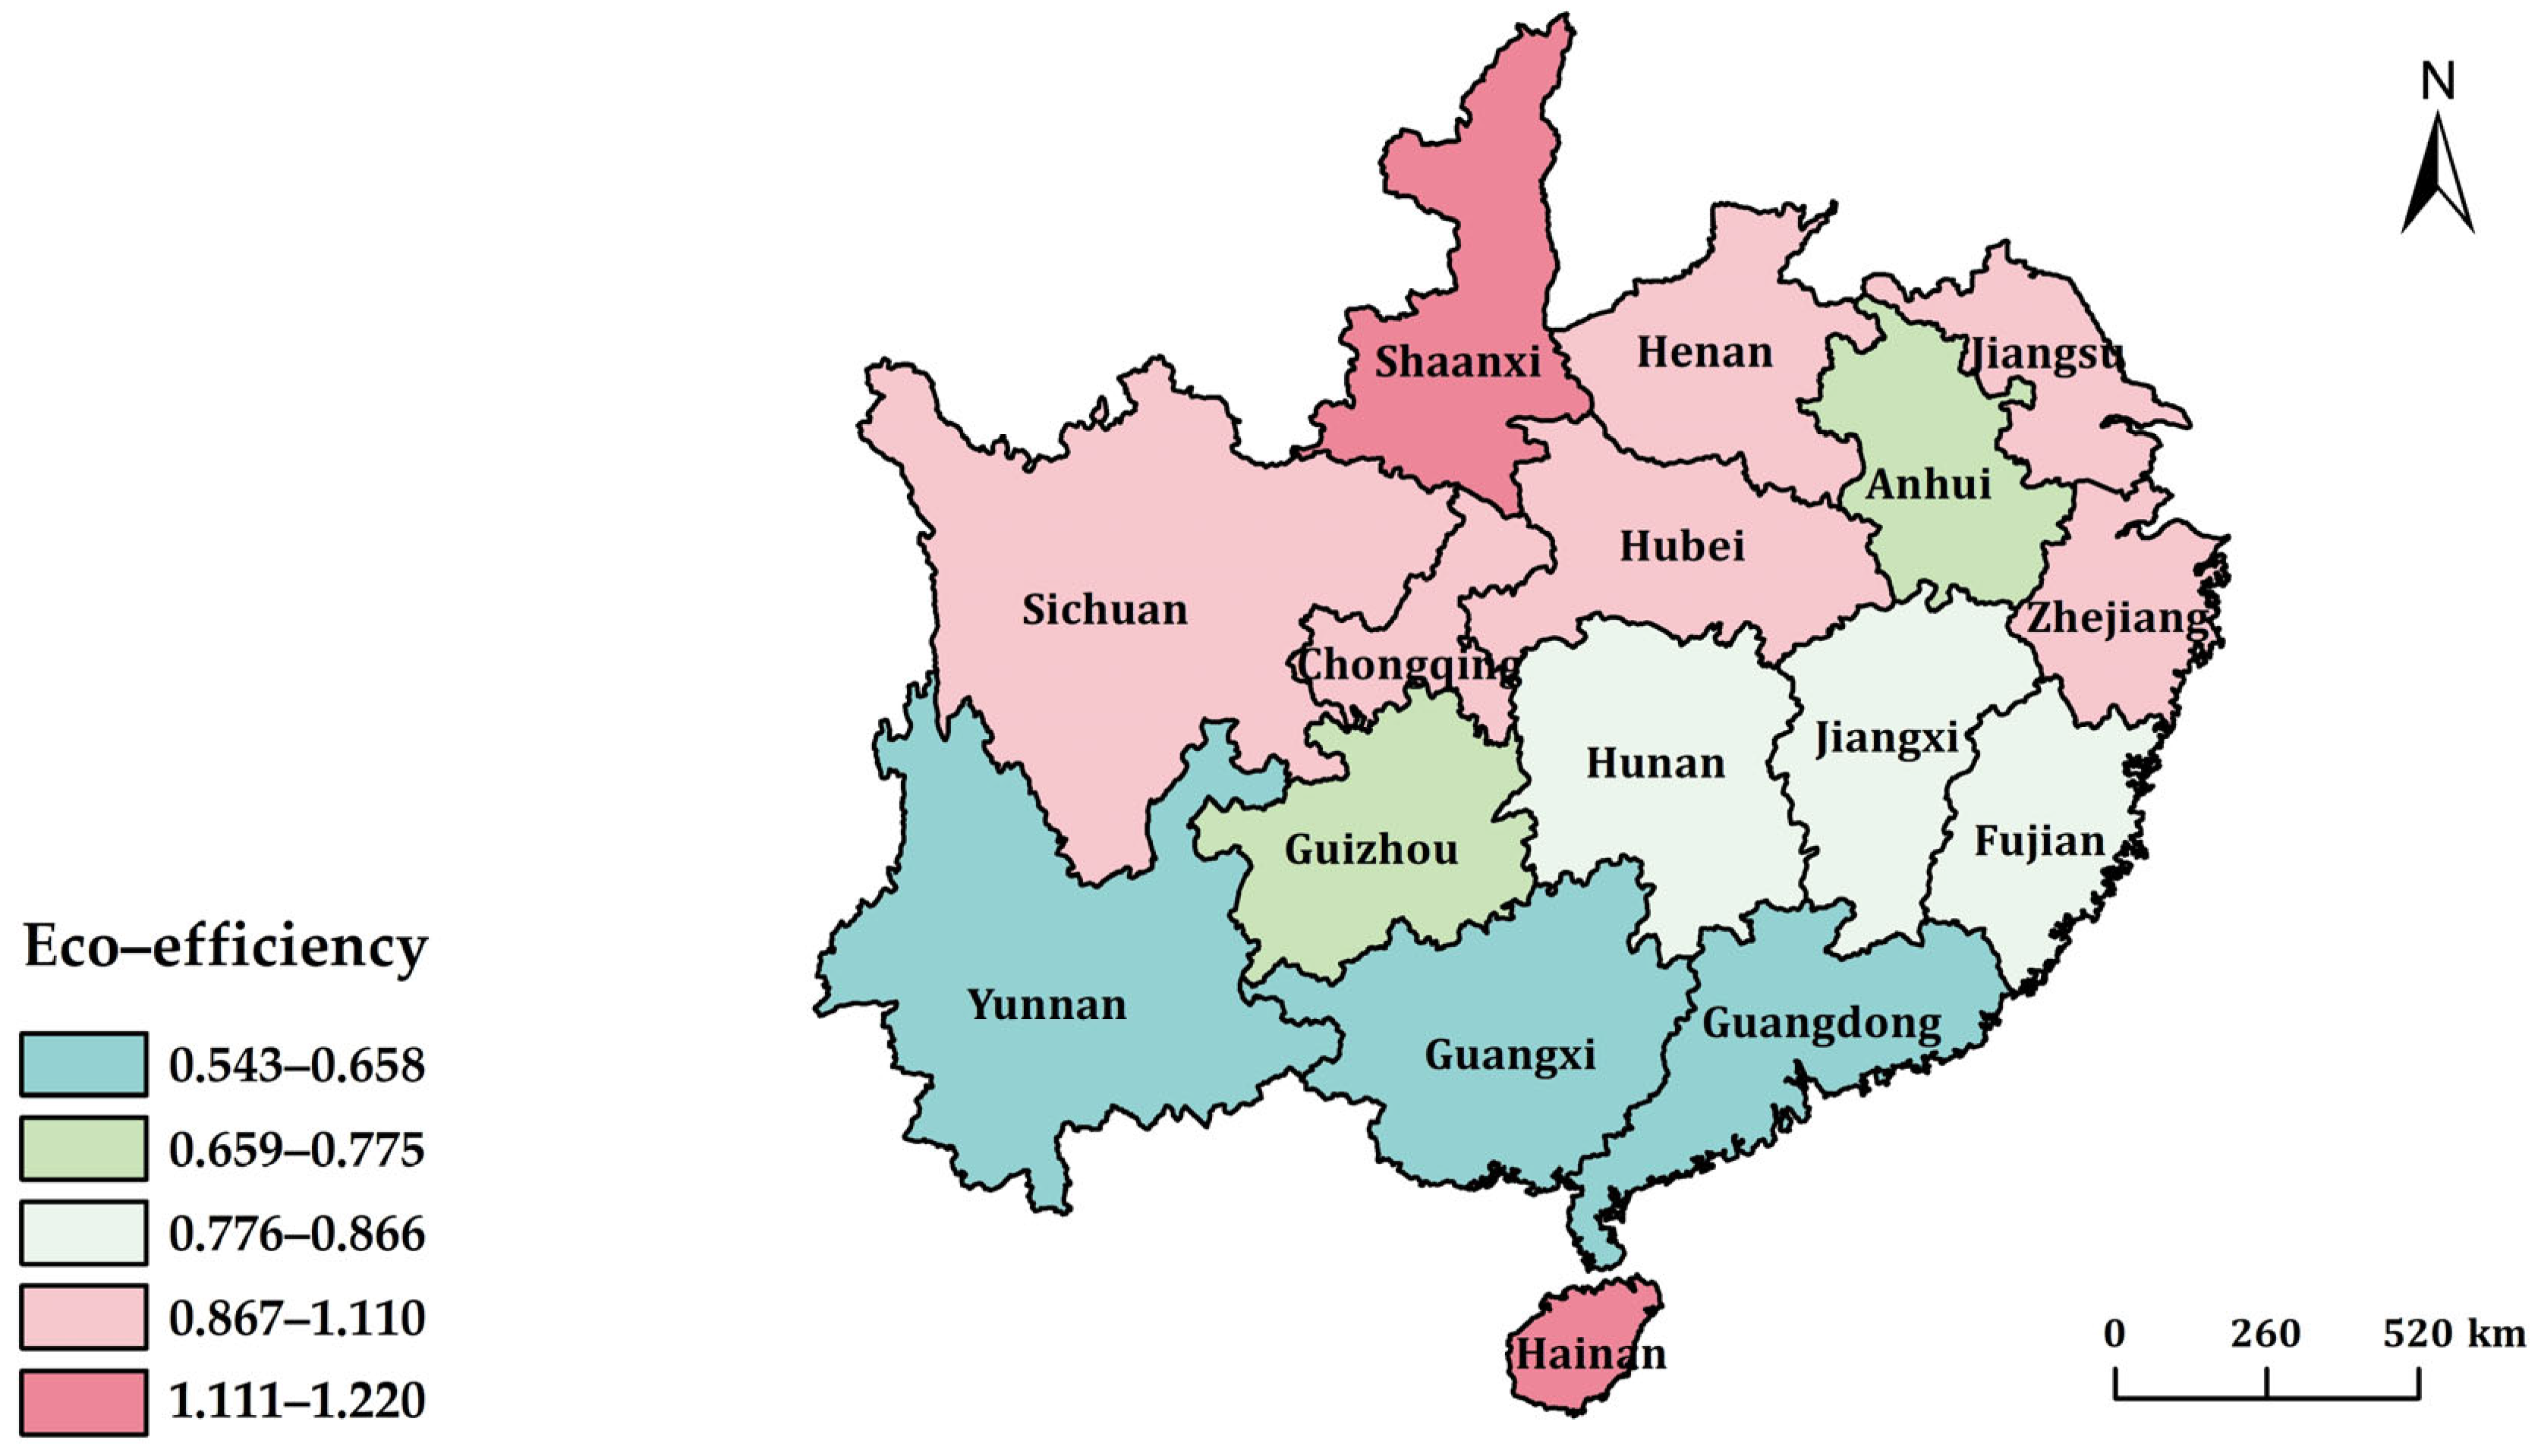
As is shown in Figure 4, Hainan’s remarkable performance, situated in the extreme south, defies conventional expectations of declining efficiency with southward progression due to the diversified agrarian landscape, water management issues, and pest threats. With a top-tier efficiency score of 1.220, Hainan’s exceptional results can potentially be attributed to its unique tropical climate, combined with its agricultural practices and technological investments. Equally noteworthy is Shaanxi, registering an efficiency score of 1.142. Located in China’s upper mid-section and marked by a transitional climate, Shaanxi’s performance suggests a strategic leveraging of its versatile weather patterns, fertile soils, and a rich history of rice cultivation. Furthermore, the consistent achievements of provinces such as Sichuan, Chongqing, Hubei, Henan, Jiangsu, and Zhejiang, each with efficiency scores surpassing 1.0, emphasize the critical role of China’s central belt in the rice cultivation scenario. The blend of geographical advantage, abundant water resources, a balanced climate, and modern rice cultivation techniques in these provinces manifests as heightened efficiency.

Figure 4.
Average eco-efficiency of each province from 2004 to 2021.
Guangxi, Yunnan, and Guangdong, all registering efficiency scores below 0.7, beckon critical scrutiny. A combination of fragmented landholding patterns, pest infestations characteristic of the subtropical climate, and potential shifts in economic priorities away from rice farming could be influencing their subpar performances. Moreover, an inclination towards specific rice varieties that face heightened challenges in these regions could further impede their efficiency. Conversely, Anhui, Fujian, Hunan, and Guizhou, with their efficiency scores ranging between 0.751 and 0.828, appear to be grappling with an array of challenges, ones that their high-efficiency counterparts have perhaps managed to surmount. Whether these challenges lie in the susceptibility of local rice varieties, water management complexities, or evolving agricultural practices, pinpointed interventions could significantly enhance their efficiency trajectories.
Taking a step back to synthesize the efficiency panorama across provinces offers both captivating insights and invaluable lessons. While it is undeniable that geographical and climatic nuances exert significant influence, it becomes palpably clear that the interplay of policy choices, technological integration, and farming methodologies significantly contour the efficiency contours. The stellar performance of Hainan, even in its geographically southern disposition, coupled with the commendable efficiencies observed in the central provinces, underscores a powerful message: that innovative approaches and well-thought-out strategies can indeed turn the tide, delivering exceptional outcomes even in terrains conventionally deemed challenging.
3.2. Dynamic Assessment via the Malmquist Index (MI) Model
3.2.1. Analysis of MI and Its Decomposition for Indica Rice Production across 16 Provinces
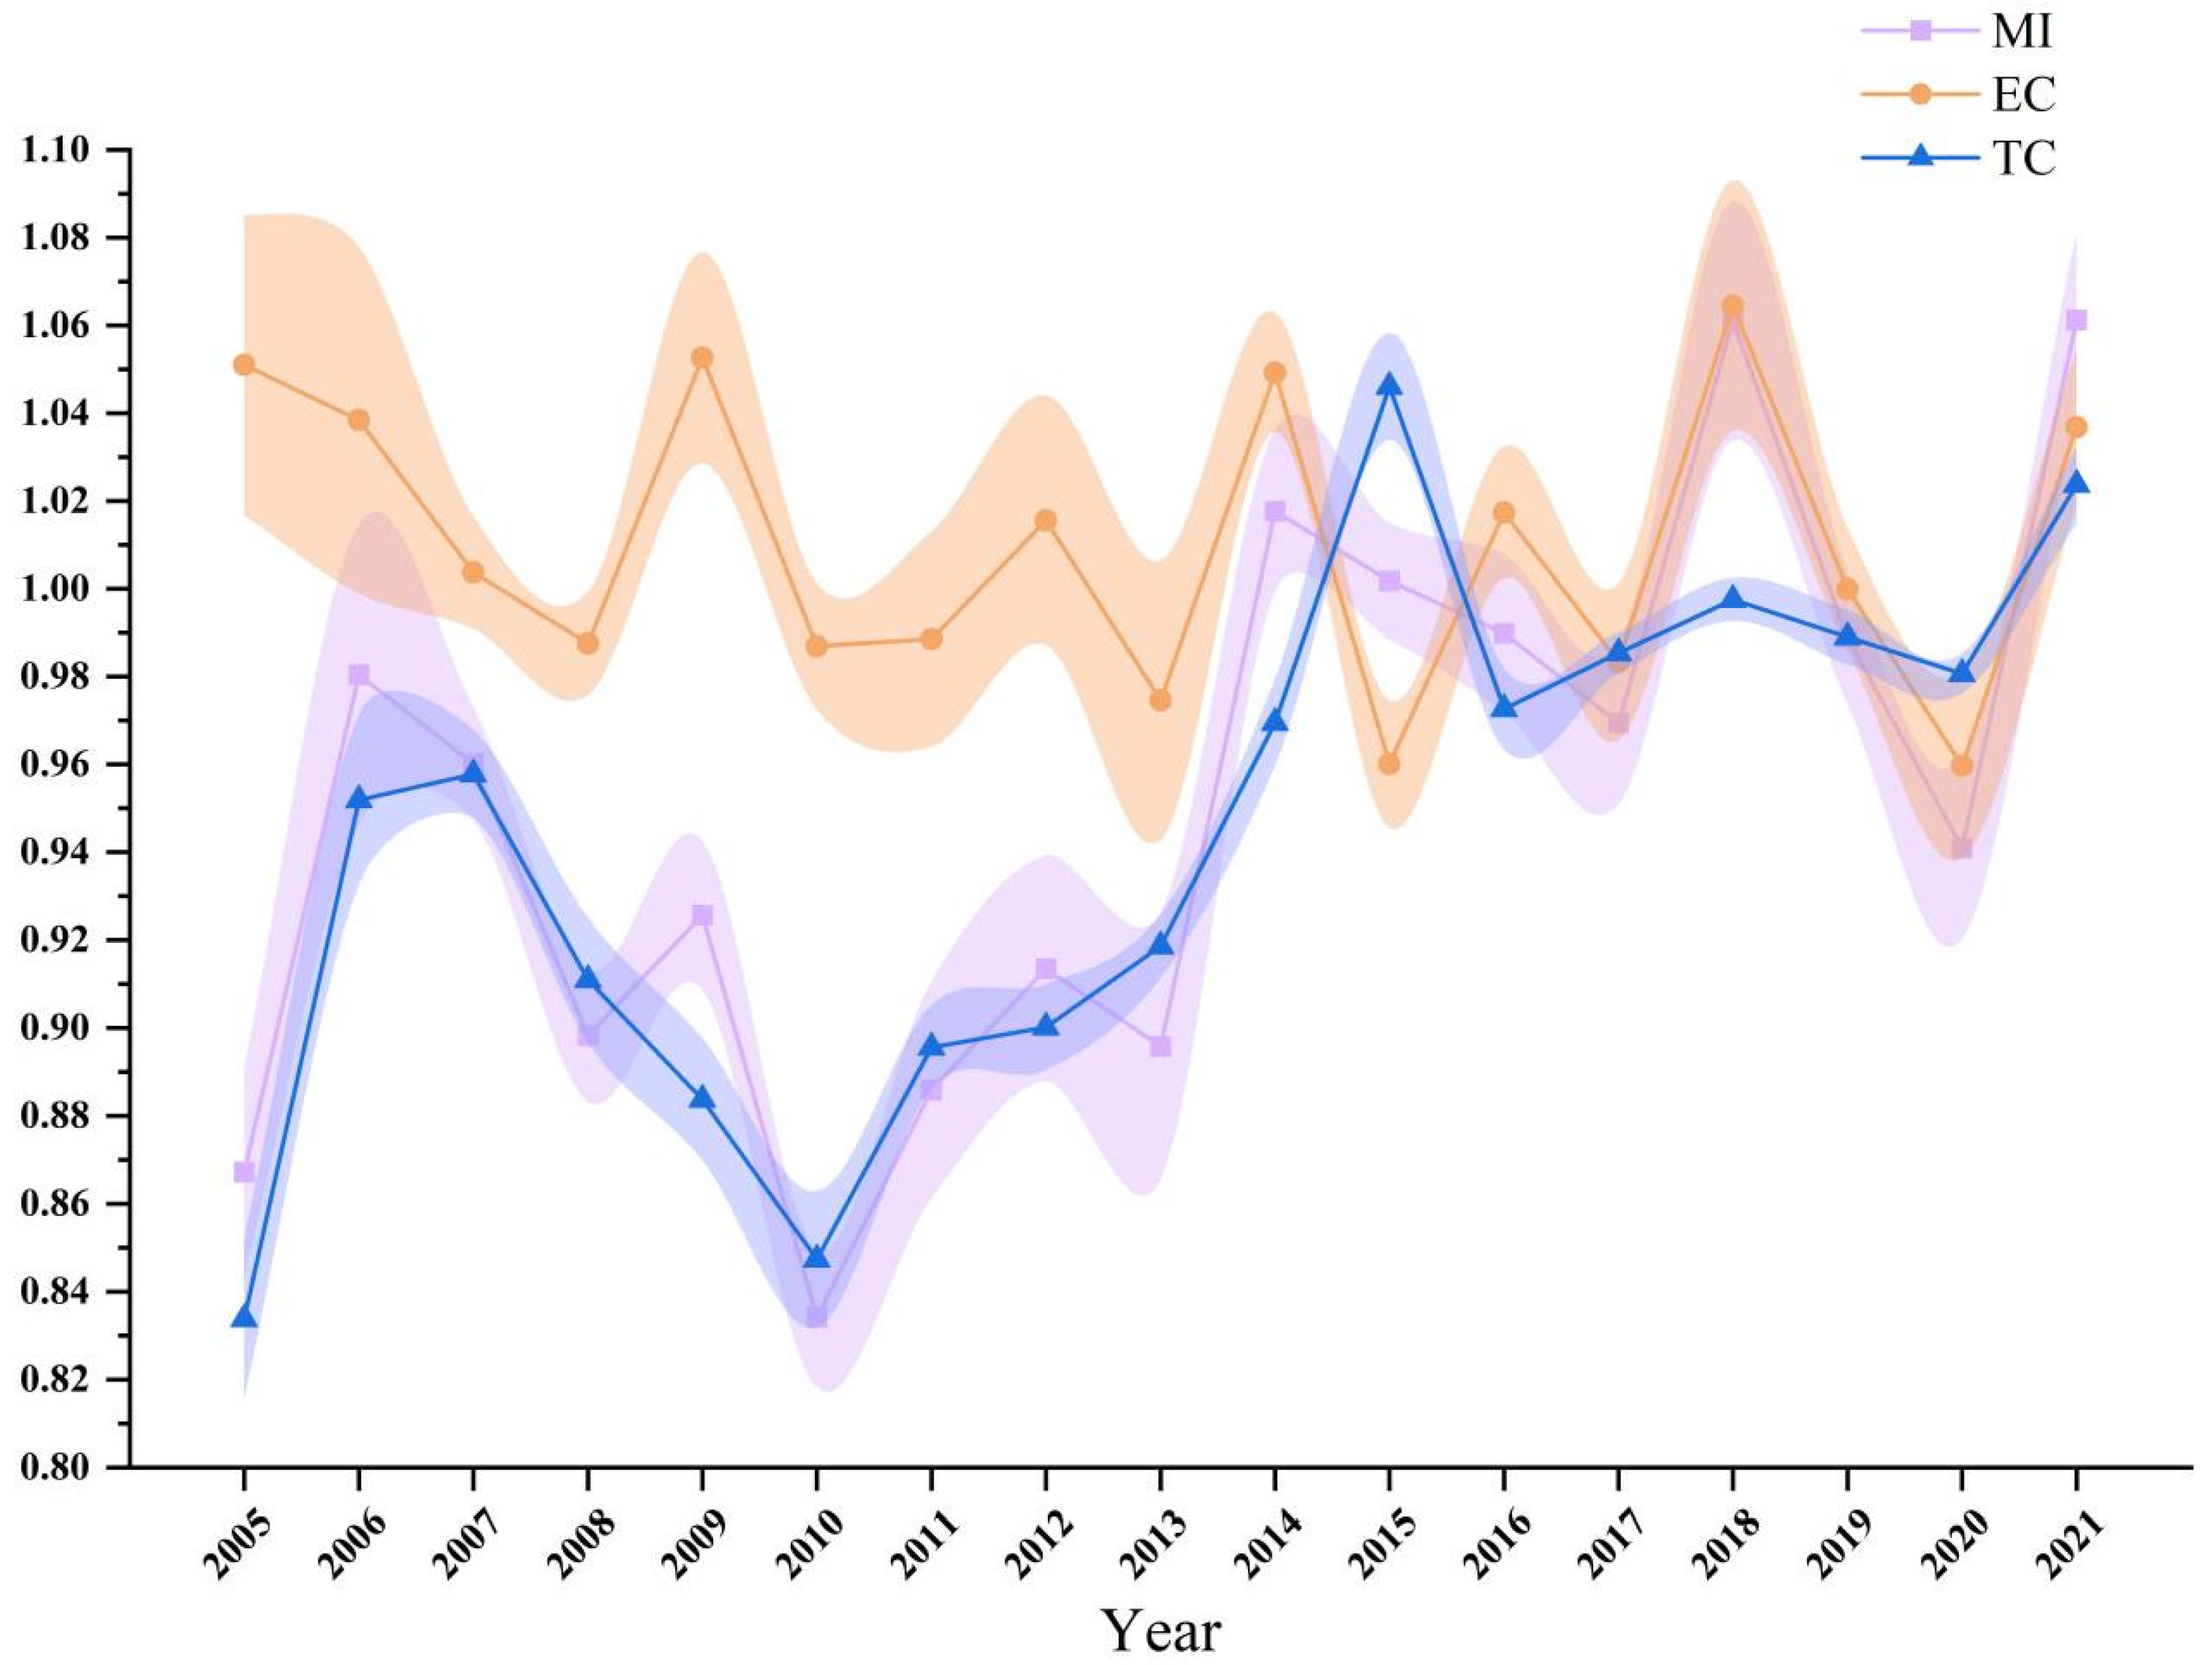
As shown in Figure 5, the technical efficiency change (EC) of indica rice production from 2004–2005 is notably high at 1.051. However, during the same period, both the Malmquist Index (MI) and the technical progress change (TC) lingered at relatively low levels. Specifically, MI was at its lowest across all periods, registering values of 0.867 and 0.834, respectively. Between 2005–2006, there was a marginal decline in EC to 1.038, while both MI and TC witnessed substantial improvements at 0.98 and 0.952, respectively. From 2006 to 2010, there was a general declining trend across MI, EC, and TC. However, a significant rebound in EC between 2008–2009 led to a modest recovery in MI, moving from 0.898 to 0.926. Subsequently, from 2010–2015, EC displayed oscillations, whereas MI and TC experienced dramatic ascents. Both MI and TC surged from 0.834 and 0.847 in 2009–2010 to 1.002 and 1.046 in 2014–2015, respectively. After this period, while TC began to stabilize, MI exhibited fluctuations predominantly influenced by EC.
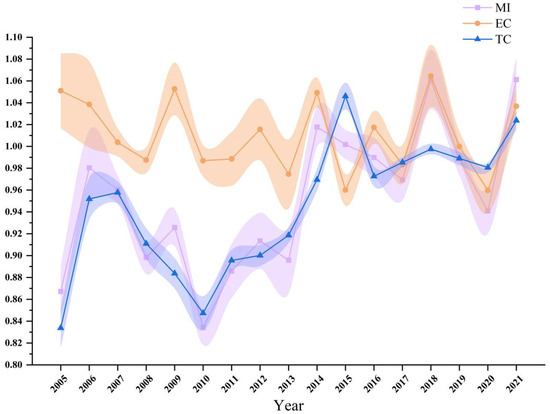
Figure 5.
Malmquist Index (MI), Technical Efficiency Change (EC), and Technical Change (TC) for Indica Rice Production across 16 Provinces.
Broadly speaking, up until 2014–2015, the trends and levels of MI and TC were relatively congruent. After 2014–2015, although MI and TC still followed parallel trends, MI became significantly more sensitive to the variances in EC. The dynamics of MI and its decomposition indices reveal the interconnectedness of technical efficiency and technological progression in influencing rice eco-efficiency. Before 2014–2015, TC’s evident impact on MI underscores the role of technological advancements and innovations in driving eco-efficiency. The consistent trend between MI and TC suggests that the provinces might have been focusing on technological improvements or adopting newer methodologies to enhance rice yield during this phase. However, after 2014–2015, the increasing influence of EC on MI implies that the intrinsic efficiency of production methods and resource utilization became more pivotal. The shift in emphasis from technological progress to technical efficiency might indicate an optimization phase where the provinces were looking inwardly to refine and streamline their existing processes.
In summary, technological advancements served as the primary catalyst for MI enhancements. Several studies have underscored the pivotal role of technological advancements in enhancing the MI index of rice. Controlled Release Nitrogen Fertilizer (CRNF) has proven to be superior to urea, primarily due to its capacity to improve nitrogen efficiency, boost yield, and conserve both human and material resources [45,46]. Yet, the elevated cost of CRNF remains a significant barrier to its widespread adoption, particularly in developing nations [47]. Currently, the prevailing market price for mainstream CRNF stands at approximately 450 USD·t−1, noticeably surpassing that of conventional fertilizer products priced around 360 USD·t−1 in China. Recognizing the criticality of technological evolution, many local administrations have increasingly pivoted towards enacting supportive subsidy policies. For instance, in Guangdong province, the local government, in a bid to bolster the use of CRNF, has initiated a policy in 2020 to subsidize farmers between 25–30% of the market prices [48].
3.2.2. MI and Its Decomposition Analysis of Early Indica Rice Production
As depicted in Figure 6, it is discernible that for early indica rice during 2004–2005, the technical progress change (TC) stood merely at 0.656. The technical efficiency change (EC) for this period peaked at 1.284, the highest across all periods. However, intriguingly, the Malmquist Index (MI) at 0.814 did not manifest an enhancement corresponding to the elevated EC.
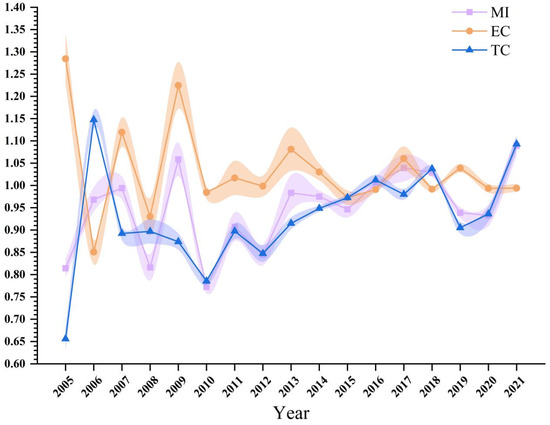
Figure 6.
Change trends of MI, EC, and TC for early indica rice.
In the subsequent 2005–2006 period, there was a remarkable surge in TC to 1.148, while EC declined considerably to 0.851. Driven by this pronounced increment in TC, MI saw a significant augmentation at 0.968. As we move into the 2006–2007 interval, TC experienced a marked reduction to 0.892, whereas EC rose to 1.119. Despite the attainment of a certain level of technical progress, its influence on MI remained palpable. The MI did not depict a decline during this phase; contrarily, it marginally advanced to 0.994. Following this, the trend variations between MI and EC became relatively synchronous. Starting from 2009–2010, the fluctuation trends and even the index levels of MI and TC mirrored each other quite closely.
Early indica rice, known for its swifter growth and harvest cycle, presents unique challenges and advantages in terms of cultivation practices. The data from the specified periods shed light on these intricacies. The initial high EC value during 2004–2005 suggests an optimization of resource utilization and management practices for early indica rice production. However, the concomitantly low TC and MI indicate that despite improved efficiencies, technological innovations or adaptations were possibly lagging, restraining the overall productivity improvement. Furthermore, the MI of early indica rice was initially subdued. An exploration into the causative factors revealed that China’s rice production reached peak levels, both in terms of overall production and yield per unit, in 1997 and 1998. This resulted in a sporadic surplus, where increased production did not correlate with a rise in income. Such a scenario dampened the zeal of rice farmers, influencing their inclination to cultivate rice. Consequently, this affected their investment in rice farming, leading to a significant dip in the MI. The sharp escalation in TC for 2005–2006 could hint at technological adoptions or breakthroughs in early indica rice cultivation. This could range from the introduction of advanced farming equipment to better-quality seeds. The corresponding rise in MI, albeit not to its maximum potential due to the decline in EC, suggests that these technological advancements positively impacted the eco-efficiency. The subsequent years exhibit a dance between EC and TC, where a rise in one coincided with a drop in the other, keeping MI relatively stable. This can be interpreted as a continuous refinement process, oscillating between efficiency improvements and technological adaptations. From 2009 onwards, the closely paralleled trends of MI and TC indicate that technological progress became a pivotal driver for eco–efficiency. The synchronization of these trends could also be indicative of the maturity phase in early indica rice cultivation, where technological advancements and their efficiency benefits were being realized concurrently. Between 2011 and 2012, there was a noticeable decline in the MI of early indica rice, with the technical progress efficiency index also showing a downward trend. This observation aligns with the findings of Wang et al. (2023) [35]. The EC for early indica rice experienced a marked drop during the 2008–2009 period and exhibited minor fluctuations from 2009 to 2021. Notably, the EC values for the 2019–2020 and 2020–2021 periods stood at 0.993 and 0.994, both falling short of 1. This underscores, in part, a deceleration in the advancement of China’s rice production technology in recent times. It also points to ineffective technology dissemination and a lack of optimal utilization of available technology.
3.2.3. MI and Its Decomposition Analysis of Medium Indica Rice Production
Between 2004 and 2007, EC for medium indica rice consistently hovered around 1, reflecting steady efficiency in its production processes (see Figure 7). A noteworthy trend during 2005–2006 and 2006–2007 was the MI stabilization at 0.959. This stability can be largely attributed to TC gravitating towards unity, remarkably settling at 0.999 in 2006–2007. A distinct divergence is observed between 2010–2013, particularly in 2012–2013. Despite a slight reduction in EC to 0.946, TC maintained its stability, driving the MI to its lowest value of 0.835 for that phase. Nevertheless, a turnaround was seen in 2013–2014, with both MI and EC scaling up to 1.069, reflecting a boost in efficiency. Concurrently, TC also elevated to a perfect 1.000. The pinnacle of this segment was reached in 2017–2018, with MI soaring to 1.076. This peak performance was underpinned by impressive TC and EC values, recorded at 1.015 and 1.060, respectively, epitomizing a harmonious synergy between technological progression and optimized efficiency.
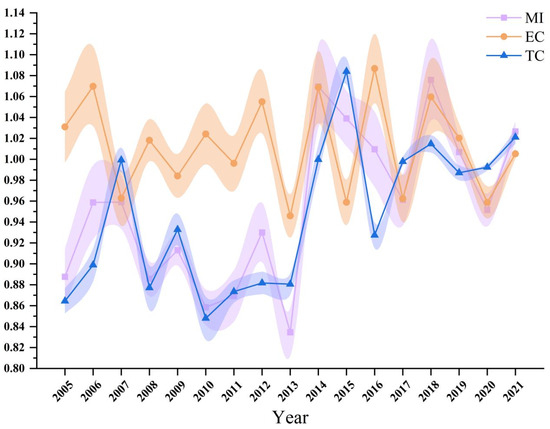
Figure 7.
Change trends of MI, EC, and TC for medium indica rice.
3.2.4. MI and Its Decomposition Analysis of Late Indica Rice Production
As is shown in Figure 8, the 2004–2005 period set the foundation with an EC of 1.051, underscoring commendable efficient practices. Conversely, the subpar TC at 0.821 led to an MI of 0.857, highlighting the imperative need for technological refinement. A paradigm shift was evident in 2005–2006 as TC surged dramatically to 1.043, catalyzing an appreciable ascent in MI to 1.033. This transition underscored the instrumental role of technological enhancement in modulating MI. The period 2013–2014 witnessed an MI apex of 1.080, bolstered by an EC of 1.078 and a steadfast TC of 1.002. This phase signals an adept balance between technological frontiers and honed practices. Fast-forwarding to 2020–2021, this concluding phase manifested an aligned upswing across all parameters, culminating in an MI of 1.095 for late indica rice with the strong backbone of an EC at 1.079 and a TC at 1.016.
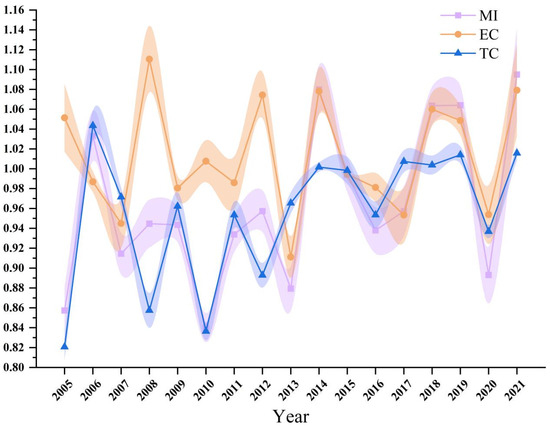
Figure 8.
Change trends of MI, EC, and TC for late indica rice.
3.2.5. Efficiency Dynamics and Technological Progress in Indica Rice Varieties
In analyzing the efficiency dynamics of the three indica rice varieties, clear variances emerge in the technological progress change (TC), technical efficiency change (EC), and the Malmquist Index (MI) over the periods. Early indica rice during 2004–2005 had a pronounced EC of 1.284, the zenith among all periods; however, this did not translate to a concomitant surge in MI, which remained at 0.814. This was predominantly due to a modest TC of 0.656. Yet, the subsequent year displayed a rebound in TC, hinting at rapid technological adaptation. Meanwhile, medium indica rice between 2004–2007 showcased consistent EC around 1, reflecting unwavering efficiency. The 2005–2007 phase saw an MI near 0.959, underscored by the TC gravitating towards unity. By 2017–2018, medium indica rice reached its crescendo with an MI of 1.076, indicative of a balanced nexus between technology and efficiency. Contrastingly, late indica rice commenced in 2004–2005 with an EC of 1.051, emphasizing proficient practices. Yet, the MI was restricted to 0.857 due to a lagging TC of 0.821. This technological gap was promptly bridged by 2005–2006, with TC soaring to 1.043. The 2013–2014 phase exhibited mastery in balancing technological adoption with honed practices, achieving an MI pinnacle of 1.080. The concluding phase in 2020–2021 further accentuated this trajectory, marking an MI apex of 1.095. While all three indica rice varieties have exhibited their distinct efficiencies and technological progress dynamics, medium and late indica rice demonstrated a more harmonized interplay between TC and EC, achieving higher MI values. Early indica rice, despite its significant efficiency, faced challenges in harmonizing technological advancements with efficiency, especially in the initial years.
Overall, the growth trajectory of MI closely mirrors that of TC, indicating that technological progress primarily drives the MI growth in the production of early, middle, and late indica rice in China. Each sowing season of indica rice urgently requires technological innovations, such as no-tillage bed-furrow management, to bolster efficiency. The current literature underscores the benefits of water conservation and emission reduction via no-tillage bed-furrow management [49,50], and the gains in efficiency through the deployment of UAVs [51,52]. Huang et al. highlighted that, by eliminating seeding nursery and transplanting processes, no-tillage direct seeding of rice curtailed labor and machinery inputs by approximately 21% compared to mechanical transplanting [53]. Alternating dry-wet irrigation methods in rice fields offer cost efficiencies over traditional flooding irrigation. In Southeast Asia, water consumption with alternate irrigation is 38% lower than with flooding, leading to an increase in farmer revenues by 17–38% [54]. Thus, no-tillage bed-furrow management, integrating the benefits of both no-tillage and alternating dry-wet irrigation, theoretically presents opportunities for reducing production costs while enhancing energy use efficiency (EUE). Furthermore, unmanned aerial vehicles (UAVs) have emerged as transformative tools to amplify rice eco-efficiency. In recent times, Chinese UAV firms have launched cost-effective seeding, fertilization, and pesticide spraying equipment, propelling the adoption of UAVs in rice cultivation [55].
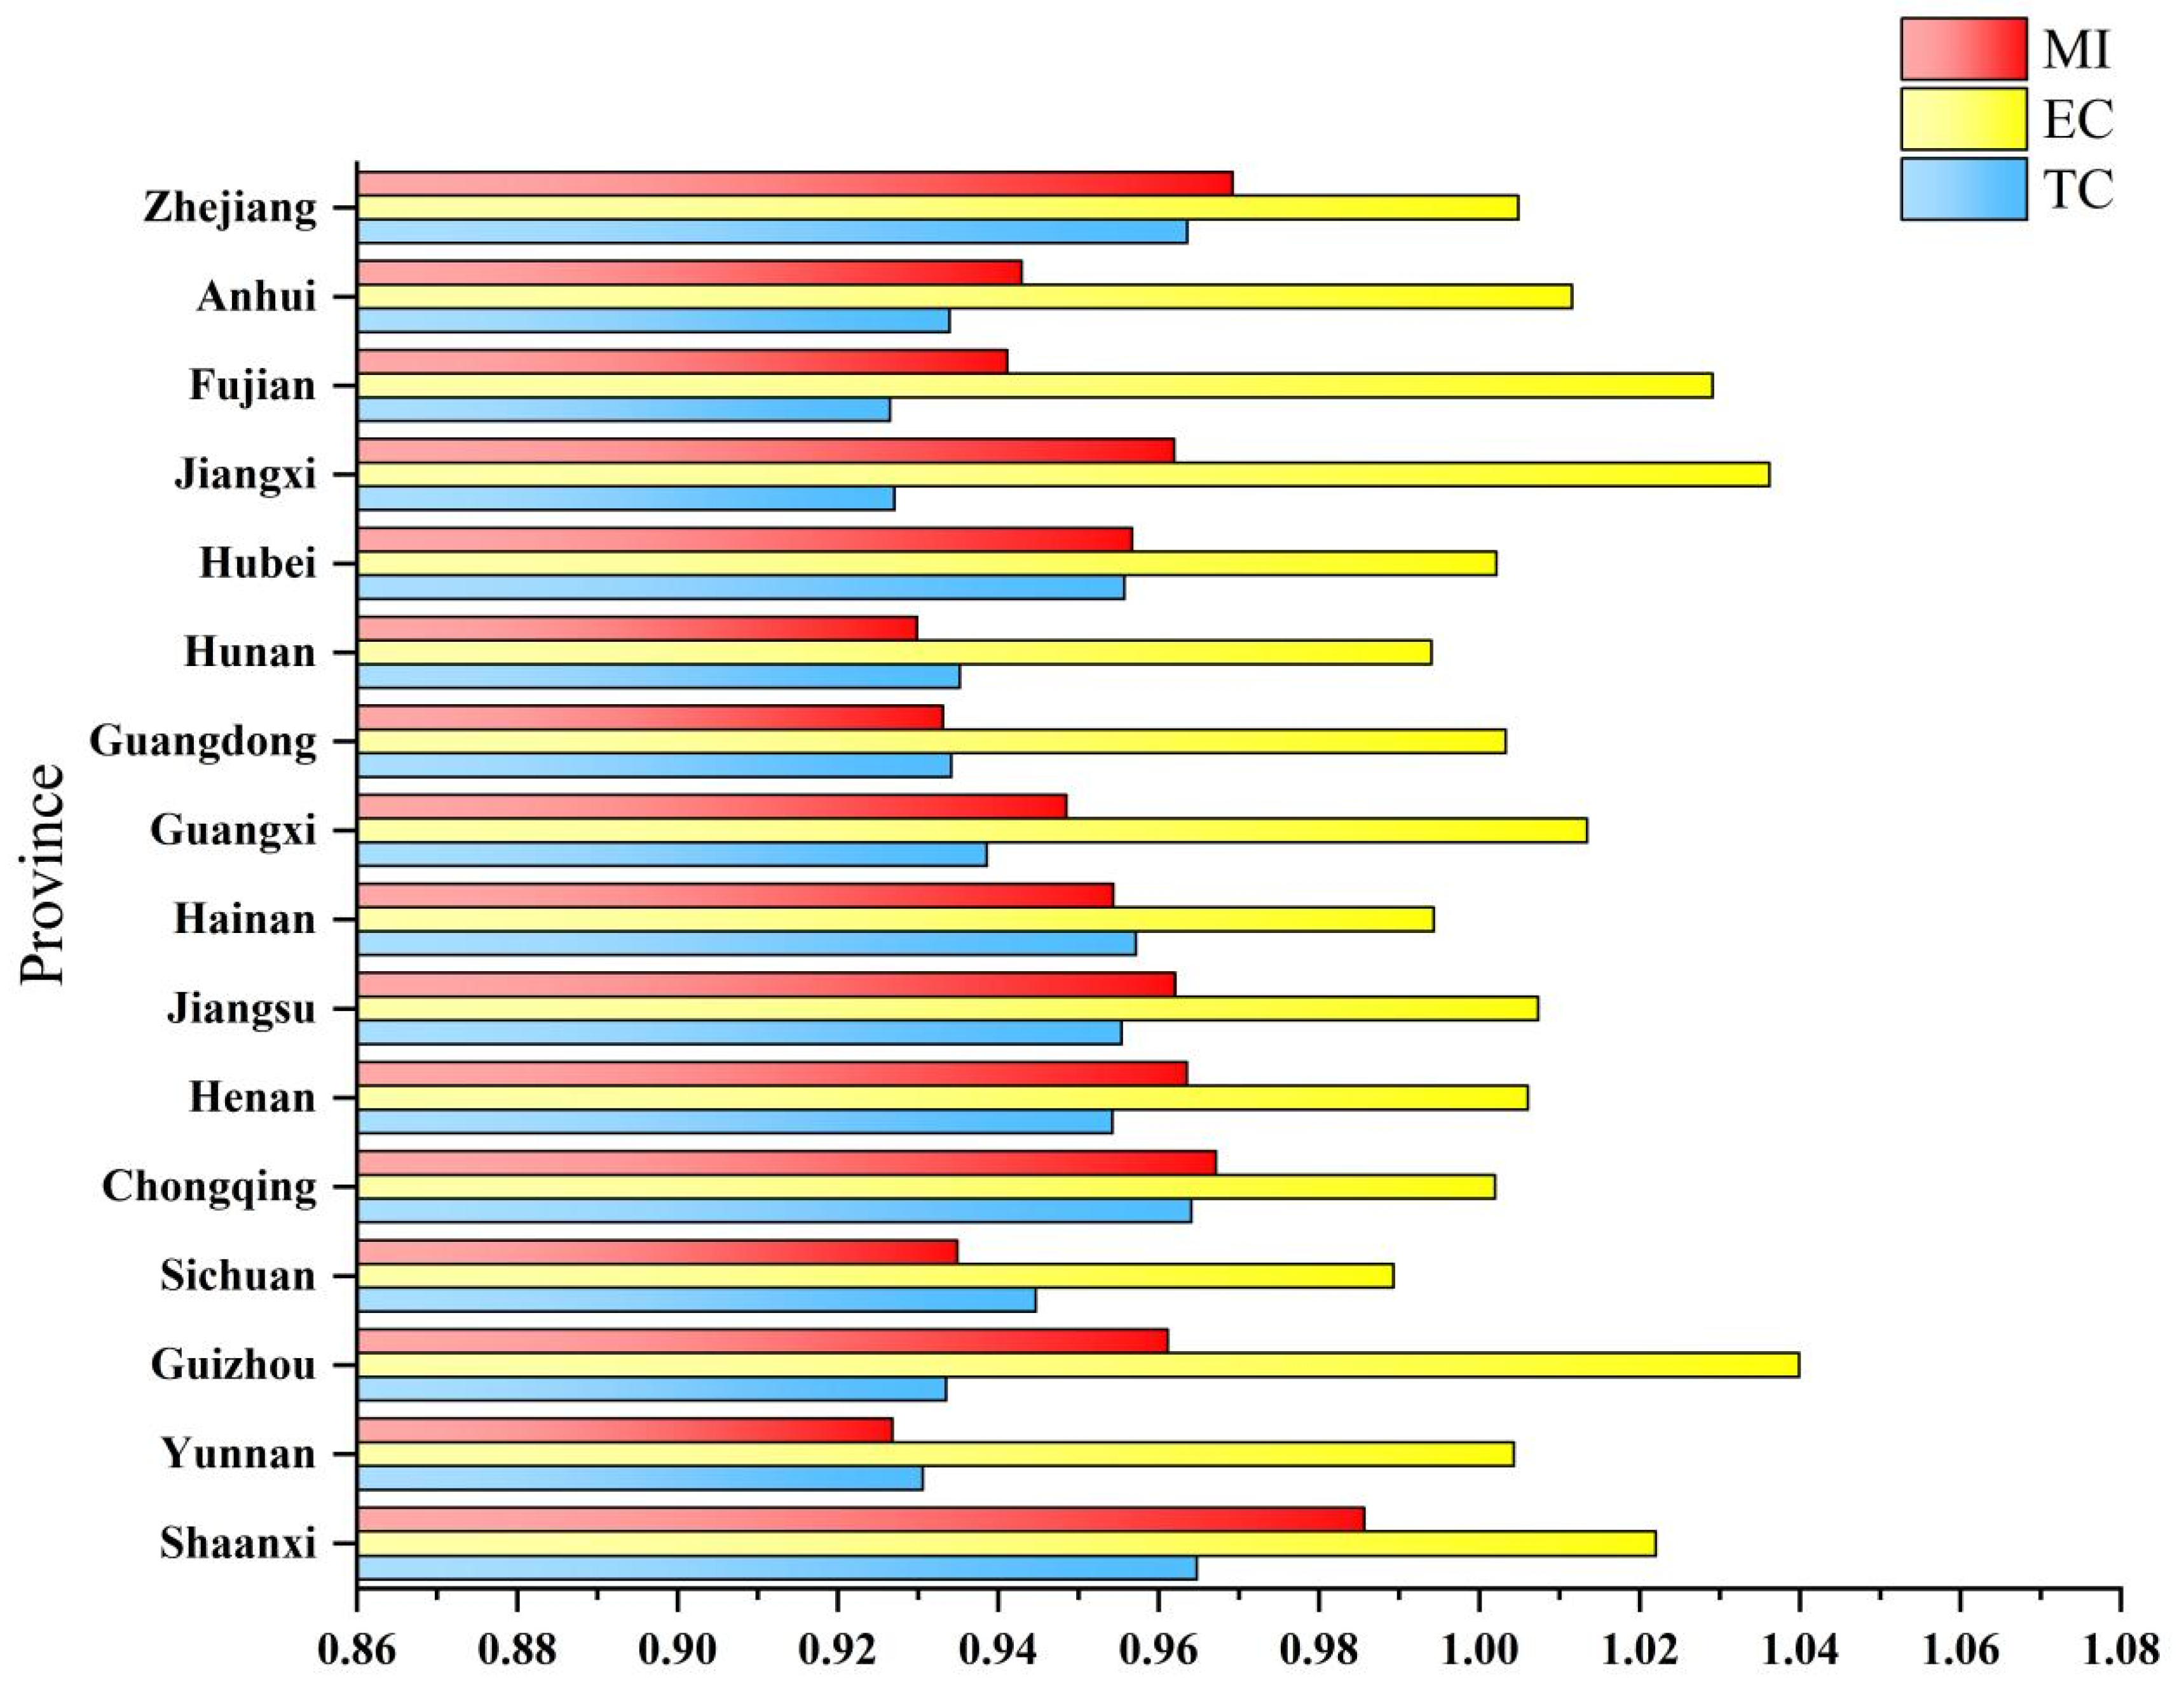
3.2.6. Provincial Variations in Indica Rice Eco-Efficiency and Technological Dynamics
In an exhaustive evaluation spanning 17 periods from 2004 to 2021, the Malmquist Index (MI) and its decomposition were analyzed for indica rice cultivation across 16 provinces (Figure 9). The prevalent trend suggests that MI and TC for a majority of provinces hover around or below the unitary mark, signifying palpable opportunities for technological upliftment. Conversely, many provinces have successfully attained elevated EC levels, with notable exceptions including Hunan, Hainan, and Sichuan. A discernible association emerges between MI and TC upon evaluating provincial averages.
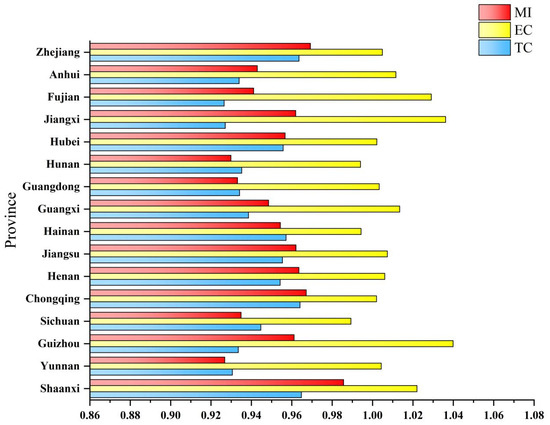
Figure 9.
Average MI, EC, TC of indica rice in each province of China from 2004 to 2021.
Zhejiang’s MI, registered at 0.969, is bolstered by a favorable EC of 1.005. Nevertheless, its TC at 0.964 indicates potential avenues for technological refinement. Anhui, with its MI at 0.943, boasts an EC marginally above unity at 1.012, yet the TC of 0.934 underscores a prospect for technological development. In Fujian, machinery investment costs are relatively low, whereas labor input per unit area is notably high, suggesting a minimal level of mechanization in the region. This limited adoption of mechanization can be attributed to Fujian’s mountainous terrain, hilly landscapes, and fragmented land parcels, making it challenging to implement mechanized farming methods. Both Fujian and Jiangxi, possessing MIs of 0.941 and 0.962, respectively, enjoy robust EC metrics. However, their TCs, falling shy of 0.930, suggest that weaving in modern cultivation practices, suited to the region’s specific agronomic conditions, might amplify yields. Hubei strikes a balanced chord, evidenced by an MI of 0.957, buttressed by an EC of 1.002 and a TC of 0.956. The region, endowed with abundant water reserves, has harnessed efficiency optimally, but there remains a frontier in technological advancements to be explored. Hunan’s MI, pegged at 0.930, reveals potential augmentation areas, given its EC of 0.994 and a TC of 0.935. Guangdong and Guangxi, brandishing MIs of 0.933 and 0.949, respectively, both flaunt ECs slightly over 1. However, their TC values linger below 0.940. These provinces, strategically positioned with robust market linkages, could bolster their competitive stature through technological assimilation. Interestingly, while Hainan Province achieves the highest rank in the SBM-DEA eco-efficiency measurement, its MI index does not secure a top position. This can be attributed to Hainan’s already impressive eco-efficiency in the base year (2004), standing at 1.30, leaving limited scope for substantial enhancement. Hainan, characterized by its tropical milieu, registers an MI of 0.954. Its EC, fractionally below the baseline, coupled with a TC of 0.957, indicates the prospect of capitalizing on its unique climatic attributes for cultivating specialized rice strains. A collective assessment of Jiangsu, Henan, Chongqing, Sichuan, Guizhou, Yunnan, and Shaanxi—a cohort representing diverse topographical and climatic spectra—shows that they uniformly exhibit MIs spanning from 0.962 to 0.986. Most of these provinces have entrenched commendable efficiency standards, but their TC benchmarks signal clear prospects for technological infusion, with provinces like Guizhou, showcasing a TC of 0.933, standing out.
In addition, despite being economically advanced, provinces like Jiangsu and Guangdong are not leading in the MI index; with Guangdong notably ranking towards the lower end. A significant reason for this discrepancy is the excessive use of input factors, including fertilizers and pesticides, in these regions. Such overuse results in heightened undesired outputs, primarily in the form of environmental pollutants. This observation aligns with Sun et al.’s findings (2021) [20], which highlighted the substantial potential for improvement in the technical efficiency of chemical fertilizer use in China’s primary rice-producing provinces. Excessive application of agricultural inputs directly correlates with increased greenhouse gas (GHG) emissions [56]. Indeed, rice agroecosystems are responsible for approximately 48% of global farmland GHG emissions [57,58]. Furthermore, GHG-induced climate change threatens rice’s long-term productivity and can even amplify GHG emissions [59]. Consequently, there is an urgent call for agronomic innovations that champion climate-resilient and sustainable rice farming practices [60].
4. Conclusions and Policy Recommendations
4.1. Conclusions
In this comprehensive study, employing the super-efficiency SBM model in tandem with the Malmquist Index and its components, we explored the eco-efficiency of three-season indica rice across 16 pivotal provinces in China from 2004 to 2021. What sets this research apart is the innovative approach of incorporating undesirable outputs, specifically carbon emissions, into the efficiency dynamics evaluation across varying periods, provinces, and rice cultivation seasons. The main conclusions are as follows:
(1) An inclusive analysis of indica rice eco-efficiency, considering the carbon emissions impact, reveals an average efficiency trend. What stands out and resonates universally is the transformative power of technology in agriculture, most distinctly seen within the medium indica rice sector. While stability in the Malmquist Index (MI) was observed in periods such as 2005–2006, the zenith reached during 2017–2018 is a testament to the global narrative: integrating advanced technology and wise resource management is pivotal for enhanced agricultural productivity while maintaining ecological balance. This observation finds support in studies by Keizer et al. [61] and Christian et al. [62], further asserting the universal relevance of our findings.
(2) Notable fluctuations in the eco-efficiency of indica rice, especially during periods such as 2008, underline the vulnerability of rice agriculture to climatic adversities. Events like the “2008 Chinese winter storms” significantly hampered production, emphasizing that while technological and agronomic advancements play a pivotal role in bolstering efficiency, they must be complemented with climate-resilient strategies to ensure consistent and sustainable rice production. This observation highlights the global need for integrating climate adaptation measures within agricultural frameworks to counteract the unpredictable nature of extreme weather events.
(3) Through the lens of the Malmquist Index and its decomposition, a universal truth emerges: efficiency, divorced from ecological consideration, is short-lived. In provinces such as Hunan, Hainan, and Sichuan, where efficient practices are evident, there remains a noticeable gap in technological advancement. This highlights a pressing message for the global sphere: efficiency is vital, yet it must be harmonized with sustainable agricultural methodologies. This is not merely a regional insight but a global doctrine underscoring the deep synergy between innovation, enhanced efficiency, and sustainable agriculture.
(4) On delving deeper at the provincial level, it becomes evident that agricultural practices and efficiencies are not monolithic. While regions like Zhejiang and Jiangxi offer a benchmark of consistency, areas like Hubei and Hunan spotlight the potential of coupling technological advances with ecological prudence. This regional disparity over time is not just a cue for localized strategy modifications but also sends a message to the global research fraternity: tailored, region-specific interventions are quintessential for achieving the twin objectives of productivity and sustainability.
4.2. Policy Implications
First, the central and provincial governments should consider establishing grant programs specifically tailored to encourage and assist farmers in integrating advanced agricultural technologies into their practices. These grants can be used to purchase state-of-the-art machinery, implement advanced irrigation systems, or attend training sessions.
Second, foster collaborations between private technology firms and public agricultural bodies to co-create solutions that can help in monitoring and reducing the undesirable outputs in real-time. For instance, IoT-enabled devices to detect and minimize wastage or emissions.
Third, recognizing the unique challenges faced by different provinces and establishing integrated digital agricultural hubs that blend physical innovation centers with digital platforms. These hubs can serve as localized research and training centers for agronomic challenges while also providing an online platform for farmers to exchange best practices, innovative solutions, and knowledge related to green production.
4.3. Limitations of the Study
This research primarily relies on official statistical data, which presents inherent constraints. A key limitation is the absence of specific methane emission data when segmenting indica rice into early, medium, and late varieties. Additionally, the study lacks comprehensive data on the quantities of diesel and pesticides used, which might skew the calculations of undesired outputs. Given these constraints, it becomes evident that while our findings provide valuable insights, they are not exhaustive. Future research endeavors should prioritize the selection of representative areas for in-depth experimental and empirical investigations. This will ensure a more holistic understanding and further refine the results, capturing a broader spectrum of influencing factors in indica rice production.
Author Contributions
Y.L.: Conceptualization, Methodology, Software, Formal analysis, Validation, Visualization, Writing—Original Draft. Z.S.: Data curation, Investigation, Writing—Review & Editing. G.Y.: Supervision. J.X.: Funding acquisition, Project administration. All authors have read and agreed to the published version of the manuscript.
Funding
The work reported here was supported by grants from National Science Foundation for Young Scientists of China (Project No.: 72103178, G0311).
Data Availability Statement
Data will be made available on request.
Conflicts of Interest
The authors declare no conflict of interest.
Appendix A
Appendix A.1. Super Efficiency SBM Model Basics
Using linear programming techniques, data envelopment analysis (DEA) [63] provides a suitable way to estimate a multiple inputs/multiple outputs empirical efficient function as described by Farrell [64]. However, in instances where there is excessive input or insufficient output, implying the presence of non-zero slacks in inputs or outputs, radial DEA tends to overestimate the efficiency of a Decision-Making Unit (DMU). Furthermore, angular DEA often overlooks variations in input or output, resulting in findings that may not truly reflect the objective reality.
To address these shortcomings, Tone [65] introduced a novel efficiency measurement approach based on slack variables, termed the Slacks-Based Measure (SBM) model. The SBM model proposed by Tone et al., 2001 [61] possesses an inherent limitation: the efficiency values it calculates are confined within the (0,1] interval. Decision-Making Units (DMUs) with an efficiency score of 1 are deemed efficient, while those scoring less than 1 are considered inefficient. Consequently, there is an inability to make comparative assessments among efficient DMUs. To address this issue, Tone [66] introduced the super-efficiency SBM model. Undesirable outputs are almost always a part of the rice production process. Tone [67] proposed the undesirable super-efficiency SBM model, which took into account the undesirable outputs for the first time in the SBM literature and thus can better reflect the essence of efficiency evaluation. The model is stated as follows: suppose there are n DMUs, and each DMU contains m inputs, then and are the desirable and undesirable outputs, respectively. If we denote the relative factors by three vectors: , , and , the matrices X, , and can be defined as follows: , , .
Then, the production possibility set (PPS) can be described as Formula (A1):
where is the non-negative intensity vector, indicating that the above definition corresponds to the constant returns to scale (CRS) condition.
Based on this PPS, and according to Tone’s SBM model (Tone et al., 2004 [67]), the Super-SBM model with undesirable outputs for evaluating the SBM-efficient DMUs can be measured as Formula (A2):
where the is the objective function whose value can be more than 1. This non-angle and non-radial Super-SBM model with undesirable outputs has numerous advantages. First, it effectively solves the slackness problems of inputs and outputs caused by radial and angular choices [68]. Second, it directly addresses the input excess and output shortfall in efficiency measurements, which is particularly suitable for dealing with undesirable outputs [69]. Third, it can rank the SBM-efficient DMUs in the SBM model [70]. Therefore, compared with other DEA models, the Super-SBM model with undesirable outputs better represents the nature of indica rice’s GTFP evaluations.
Appendix A.2. Malmquist Index (MI) Model Basics
The Malmquist index, originally postulated by Swedish economist Sten Malmquist [71] in 1953, has evolved substantially since its inception. Fare et al. [72] constructed the geometric mean of the comprehensive Malmquist productivity index (MI) based on the input-oriented CCR model and further decomposed it into two components: EC (efficiency change) and TC (technical change). Supposing that a DMU produces a vector of outputs by using a vector of inputs in period t. Let and denote the same input-output pairs in periods t and t + 1, respectively. The MI of this DMU between two designated time points is defined as:
In Formula (A3), represents the input quantity in period t and period t + 1; represents the output quantity in period t and period t + 1; , represents the input distance function of the decision unit compared with the frontier surface in periods t and t + 1, , represents the input distance function of the decision unit compared with the frontier surface in periods t and t + 1.
References
- Chen, J. Rapid Urbanization in China: A Real Challenge to Soil Protection and Food Security. Catena 2007, 69, 1–15. [Google Scholar] [CrossRef]
- Wheeler, T.; Braun, J.V. Climate Change Impacts on Global Food Security. Science 2013, 341, 508–513. [Google Scholar] [CrossRef]
- Rosegrant, M.W.; Ringler, C.; Zhu, T. Water for Agriculture: Maintaining Food Security under Growing Scarcity. Annu. Rev. Environ. Resour. 2009, 34, 205–222. [Google Scholar] [CrossRef]
- Laborde, D.; Martin, W.; Swinnen, J.; Vos, R. COVID-19 Risks to Global Food Security. Science 2020, 369, 500–502. [Google Scholar] [CrossRef]
- Imran, M.A.; Ali, A.; Ashfaq, M.; Hassan, S.; Culas, R.; Ma, C. Impact of Climate Smart Agriculture (CSA) through Sustainable Irrigation Management on Resource Use Efficiency: A Sustainable Production Alternative for Cotton. Land Use Policy 2019, 88, 104113. [Google Scholar] [CrossRef]
- Zhang, Q.; Zhang, F.; Wu, G.; Mai, Q. Spatial Spillover Effects of Grain Production Efficiency in China: Measurement and scope. J. Clean. Prod. 2021, 278, 121062. [Google Scholar] [CrossRef]
- Ma, L.; Long, H.; Tang, L.; Tu, S.; Zhang, Y.; Qu, Y. Analysis of the Spatial Variations of Determinants of Agricultural Production Efficiency in China. Comput. Electron. Agric. 2021, 180, 105890. [Google Scholar] [CrossRef]
- Battese, G.E.; Coelli, T.J. Frontier production functions, technical efficiency and panel data: With application to paddy farmers in India. J. Prod. Anal. 1992, 3, 153–169. [Google Scholar] [CrossRef]
- Mkanthama, J.; Makombe, G.; Kihoro, J.; Ateka, E.M.; Kanjere, M. Technical Efficiency of Rainfed and Irrigated Rice Production in Tanzania. Irrig. Drain. 2018, 67, 233–241. [Google Scholar] [CrossRef]
- Hidayati, B.; Yamamoto, N.; Kano, H. Investigation of production efficiency and socio-economic factors of organic rice in Sumber Ngepoh district, Indonesia. J. Cent. Eur. Agric. 2019, 20, 748–758. [Google Scholar] [CrossRef]
- Houshyar, E.; Azadi, H.; Almassi, M. Sustainable and efficient energy consumption of corn production in Southwest Iran: Combination of multi-fuzzy and DEA modeling. Energy 2012, 44, 672–681. [Google Scholar] [CrossRef]
- Odeck, J. Statistical precision of DEA and Malmquist indices: A bootstrap application to Norwegian grain producers. Omega 2009, 37, 1007–1017. [Google Scholar] [CrossRef]
- Dolgikh, Y. Evaluation and analysis of dynamics of change of efficiency of grain production in Ukraine by DEA method. Agric. Resour. Econ. 2019, 5, 47–62. [Google Scholar] [CrossRef]
- Watkins, K.; Hristovska, T.; Mazzanti, R.; Wilson, C.; Schmidt, L. Measurement of Technical, Allocative, Economic, and Scale Efficiency of Rice Production in Arkansas Using Data Envelopment Analysis. J. Agric. Appl. Econ. 2014, 46, 89–106. [Google Scholar] [CrossRef]
- Garcia, A.F.; Shively, G.E. How Might Shadow Price Restrictions Reduce Technical Efficiency? Evidence from a Restricted DEA Analysis of Coffee Farms in Vietnam. J. Agric. Econ. 2011, 62, 47–58. [Google Scholar] [CrossRef]
- Huang, M.; Li, X.; Zeng, L. Impact of farmers’ capital endowment on eco—efficiency of rice production—A case study of Hubei province. Chin. J. Agric. Resour. Reg. Plan. 2022, 43, 75–84. [Google Scholar]
- Tian, H.; Fu, W. The quality of rural labor force and rice production technical efficiency. Commer. Res. 2021, 2, 88–98. [Google Scholar] [CrossRef]
- Mahesh, H.B.; Shirke, M.D.; Singh, S.; Rajamani, A.; Hittalmani, S.; Wang, G.-L.; Gowda, M. Indica rice genome assembly, annotation and mining of blast disease resistance genes. BMC Genom. 2016, 17, 242. [Google Scholar] [CrossRef]
- Peng, S.; Tang, Q.; Zou, Y. Current Status and Challenges of Rice Production in China. Plant Prod. Sci. 2009, 12, 3–8. [Google Scholar] [CrossRef]
- Ying, J.; Peng, S.; He, Q.; Yang, H.; Yang, C.; Visperas, R.M.; Cassman, K.G. Comparison of high-yield rice in tropical and subtropical environments: I. Determinants of grain and dry matter yields. Field Crop. Res. 1998, 57, 71–84. [Google Scholar] [CrossRef]
- Glaszmann, J.C. Isozymes and classification of Asian rice varieties. Theor. Appl. Genet. 1987, 74, 21–30. [Google Scholar] [CrossRef] [PubMed]
- Jing, Q.; Spiertz, J.H.J.; Hengsdijk, H.; van Keulen, H.; Cao, W.; Dai, T. Adaptation and performance of rice genotypes in tropical and subtropical environments. NJAS Wagening. J. Life Sci. 2010, 57, 149–157. [Google Scholar] [CrossRef]
- Sun, Z.; Li, X. Technical Efficiency of Chemical Fertilizer Use and Its Influencing Factors in China’s Rice Production. Sustainability 2021, 13, 1155. [Google Scholar] [CrossRef]
- Färe, R.; Grosskopf, S.; Lindgren, B.; Roos, P. Productivity Developments in Swedish Hospitals: A Malmquist Output Index Approach. In Data Envelopment Analysis: Theory, Methodology, and Applications; Springer: Dordrecht, The Netherlands, 1994. [Google Scholar] [CrossRef]
- Chung, Y.H.; Färe, R.; Grosskopf, S. Productivity and undesirable outputs: A directional distance function approach. J. Environ. Manag. 1997, 51, 229–240. [Google Scholar] [CrossRef]
- Wang, H.; Wang, M. Effects of technological innovation on energy efficiency in China: Evidence from dynamic panel of 284 cities. Sci. Total Environ. 2020, 709, 136172. [Google Scholar] [CrossRef]
- Newman, C.; Matthews, A. The productivity performance of Irish dairy farms 1984–2000: A multiple output distance function approach. J. Prod. Anal. 2006, 26, 191–205. [Google Scholar] [CrossRef]
- Ma, L.; Zhang, W.F.; Ma, W.Q.; Velthof, G.L.; Oenema, O.; Zhang, F.S. An Analysis of Developments and Challenges in Nutrient Management in China. J. Environ. Qual. 2013, 42, 951–961. [Google Scholar] [CrossRef]
- Liu, E.K.; He, W.Q.; Yan, C.R. ‘White revolution’ to ‘white pollution’—Agricultural plastic film mulch in China. Environ. Res. Lett. 2014, 9, 091001. [Google Scholar] [CrossRef]
- Li, H.; Liu, H.; Gong, X.; Li, S.; Pang, J.; Chen, Z.; Sun, J. Optimizing irrigation and nitrogen management strategy to trade off yield, crop water productivity, nitrogen use efficiency and fruit quality of greenhouse grown tomato. Agric. Water Manag. 2021, 245, 106570. [Google Scholar] [CrossRef]
- Salam, M.A.; Rahman, S.; Anik, A.R.; Sharna, S.C. Exploring competitiveness of surface water versus ground water irrigation and their impacts on rice productivity and efficiency: An empirical analysis from Bangladesh. Agric. Water Manag. 2023, 283, 108298. [Google Scholar] [CrossRef]
- Keson, J.; Silalertruksa, T.; Gheewala, S.H. Land suitability class and implications to Land-Water-Food Nexus: A case of rice cultivation in Thailand. Energy Nexus 2023, 10, 100205. [Google Scholar] [CrossRef]
- Ojo, T.O.; Baiyegunhi, L.J.S. Impact of climate change adaptation strategies on rice productivity in South-west, Nigeria: An endogeneity corrected stochastic frontier model. Sci. Total Environ. 2020, 745, 141151. [Google Scholar] [CrossRef]
- Shi, M.; Paudel, K.P.; Chen, F. Mechanization and efficiency in rice production in China. J. Integr. Agric. 2021, 20, 1996–2008. [Google Scholar] [CrossRef]
- Wang, X.; Li, J.; Li, J.; Chen, Y.; Shi, J.; Liu, J.; Sriboonchitta, S. Temporal and Spatial Evolution of Rice Productivity and Its Influencing Factors in China. Agronomy 2023, 13, 1075. [Google Scholar] [CrossRef]
- Nodin, M.N.; Mustafa, Z.; Hussain, S.I. Eco-efficiency assessment of Malaysian rice self-sufficiency approach. Socio-Econ. Plan. Sci. 2023, 85, 101436. [Google Scholar] [CrossRef]
- Liao, J.; Yu, C.; Feng, Z.; Zhao, H.; Wu, K.; Ma, X. Spatial differentiation characteristics and driving factors of agricultural eco-efficiency in Chinese provinces from the perspective of ecosystem services. J. Clean. Prod. 2021, 288, 125466. [Google Scholar] [CrossRef]
- Fei, R.; Lin, B. Estimates of energy demand and energy saving potential in China’s agricultural sector. Energy 2017, 135, 865–875. [Google Scholar] [CrossRef]
- Song, Y.; Zhang, B.; Wang, J.; Kwek, K. The impact of climate change on China’s agricultural green total factor productivity. Technol. Forecast. Soc. Chang. 2022, 185, 122054. [Google Scholar] [CrossRef]
- Liu, Y.; Zhang, J.; Zhang, L. Analysis of carbon emission efficiency of rice in China under different rice planting patterns based on the DEA-SBM model. J. China Agric. Univ. 2018, 23, 177–186. [Google Scholar]
- Lu, H.; Xie, H.; He, Y.; Wu, Z.; Zhang, X. Assessing the impacts of land fragmentation and plot size on yields and costs: A translog production model and cost function approach. Agric. Syst. 2018, 161, 81–88. [Google Scholar] [CrossRef]
- Lyu, Y.; Yang, X.; Pan, H.; Zhang, X.; Cao, H.; Ulgiati, S.; Wu, J.; Zhang, Y.; Wang, G.; Xiao, Y. Impact of fertilization schemes with different ratios of urea to controlled release nitrogen fertilizer on environmental sustainability, nitrogen use efficiency and economic benefit of rice production: A study case from Southwest China. J. Clean. Prod. 2021, 293, 126198. [Google Scholar] [CrossRef]
- Wang, H.; Wang, N.; Quan, H.; Zhang, F.; Fan, J.; Feng, H.; Cheng, M.; Liao, Z.; Wang, X.; Xiang, Y. Yield and water productivity of crops, vegetables and fruits under subsurface drip irrigation: A global meta-analysis. Agric. Water Manag. 2022, 269, 107645. [Google Scholar] [CrossRef]
- Yang, Z.; Zhu, Y.; Zhang, X.; Liao, Q.; Fu, H.; Cheng, Q.; Chen, Z.; Sun, Y.; Ma, J.; Zhang, J.; et al. Unmanned aerial vehicle direct seeding or integrated mechanical transplanting, which will be the next step for mechanized rice production in China? —A comparison based on energy use efficiency and economic benefits. Energy 2023, 273, 127223. [Google Scholar] [CrossRef]
- Naz, M.Y.; Sulaiman, S.A. Slow release coating remedy for nitrogen loss from conventional urea: A review. J. Control. Release 2016, 225, 109–120. [Google Scholar] [CrossRef]
- Zheng, W.; Zhang, M.; Liu, Z.; Zhou, H.; Lu, H.; Zhang, W.; Yang, Y.; Li, C.; Chen, B. Combining controlled-release urea and normal urea to improve the nitrogen use efficiency and yield under wheat-maize double cropping system. Field Crop. Res. 2016, 197, 52–62. [Google Scholar] [CrossRef]
- Shaviv, A. Advances in controlled-release fertilizers. Adv. Agron. 2001, 71, 1–49. [Google Scholar]
- Department of Agriculture and Rural Affairs of Guangdong Province. Notice on the Issuance of the Implementation Plan for Fertilizer Reduction and Efficiency Increase in 2020. 2020. Available online: http://dara.gd.gov.cn/tzgg2272/content/post_3055204.html (accessed on 16 October 2023). (In Chinese)
- Xu, Y.; Ge, J.; Tian, S.; Li, S.; Nguy-Robertson, A.L.; Zhan, M.; Cao, C. Effects of water-saving irrigation practices and drought resistant rice variety on greenhouse gas emissions from a no-till paddy in the central lowlands of China. Sci. Total Environ. 2015, 505, 1043–1052. [Google Scholar] [CrossRef]
- Xu, Y.; Zhan, M.; Cao, C.; Tian, S.; Ge, J.; Li, S.; Wang, M.; Yuan, G. Improved water management to reduce greenhouse gas emissions in no-till rapeseed–rice rotations in Central China. Agric. Ecosyst. Environ. 2016, 221, 87–98. [Google Scholar] [CrossRef]
- Qi, P.; Wang, Z.; Wang, C.; Xu, L.; Jia, X.; Zhang, Y.; Wang, S.; Han, L.; Li, T.; Chen, B.; et al. Development of multifunctional unmanned aerial vehicles versus ground seeding and outplanting: What is more effective for improving the growth and quality of rice culture? Front. Plant Sci. 2022, 13, 953753. [Google Scholar] [CrossRef]
- Wang, X.; Yang, G.; Pan, X.; Xiang, H.; Peng, S.; Xu, L. Feasibility of improving unmanned aerial vehicle-based seeding efficiency by using rice varieties with low seed weight. Rice Sci. 2022, 29, 299–303. [Google Scholar] [CrossRef]
- Huang, M.; Xia, B.; Zou, Y.; Jiang, P.; Mo, Y. No-till direct seeding for energy-saving rice production in China. In Farming for Food and Water Security. Sustainable Agriculture Reviews; Lichtfouse, E., Ed.; Springer: Dordrecht, The Netherlands, 2012; Volume 10, pp. 111–126. [Google Scholar]
- Lampayan, R.M.; Rejesus, R.M.; Singleton, G.R.; Bouman, B. Adoption and economics of alternate wetting and drying water management for irrigated lowland rice. Field Crop. Res. 2015, 170, 95–108. [Google Scholar] [CrossRef]
- Wan, J.; Qi, L.; Zhang, H.; Lu, Z.; Zhou, J. Research status and development trend of UAV broadcast sowing technology in China. In Proceedings of the 2021 ASABE Annual International Virtual Meeting, Virtual, 12–16 July 2021. [Google Scholar] [CrossRef]
- Cai, G.; Su, X.; Li, Y.; Wang, X. Comparisons between diversified multicropping systems in terms of crop productivity, economic benefits and carbon footprint in the Pearl River Delta region of South China. Farming Syst. 2023, 1, 100051. [Google Scholar] [CrossRef]
- Carlson, K.M.; Gerber, J.S.; Mueller, N.D.; Herrero, M.; MacDonald, G.K.; Brauman, K.A.; Havlik, P.; O’Connell, C.S.; Johnson, J.A.; Saatchi, S.; et al. Greenhouse gas emissions intensity of global croplands. Nat. Clim. Chang. 2017, 7, 63–68. [Google Scholar] [CrossRef]
- Wang, Q.; Zhou, F.; Shang, Z.; Ciais, P.; Winiwarter, W.; Jackson, R.B.; Tubiello, F.N.; Janssens-Maenhout, G.; Tian, H.; Cui, X.; et al. Data-driven estimates of global nitrous oxide emissions from croplands. Natl. Sci. Rev. 2020, 7, 441–452. [Google Scholar] [CrossRef] [PubMed]
- van Groenigen, K.J.; van Kessel, C.; Hungate, B.A. Increased greenhouse-gas intensity of rice production under future atmospheric conditions. Nat. Clim. Chang. 2013, 3, 288–291. [Google Scholar] [CrossRef]
- Gao, H.; Liu, Q.; Yan, C.; Wu, Q.; Gong, D.; He, W.; Liu, H.; Wang, J.; Mei, X. Mitigation of greenhouse gas emissions and improved yield by plastic mulching in rice production. Sci. Total Environ. 2023, 880, 162984. [Google Scholar] [CrossRef]
- Keizer, T.H.; Emvalomatis, G. Differences in TFP growth among groups of dairy farms in the Netherlands. NIAS-Wagening. J. Life Sci. 2014, 70, 33–38. [Google Scholar] [CrossRef]
- Christian, N.; Bichaka, F. Trends in agricultural production efficiency and their implications for food security in Sub-Saharan African countries. Afr. Dev. Rev. 2019, 31, 3–8. [Google Scholar]
- Charnes, A.A.; Cooper, W.W.; Rhodes, E. Measuring the efficiency of decision making units. Eur. J. Oper. Res. 1978, 2, 429–441. [Google Scholar] [CrossRef]
- Farrell, M.J. The Measurement of Productive Efficiency. J. R. Stat. Soc. A Stat. 1957, 120, 253–290. [Google Scholar] [CrossRef]
- Tone, K. A slacks-based measure of efficiency in data envelopment analysis. Eur. J. Oper. Res. 2001, 130, 489–509. [Google Scholar] [CrossRef]
- Tone, K. A slacks-based measure of super-efficiency in data envelopment analysis. Eur. J. Oper. Res. 2002, 143, 32–41. [Google Scholar] [CrossRef]
- Tone, K. Dealing with Undesirable Outputs in DEA: A Slacks-based Measure (SBM) Approach. Presented at the NAPW III, Toronto, ON, Canada, 23–25 June 2004; pp. 44–45. [Google Scholar]
- Song, M.L.; An, Q.; Zhang, W.; Wang, Z.; Wu, J. Environmental efficiency evaluation based on data envelopment analysis: A review. Renew. Sustain. Energy Rev. 2012, 16, 4465–4469. [Google Scholar] [CrossRef]
- Zhou, P.; Ang, B.W.; Poh, K.L. Slacks-based efficiency measures for modeling environmental performance. Ecol. Econ. 2006, 60, 111–118. [Google Scholar] [CrossRef]
- Song, M.L.; Zhang, L.; An, Q.; Wang, Z.; Li, Z. Statistical analysis and combination forecasting of environmental efficiency and its influential factors since China entered the WTO: 2002–2010–2012. J. Clean. Prod. 2013, 42, 42–51. [Google Scholar] [CrossRef]
- Malmquist, S. Index numbers and indifference surfaces. TEST 1953, 4, 209–242. [Google Scholar] [CrossRef]
- Färe, R.; Grosskopf, S.; Lindgren, B.; Roos, P. Productivity change in Swedish pharmacies 1980–1989: A non-parametric Malmquist approach. J. Prod. Anal. 1992, 3, 85–102. [Google Scholar] [CrossRef]


Disclaimer/Publisher’s Note: The statements, opinions and data contained in all publications are solely those of the individual author(s) and contributor(s) and not of MDPI and/or the editor(s). MDPI and/or the editor(s) disclaim responsibility for any injury to people or property resulting from any ideas, methods, instructions or products referred to in the content. |
© 2023 by the authors. Licensee MDPI, Basel, Switzerland. This article is an open access article distributed under the terms and conditions of the Creative Commons Attribution (CC BY) license (https://creativecommons.org/licenses/by/4.0/).