Article

Identification of Allele-Specific Expression Genes Associated with Maize Heterosis

1
College of Agronomy, Shenyang Agricultural University, Shenyang 110161, China
2
State Key Laboratory of Crop Gene Resources and Breeding, Institute of Crop Sciences, Chinese Academy of Agricultural Sciences, Beijing 100081, China
*
Author to whom correspondence should be addressed.
These authors contributed equally to this work.
Agronomy 2023, 13(11), 2722; https://doi.org/10.3390/agronomy13112722
Submission received: 30 September 2023 / Revised: 26 October 2023 / Accepted: 26 October 2023 / Published: 29 October 2023
(This article belongs to the Section Crop Breeding and Genetics)

Abstract

:
Deciphering the molecular basis of heterosis would yield genes and markers for designing improved maize-hybrid varieties. In this study, 481 BC1F3 lines derived from Zheng58 and PH4CV were genotyped with 15,386 polymorphic SNPs markers and testcrossed with two testers (Chang7-2 and PH6WC) to generate 962 testcross lines. The yield of these testcross lines and their parental lines was evaluated across multiple environments. Genetic analysis revealed that dominance is the primary contributor to heterosis. Mapping of midparent heterosis (MPH) identified two dominant QTL, six additive-by-additive interactions, eighteen additive-by-dominance interactions, and fifty-four dominance-by-dominance interactions. These interactions encompassed 104 genetic blocks, including 24 genetic blocks that explained >1% of phenotypic variances for both MPH and hybrid performance. We compared the locations of the allele-specific expression genes (ASEGs) identified from the expression data of two hybrid lines and their parental lines with those of the 24 genetic blocks and found 15 ASEGs related to yield or biomass regulation, including two known genes BT2 and ZmNF-YC4. Fisher’s exact test analysis indicated a significant enrichment of these ASEGs in the 24 blocks, affirming the reliability of the MPH-mapping results. The co-expression network of six ASEGs, including BT2 and ZmNF-YC4, contained many genes related to yield or biomass regulation. This study unravels potential candidate genes and regulatory networks associated with maize heterosis.

1. Introduction

Through thousands of years of evolution, domestication, and improvement, maize has retained a remarkable degree of genetic diversity. The genetic diversity found within different maize lines is equivalent to the divergence observed between humans and chimpanzees [1], highlighting the vast genetic variation among various maize accessions. This genetic diversity is closely linked to the phenomenon of maize heterosis. Phenotypically, heterosis refers to the superior performance of F1 hybrid progeny compared to their parental lines, particularly in terms of biomass and yield attributes. Maize has emerged as a leading model organism for the study of plant heterosis [2]. Investigating the regulatory mechanism of maize heterosis would boost our understanding of why and how hybrid maize has superior performance.
Various hypotheses have been proposed to elucidate the mechanisms of heterosis, including dominance and overdominance, involving interactions of two alleles, and epistasis, involving interactions of different genes [3]. Genetic and molecular experiments have been conducted to explore how alleles/genes/genetic factors interact to produce the enhanced performance observed in hybrid lines [4,5]. Using 2839 rice-hybrid lines and 9839 segregation individuals, Gu et al. [6] found that the intersubspecific heterosis of yield traits was mainly contributed to by genetic complementarity, and dominance-effect quantitative trait locus/loci (QTL) have a larger contribution than overdominance-effect QTL. On the other hand, researchers ascertained that rice heterosis emerges from the accumulation of numerous rare superior alleles exhibiting favorable dominance effects [7]. Using a large maize testcross population, Xiao et al. showed that yield heterosis is correlated with the widespread epistatic QTLs, especially a few major-effect additive-by-dominant QTLs which took effect in the early developmental stages [8]. Li et al. divided 1604 maize-inbred lines into female and male heterotic groups, and found that there was a positive correlation between heterosis and the heterozygosity levels in the differentiated genes between the two groups [9]. Disparate explanations may stem from differences in populations, species, and data types, and the identification of candidate genes underpinning heterosis promises to provide insights into the mechanics of this phenomenon.
Allele-Specific Expression (ASE) is associated with heterosis across multiple plant species [10,11,12,13]. ASE analysis in rice-hybrid lines and their parental lines has revealed discernible ASE patterns linked to the genetic basis of heterosis, aligning with the principles of dominance and over dominance [10]. Furthermore, the role of Allele-Specific Expression Genes (ASEGs) in fostering heterosis extends beyond rice, encompassing diverse plants such as maize, tea, and potato [11,12,13]. In the maize context, a notable enrichment of genes associated with heterosis was observed within functional categories spanning metabolic processes, hormone regulation, protein biosynthesis, and photosynthesis [11,14]. Particularly, genes pivotal to inflorescence meristem development and auxin metabolism exhibited potential relevance to maize heterosis [14]. Transcriptomic analyses in maize have identified candidate genes associated with heterosis, contributing to critical processes such as photosynthesis, carbohydrate metabolism, light response, and circadian rhythms [15]. ASE analysis and gene enrichment analysis presents a promising approach for identifying prime candidate genes that drive maize heterosis.
Midparent heterosis (MPH), which is the proportion of trait performance of F1 lines that exceeds that of the midparent, was commonly used to assess heterosis in plants. To dissect the genetic basis and regulatory networks associated with MPH in popular hybrid varieties, a BC1F3 biparental population consisting of 481 lines was constructed, and testcrossed with two tester lines. High-density molecular markers were used to genotype the BC1F3 population. Extensive yield evaluations were conducted in four distinct environmental contexts. The genetic basis of yield-based MPH was carefully examined using a linear mixed model and compared with the ASEGs identified from two hybrid varieties (‘ZD958′ and ’XY335′) and their respective parental lines. Fisher’s exact test was employed to assess the enrichment of these ASEGs near high-impact QTLs. Afterwards, candidate genes related to the regulation of yield or biomass were extracted from the ASEGs in the QTL regions, and the regulatory networks of six promising ASEGs were elucidated, shedding light on the potential regulatory network associated with the superior performance of popular hybrid varieties.

2. Materials and Methods

2.1. Phenotypic and Genotypic Data

The workflow for population development was provided in Figure S1. Specifically, the parental lines of ZD958 and XY335 were used for constructing populations in this study. ZD958 and XY335 are popular hybrid varieties in China [16]. The female and male parents of ZD958 are, respectively, Zheng58 and Chang7-2, and those of XY335 are, respectively, PH6WC and PH4CV. The four parental lines are inbred lines. PH4CV (female parent) and Zheng58 (male parent) were employed as the recurrent and donor parents, respectively, to produce F1 and BC1F1 plants. At the flowering stage, these BC1F1 plants were pollinated using pollens bulked from more than ten BC1F1 plants. The seeds harvested from these BC1F1 plants were named as bulk-BC1F2 generation, which were self-pollinated to produce 481 BC1F3 plants. Then, the BC1F3 plants were self-pollinated to generate the BC1F3:4 population containing 481 BC1F3:4 lines. Pollens from the same BC1F3 plants were used to pollinate PH6WC and Chang7-2 for developing two distinct testcross populations, with each containing 481 testcross lines. The two populations were designated as the PH6WC testcross population and Chang7-2 testcross population, respectively. For each population (BC1F3:4 population and the two testcross populations), we evaluated the yield of each line in Shunyi (Beijing municipality) during the summers of 2016 and 2017, as well as in Changji (Xinjiang Uygur Autonomous region) and Xinxiang (Henan province) during the summer of 2017.
The experimental design and field management were outlined in our previous work [17]. Specifically, each of the three populations (two testcross populations and one BC1F3:4 population) were planted separately in the field, and were arranged in an incomplete block design with two replicates. Because the population size was 481, each population was divided into eight random blocks with each block containing approximately the same number of lines (seven blocks contained sixty lines, and one block contained the remaining lines). Each hybrid line was sown in a two-row plot, and each parental lines was sown in a one-row plot. The row length, row space, and inter-plant space in the same row were 500, 60, and 25 cm, respectively. The planting density was approximately 66,660 plants per hectare. Management in the field followed the normal agricultural practice. The seed yield and water content in each plot was weighted, and the computed plot yield (adjusted to 14% water content) was then normalized by dividing it by the number of plants within the plot, yielding the yield-per-plant (YPP) data.
We firstly dissect the variance component following a linear mixed model:
y i j k l = μ + g i + e j + g e i j + δ j k + b k l + ε i j k ,
where y i j k is the yield of i th genotype in the k th (k = 1, 2) replicate nested in the j th (j = 1, 2, 3) environment, and the l th block is in the k th replicate. μ is the overall mean; g i is the genotype effect; e j is the environment effect; g e i j is G × E effect; δ j k is the replicate effect nested in environment effect; b k l is the block effect nested in replicate effect; and ε i j k is the residual error. All factors were treated as random effects when solving the model. However, we found that the block effect showed no significant variations (Table S1), and omitted the block effect when estimating broad-sense heritability and calculating the best linear unbiased estimate values (BLUEs). The broad sense heritability on an entry-mean basis was calculated following the below formula:
H 2 = σ g 2 σ g 2 + σ g e 2 N e + σ ε 2 r L * N e ,
where σ g 2 is the genetic variance; and σ g e 2 is the variance of genotype by environment interaction. N e and r are the number of environments and replicates, respectively.
When calculating BLUEs, the genotype was used as a fixed factor. The linear mixed model was fitted through using the lmer function in the R package “lme4” [18].
The genotypic data encompassing 15,386 polymorphic SNPs and their respective positions (mapped to maize reference-genome-version 3) were available in our earlier work [17].

2.2. Variance Components Analysis

MPH was calculated using the following formula:
MPH = F 1 MP MP 100 % ,
where F1 represents the BLUE value for each testcross line, and midparent (MP) signifies the mean value of the BLUE across parental lines. The relationship between MPH and genetic distance within the tested population was explored by calculating the Euclidean distance between the parents of each testcross line using the R function dist, followed by computing the correlation coefficient between MPH and Euclidean distance.
The variance components’ analysis was conducted according to the model proposed by Jiang et al. [19], denoted as follows:
y ˜ = T M d d + T M a a a a + T M a d a d + T M d d d d + T e ,
where y ˜ = T y ; T is a matrix that transforms phenotypic data of hybrid and parental lines into MPH values; and y is the vector containing the BLUE data. The vectors d, aa, ad, and dd encapsulate the additive effect, dominance effect, additive-by-additive effect, additive-by-dominance effect, and dominance-by-dominance effect, respectively. Moreover, M a , M d , M a a , M a d , and M d d represent the design matrices of the corresponding genetic effects, while e signifies the residual error. The variables d, aa, ad, dd, and e are presumed to follow specific distributions: d ~ N 0 , I σ d 2 , a a ~ N 0 , I σ a a 2 , a d ~ N 0 , I σ a d 2 , d d ~ N 0 , I σ d d 2 and e ~   N 0 , I σ e 2 . The BGLR package [20] was utilized to implement a transformed version of this model [19].

2.3. Mapping of MPH

The mapping of MPH followed the model outlined in the previous work [19]:
y ^ = m a + g ^ d + g ^ a a + g ^ a d + g ^ d d + e ^ ,
where a represents the tested genetic effects, encompassing dominance and epistatic effects, while m stands for the corresponding coefficient. The random variables g ^ d ~ N 0 , K ^ d σ d 2 , g ^ a a ~ N 0 , K ^ a a σ a a 2 , g ^ a d ~ N 0 , K ^ a d σ a d 2 , g ^ d d ~ N 0 , K ^ d d σ d d 2 and e ^ ~   N 0 , I σ e 2 pertain to the genetic mapping of dominance and epistasis effects. The kinship matrices K ^ d ,     K ^ a a ,   K ^ a d ,   K ^ d d [19] are instrumental in accounting for multi-level genetic-relatedness control. For detecting significant loci-governing dominance effects, a threshold of 0.05/Ne was employed, where Ne represents the effective marker count, calculated using the simpleM package [21,22,23]. A similar threshold of 0.05/Ne × (Ne − 1)/2 was applied for identifying significant loci-controlling epistasis effects. The maize genome was partitioned into genetic blocks spanning from the start to the end of each chromosome. The block size was 5Mb in length, and was determined by dividing the maize genome size (~2.1 Gb) [24] by Ne (417). The positions of each SNP marker and their corresponding block were provided in Table S2. The mapping process excluded epistatic interactions detected within individual blocks or between adjacent blocks.
Phenotypic variances explained (PVE) by these loci for MPH were computed by regressing MPH against SNP markers through a linear model. The analysis of variance (ANOVA) method was employed to calculate both the sum of square of the regression (SSreg) and the total sum of square (SStol). PVE was then derived by dividing SSreg by SStol [25].

2.4. Retrieving Yield and Biomass Genes

The roster of maize-yield genes was compiled from our prior report [26]. The presence of these yield genes within the QTL regions controlling MPH was investigated. This compilation encompassed 29 known genes validated for controlling yield traits in maize, along with 575 additional genes identified by utilizing known yield genes from other plant species as queries for protein-to-protein blast searches against the maize B73 protein-translation database.
A parallel approach was adopted to extract maize biomass genes. Initially, 39 known genes linked to biomass were summarized (Table S3). Subsequently, 99 maize genes (Table S4) were identified by querying the protein database of maize B73 with known biomass genes from other plant species, employing specific criteria for homologous gene selection: E values < 10−10, Identity > 40, and Coverage > 60%. In cases where a gene lacked homologous counterparts in maize, the two genes with the lowest E values were designated as its homologous genes.

2.5. Colocalization of MPH Significant Loci and ASEGs

Previously identified ASEGs, exhibiting significant expression differences in F1 relative to parental lines, were determined using two hybrid and parent combinations (HPTs), including ZD958 and XY335 HPTs [11]. To identify candidate genes associated with MPH, a stepwise approach was adopted. Initially, candidate QTLs were narrowed down by selecting blocks housing SNPs accounting for >1% of phenotypic variances in both MPH and hybrid performance (termed as the SNP_1% set). Subsequently, ASEGs within a 5 Mb interval of the SNP_1% set were identified.
Fisher’s exact test was utilized to assess the enrichment of these ASEGs within the 5 Mb interval of the SNP_1% set. Supposing that the SNPs in the SNP_1% set were randomly distributed across the genome, so were the ASEGs in the surrounding regions of these SNPs. Theoretically, there should be no significant differences between the ratio calculated by dividing the count of SNPs in the SNP_1% set by the total SNPs count, and the ratio calculated by dividing the count of ASEGs in the surrounding regions of these SNPs by the total ASEGs count. By dividing the count of SNPs in the SNP_1% set by the total SNP count, an expected ratio was derived. Fisher’s exact test then gauged whether ASEGs exhibited preferential enrichment within the 5 Mb interval of the SNP_1% set by evaluating the deviation of the ratio of ASEGs within the specified interval to the overall ASEG count against the expected ratio [27]. Fisher’s exact test was performed utilizing the fisher.test function from the “stats” package.
Upon identification of candidate genes linked to MPH, their allelic expression profiles in parental lines and F1 were scrutinized, and t.test analysis was used to detect whether there are differences between parental lines or between different alleles in the hybrid lines. Furthermore, gene ontology (GO) enrichment analysis was carried out employing the enrich GO function from the R package cluster profiler [28]. Significance was attributed to enrichments characterized by an adjusted p value (P-adjust) below 0.05.

2.6. Construction of Weighted Gene Co-Expression Networks

We used the RNA-seq data from 18 samples [12] to unravel the potential co-expression networks of ASEGs, including the ZD958, XY335, and their parental lines, with each line containing three replicates. We firstly filter genes based on a fragments-per-kilo base of transcript-per-million mapped fragments (FPKM) with the criteria of median >0, and coefficient of variance <0.2, leaving 19524 genes. The standardized FPKM values were used to construct the correlation matrix using the cor function of the R package WGCN [29]. Genes with strong correlation (p < 0.001) with the target gene were used to construct the weighted gene co-expression network. The function pickSoftThreshold was used to determine the softthreshold, and the function TOMsimilarityFromExpr was used to compute the topological overlap matrix, which was used to compute the weighted-correlation matrix. A pair-wise weighted-correlation larger than 0.02 was used to construct the co-expression network. We used the Cytoscape software [30] to visualize the network.

3. Results

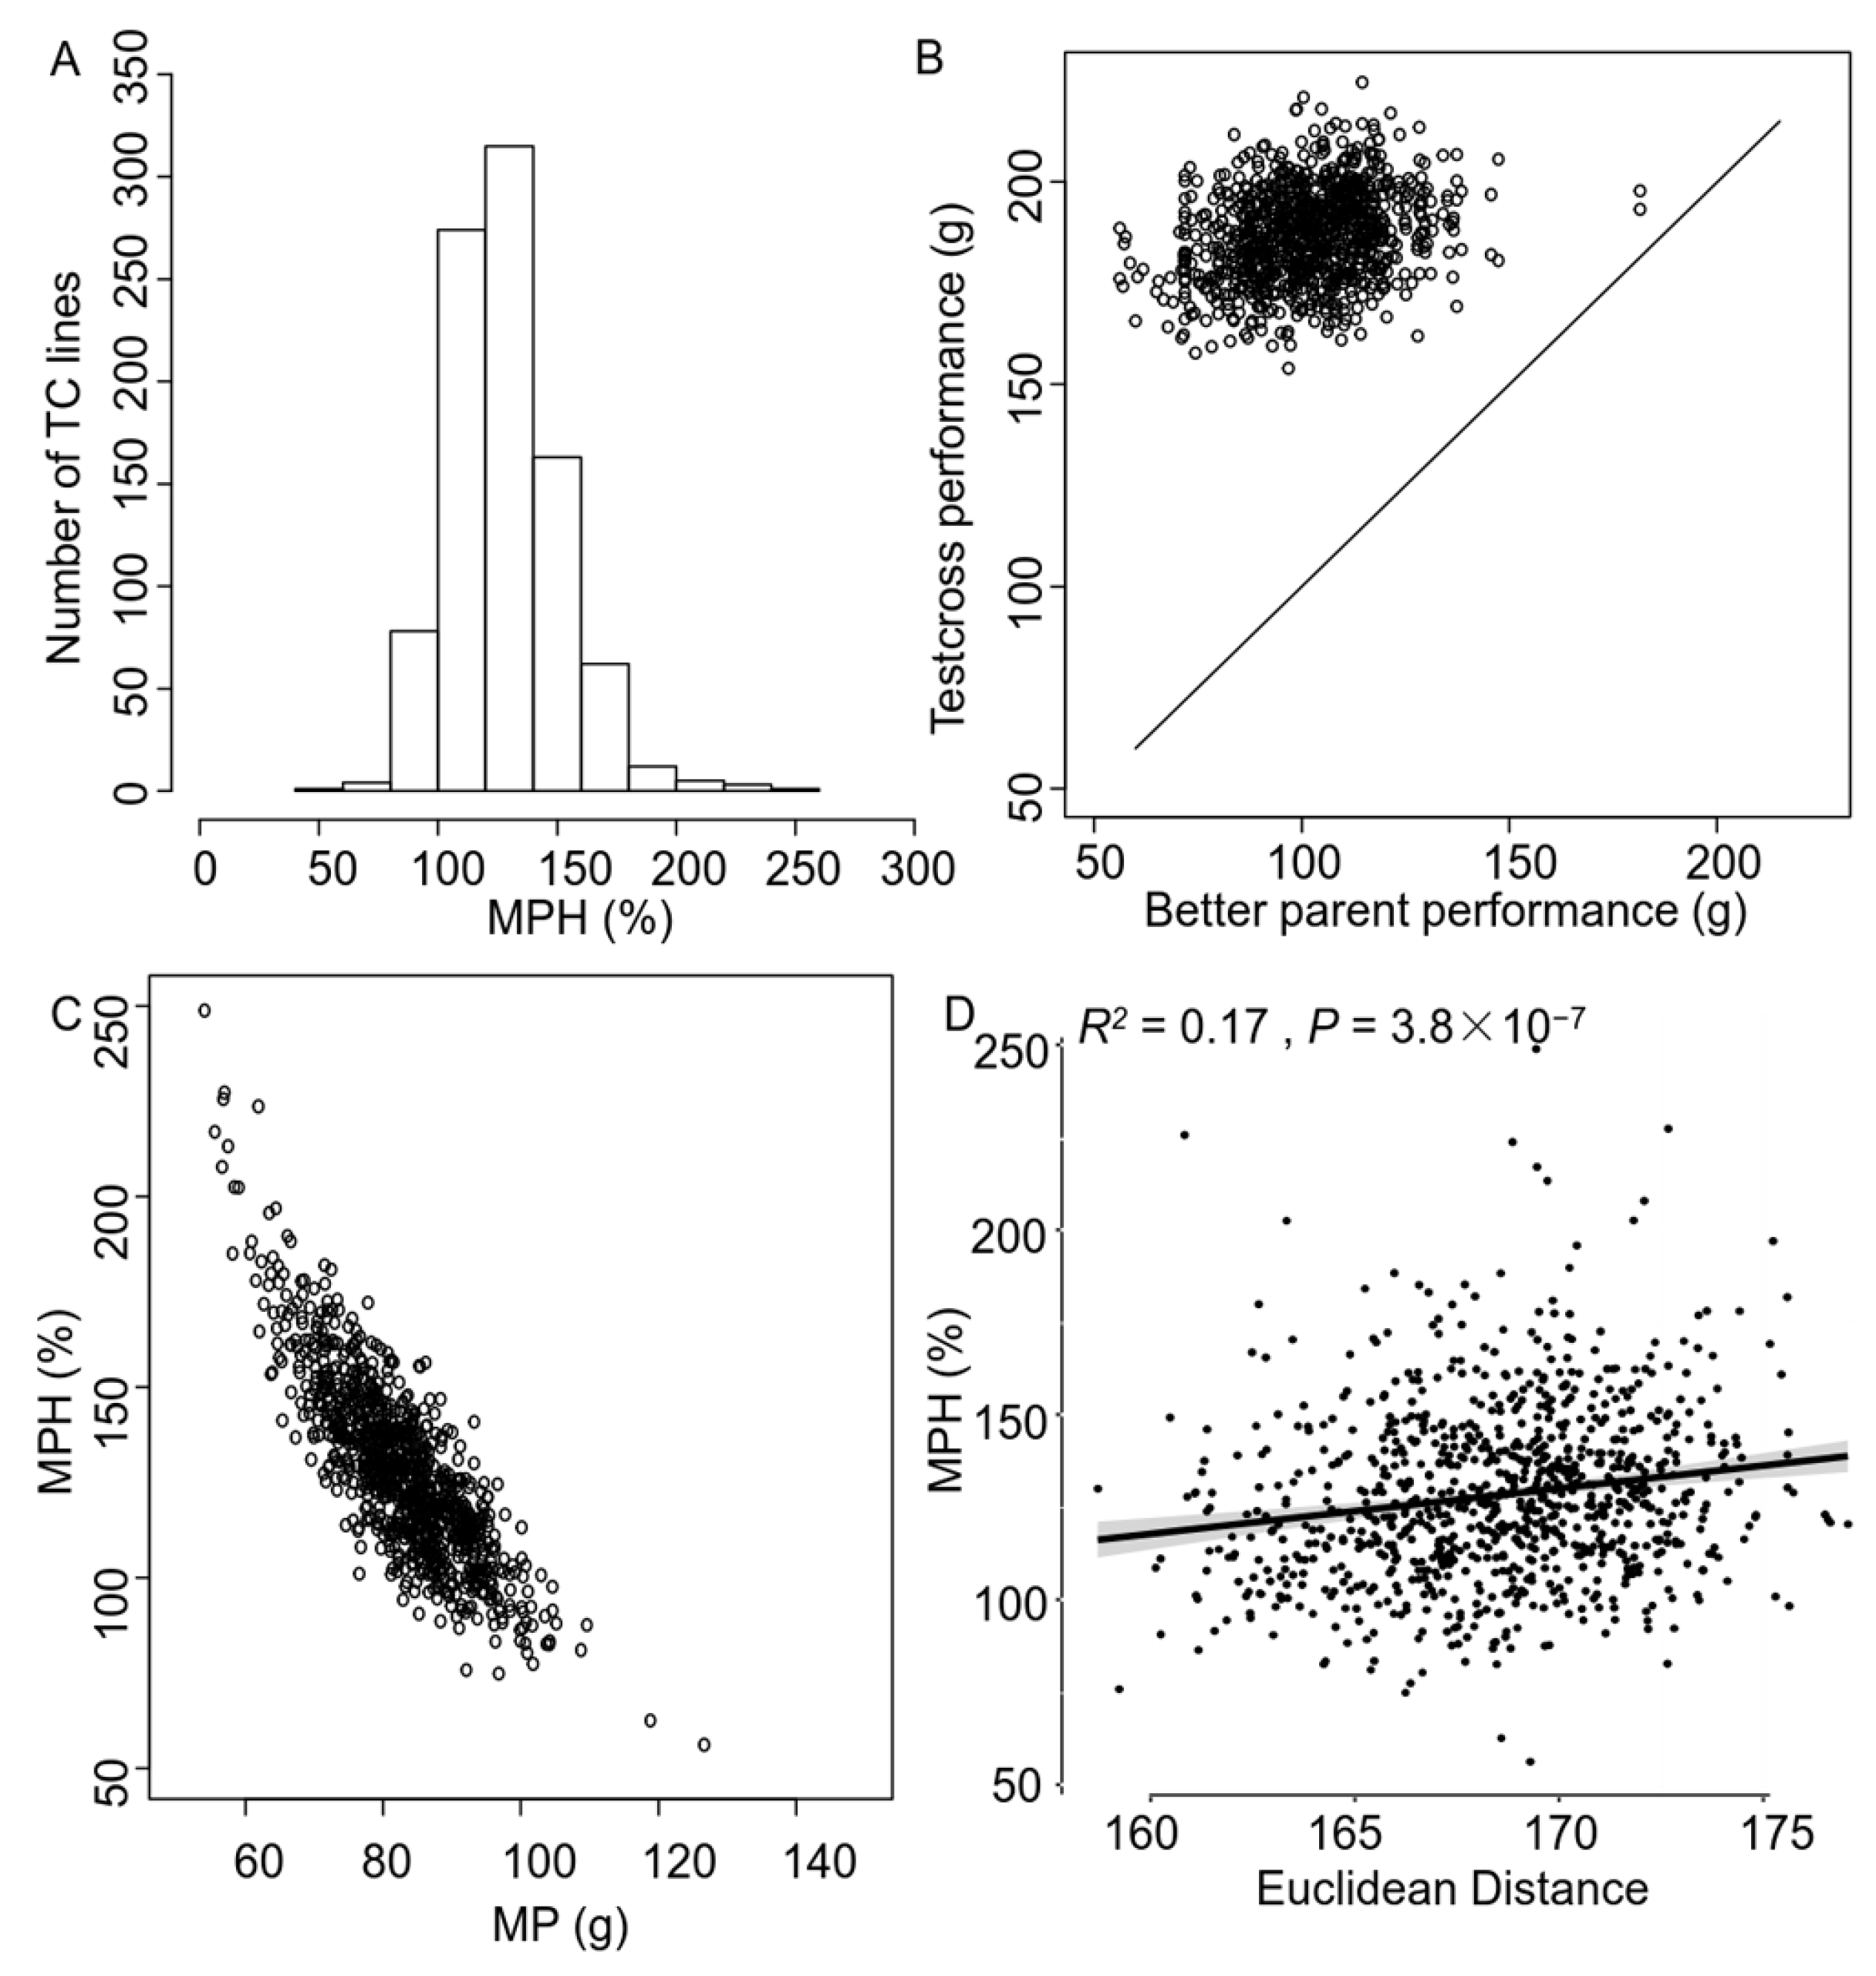
3.1. Observation of Strong Heterosis in the Testcross Population

Significant levels of heterosis were evident within the testcross population, with substantial heritability of yield recorded as 0.55 for Chang7-2 testcross population and 0.58 for PH4CV testcross population. This high heritability, combined with a heritability of 0.62 within the BC1F3:4 populations, facilitated a comprehensive exploration of the genetic foundations of heterosis. MPH exhibited a range from 0.56 to 2.49, with an average value of 1.28 (Figure 1A). Furthermore, the yield of testcross lines consistently exceeded that of better parent, highlighting the pronounced heterotic effect within the testcross populations (Figure 1B). Interestingly, we found that MPH showed a negative correlation with MP values (Figure 1C), indicating that parental lines that have good performance might not produce better F1 lines. A strong correlation emerged between genetic distance and MPH, affirming the robustness between heterosis and its genetic basis (Figure 1D).

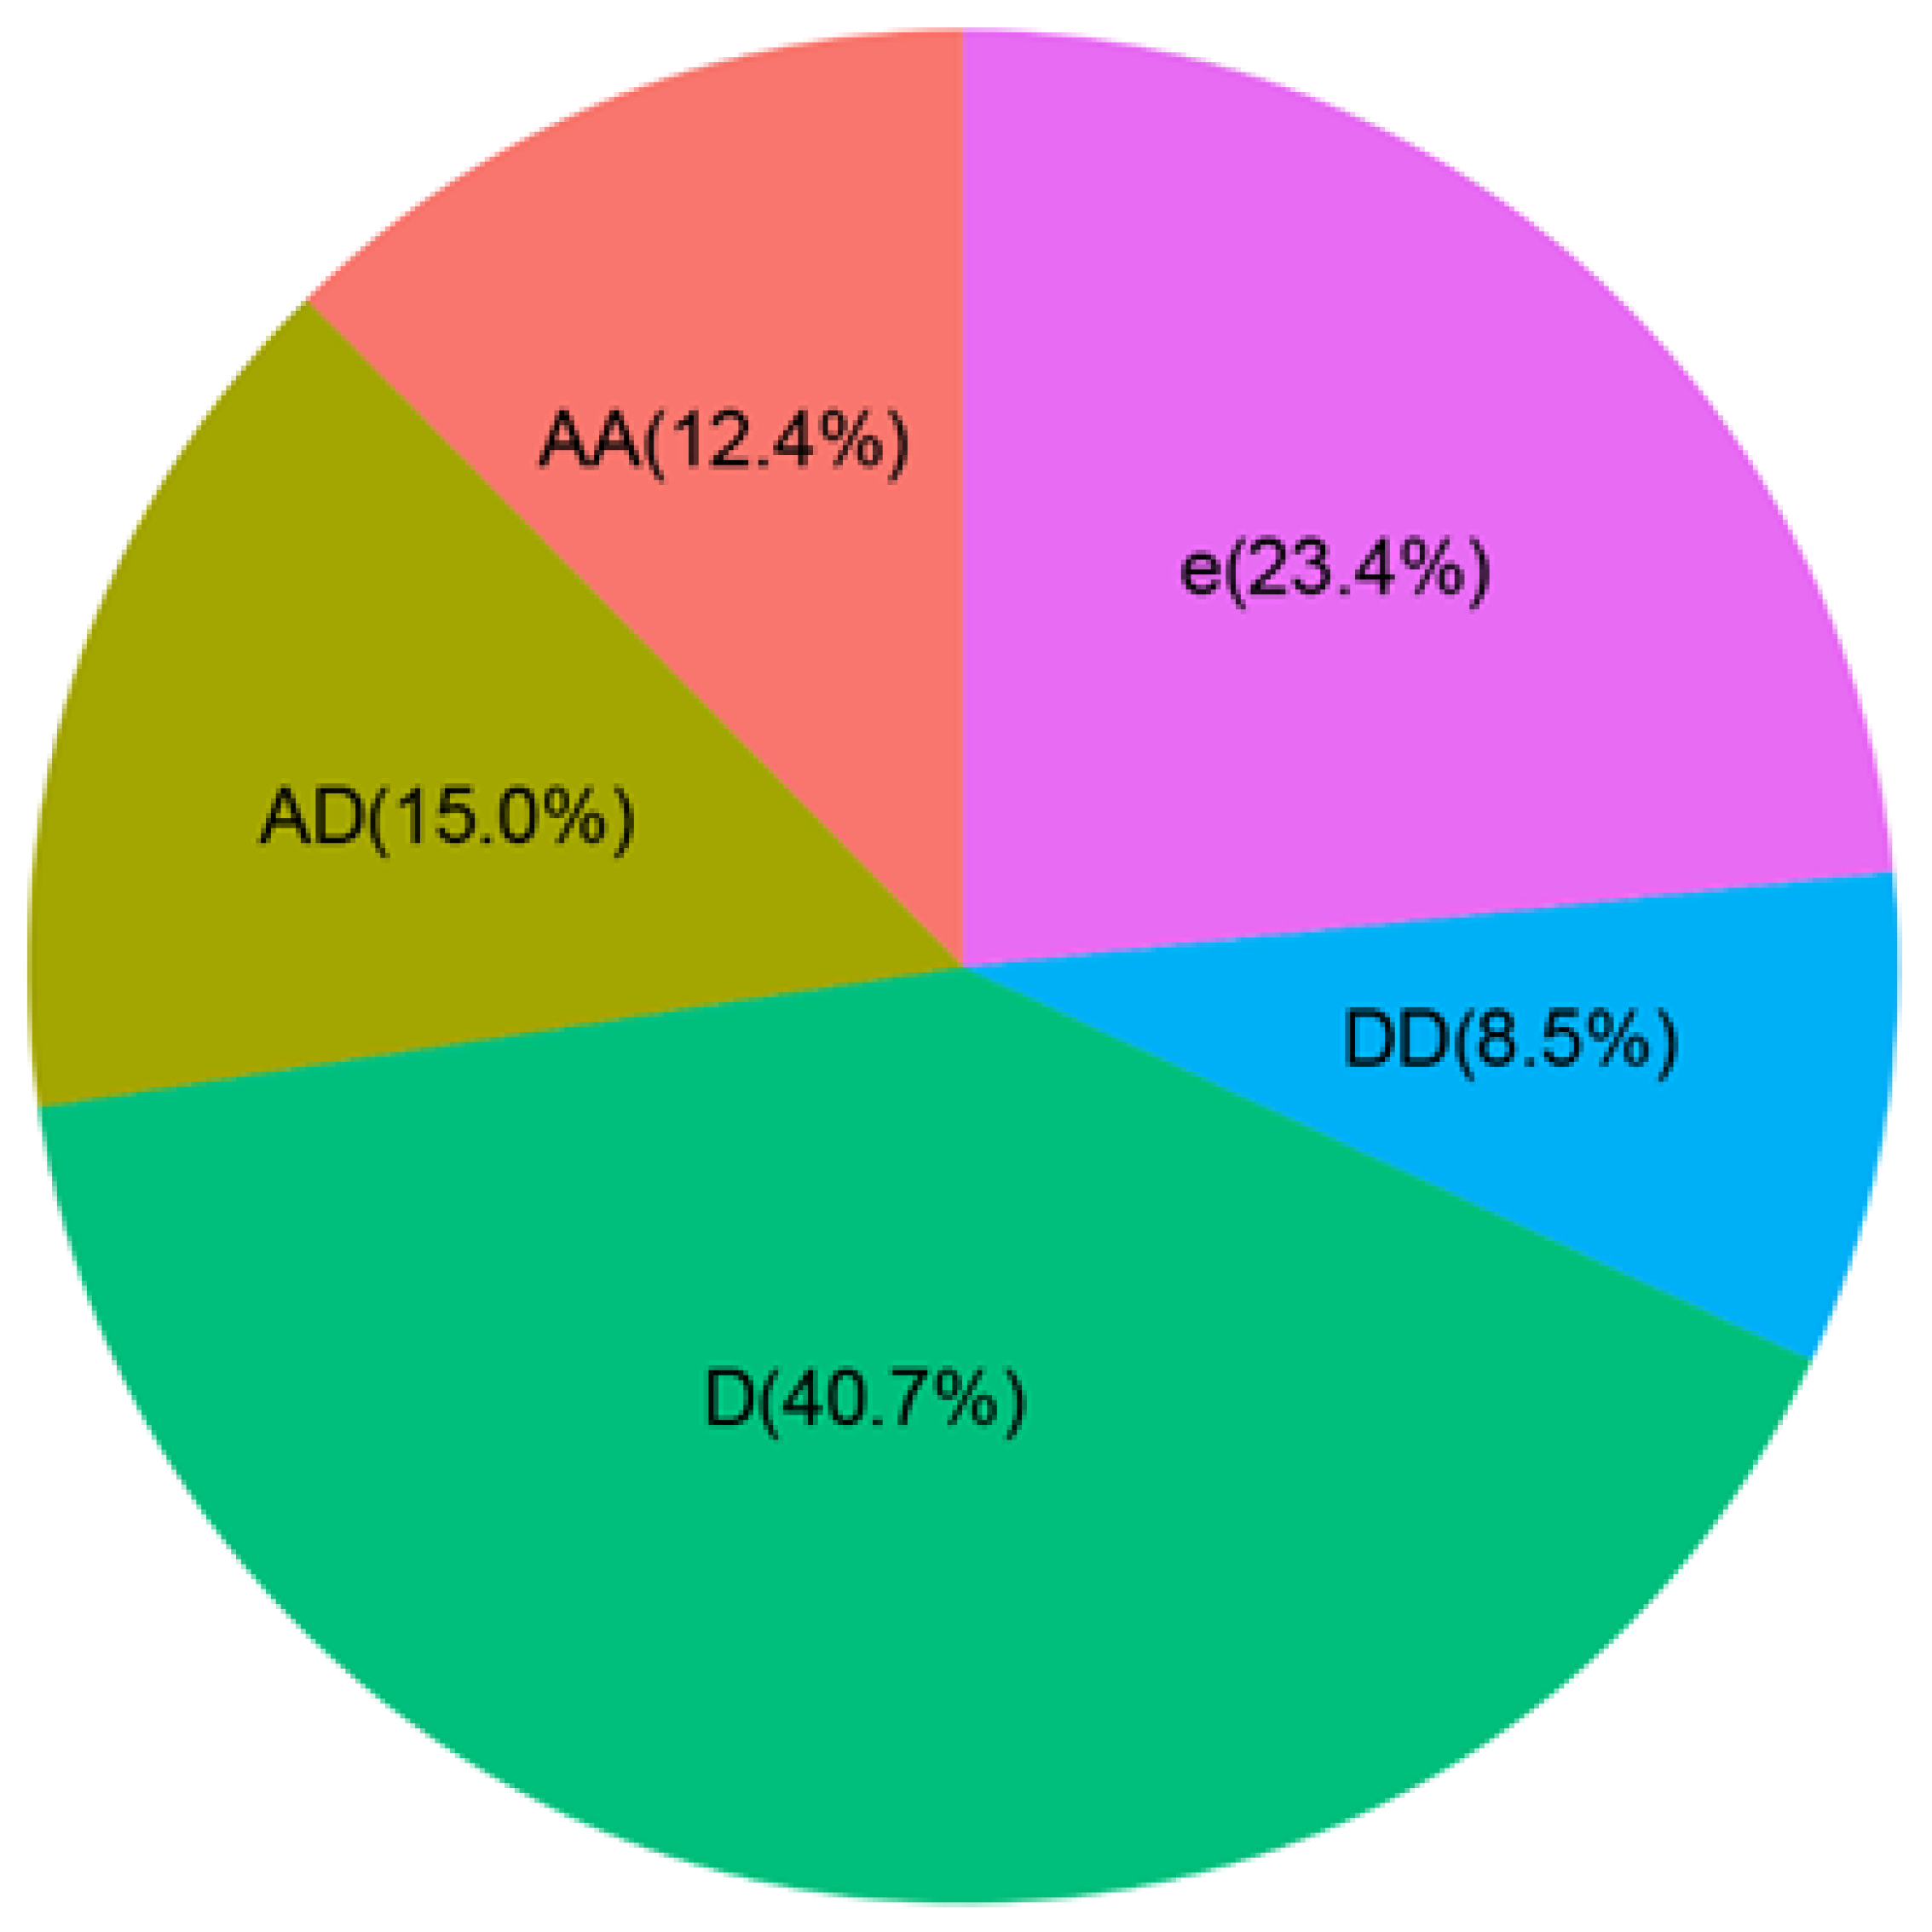
3.2. Genetic Dissection of MPH and Candidate Gene Identification

Exploring the genetic effects contributing to MPH revealed that dominance is the primary driver of yield heterosis, accounting for 40.7% of the total variance. This is followed by the additive-by-dominance effect at 15.0%, additive-by-additive effect at 12.4%, and dominance-by-dominance effect at 8.5% (Figure 2). This pattern underscores the pivotal role of genetic factors in determining the extent of heterosis. Mapping of MPH pinpointed two dominance loci on chromosomes 9 and 10 that explained less than 1% of the phenotypic variances (Figure 3A and Figure S2). Additionally, the MPH mapping unveiled 6 pairs of additive-by-additive interactions, involving 9 SNPs, 18 additive-by-dominance interactions, encompassing 32 SNPs, and 54 dominance-by-dominance interactions, involving 95 SNPs (Figure 3A). After excluding redundant SNPs, a total of 124 SNPs distributed across 104 genetic blocks were identified as being associated with MPH (Table S5). These interactions collectively contributed 4.5%, 12.0%, and 22.8% of the phenotypic variances for MPH, respectively.
A comprehensive analysis of ASEGs was conducted within the XY335 and ZD958 HPTs, yielding 3044 and 3749 ASEGs, respectively (Figure 3B,C). These ASEGs had previously been validated for their association with heterosis [11]. Notably, SNPs exhibiting higher PVE for MPH also demonstrated corresponding higher PVE for hybrid performance (Figure S2; Table S5). Among the 104 blocks containing significant SNPs for MPH (Figure S2; Table S5), 39 blocks were found to contain SNPs explaining more than 1% of the phenotypic variance for MPH (Figure 3D,E). Importantly, 24 of them encompassed SNPs that accounted for more than 1% of the phenotypic variance for both MPH and hybrid performance (Figure 3D,E). This specific set of 24 SNPs was designated as the SNP_1% set. Colocalization analysis identified 148 and 166 ASEGs from the XY335 and ZD958 HPTs, respectively, within these 24 blocks (Table S6). A union of 259 non-redundant ASEGs was identified by combining the ASEGs from both HPTs. Notably, the ASEGs were found to be significantly enriched around the SNP_1% set (Figure 4A). Subsequent GO enrichment analysis unveiled enrichment in categories such as translation elongation factor activity, hydrolase activity, nucleoside-triphosphatase activity, pyrophosphatase activity, and nuclear pore (Figure 4B; Table S5).

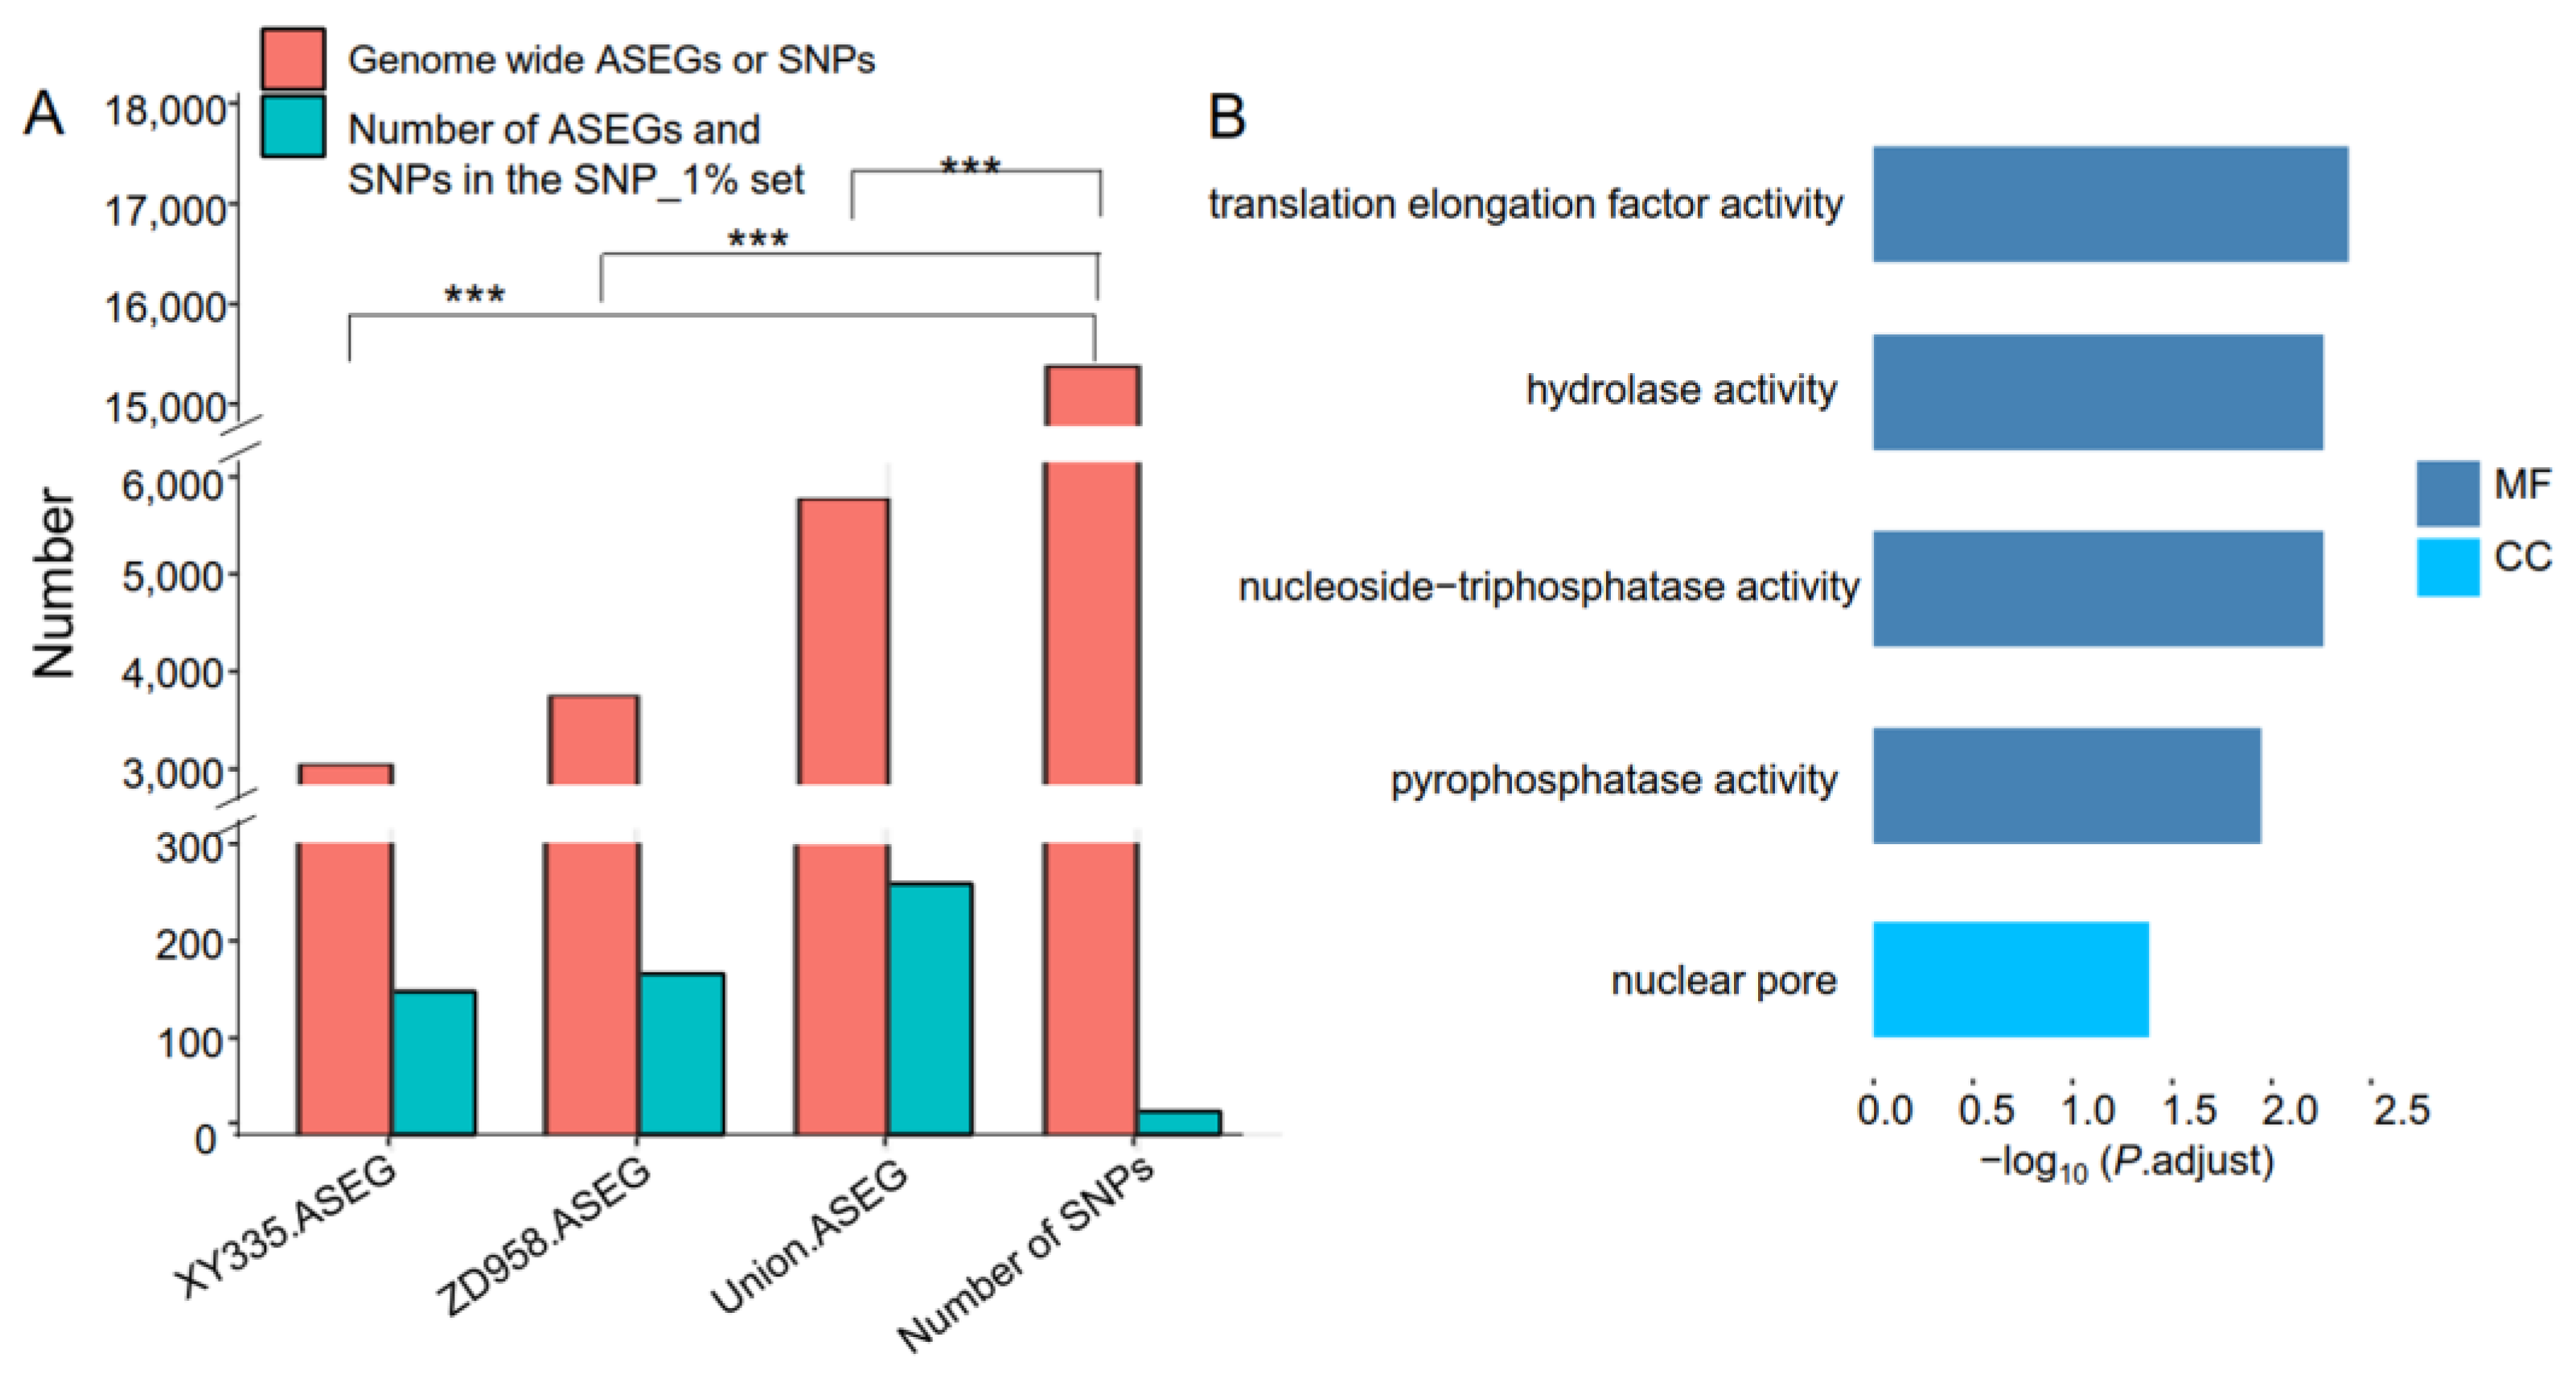
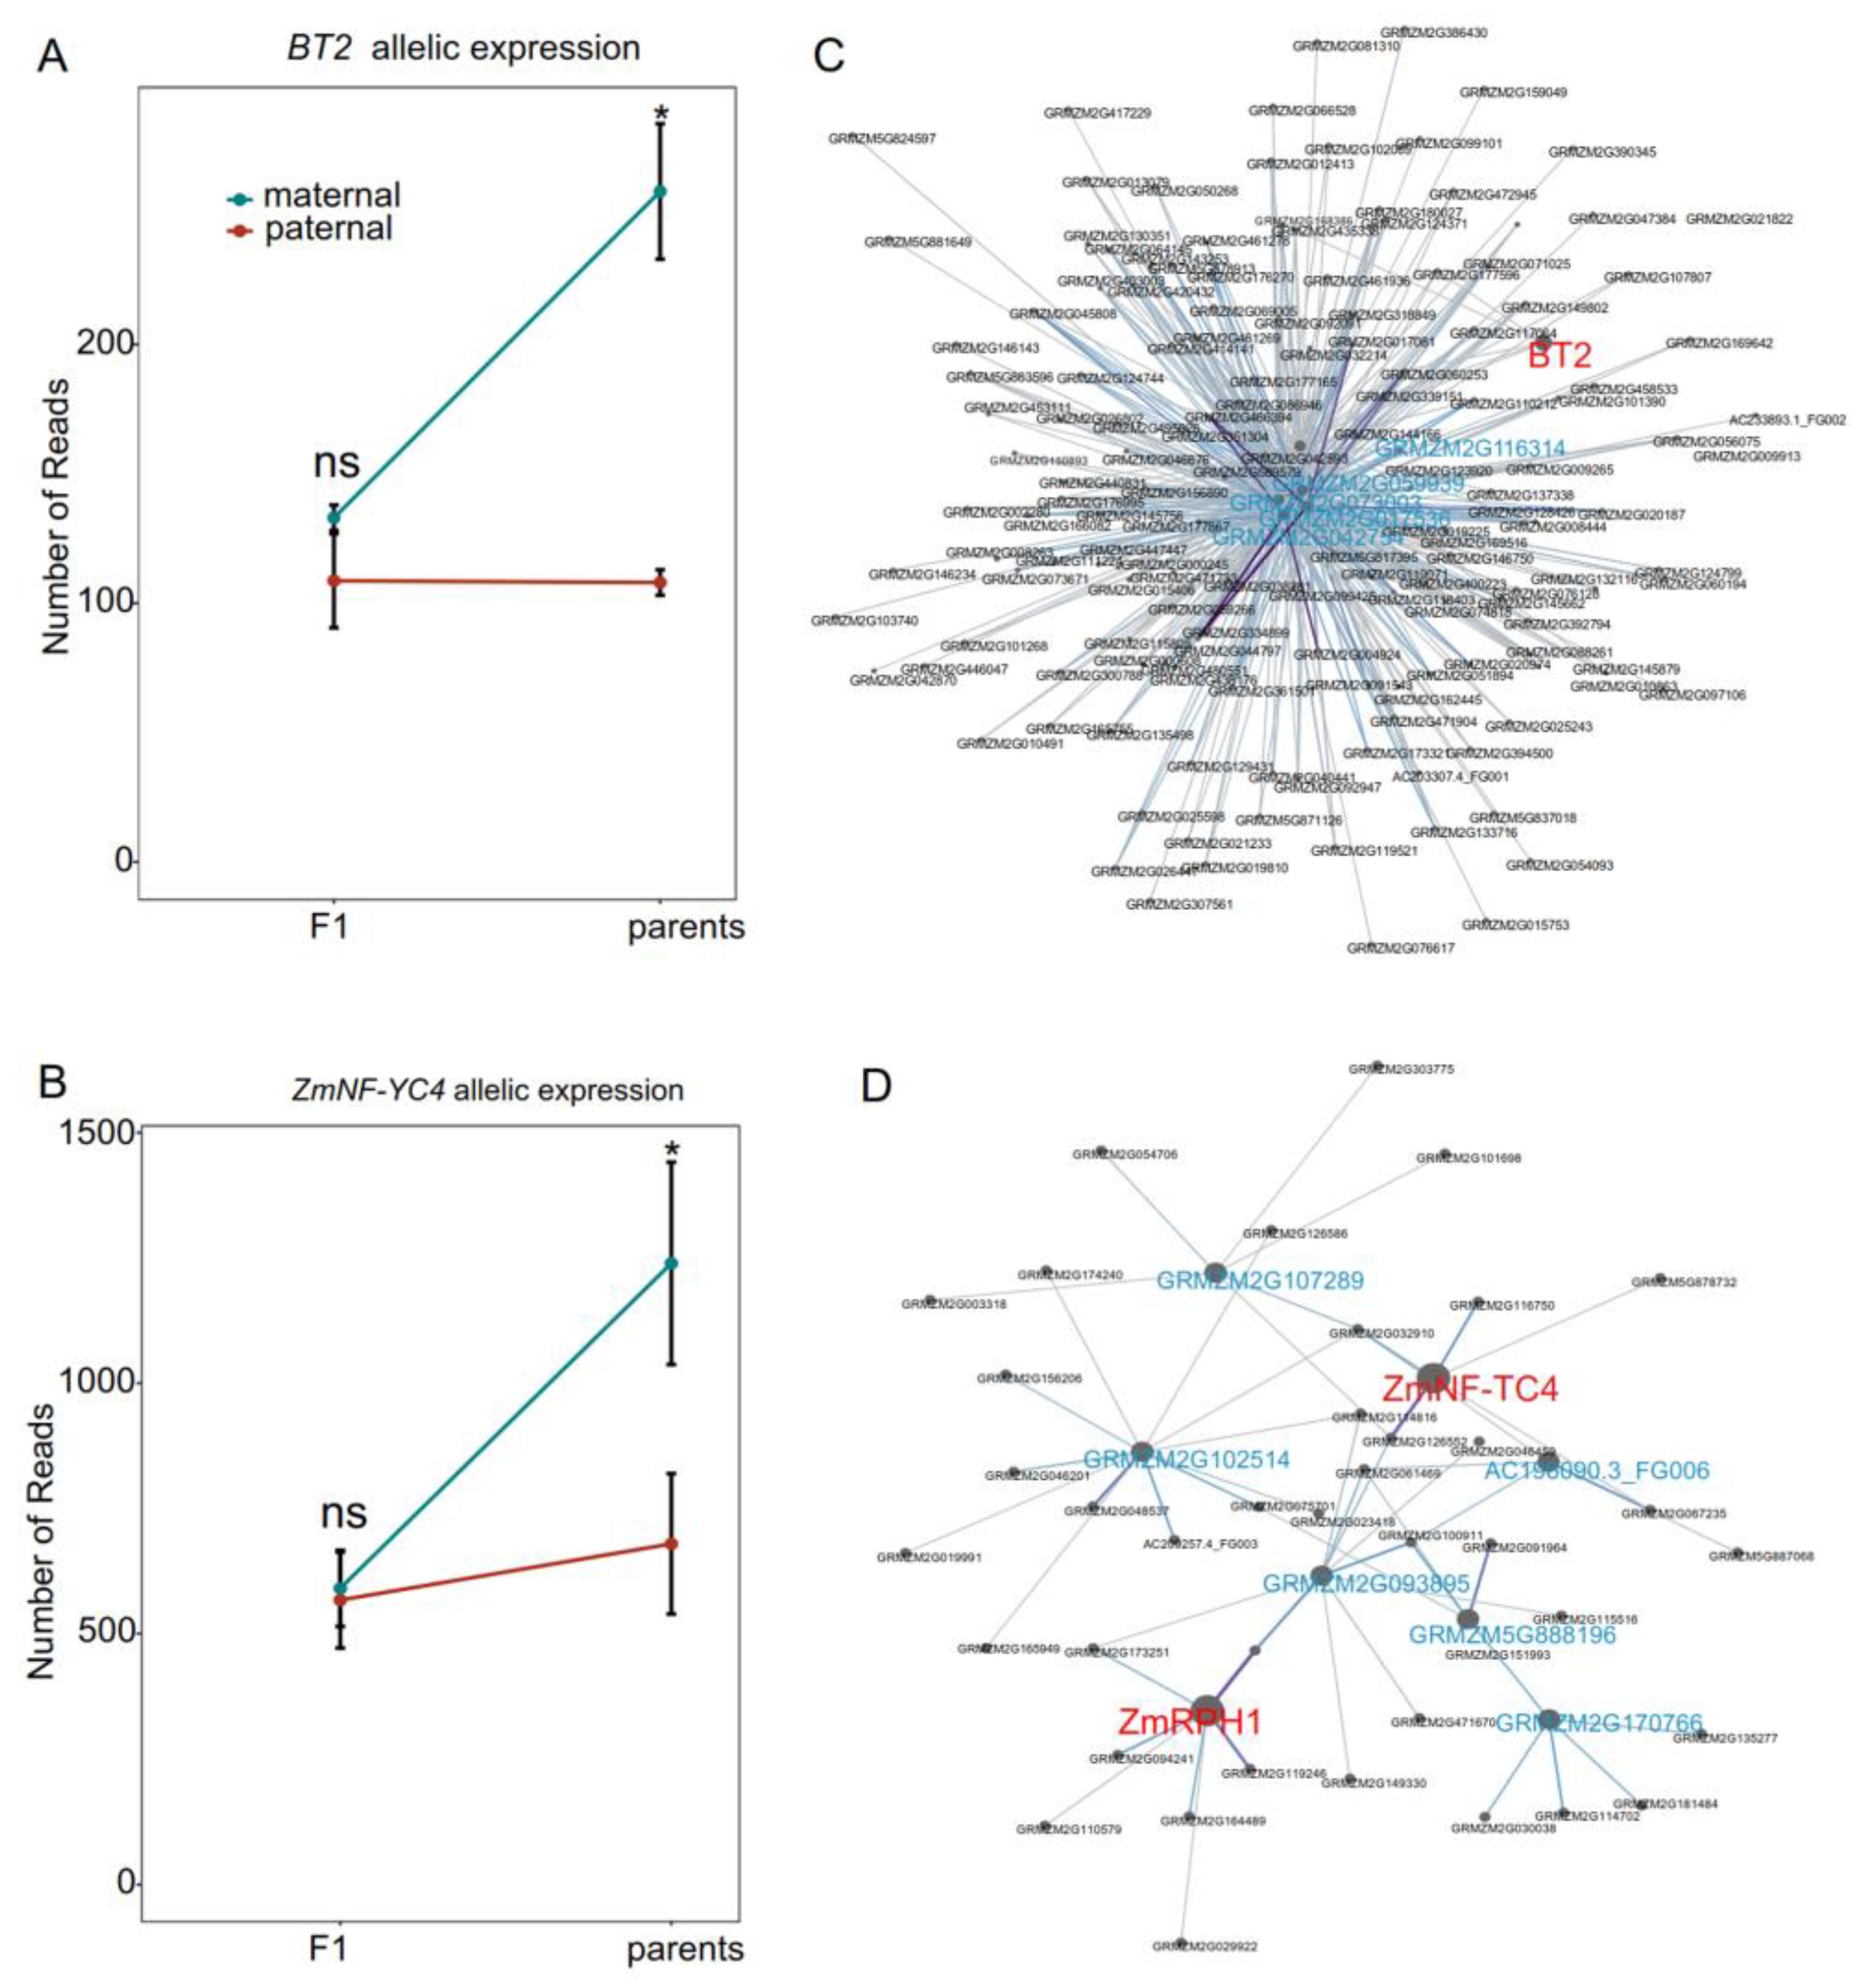
3.3. Identification of Candidate Genes and Their Co-Expression Networks Associated with MPH

Examination of ASEGs enriched around the SNP_1% set explored their relevance-to-yield and biomass control. In this context, the gene BT2 (GRMZM2G068506), implicated in starch biosynthetic processes through glucose-1-phosphate adenylyltransferase activity, exhibited ASE in the ZD958 HPT. ASE patterns revealed significant differences between parental lines for BT2 alleles, yet non-significant differences in the F1 hybrid (Figure 5A). Similarly, the gene ZmNF-YC4 (also known as GRMZM2G078691 or qPH7), previously linked to plant height and flowering time (www.maizegdb.org, access on 27 October 2023), demonstrated ASE in the ZD958 HPT. Expression patterns for ZmNF-YC4 alleles mirrored those of BT2, with distinct parental-line differences and comparable hybrid expression (Figure 5B).
Moreover, ten ASEGs homologous to known yield genes in other plants were identified (Table S7), and all ten ASEGs exhibited ASE in the XY335 HPT, with four of them also showing ASE in the ZD958 HPT. These four genes (GRMZM2G370081, GRMZM2G414043, GRMZM2G374088, and GRMZM2G016858) also displayed ASE in both HPTs (Figure 3B,C). Similarly, four ASEGs homologous to known biomass genes in other plants were identified, with three of them showing ASE in the XY335 HPT and two in the ZD958 HPT (Table S7). One gene (GRMZM2G016858) displayed ASE in both HPTs (Figure 3B,C). Notably, GRMZM2G016858 might be associated with the regulation of both yield and biomass (Table S7). Given the enrichment of ASEGs around the SNP_1% set (Figure 5A), these 15 ASEGs (Table S7) exhibiting relevance to both yield and biomass were deemed putative candidate genes for maize heterosis.
The regulatory network of six ASEGs were constructed, shedding light on potential mechanisms underlying maize heterosis. In the regulatory network of BT2, there are 111 genes (Figure 5C). Notably, the Arabidopsis or rice homologs of GRMZM2G073003, GRMZM2G116314, and GRMZM2G059939 are known to control seed weight [31,32,33], and are corresponding to the role of BT2 in the regulation of seed development in maize [34]. Additionally, two genes, GRMZM2G017536 and GRMZM2G042754, could potentially influence grain yield by controlling biomass traits, as their homologs have been associated with biomass traits (Table S4). In the co-expression network of ZmNF-YC4 (Figure 5D), there are 47 genes, including GRMZM2G114190 (ZmRPH1), which is a known genes controlling biomass. The network also includes GRMZM2G107289, GRMZM2G102514, GRMZM2G170766, and AC196090.3_FG006 whose homologs were associated with yield traits [26], as well as GRMZM2G093895 and GRMZM5G888196, whose homologs were associated with biomass traits (Table S4).
Additionally, co-expression networks were constructed for the four ASEGs showing ASE in both HPTs (Figure S2). In the co-expression network of GRMZM2G016858, we not only found urb2, controlling seed weight in maize [35], but also find fifteen other genes (Figure S3A), including 14 genes related to yield [26], and one gene related to biomass (Table S4). In the co-expression network of the yield-related gene GRMZM2G370081, one known gene smk9, associated with yield traits, was identified, along with eight other genes related to yield [26], and one gene related to biomass (Table S4; Figure S3B). In the co-expression network of the yield-related gene GRMZM2G414043, five genes related to yield were identified [26] (Figure S3C). However, no genes related to yield or biomass were found in the co-expression network of GRMZM2G374088 (Figure S3D). The genes in these expression networks, including those of the two known genes (BT2 and ZmNF-YC4) and the four genes showing ASE in both HPTs, provide insights into the potential regulatory mechanisms underlying maize heterosis.

4. Discussion

The inheritance of heterosis is a complex genetic phenomenon, with dominance effects originating from a single genetic locus and epistasis effects arising from interactions between different genetic loci [36,37]. Previous studies have yielded diverse conclusions on the mechanism of heterosis. For example, some studies found incomplete dominance of deleterious alleles explaining grain yield heterosis in elite wheat crosses [38]. Gu et al. [6] concluded that dominance-effect loci contributed a larger proportion of phenotypic variance than overdominance-effect loci. Garcia et al. [39] attributed maize-yield heterosis mainly to dominant gene action. Li et al. used a population constructed by crossing 339 recombinant inbred lines with two testers and found that dominance contributes the highest proportion to heterosis, while epistasis contributes the highest proportion to hybrid performance [37]. These differences may arise from variations in populations, species, and traits, highlighting the need for a better understanding of the genetic mechanisms underlying heterosis. In the current study, using two large testcross populations, we deciphered that dominance plays a pivotal role in maize heterosis, and epistasis also contributed a large proportion to heterosis. Our findings substantiate those of Garcia et al. [39] and Li et al. [37] and shed light on the mechanisms contributing to the remarkable yield of hybrid maize.
Conventionally, the method used mapping heterosis to encode the marker matrix to different modes (additive, dominance, and recessive modes), and run the linear model for each marker matrix separately [7]. Previously, Jiang et al. developed an integrated model fitting dominance and epistasis effects together, and applied this model for mapping heterosis based on a wheat population [19]. Here, we used this model to map maize heterosis for the first time. The model showed advantages over other models [7,17]. Firstly, this model reduced the influences of population structure and genetic relatedness by integrating the genetic relationships of each individual using the kinships calculated based on the additive- and dominance-marker matrices. Secondly, this model extensively tested the three epistasis effects (additive-by-additive, dominance-by-dominance, and additive-by-dominance) of one SNP and another, and can unravel all significant interactions present in the genome. Thirdly, because each SNP was coded both as an additive and dominance marker, the additive and dominance effects of this epistatic locus can be estimated simultaneously. Our analysis successfully mapped dominance loci and many other loci showing epistasis effects, proving the reliability of the linear model for mapping MPH in maize.
Considering the strong correlation between heterosis and hybrid performance, identifying the genetic basis of heterosis could be informative for designing better hybrid varieties. SS (the stiff stalk group), NSS (the non-stiff-stalk group), and SPT (the sipingtou group) are different heterotic groups that are classified based on genome-wide molecular markers, and each heterotic group may contain hundreds of inbred lines or genetic resources [9,16]. A hybrid variety is developed by crossing an inbred line in one heterotic group with another inbred line in another heterotic group, and there are heterotic patterns to follow when designing hybrid varieties [9,16]. We selected the parental lines of ZD958 and XY335, the most popular hybrid varieties in China, to construct the testcross population. XY335 belongs to the SS × NSS pattern, while ZD958 belongs to the SPT × SS pattern [16], and the two heterotic patterns are the main heterotic patterns in China [9,16], indicating that the parental lines of many hybrid varieties belong to the same heterotic groups as those of ZD958 or XY335. Moreover, inbred lines belong to the three heterotic groups and are parental lines (one or both lines) of many other current hybrid varieties, indicating many current varieties have a close relationship with ZD958 or XY335 [40,41,42]. Correspondingly, the genetic basis of heterosis and hybrid performance of the two hybrid varieties used in this study may overlap with those of some maize-hybrid varieties. Therefore, the genetic and molecular basis unraveled in this study would not only help us understand why the current maize-hybrid varieties have superior hybrid performance, but also be useful for the breeding of better maize-hybrid varieties in the future.
To mitigate potential false-positive QTL for MPH and uncover QTL governing both heterosis and hybrid performance, we focused on SNPs explaining >1% of phenotypic variance for both MPH and hybrid performance. Notably, the QTL have large effect on MPH may also have a large effect on hybrid performance (Figure S2), reflecting the strong correlation between hybrid performance and heterosis [37]. Our results are consistent with findings reported by Li et al. [37] and Wang et al. [43], which also found substantial overlap between the genetic basis of hybrid performance and heterosis. The strong correlation between PVEs of hybrid performance and heterosis (Figure S2) also supported the reliability of the identified QTL for MPH, and give us the confidence to find candidate genes in these QTL regions. Given ASEGs’ associations with heterosis [11,12,13], we identified ASEGs around the SNP_1% set to identify candidate genes underlying heterosis. Notably, these ASEGs exhibited significant enrichment around the SNP_1% set, suggesting a non-random relationship between ASEGs and the QTL associated with heterosis. This enrichment analysis bolsters the reliability of MPH mapping results and implies the involvement of certain ASEGs in heterosis regulation. Through co-localizing these ASEGs with QTLs for MPH, this study not only provided candidate genes for maize heterosis, but also provided clues on the genetic effects of these ASEGs on maize heterosis, which is how these ASEGs works to determine maize heterosis and hybrid performance (Table S5). Such knowledge is key to our understanding of the genetic mechanism of heterotic genes.
Examining the alterations in ASEG expression within F1 lines presents an intriguing avenue for exploration. Multiple scenarios may arise: (1) alleles showing negligible differences between parental expression, and manifesting significant differences between allelic expressions in F1; (2) alleles displaying significant differences between parental expression, but exhibiting negligible differences between allelic expressions in F1; (3) alleles with significant differences between parental expression, maintaining a comparable level in F1; (4) the expressions may show great but statistically non-significant differences between the two alleles of the parental lines, and between those of the two alleles in F1. Maize-yield heterosis is associated with biomass, and ear and kernel development [44,45]. By comparing the literature-derived yield and biomass-related genes with ASEGs around the SNP_1% set, eleven yield-related and five biomass-related genes were identified, including one gene associated with both yield and biomass (Table S7), one known gene associated with yield (BT2), and one known gene associated with biomass (ZmNF-YC4). Particularly intriguing are the four genes demonstrating ASE in both ZD958 and XY335 HPTs, indicating a higher likelihood of heterosis association. Most of these ASEGs showed expression differences in parental lines, and non-significant difference in F1 (Figure 5 and Figure S3), indicating that there might be neutralizing trends in gene expression in F1 lines. Notably, our study unveiled higher BT2 allelic expression differences in parental lines than in F1, possibly indicating repression of a potentially unfavorable allele within ZD958. Similarly, ZmNF-YC4 expression, associated with advantageous growth under both normal and drought stress conditions (www.maizegdb.org, access on 27 October 2023), exhibited repression of the maternal allele in ZD958. Given that SNPs proximal to both BT2 and ZmNF-YC4 interact dominantly with other loci (Table S5), potential allele interactions warrant further investigation.
Like other complex traits, the regulatory network of heterosis could involve many genes that have direct and indirect effects on trait performance [3,46]. To further understand the regulatory mechanism of heterosis, we constructed the co-expression network of six ASEGs that were candidate genes for heterosis, including ZmNF-YC4, BT2, and the four genes showing ASE in both HPTs (Figure 5 and Figure S3). As expected, we found many genes that are related to the control of yield or biomass in the co-expression networks of the five ASEGs. Especially, three genes (ZmRPH1, smk9, and urb2) have been verified to be associated with maize biomass or yield traits [35,47,48], and the seven and five promising candidate genes, respectively, in the co-expression network of ZmNF-YC4 and BT2 (Figure 5), provide clues on how these genes work together to control heterosis. Interestingly, most of the candidate genes in these regulatory networks were related to the control of yield traits, further supporting the relationship between these genes and yield heterosis. This study provides insights into the genetic mechanisms driving heterosis and hybrid performance, unraveling the implication of a regulatory mechanism of maize-yield heterosis present in maize hybrid varieties.

5. Conclusions

The study combines genetic and phenotypic data from testcross lines and their parental lines to investigate the genetic basis of yield heterosis in maize. The findings highlighted the predominant role of dominance in yield heterosis. Through the analysis, 104 genetic blocks associated with yield heterosis were identified, with 24 of them significantly contributing to both yield heterosis and hybrid performance. Colocalization analysis led to the identification of 259 ASEGs enriched within these 24 blocks, and 15 of these ASEGs were associated with yield or biomass. Notably, the allelic expression patterns of BT2 and ZmNF-YC4 exhibited significant differences between parental lines but negligible differences in the F1 lines. Additionally, the studied construction co-expression networks for six ASEGs, shed light on potential regulatory networks associated with maize heterosis.

Supplementary Materials

The following supporting information can be downloaded at https://www.mdpi.com/article/10.3390/agronomy13112722/s1: Table S1 Analysis of variance; Table S2 The positions of 15386 molecular markers and the corresponding 5-Mb blocks containing these markers; Table S3 Functional genes controlling maize biomass; Table S4 Genes controlling biomass traits in other plant species and their homologous genes in maize; Table S5 SNPs that are associated with MPH; Table S6 ASEGs within 5Mb regions of the SNP_1% set; Table S7 ASEGs that are related to yield and biomass in plants; Figure S1 The workflow for population development; Figure S2 The relationship between the PVEs for MPH and hybrid performance of the 124 MPH associated SNPs. Note: The SNPs and their genetic effects are provided in Table S5; Figure S3 The expressions of two alleles of each of the four genes showing ASE in both ZD958 and XY335 HPTs; Figure S4 Weighted co-expression networks of four genes showing ASE in both ZD958 and XY335 HPTs. Note: Genes in red are known genes associated with yield traits, and genes in blue are potential genes associated with yield and biomass traits. With the increase in weighted correlation between gene pairs, the width of edges become thicker, and the colors of edges changed from light grey to dark purple.

Author Contributions

Conceptualization, W.D.; methodology, Y.M. and H.Z.; resources, Y.M. and W.D.; investigation, Y.M., W.Y., P.W. and Q.L.; writing—original draft preparation, Y.M.; writing—review and editing, H.Z. and W.D.; funding acquisition, H.Z. and W.D. All authors have read and agreed to the published version of the manuscript.

Funding

This research was funded by the Central Government Guidance Funds for Local Science and Technology Development–Basic Research of Free Exploration (2023JH6/100100015), the Shenyang Science and Technology Plan of Seed Industry Innovation Project (22-318-2-04), and the Chinese Academy of Agricultural Sciences (CAAS) Innovation Project.

Data Availability Statement

All data are provided as Supplementary Materials or available as public data.

Conflicts of Interest

The authors declare that there are no conflict of interest.

References

  1. Chen, F.C.; Li, W.H. Genomic divergences between humans and other hominoids and the effective population size of the common ancestor of humans and chimpanzees. J. Hum. Genet. 2001, 68, 444–456. [Google Scholar] [CrossRef]
  2. Riedelsheimer, C.; Czedik-Eysenberg, A.; Grieder, C.; Lisec, J.; Technow, F.; Sulpice, R.; Altmann, T.; Stitt, M.; Willmitzer, L.; Melchinger, A.E. Genomic and metabolic prediction of complex heterotic traits in hybrid maize. Nat. Genet. 2012, 44, 217–220. [Google Scholar] [CrossRef]
  3. Wu, X.; Liu, Y.; Zhang, Y.; Gu, R. Advances in research on the mechanism of heterosis in plants. Front. Plant Sci. 2021, 12, 745726. [Google Scholar] [CrossRef] [PubMed]
  4. Das, A.K.; Choudhary, M.K.; Kumar, P.; Karjagi, C.G.; Kr, Y.; Kumar, R.; Singh, A.; Kumar, S.; Rakshit, S. Heterosis in genomic era: Advances in the molecular understanding and techniques for rapid exploitation. CRC Crit. Rev. Plant Sci. 2021, 40, 218–242. [Google Scholar] [CrossRef]
  5. Schnable, P.S.; Springer, N.M. Progress toward understanding heterosis in crop plants. Annu. Rev. Plant Biol. 2013, 64, 71–88. [Google Scholar] [CrossRef] [PubMed]
  6. Gu, Z.; Gong, J.; Zhu, Z.; Li, Z.; Feng, Q.; Wang, C.; Zhao, Y.; Zhan, Q.; Zhou, C.; Wang, A.; et al. Structure and function of rice hybrid genomes reveal genetic basis and optimal performance of heterosis. Nat. Genet. 2023, 55, 1745–1756. [Google Scholar] [CrossRef] [PubMed]
  7. Huang, X.; Yang, S.; Gong, J.; Zhao, Y.; Feng, Q.; Gong, H.; Li, W.; Zhan, Q.; Cheng, B.; Xia, J.; et al. Genomic analysis of hybrid rice varieties reveals numerous superior alleles that contribute to heterosis. Nat. Commun. 2015, 6, 6258. [Google Scholar] [CrossRef] [PubMed]
  8. Xiao, Y.; Jiang, S.; Cheng, Q.; Wang, X.; Yan, J.; Zhang, R.; Qiao, F.; Ma, C.; Luo, J.; Li, W.; et al. The genetic mechanism of heterosis utilization in maize improvement. Genome Biol. 2021, 22, 148. [Google Scholar] [CrossRef]
  9. Li, C.; Guan, H.; Jing, X.; Li, Y.; Wang, B.; Li, Y.; Liu, X.; Zhang, D.; Liu, C.; Xie, X.; et al. Genomic insights into historical improvement of heterotic groups during modern hybrid maize breeding. Nat. Plants 2022, 8, 750–763. [Google Scholar] [CrossRef]
  10. Shao, L.; Xing, F.; Xu, C.; Zhang, Q.; Che, J.; Wang, X.; Son, G.J.; Li, X.; Xiao, J.; Chen, L.L.; et al. Patterns of genome-wide allele-specific expression in hybrid rice and the implications on the genetic basis of heterosis. Proc. Natl. Acad. Sci. USA 2019, 116, 5653–5658. [Google Scholar] [CrossRef]
  11. Zhou, T.; Afzal, R.; Haroon, M.; Ma, Y.; Zhang, H.; Li, L. Dominant complementation of biological pathways in maize hybrid lines is associated with heterosis. Planta 2022, 256, 111. [Google Scholar] [CrossRef]
  12. Wang, P.; Gu, M.; Yu, X.; Shao, S.; Du, J.; Wang, Y.; Wang, F.; Chen, S.; Liao, Z.; Ye, N.; et al. Allele-specific expression and chromatin accessibility contribute to heterosis in tea plants (Camellia sinensis). Plant J. 2022, 112, 1194–1211. [Google Scholar] [CrossRef]
  13. Li, D.; Lu, X.; Zhu, Y.; Pan, J.; Zhou, S.; Zhang, X.; Zhu, G.; Shang, Y.; Huang, S.; Zhang, C. The multi-omics basis of potato heterosis. J. Integr. Plant Biol. 2022, 64, 671–687. [Google Scholar] [CrossRef]
  14. Shi, X.; Li, W.; Guo, Z.; Wu, M.; Zhang, X.; Yuan, L.; Qiu, X.; Xing, Y.; Sun, X.; Xie, H.; et al. Comparative transcriptomic analysis of maize ear heterosis during the inflorescence meristem differentiation stage. BMC Plant Biol. 2022, 22, 348. [Google Scholar] [CrossRef]
  15. Ma, J.; Zhang, D.; Cao, Y.; Wang, L.; Li, J.; Lübberstedt, T.; Wang, T.; Li, Y.; Li, H. Heterosis-related genes under different planting densities in maize. J. Exp. Bot. 2018, 69, 5077–5087. [Google Scholar] [CrossRef] [PubMed]
  16. Sang, Z.; Zhang, Z.; Yang, Y.; Li, Z.; Liu, X.; Xu, Y.; Li, W. Heterosis and heterotic patterns of maize germplasm revealed by a multiple-hybrid population under well-watered and drought-stressed conditions. J. Integr. Agric. 2022, 21, 2477–2491. [Google Scholar] [CrossRef]
  17. Ma, Y.; Li, D.; Xu, Z.; Gu, R.; Wang, P.; Fu, J.; Wang, J.; Du, W.; Zhang, H. Dissection of the genetic basis of yield traits in line per se and testcross populations and identification of candidate genes for hybrid performance in maize. Int. J. Mol. Sci. 2022, 23, 5074. [Google Scholar] [CrossRef]
  18. Bates, D.; Mächler, M.; Bolker, B.; Walker, S. Fitting linear mixed-effects models using lme4. J. Stat. Softw. 2015, 67, 1–48. [Google Scholar] [CrossRef]
  19. Jiang, Y.; Schmidt, R.H.; Zhao, Y.; Reif, J.C. A quantitative genetic framework highlights the role of epistatic effects for grain-yield heterosis in bread wheat. Nat. Genet. 2017, 49, 1741–1746. [Google Scholar] [CrossRef] [PubMed]
  20. Pérez, P.; de los Campos, G. Genome-Wide regression and prediction with the BGLR statistical package. Genetics. 2014, 198, 483–495. [Google Scholar] [CrossRef]
  21. Gao, X. Multiple testing corrections for imputed SNPs. Genet. Epidemiol. 2011, 35, 154–158. [Google Scholar] [CrossRef]
  22. Gao, X.; Becker, L.C.; Becker, D.M.; Starmer, J.D.; Province, M.A. Avoiding the high bonferroni penalty in genome-wide association studies. Genet. Epidemiol. 2010, 34, 100–105. [Google Scholar] [CrossRef]
  23. Gao, X.; Starmer, J.; Martin, E.R. A multiple testing correction method for genetic association studies using correlated single nucleotide polymorphisms. Genet. Epidemiol. 2008, 32, 361–369. [Google Scholar] [CrossRef] [PubMed]
  24. Jiao, Y.; Peluso, P.; Shi, J.; Liang, T.; Stitzer, M.C.; Wang, B.; Campbell, M.S.; Stein, J.C.; Wei, X.; Chin, C.S.; et al. Improved maize reference genome with single-molecule technologies. Nature 2017, 546, 524–527. [Google Scholar] [CrossRef]
  25. Zhao, K.; Tung, C.W.; Eizenga, G.C.; Wright, M.H.; Ali, M.L.; Price, A.H.; Norton, G.J.; Islam, M.R.; Reynolds, A.; Mezey, J.; et al. Genome-wide association mapping reveals a rich genetic architecture of complex traits in Oryza sativa. Nat. Commun. 2011, 2, 467. [Google Scholar] [CrossRef] [PubMed]
  26. Zhang, H.; Lu, Y.; Ma, Y.; Fu, J.; Wang, G. Genetic and molecular control of grain yield in maize. Mol. Breed. 2021, 41, 18. [Google Scholar] [CrossRef] [PubMed]
  27. Lewin, A.; Grieve, I.C. Grouping gene ontology terms to improve the assessment of gene set enrichment in microarray data. BMC Bioinform. 2006, 7, 426. [Google Scholar] [CrossRef] [PubMed]
  28. Wu, T.; Hu, E.; Xu, S.; Chen, M.; Guo, P.; Dai, Z.; Feng, T.; Zhou, L.; Tang, W.; Zhan, L.; et al. clusterProfiler 4.0: A universal enrichment tool for interpreting omics data. Innovation 2021, 2, 100141. [Google Scholar]
  29. Langfelder, P.; Horvath, S. WGCNA: An R package for weighted correlation network analysis. BMC Bioinform. 2008, 9, 559. [Google Scholar] [CrossRef]
  30. Shannon, P.; Markiel, A.; Ozier, O.; Baliga, N.S.; Wang, J.T.; Ramage, D.; Amin, N.; Schwikowski, B.; Ideker, T. Cytoscape: A software environment for integrated models of biomolecular interaction networks. Genome Res. 2003, 13, 2498–2504. [Google Scholar] [CrossRef]
  31. Ren, D.; Wang, X.; Yang, M.; Yang, L.; He, G.; Deng, X.W. A new regulator of seed size control in Arabidopsis identified by a genome-wide association study. New Phytol. 2019, 222, 895–906. [Google Scholar] [CrossRef] [PubMed]
  32. Shi, C.; Ren, Y.; Liu, L.; Wang, F.; Zhang, H.; Tian, P.; Pan, T.; Wang, Y.; Jing, R.; Liu, T.; et al. Ubiquitin specific protease 15 has an important role in regulating grain width and size in rice. Plant Physiol. 2019, 180, 381–391. [Google Scholar] [CrossRef] [PubMed]
  33. Zhang, Y.; Du, L.; Xu, R.; Cui, R.; Hao, J.; Sun, C.; Li, Y. Transcription factors SOD7/NGAL2 and DPA4/NGAL3 act redundantly to regulate seed size by directly repressing KLU expression in Arabidopsis thaliana. Plant Cell. 2015, 27, 620–632. [Google Scholar] [CrossRef] [PubMed]
  34. Wang, Y.; Shi, D.; Zhu, H.; Yin, H.; Wang, G.; Yang, A.; Song, Z.; Jing, Q.; Shuai, B.; Xu, N.; et al. Revisiting maize brittle endosperm-2 reveals new insights in BETL development and starchy endosperm filling. Plant Sci. 2023, 332, 111727. [Google Scholar] [CrossRef]
  35. Wang, H.; Wang, K.; Du, Q.; Wang, Y.; Fu, Z.; Guo, Z.; Kang, D.; Li, W.X.; Tang, J. Maize Urb2 protein is required for kernel development and vegetative growth by affecting pre-ribosomal RNA processing. New Phytol. 2018, 218, 1233–1246. [Google Scholar] [CrossRef]
  36. Liu, J.; Li, M.; Zhang, Q.; Wei, X.; Huang, X. Exploring the molecular basis of heterosis for plant breeding. J. Integr. Plant Biol. 2020, 62, 287–298. [Google Scholar] [CrossRef]
  37. Li, D.; Zhou, Z.; Lu, X.; Jiang, Y.; Li, G.; Li, J.; Wang, H.; Chen, S.; Li, X.; Würschum, T.; et al. Genetic dissection of hybrid performance and heterosis for yield-related traits in maize. Front. Plant Sci. 2021, 12, 774478. [Google Scholar] [CrossRef]
  38. Gogna, A.; Zhang, J.; Jiang, Y.; Schulthess, A.W.; Zhao, Y.; Reif, J.C. Filtering for SNPs with high selective constraint augments mid-parent heterosis predictions in wheat (Triticum aestivum L.). Crop. J. 2023, 11, 166–176. [Google Scholar] [CrossRef]
  39. Garcia, A.A.; Wang, S.; Melchinger, A.E.; Zeng, Z.B. Quantitative trait loci mapping and the genetic basis of heterosis in maize and rice. Genetics. 2008, 180, 1707–1724. [Google Scholar] [CrossRef]
  40. Li, Y.; Wang, T.Y. Germplasm base of maize breeding in China and formation of foundation parents. J. Maize Sci. 2010, 18, 1–8. [Google Scholar]
  41. Sun, Q.; Lu, S.; Li, W.; Yu, Y.; Zhao, M.; Li, W.; Meng, Z. Pedigree analysis on parental inbred lines of Chinese approved maize hybrids released by pioneer corporation. J. Maize Sci. 2020, 28, 8–13. [Google Scholar]
  42. Liu, Z.; Tang, J.; Wang, Q.; Hu, Y.; Ji, H.; Chen, W. Analysis of heterotic patterns of maize hybrids used in China′s henan province. Sci. Agric. Sin. 2006, 39, 1689–1696. [Google Scholar]
  43. Wang, B.; Hou, M.; Shi, J.; Ku, L.; Song, W.; Li, C.; Ning, Q.; Li, X.; Li, C.; Zhao, B.; et al. De novo genome assembly and analyses of 12 founder inbred lines provide insights into maize heterosis. Nat. Genet. 2023, 55, 312–323. [Google Scholar] [CrossRef] [PubMed]
  44. Liu, X.; Gu, S.; Wen, W.; Lu, X.; Jin, Y.; Zhang, Y.; Guo, X. Disentangling the heterosis in biomass production and radiation use efficiency in maize: A phytomer-based 3D modelling approach. Plants 2023, 12, 1229. [Google Scholar] [CrossRef]
  45. Ko, D.K.; Rohozinski, D.; Song, Q.; Taylor, S.H.; Juenger, T.E.; Harmon, F.G.; Chen, Z.J. Temporal shift of circadian-mediated gene expression and carbon fixation contributes to biomass heterosis in maize hybrids. PLoS Genet. 2016, 12, e1006197. [Google Scholar] [CrossRef]
  46. Liu, W.; Zhang, Y.; He, H.; He, G.; Deng, X.W. From hybrid genomes to heterotic trait output: Challenges and opportunities. Curr. Opin. Plant Biol. 2022, 66, 102193. [Google Scholar] [CrossRef]
  47. Li, W.; Ge, F.; Qiang, Z.; Zhu, L.; Zhang, S.; Chen, L.; Wang, X.; Li, J.; Fu, Y. Maize ZmRPH1 encodes a microtubule-associated protein that controls plant and ear height. J. Plant Biotechnol. 2020, 18, 1345–1347. [Google Scholar] [CrossRef]
  48. Pan, Z.; Liu, M.; Xiao, Z.; Ren, X.; Zhao, H.; Gong, D.; Liang, K.; Tan, Z.; Shao, Y.; Qiu, F. ZmSMK9, a pentatricopeptide repeat protein, is involved in the cis-splicing of nad5, kernel development and plant architecture in maize. Plant Sci. 2019, 288, 110205. [Google Scholar] [CrossRef]
Figure 1. Observation of strong heterosis in the testcross population. Notes: (A) Distribution of MPH; (B) the relationship between the yield performance of testcross lines and better parent lines; (C) the relationship between MPH and midparent values; and (D) MPH is significantly correlated with the genetic distance between parental lines.
Agronomy 13 02722 g001
Figure 2. Genetic variances of MPH. Note: D, AA, AD, DD, and e are, respectively, dominance, additive-by-additive, additive-by-dominance, dominance-by-dominance, and error variances.
Agronomy 13 02722 g002
Figure 3. MPH mapping and ASEGs across the genome. Notes: (A) showcases the MPH mapping result; the red, green, and blue lines, respectively, portray significant additive-by-additive, additive-by-dominance, and dominance-by-dominance overdominance interactions; B and C are genome-wide ASEG genes detected in the XY335 (B) and ZD958 (C) HPTs. BT2 (GRMZM2G068506) and ZmNF-YC4 (GRMZM2G078691) detected in ZD958 HPT; and four ASEGs detected in both XY335 and ZD958 HPTs are shown. (D) highlights the 39 significant independent SNPs, where blue dots denote 24 SNPs of the SNP_1% set, and green dots signify the remaining 15 SNPs. (E) shows all 15,386 SNP markers (pink dots), with red dots denoting 39 significantly independent SNPs.
Agronomy 13 02722 g003
Figure 4. Enrichment analysis of the ASEGs in the regions of the SNP_1% set. Note: (A), Fisher’s exact test showed that ASEGs were significantly enriched in the regions of the SNP_1% set, and *** indicate p < 0.001; (B), GO enrichment analysis of the 259 non-redundant ASEGs detected in both ZD958 and XY335 HPTs.
Agronomy 13 02722 g004
Figure 5. Allelic expression of BT2 and ZmNF-YC4 in ZD958 and its parental lines. Note: (A,B) The female and male parents of ZD958 are Zheng58 and Chang7-2, respectively. “*” indicates significant difference between the parental lines, and “ns” indicate that the differences between the expressions of the two alleles in F1 are not significant. The bars indicate standard errors. (C,D) The co-expression networks of BT2 (C) and ZmNF-YC4 (D), and the genes in red and blue indicated known functional genes or genes whose homologs in other plants were associated with biomass or yield traits.
Agronomy 13 02722 g005
Disclaimer/Publisher’s Note: The statements, opinions and data contained in all publications are solely those of the individual author(s) and contributor(s) and not of MDPI and/or the editor(s). MDPI and/or the editor(s) disclaim responsibility for any injury to people or property resulting from any ideas, methods, instructions or products referred to in the content.

