Genome-Wide Association Study for Yield and Yield-Related Traits in Chinese Spring Wheat

 ,
,
Abstract
:1. Introduction
2. Materials and Methods
2.1. Plant Materials and Field Trials
2.2. Phenotype
- Before harvesting, five main tillers from five randomly selected plants were chosen from the middle two rows of each plot to assess the following traits: plant height (PH), spike length (SL), spikelet number per spike (SNS), kernel number per spikelet (KNS), kernel number per main spike (KNMS), and kernel weight per main spike (KWMS).
- Productive spikelet rate (PSR) was calculated by dividing the number of productive spikelets by the total number of spikelets.
- After reaching full maturity, the grain yield (GY) was evaluated. All wheat plants in each cultivar’s entire plot were harvested to measure the plot’s yield. The results were then converted into yield per hectare (kg).
- The thousand-grain weight (TKW) was recorded by weighing 1000 grains in grams (g).
- Test weight (TW) was recorded by weighing one liter of grains in grams (g).
2.3. SNP Genotype
2.4. Genome-Wide Association Study
2.5. Haplotype Analysis
2.6. Candidate Genes
2.7. Statistical Analysis
3. Results
3.1. Phenotypic Assessment
3.2. Genome-Wide Association Study and Annotations
3.3. Haplotype Analysis
3.4. Cumulative Effect Analysis
4. Discussion
4.1. Traits Analysis
4.2. Marker-Trait Associations
4.2.1. Association for GY
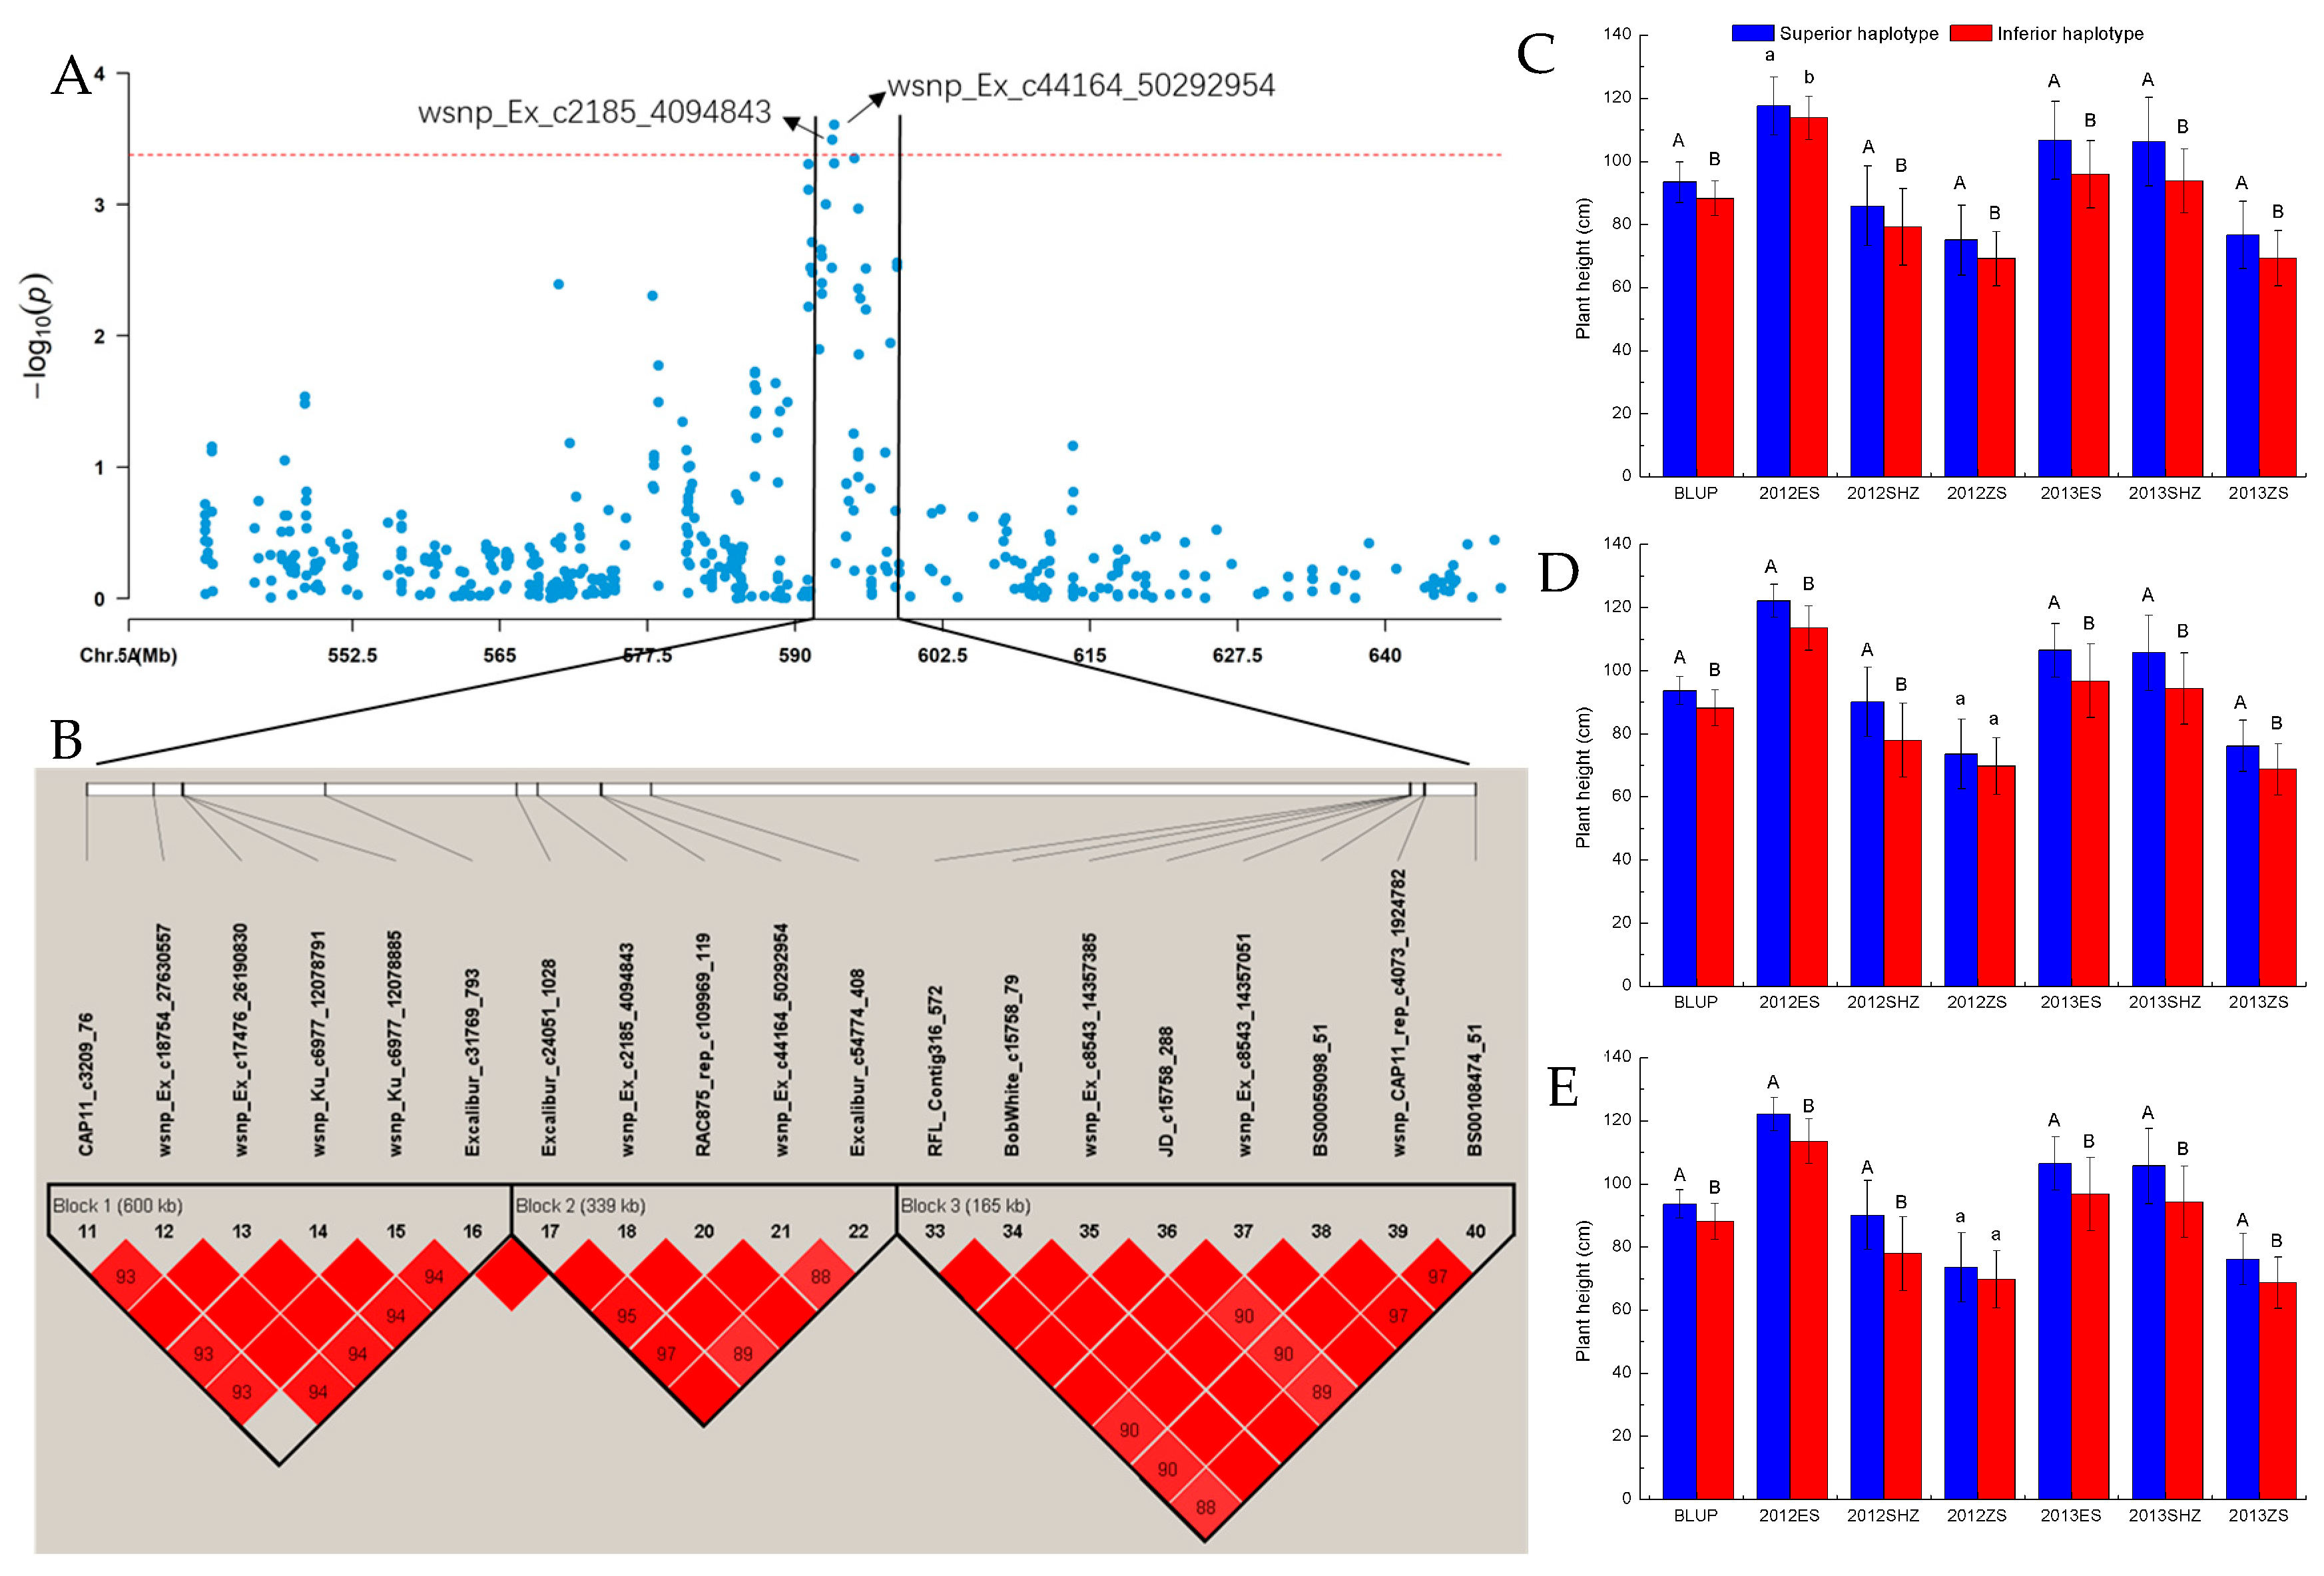
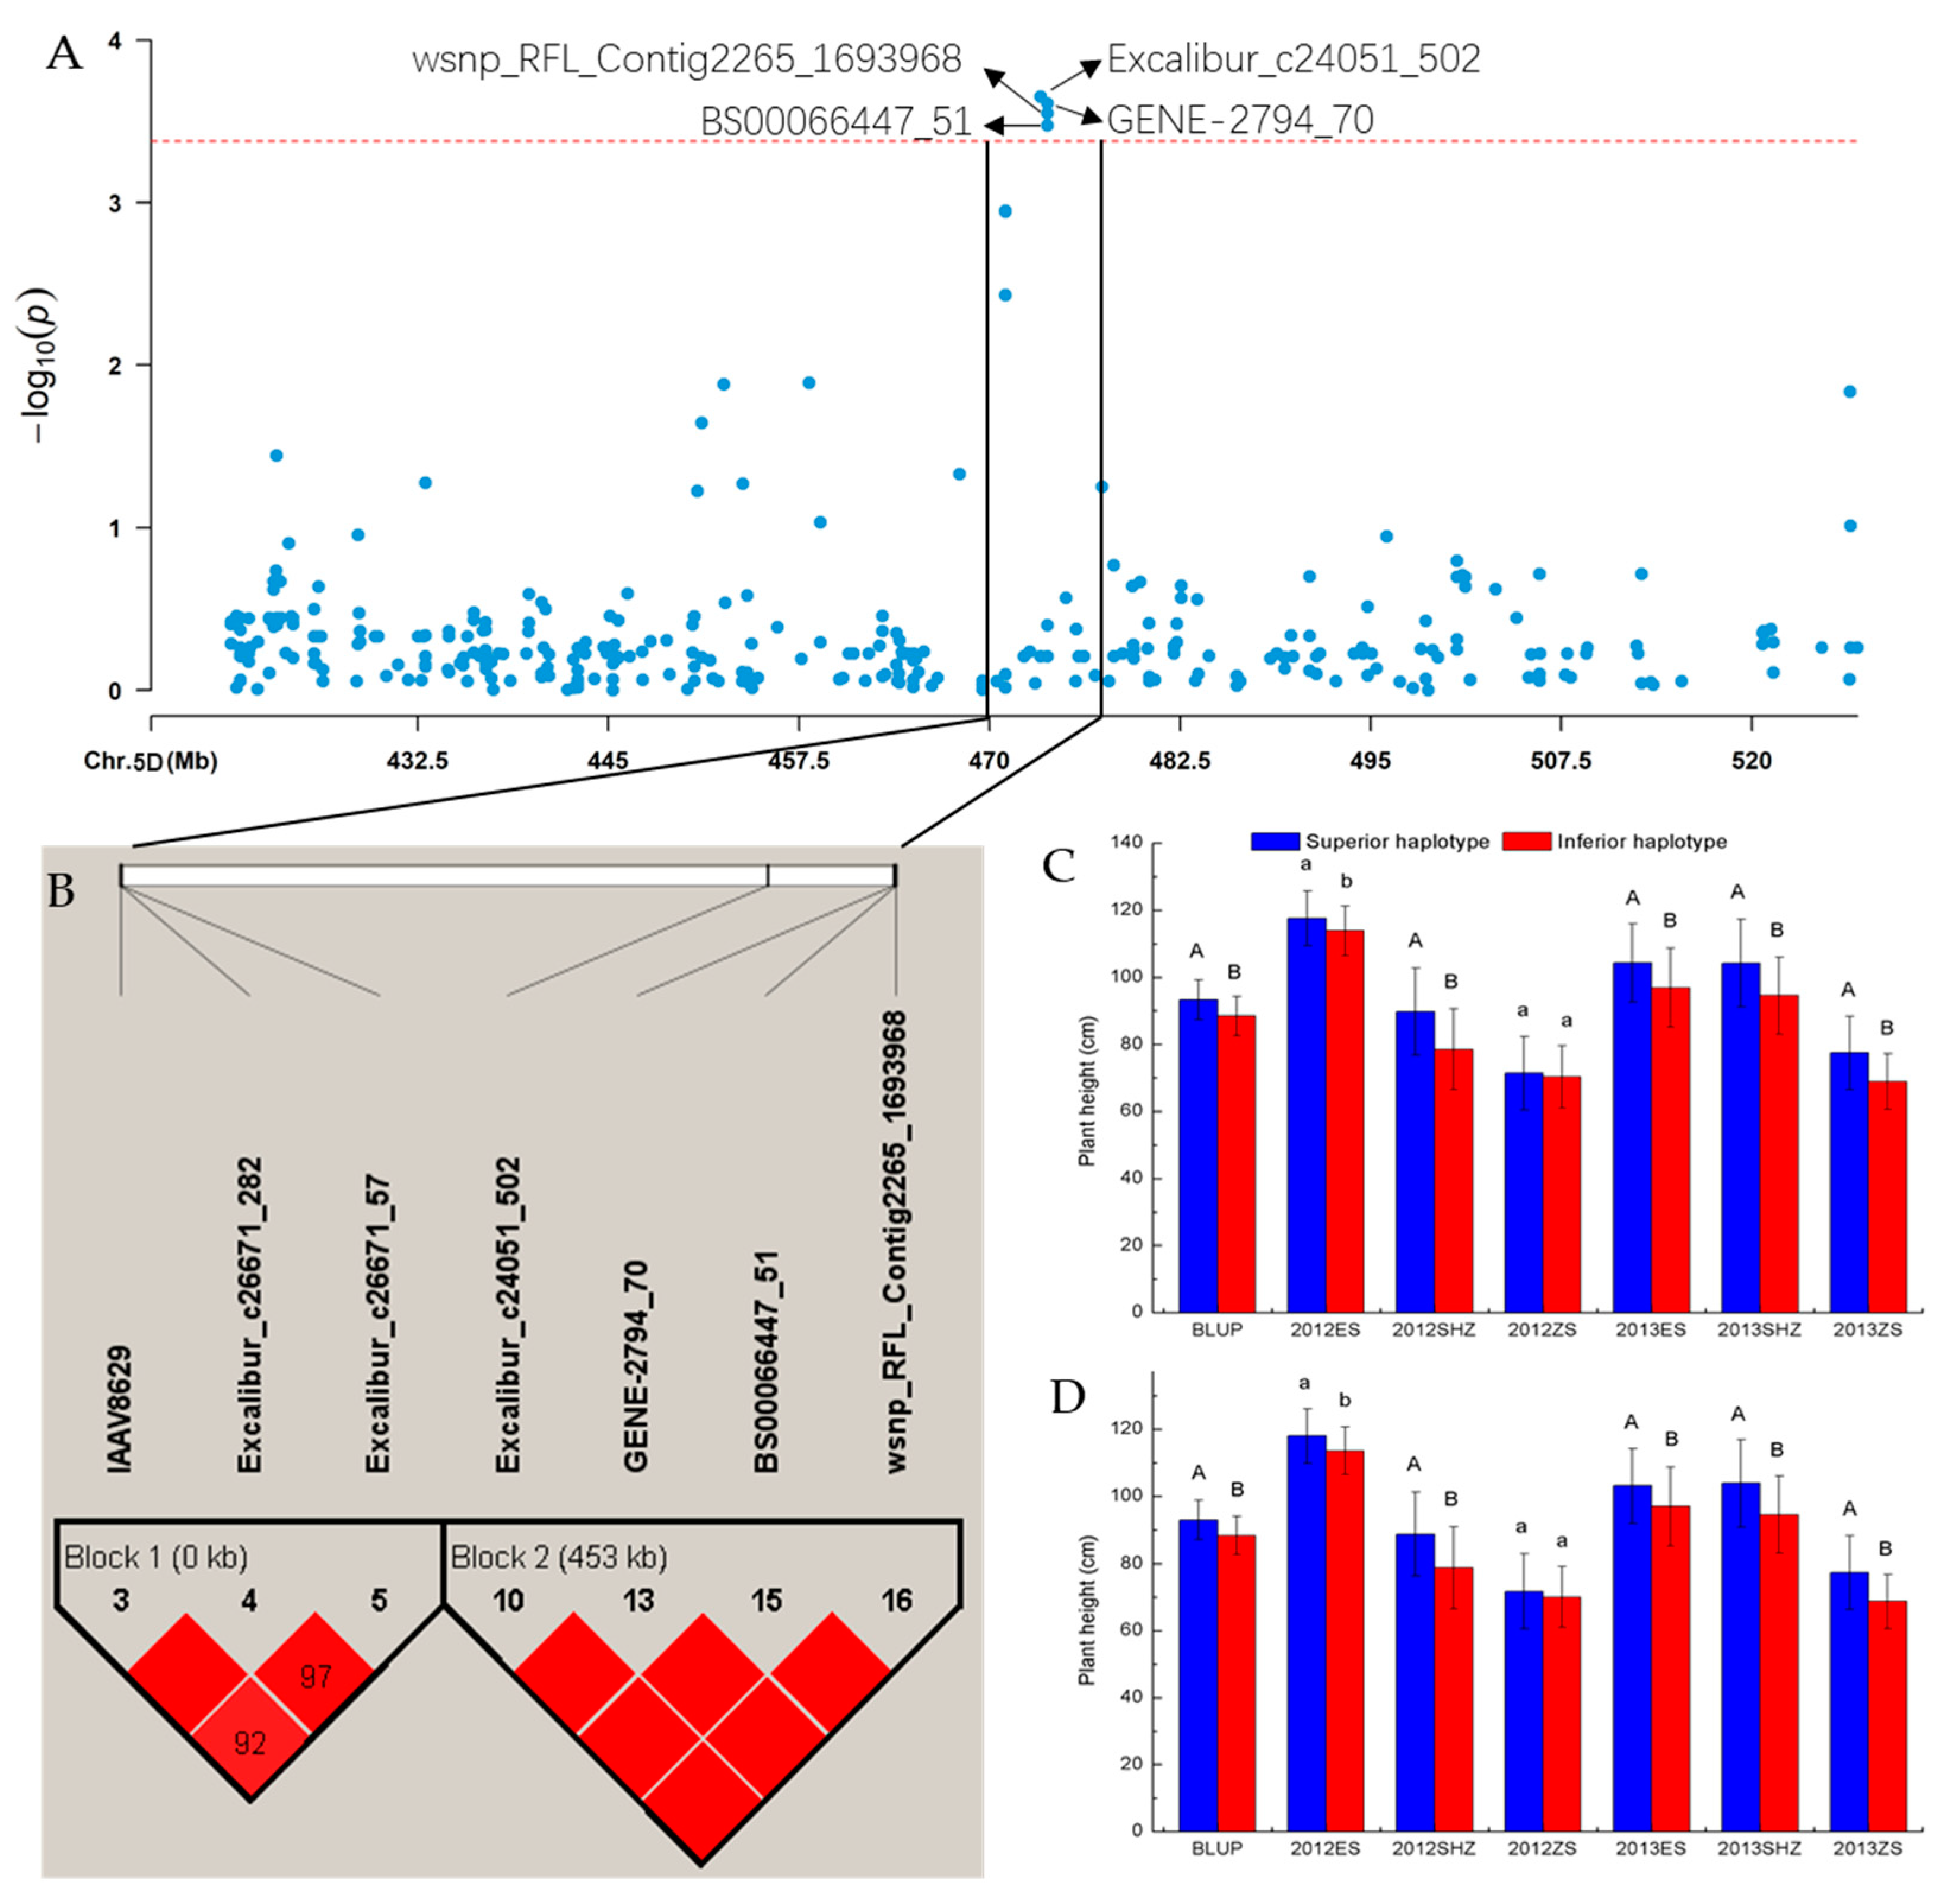
4.2.2. Association for PH
4.2.3. Association with SL
4.2.4. Association with PSR
4.2.5. Association with KNMS
4.2.6. Association with TKW
4.2.7. Association with TW
4.2.8. Cumulative Effect Analysis of Super Alleles
5. Conclusions
Supplementary Materials
Author Contributions
Funding
Institutional Review Board Statement
Informed Consent Statement
Data Availability Statement
Conflicts of Interest
References
- Godfray, H.C.; Beddington, J.R.; Crute, I.R.; Haddad, L.; Lawrence, D.; Muir, J.F.; Pretty, J.; Robinson, S.; Thomas, S.M.; Toulmin, C. Food security: The challenge of feeding 9 billion people. Science 2010, 327, 812–818. [Google Scholar] [CrossRef] [PubMed]
- Tilman, D.; Balzer, C.; Hill, J.; Befort, B.L. Global food demand and the sustainable intensification of agriculture [sustainability science]. Proc. Natl. Acad. Sci. USA 2011, 108, 20260–20264. [Google Scholar] [CrossRef] [PubMed]
- Ray, D.K.; Mueller, N.D.; West, P.C.; Foley, J.A.; Hart, J.P. Yield trends are insufficient to double global crop production by 2050. PLoS ONE 2013, 8, e66428. [Google Scholar] [CrossRef] [PubMed]
- Statista. Available online: https://www.statista.com/topics/1668/wheat/ (accessed on 26 October 2023).
- Tadesse, W.; Sanchez-Garcia, M.; Assefa, S.G.; Amri, A.; Baum, M. Genetic Gains in Wheat Breeding and Its Role in Feeding the World. Crop Breed Genet. Genom. 2019, 1, e190005. [Google Scholar]
- Curtis, B.C. Wheat in the World. In Bread Wheat Improvement and Production; Curtis, B.C., Rajaram, S., Macpherson, H.G., Eds.; Plant Production and Protection Series 30; FAO: Roma, Italy, 2002; pp. 1–18. [Google Scholar]
- Akram, S.; Arif, M.A.R.; Hameed, A. A GBS-based GWAS analysis of adaptability and yield traits in bread wheat (Triticum aestivum L.). J. Appl. Genet. 2021, 62, 27–41. [Google Scholar] [CrossRef]
- Sehgal, D.; Autrique, E.; Singh, R.; Ellis, M.; Singh, S.; Dreisigacker, S. Identification of genomic regions for grain yield and yield stability and their epistatic interactions. Sci. Rep. 2017, 7, 41578. [Google Scholar] [CrossRef]
- Arzani, A.; Ashraf, M. Cultivated Ancient Wheats (Triticum spp.): A Potential Source of Health-Beneficial Food Products. Compr. Rev. Food Sci. Food Saf. 2017, 16, 477–488. [Google Scholar] [CrossRef]
- Eltaher, S.; Baenziger, P.S.; Belamkar, V.; Emara, H.A.; Nower, A.A.; Salem, K.F.M.; Alqudah, A.M.; Sallam, A. GWAS revealed effect of genotype × environment interactions for grain yield of nebraska winter wheat. BMC Genom. 2021, 1, 2. [Google Scholar] [CrossRef]
- Hai, L.; Guo, H.; Wagner, C.; Xiao, S.; Friedt, W. Genomic regions for yield and yield parameters in chinese winter wheat (Triticum aestivum L.) genotypes tested under varying environments correspond to qtl in widely different wheat materials. Plant Sci. 2008, 175, 226–232. [Google Scholar] [CrossRef]
- Kearsey, M.J.; Pooni, H.S. The Genetical Analysis of Quantitative Traits; Chapman and Hall: Boca Raton, FL, USA, 1996. [Google Scholar]
- Gao, F.; Wen, W.; Liu, J.; Rasheed, A.; Yin, G.; Xia, X.; Wu, X.; He, Z. Genome-Wide Linkage Mapping of QTL for Yield Components, Plant Height and Yield-Related Physiological Traits in the Chinese Wheat Cross Zhou 8425B/Chinese Spring. Front. Plant Sci. 2015, 6, 1099. [Google Scholar] [CrossRef]
- Cao, S.; Xu, D.; Hanif, M.; Xia, X.; He, Z. Genetic architecture underpinning yield component traits in wheat. Theor. Appl. Genet. 2020, 133, 1811–1823. [Google Scholar] [CrossRef]
- Shokat, S.; Sehgal, D.; Vikram, P.; Liu, F.; Singh, S. Molecular markers associated with agro-physiological traits under terminal drought conditions in bread wheat. Int. J. Mol. Sci. 2020, 21, 3156. [Google Scholar] [CrossRef] [PubMed]
- Zhao, J.; Sun, L.; Gao, H.; Hu, M.; Mu, L.; Cheng, X.; Wang, J.; Zhao, Y.; Li, Q.; Wang, P.; et al. Genome-wide association study of yield-related traits in common wheat (Triticum aestivum L.) under normal and drought treatment conditions. Front. Plant Sci. 2023, 13, 1098560. [Google Scholar] [CrossRef]
- Hsu, P.; Walton, P.D. Relationships between yield and its components and structures above the flag leaf node in spring wheat. Crop Sci. 1971, 11, 190–193. [Google Scholar] [CrossRef]
- Yano, M.; Sasaki, T. Genetic and molecular dissection of quantitative traits in rice. Plant Mol. Biol. 1997, 35, 145–153. [Google Scholar] [CrossRef]
- Bezant, J.; Laurie, D.; Pratchett, N.; Chojecki, J.; Kearsey, M. Mapping qtl controlling yield and yield components in a spring barley (Hordeum vulgare L.) cross using marker regression. Mol. Breed. 1997, 3, 29–38. [Google Scholar] [CrossRef]
- Lozada, D.N.; Mason, R.E.; Babar, M.A.; Carver, B.F.; Guedira, G.B.; Merrill, K.; Arguello, M.N.; Acuna, A.; Vieira, L.; Holder, A.; et al. Association mapping reveals loci associated with multiple traits that affect grain yield and adaptation in soft winter wheat. Euphytica 2017, 213, 222. [Google Scholar] [CrossRef]
- Nigro, D.; Gadaleta, A.; Mangini, G.; Colasuonno, P.; Marcotuli, I.; Giancaspro, A.; Giove, S.L.; Simeone, R.; Blanco, A. Candidate genes and genome-wide association study of grain protein content and protein deviation in durum wheat. Planta 2019, 249, 1157–1175. [Google Scholar] [CrossRef]
- Bilgrami, S.S.; Ramandi, H.D.; Shariati, V.; Razavi, K.; Tavakol, E.; Fakheri, B.A.; Nezhad, N.M.; Ghaderian, M. Detection of genomic regions associated with tiller number in iranian bread wheat under different water regimes using genome-wide association study. Sci. Rep. 2020, 10, 14034–14051. [Google Scholar] [CrossRef]
- Ganal, M.W.; Polley, A.; Graner, E.M.; Plieske, J.; Wieseke, R.; Luerssen, H.; Durstevitz, G. Large snp arrays for genotyping in crop plants. J. Biosci. 2012, 37, 821–828. [Google Scholar] [CrossRef]
- Neumann, K.; Kobiljski, B.; Deni, S.; Varshney, R.K.; Brner, A. Genome-wide association mapping: A case study in bread wheat (Triticum aestivum L.). Mol. Breed. 2011, 27, 37–58. [Google Scholar] [CrossRef]
- Muhu-Din Ahmed, H.G.; Sajjad, M.; Zeng, Y.; Iqbal, M.; Habibullah Khan, S.; Ullah, A.; Nadeem Akhtar, M. Genome-wide association mapping through 90K SNP array for quality and yield attributes in bread wheat against water-deficit conditions. Agriculture 2020, 10, 392. [Google Scholar] [CrossRef]
- Edae, E.A.; Byrne, P.F.; Haley, S.D.; Lopes, M.S.; Reynolds, M.P. Genome-wide association mapping of yield and yield components of spring wheat under contrasting moisture regimes. Theor. Appl. Genet. 2014, 127, 791–807. [Google Scholar] [CrossRef] [PubMed]
- Ain, Q.U.; Rasheed, A.; Anwar, A.; Mahmood, T.; Imtiaz, M.; Mahmood, T.; Xia, X.; He, Z.; Quraishi, U.M. Genome-wide association for grain yield under rainfed conditions in historical wheat cultivars from Pakistan. Front. Plant Sci. 2015, 6, 743. [Google Scholar] [CrossRef]
- Sukumaran, S.; Dreisigacker, S.; Lopes, M.; Chavez, P.; Reynolds, M.P. Genome-wide association study for grain yield and related traits in an elite spring wheat population grown in temperate irrigated environments. Theor. Appl. Genet. 2015, 128, 353–363. [Google Scholar] [CrossRef] [PubMed]
- Garcia, M.; Eckermann, P.; Haefele, S.; Satija, S.; Sznajder, B.; Timmins, A.; Baumann, U.; Wolters, P.; Mather, D.E.; Fleury, D. Genome-wide association mapping of grain yield in a diverse collection of spring wheat (Triticum aestivum L.) evaluated in southern australia. PLoS ONE 2019, 14, e0211730. [Google Scholar] [CrossRef] [PubMed]
- Li, F.; Wen, W.; Liu, J.; Zhang, Y.; Xia, X. Genetic architecture of grain yield in bread wheat based on genome-wide association studies. BMC Plant Biol. 2019, 19, 168–187. [Google Scholar] [CrossRef] [PubMed]
- Ward, B.P.; Brown-Guedira, G.; Kolb, F.L.; Van Sanford, D.A.; Tyagi, P.; Sneller, C.H.; Griffey, A.G. Genome-wide association studies for yield-related traits in soft red winter wheat grown in virginia. PLoS ONE 2019, 14, e0208217. [Google Scholar] [CrossRef] [PubMed]
- Li, X.; Xu, X.; Liu, W.; Li, X.; Yang, X.; Ru, Z.; Li, L. Dissection of Superior Alleles for Yield-Related Traits and Their Distribution in Important Cultivars of Wheat by Association Mapping. Front. Plant Sci. 2020, 11, 175. [Google Scholar] [CrossRef]
- Chidzanga, C.; Mullan, D.; Roy, S.; Baumann, U.; Garcia, M. Nested association mapping-based GWAS for grain yield and related traits in wheat grown under diverse australian environments. Theor. Appl. Genet. 2022, 135, 4437–4456. [Google Scholar] [CrossRef]
- Khan, H.; Krishnappa, G.; Kumar, S.; Mishra, C.N.; Krishna, H.; Devate, N.B.; Rathan, N.D.; Parkash, O.; Yadav, S.S.; Srivastava, P.; et al. Genome-wide association study for grain yield and component traits in bread wheat (Triticum aestivum L.). Front. Genet. 2022, 13, 982589. [Google Scholar] [CrossRef]
- Wang, X.; Guan, P.; Xin, M.; Wang, Y.; Chen, X.; Zhao, A.; Liu, M.; Li, H.; Zhang, M.; Lu, L.; et al. Genome-wide association study identifies QTL for thousand grain weight in winter wheat under normal- and late-sown stressed environments. Theor. Appl. Genet. 2021, 134, 143–157. [Google Scholar] [CrossRef]
- Said, A.A.; Macqueen, A.H.; Shawky, H.; Reynolds, M.; Juenger, T.E.; El-Soda, M. Genome-wide association mapping of genotype-environment interactions affecting yield-related traits of spring wheat grown in three watering regimes. Environ. Exp. Bot. 2022, 194, 104740. [Google Scholar] [CrossRef]
- Tyrka, M.; Krajewski, P.; Bednarek, P.T.; Rączka, K.; Drzazga, T.; Matysik, P.; Martofel, R.; Woźna-Pawlak, U.; Jasińska, D.; Niewińska, M.; et al. Genome-wide association mapping in elite winter wheat breeding for yield improvement. J. Appl. Genet. 2023, 64, 377–391. [Google Scholar] [CrossRef] [PubMed]
- Hao, C.; Dong, Y.; Wang, L.; You, G.; Zhang, H.; Ge, H.; Jia, J.; Zhang, X. Genetic diversity and construction of core collection in Chinese wheat genetic resources. Sci. Bull. 2008, 53, 1518–1526. [Google Scholar] [CrossRef]
- He, Z.H.; Rajaram, S.; Xin, Z.Y.; Huang, G.Z. A history of wheat breeding in china. J. Comp. Neurol. 2001, 523, 805–813. [Google Scholar]
- Gao, L.; Meng, C.; Yi, T.; Xu, K.; Cao, H.; Zhang, S.; Yang, X.; Zhao, Y. Genome-wide association study reveals the genetic basis of yield- and quality-related traits in wheat. BMC Plant Biol. 2021, 21, 144–155. [Google Scholar] [CrossRef]
- Doyle, J. DNA Protocols for Plants; Springer: Berlin/Heidelberg, Germany, 1991; Volume 57. [Google Scholar] [CrossRef]
- Purcell, S.; Neale, B.; Todd-Brown, K.; Thomas, L.; Ferreira, M.A.R.; Bender, D.; Maller, J.; Sklar, P.; de Bakker, P.I.W.; Daly, M.J.; et al. Plink: A tool set for whole-genome association and population-based linkage analyses. Am. J. Hum. Genet. 2007, 81, 559–575. [Google Scholar] [CrossRef]
- Tian, Y.; Sang, W.; Liu, P.; Liu, J.; Xiang, J.; Cui, F.; Xu, H.; Han, X.; Nie, Y.; Kong, D.; et al. Genome-wide Association Study for Starch Pasting Properties in Chinese Spring Wheat. Front. Genet. 2022, 13, 830644. [Google Scholar] [CrossRef] [PubMed]
- Bradbury, P.J.; Zhang, Z.; Kroon, D.E.; Casstevens, T.M.; Ramdoss, Y.; Buckler, E.S. Tassel: Software for association mapping of complex traits in diverse samples. Bioinformatics 2007, 23, 2633–2635. [Google Scholar] [CrossRef]
- Barrett, J.C.; Fry, B.; Maller, J.; Daly, M.J. Haploview: Analysis and Visualization of LD and Haplotype Maps. Bioinformatics 2005, 21, 263–265. [Google Scholar] [CrossRef] [PubMed]
- Gabriel, S.B.; Schaffner, S.F.; Nguyen, H.; Moore, J.M.; Roy, J.; Blumenstiel, B. The structure of haplotype blocks in the human genome. Science 2002, 296, 2225–2229. [Google Scholar] [CrossRef] [PubMed]
- Bernardo, R. Best linear unbiased prediction of maize single-cross performance. Crop Sci. 1996, 36, 50–56. [Google Scholar] [CrossRef]
- Bernardo, R. Testcross additive and dominance effects in best linear unbiased prediction of maize single-cross performance. Theor. Appl. Genet. 1996, 93, 1098–1102. [Google Scholar] [CrossRef] [PubMed]
- Bates, D.M.; Maechler, M.; Bolker, B.M.; Walker, S.C. Package lme4: Linear mixed-effects models using eigen and s4. J. Stat. Softw. 2014, 67. Available online: https://cran.r-project.org/web//packages/lme4/ (accessed on 19 September 2023).
- Shi, W.; Hao, C.; Zhang, Y.; Cheng, J.; Zhang, Z.; Liu, J.; Yi, X.; Cheng, X.; Sun, D.; Xu, Y.; et al. A Combined Association Mapping and Linkage Analysis of Kernel Number Per Spike in Common Wheat (Triticum aestivum L.). Front. Plant Sci. 2017, 8, 01412. [Google Scholar] [CrossRef]
- Wu, X.; Chang, X.; Jing, R. Genetic insight into yield-associated traits of wheat grown in multiple rain-fed environments. PLoS ONE 2012, 7, e31249. [Google Scholar] [CrossRef]
- Alqudah, A.M.; Haile, J.K.; Alomari, D.Z.; Pozniak, C.J.; Kobiljski, B.; Börner, A. Genome-wide and SNP network analyses reveal genetic control of spikelet sterility and yield-related traits in wheat. Sci. Rep. 2020, 10, 2098. [Google Scholar] [CrossRef]
- Tricker, P.J.; Abdeljalil, E.H.; Jessica, S.; Delphine, F. The physiological and genetic basis of combined drought and heat tolerance in wheat. J. Exp. Bot. 2018, 69, 3195–3210. [Google Scholar] [CrossRef] [PubMed]
- Brinton, J.; Uauy, C.; Centre, J.I.; Park, N.R. A reductionist approach to dissecting grain weight and yield in wheat. J. Integr. Plant. Biol. 2019, 61, 337–358. [Google Scholar] [CrossRef]
- Pradhan, S.; Babar, M.A.; Robbins, K.; Bai, G.; Mason, R.E.; Khan, J.; Shahi, D.; Avci, M.A.; Guo, J.; Hossain, M.M.; et al. Understanding the Genetic Basis of Spike Fertility to Improve Grain Number, Harvest Index, and Grain Yield in Wheat Under High Temperature Stress Environments. Front. Plant Sci. 2019, 10, 1481. [Google Scholar] [CrossRef] [PubMed]
- Sheoran, S.; Jaiswal, S.; Raghav, N.; Sharma, R.; Sabhyata; Gaur, A.; Jaisri, J.; Tandon, G.; Singh, S.; Sharma, P.; et al. Genome-wide association study and post-genome-wide association study analysis for spike fertility and yield related traits in bread wheat. Front. Plant Sci. 2021, 12, 820761. [Google Scholar] [CrossRef] [PubMed]
- Pinto, R.S.; Reynolds, M.P.; Mathews, K.L.; Mcintyre, C.L.; Olivares-Villegas, J.J.; Chapman, S.C. Heat and drought adaptive qtl in a wheat population designed to minimize confounding agronomic effects. Theor. Appl. Genet. 2010, 121, 1001–1021. [Google Scholar] [CrossRef] [PubMed]
- Lopes, M.S.; Dreisigacker, S.; Peña, R.J.; Sukumaran, S.; Reynolds, M.P. Genetic characterization of the wheat association mapping initiative (wami) panel for dissection of complex traits in spring wheat. Theor. Appl. Genet. 2015, 128, 453–464. [Google Scholar] [CrossRef] [PubMed]
- Su, Q.; Zhang, X.; Zhang, W.; Zhang, N.; Song, L.; Liu, L.; Xue, X.; Liu, G.; Liu, J.; Meng, D.; et al. QTL Detection for Kernel Size and Weight in Bread Wheat (Triticum aestivum L.) Using a High-Density SNP and SSR-Based Linkage Map. Front. Plant Sci. 2018, 9, 1484. [Google Scholar] [CrossRef] [PubMed]
- Daba, S.D.; Tyagi, P.; Brown-Guedira, G.; Mohammadi, M. Genome-wide association study in historical and contemporary U.S. winter wheats identifies height-reducing loci. Crop J. 2019, 8, 243–251. [Google Scholar] [CrossRef]
- Lopes, M.S.; Reynolds, M.P.; McIntyre, C.L. QTL for yield and associated traits in the seri/babax population grown across several environments in mexico, in the west asia, north africa, and south asia regions. Theor. Appl. Genet. 2013, 126, 971–984. [Google Scholar] [CrossRef]
- Snape, J.W.; Law, C.N.; Worland, A.J. Whole chromosome analysis of height in wheat. Nature 1977, 38, 25–36. [Google Scholar] [CrossRef]
- Börner, A.; Plaschke, J.; Korzun, V.; Worland, A.J. The relationships between the dwarfing genes of wheat and rye. Euphytica 1996, 89, 69–75. [Google Scholar] [CrossRef]
- Würschum, T.; Langer, S.M.; Longin, C.F.H. Genetic control of plant height in european winter wheat cultivars. Theor. Appl. Genet. 2015, 128, 865–874. [Google Scholar] [CrossRef]
- McIntosh, R.; Dubcovsky, J.; Rogers, W.; Morris, C.; Xia, X. Catalog of Gene Symbols for Wheat: 2017 (Supplement). Available online: http://www.wheat.pw.usda.gov/GG2/pubs.html (accessed on 9 July 2020).
- Zanke, C.D.; Ling, J.; Plieske, J.; Kollers, S.; Rder, M.S. Whole genome association mapping of plant height in winter wheat (Triticum aestivum L.). PLoS ONE 2014, 9, e113287. [Google Scholar] [CrossRef] [PubMed]
- Blake, N.K.; Lanning, S.P.; Martin, J.M.; Doyle, M.; Sherman, J.D.; Naruoka, Y.; Talbert, L.E. Effect of variation for major growth habit genes on maturity and yield in five spring wheat populations. Crop Sci. 2009, 49, 1211–1220. [Google Scholar] [CrossRef]
- Sallam, A.H.; Manan, F.; Bajgain, P.; Martin, M.; Szinyei, T.; Conley, E.; Brown-Guedira, G.; Muehlbauer, G.J.; Anderson, J.A.; Steffenson, B.J. Genetic architecture of agronomic and quality traits in a nested association mapping population of spring wheat. Plant Genome 2020, 13, e20051. [Google Scholar] [CrossRef] [PubMed]
- Pasquale, V.D.; Pavone, L.M. Heparan sulfate proteoglycans: The sweet side of development turns sour in mucopolysaccharidoses. BBA-Mol. Basis. Dis. 2019, 1865, 165539. [Google Scholar] [CrossRef]
- Xing, C.; Jiang, Z.; Wang, Y. Downregulation of NAGLU in VEC Increases Abnormal Accumulation of Lysosomes and Represents a Predictive Biomarker in Early Atherosclerosis. Front. Cell Dev. Biol. 2021, 9, 797047. [Google Scholar] [CrossRef]
- Sehgal, D.; Mondal, S.; Crespo-Herrera, L.; Velu, G.; Dreisigacker, S. Haplotype-based, genome-wide association study reveals stable genomic regions for grain yield in cimmyt spring bread wheat. Front. Genet. 2020, 11, 589490. [Google Scholar] [CrossRef]
- Lu, Y.; Xu, J.; Yuan, Z.; Hao, Z.; Xie, C.; Li, X.; Shah, T.; Lan, H.; Zhang, S.; Rong, T.; et al. Comparative LD mapping using single snps and haplotypes identifies QTL for plant height and biomass as secondary traits of drought tolerance in maize. Mol. Breed. 2012, 30, 407–418. [Google Scholar] [CrossRef]
- Hao, D.; Cheng, H.; Yin, Z.; Cui, S.; Zhang, D.; Yu, W.D. Identification of single nucleotide polymorphisms and haplotypes associated with yield and yield components in soybean (Glycine max) landraces across multiple environments. Theor. Appl. Genet. 2012, 124, 447–458. [Google Scholar] [CrossRef]
- Amidou, N.D.; Jemanesh, K.H.; Aron, T.C.; Fran, R.C.; John, M.C.; Ron, E.K.; Curtis, J.P. Single marker and haplotype-based association analysis of semolina and pasta colour in elite durum wheat breeding lines using a high-density consensus map. PLoS ONE 2017, 12, e0170941. [Google Scholar]
- Marza, F.; Bai, G.H.; Carver, B.F.; Zhou, W.C. Quantitative trait loci for yield and related traits in the wheat population ning7840×clark. Theor. Appl. Genet. 2006, 112, 688–698. [Google Scholar] [CrossRef]
- Rahimi, Y.; Bihamta, M.R.; Taleei, A.; Alipour, H.; Ingvarsson, P.K. Genome-wide association study of agronomic traits in bread wheat reveals novel putative alleles for future breeding programs. BMC Plant Biol. 2019, 19, 541. [Google Scholar] [CrossRef] [PubMed]
- Yang, Y.; Amo, A.; Wei, D.; Chai, Y.; Zheng, J.; Qiao, P.; Cui, C.; Lu, S.; Chen, L.; Hu, Y.G. Large-scale integration of meta-QTL and genome-wide association study discovers the genomic regions and candidate genes for yield and yield-related traits in bread wheat. Theor. Appl. Genet. 2021, 134, 3083–3109. [Google Scholar] [CrossRef] [PubMed]
- Wang, J.; Fan, Y.; Mao, L.; Qu, C.; Lu, K.; Li, J.; Liu, L. Genome-wide association study and transcriptome analysis dissect the genetic control of silique length in Brassica napus L. Biotechnol. Biofuels 2021, 14, 214. [Google Scholar] [CrossRef]
- Gong, H.; Jiao, Y.; Hu, W.W.; Pua, E.C. Expression of glutathione-s-transferase and its role in plant growth and development in vivo and shoot morphogenesis in vitro. Plant Mol. Biol. 2005, 57, 53–66. [Google Scholar] [CrossRef] [PubMed]
- Kumar, S.; Asif, M.H.; Chakrabarty, D.; Tripathi, R.D.; Trivedi, P.K. Differential expression of rice lambda class gst gene family members during plant growth, development, and in response to stress conditions. Plant Mol. Biol. Rep. 2013, 31, 569–580. [Google Scholar] [CrossRef]
- Wang, R.; Ma, J.; Zhang, Q.; Wu, C.; He, G. Genome-wide identification and expression profiling of glutathione transferase gene family under multiple stresses and hormone treatments in wheat (Triticum aestivum L.). BMC Genom. 2019, 20, 986. [Google Scholar] [CrossRef]
- Wang, W.; Li, K.; Yang, Z.; Hou, Q.; Zhao, W.W.; Sun, Q. RNase H1C collaborates with ssDNA binding proteins WHY1/3 and recombinase RecA1 to fulfill the DNA damage repair in Arabidopsis chloroplasts. Nucleic Acids Res. 2021, 49, 6771–6787. [Google Scholar] [CrossRef] [PubMed]
- Friedmann, E.; Salzberg, Y.; Weinberger, A.; Shaltiel, S.; Gerst, J.E. Yos9, the putative yeast homolog of a gene amplified in osteosarcomas, is involved in the endoplasmic reticulum (er)-golgi transport of gpi-anchored proteins. J. Biol. Chem. 2002, 277, 35274–35281. [Google Scholar] [CrossRef]
- Seaayfan, E.; Defontaine, N.; Demaretz, S.; Zaarour, N.; Laghmani, K. Os9 protein interacts with na-k-2cl co-transporter (NKCC2) and targets its immature form for the endoplasmic reticulum-associated degradation pathway. J. Biol. Chem. 2016, 291, 4487–4502. [Google Scholar] [CrossRef]
- Fujiki, Y.; Teshima, H.; Kashiwao, S.; Kawano-Kawada, M.; Ohsumi, Y.; Kakinuma, Y.; Sekito, T. Functional identification of atavt3, a family of vacuolar amino acid transporters, in arabidopsis. FEBS Lett. 2017, 591, 5–15. [Google Scholar] [CrossRef]
- Ma, J.; Wang, Y.; Ma, X.; Meng, L.; Wan, J. Disruption of gene spl35, encoding a novel cue domain-containing protein, leads to cell death and enhanced disease response in rice. Plant Biotechnol. J. 2019, 17, 1679–1693. [Google Scholar] [CrossRef]
- Wang, Z.C.; Tao, S.; Cheng, X.; Li, D.T.; Zhang, C.X.; Bao, Y.Y. CPR gene contributes to integument function and ovary development in a rice planthopper. Int. J. Mol. Sci. 2022, 23, 2875. [Google Scholar] [CrossRef]
- Sveshnikova, N.; Soll, J.; Schleiff, E. Toc34 is a preprotein receptor regulated by GTP. Proc. Natl. Acad. Sci. USA 2000, 97, 4973–4978. [Google Scholar] [CrossRef]
- Börner, A.; Schumann, E.; Furste, A.; Coster, H.; Leithold, B.; Roder, S. Mapping of quantitative trait loci determining agronomic important characters in hexaploid wheat (Triticum aestivum L.). Theor. Appl. Genet. 2002, 105, 921–936. [Google Scholar] [CrossRef]
- Huang, X.Q.; Cloutier, S.; Lycar, L.; Radovanovic, N.; Humphreys, D.G.; Noll, J.S.; Somers, D.J.; Brown, P.D. Molecular detection of qtls for agronomic and quality traits in a doubled haploid population derived from two canadian wheats (Triticum aestivum L.). Theor. Appl. Genet. 2006, 113, 753–766. [Google Scholar] [CrossRef]
- Jia, H.; Wan, H.; Yang, S.; Zhang, Z.; Ma, Z. Genetic dissection of yield-related traits in a recombinant inbred line population created using a key breeding parent in china’s wheat breeding. Theor. Appl. Genet. 2013, 126, 2123–2139. [Google Scholar] [CrossRef] [PubMed]
- Kirigwi, F.M.; Ginkel, M.V.; Brown-Guedira, G.; Gill, B.S.; Paulsen, G.M.; Fritz, A.K. Markers associated with a QTL for grain yield in wheat under drought. Mol. Breed. 2007, 20, 401–413. [Google Scholar] [CrossRef]
- Zhang, H.; Chen, J.; Li, R.; Deng, Z.; Tian, J. Conditional QTL mapping of three yield components in common wheat (Triticum aestivum L.). Crop J. 2016, 4, 220–228. [Google Scholar] [CrossRef]
- Quarrie, S.A.; Steed, A.; Calestani, C.; Semikhodskii, A.; Lebreton, C.; Chinoy, C.; Steele, N.; Pljevljakusi, D.; Waterman, E.; Weyen, J.; et al. A high-density genetic map of hexaploid wheat (Triticum aestivum L.) from the cross Chinese Spring × SQ1 and its use to compare QTLs for grain yield across a range of environments. Theor. Appl. Genet. 2005, 110, 865–880. [Google Scholar] [CrossRef] [PubMed]
- Zhang, T.; Kho, D.H.; Wang, Y.; Harazono, Y.; Nakajima, K.; Xie, Y.; Raz, A. Gp78, an E3 ubiquitin ligase acts as a gatekeeper suppressing nonalcoholic steatohepatitis (NASH) and liver cancer. PLoS ONE 2015, 10, e0118448. [Google Scholar] [CrossRef] [PubMed]
- Ma, L.; Xie, B.; Hong, Z.; Verma, D.P.; Zhang, Z. A novel RNA-binding protein associated with cell plate formation. Plant Physiol. 2008, 148, 223–234. [Google Scholar] [CrossRef] [PubMed]
- Huang, X.Q.; Kempf, H.; Ganal, M.W.; Rder, M.S. Advanced backcross qtl analysis in progenies derived from a cross between a german elite winter wheat variety and a synthetic wheat (Triticum aestivum L.). Theor. Appl. Genet. 2004, 109, 933–943. [Google Scholar] [CrossRef] [PubMed]
- Mccartney, C.A.; Somers, D.J.; Humphreys, D.G.; Lukow, O.; Ames, N.; Noll, J.; Cloutier, S.; McCallum, B.D. Mapping quantitative trait loci controlling agronomic traits in the spring wheat cross RL4452 × ‘AC domain’. Genome 2005, 48, 870–883. [Google Scholar] [CrossRef] [PubMed]
- Ahmed, H.G.M.D.; Zeng, Y.; Khan, M.A.; Rashid, M.A.R.; Ameen, M.; Akrem, A.; Saeed, A. Genome-wide association mapping of bread wheat genotypes using yield and grain morphology-related traits under different environments. Front. Genet. 2023, 13, 1008024. [Google Scholar] [CrossRef] [PubMed]
- Jamil, M.; Ali, A.; Gul, A.; Ghafoor, A.; Napar, A.A.; Ibrahim, A.M.H.; Naveed, N.H.; Yasin, N.A.; Mujeeb-Kazi, A. Genome-wide association studies of seven agronomic traits under two sowing conditions in bread wheat. BMC Plant Biol. 2019, 19, 149–167. [Google Scholar] [CrossRef] [PubMed]
- Chen, S.; Lu, X.; Ge, L.; Sun, X.; Xin, Z. Wound- and pathogen-activated de novo ja synthesis using different acx isozymes in tea plant (Camellia sinensis). J. Plant Physiol. 2019, 243, 153047. [Google Scholar] [CrossRef]
- Thakur, J.K.; Yadav, A.; Yadav, G. Molecular recognition by the kix domain and its role in gene regulation. Nucleic Acids Res. 2014, 42, 2112–2125. [Google Scholar] [CrossRef]
- Nelson, S.O.; Trabelsi, D.S.S. Sensing grain seed moisture and density from dielectric properties. IJABE 2011, 4, 75–81. [Google Scholar]
- Hsu, W.H.; Huang, Y.H.; Chen, P.R.; Hsieh, L.S. Nlip and had-like domains of pah1 and lipin 1 phosphatidate phosphatases are essential for their catalytic activities. Molecules 2021, 26, 5470. [Google Scholar] [CrossRef]
- Kumar, S.; Kumari, J.; Bhusal, N.; Pradhan, A.K.; Sareen, S. Genome-wide association study reveals genomic regions associated with ten agronomical traits in wheat under late-sown conditions. Front. Plant Sci. 2020, 11, 549743. [Google Scholar] [CrossRef]
- Yang, Y.; Chai, Y.; Zhang, X.; Lu, S.; Hu, Y.G. Multi-locus gwas of quality traits in bread wheat: Mining more candidate genes and possible regulatory network. Front. Plant Sci. 2020, 11, 1091. [Google Scholar] [CrossRef] [PubMed]


| Trait | Minimum | Maximum | Mean | SD | CV(%) | h2 |
|---|---|---|---|---|---|---|
| GY | 2589.66 | 4251.07 | 3503.34 | 314.41 | 8.97 | 0.60 |
| PH | 75.46 | 107.88 | 90.17 | 6.11 | 6.77 | 0.76 |
| SL | 6.17 | 13.49 | 9.70 | 1.06 | 10.91 | 0.89 |
| SNS | 15.55 | 20.32 | 18.19 | 0.85 | 4.69 | 0.77 |
| PSR | 84.46 | 95.90 | 91.91 | 1.80 | 1.96 | 0.78 |
| KNS | 3.11 | 4.31 | 3.70 | 0.22 | 5.89 | 0.65 |
| KNMS | 31.72 | 54.34 | 42.65 | 3.74 | 8.77 | 0.71 |
| KWMS | 31.72 | 54.34 | 42.65 | 3.74 | 8.77 | 0.24 |
| TKW | 35.45 | 50.32 | 41.98 | 2.71 | 6.45 | 0.81 |
| TW | 711.40 | 792.09 | 761.21 | 12.42 | 1.63 | 0.72 |
| Trait | GY | PH | SL | SNS | PSR | KNS | KNMS | KWMS | TKW |
|---|---|---|---|---|---|---|---|---|---|
| PH | −0.22 ** | ||||||||
| SL | 0.13 | 0.08 | |||||||
| SNS | −0.13 | 0.24 ** | 0.24 ** | ||||||
| PSR | 0.35 ** | −0.34 ** | −0.14 * | −0.22 ** | |||||
| KNS | 0.34 ** | −0.46 ** | 0.14 | −0.06 | 0.27 ** | ||||
| KNMS | 0.40 ** | −0.15 * | 0.27 ** | 0.37 ** | 0.26 ** | 0.64 ** | |||
| KWMS | 0.44 ** | −0.12 | 0.33 ** | 0.23 ** | 0.21 ** | 0.59 ** | 0.81 ** | ||
| TKW | 0.60 ** | −0.13 | 0.09 | −0.21 ** | 0.12 | 0.12 | 0.01 | 0.35 ** | |
| TW | 0.45 ** | −0.08 | 0.15 * | −0.16 * | 0.13 | 0.08 | −0.03 | 0.00 | 0.34 ** |
| Trait | Environment | SNP | Chromosome | Position (bp) |
|---|---|---|---|---|
| GY | E2, E7 | BS00109912_51 | chr7A | 653,949 |
| PH | E1, E5 | RAC875_rep_c112729_702 | chr7D | 8,344,704 |
| E5, E6 | Kukri_c31479_147 | chr5A | 569,989,461 | |
| E4, E5 | BS00081949_51 | chr7A | 734,538,957 | |
| E5, E7 | wsnp_Ex_c621_1231444 | chr5A | 591,156,150 | |
| E3, E5, E7 | RAC875_rep_c109969_119 | chr5A | 593,332,277 | |
| E3, E4, E5 | wsnp_Ex_c2185_4094843 | chr5A | 593,173,030 | |
| wsnp_Ex_c44164_50292954 | chr5A | 593,334,252 | ||
| wsnp_Ex_rep_c109532_92292121 | chr5A | 595,037,357 | ||
| BobWhite_c15758_79 | chr5A | 595,372,995 | ||
| Excalibur_c24051_502 | chr5D | 473,342,851 | ||
| GENE-2794_70 | chr5D | 473,794,273 | ||
| BS00066447_51 | chr5D | 473,795,001 | ||
| wsnp_RFL_Contig2265_1693968 | chr5D | 473,796,494 | ||
| E3, E5 | Excalibur_c31769_793 | chr5A | 592,636,579 | |
| Tdurum_contig29286_319 | chr5B | 585,001,363 | ||
| SL | E2, E7 | RAC875_c37934_285 | chr1A | 20,977,423 |
| IACX596 | chr2A | 165,849,288 | ||
| Tdurum_contig31037_205 | chr3A | 571,407,364 | ||
| Tdurum_contig11714_304 | chr3A | 585,937,902 | ||
| Tdurum_contig42087_1941 | chr4A | 277,890,095 | ||
| Ku_c9559_737 | chr5A | 8,243,302 | ||
| wsnp_Ku_c9559_15999945 | chr5A | 8,243,340 | ||
| Excalibur_c36501_188 | chr5A | 9,325,567 | ||
| Tdurum_contig10759_260 | chr5A | 573,813,835 | ||
| BS00109922_51 | chr6A | 4,678,762 | ||
| Excalibur_c37700_1016 | chr7A | 314,410,710 | ||
| wsnp_Ex_c7907_13427724 | chr6B | 118,967,499 | ||
| Kukri_c30551_400 | chr6B | 223,257,837 | ||
| Tdurum_contig35251_485 | chr6B | 226,361,465 | ||
| Excalibur_c36650_1557 | chr6B | 226,362,930 | ||
| CAP11_c763_391 | chr6B | 228,242,555 | ||
| Tdurum_contig45585_432 | chr7B | 700,818,624 | ||
| Tdurum_contig17062_665 | chr7B | 700,827,651 | ||
| Excalibur_c22642_90 | chr1D | 20,056,978 | ||
| BobWhite_c13718_682 | chr5D | 543,058,038 | ||
| D_GBB4FNX01C3F21_57 | chr6D | 471,002,720 | ||
| E4, E5 | Excalibur_c56319_61 | chr7A | 661,962,199 | |
| RAC875_c525_1372 | chr7B | 750,086,340 | ||
| RAC875_c104604_381 | chr2D | 637,425,446 | ||
| D_contig37514_120 | chr7D | 568,950,209 | ||
| tplb0049k01_89 | chr7D | 569,717,896 | ||
| Kukri_c22576_148 | chr7D | 570,647,452 | ||
| tplb0041e14_1096 | chr7D | 570,648,425 | ||
| Excalibur_c7895_385 | chr7D | 570,665,966 | ||
| D_GBB4FNX02ILZW2_114 | chr7D | 570,825,150 | ||
| BobWhite_c11549_468 | chr7D | 571,196,430 | ||
| Kukri_c101311_72 | chr7D | 571,255,045 | ||
| Kukri_c61816_202 | chr7D | 571,260,010 | ||
| D_contig25474_188 | chr7D | 571,717,776 | ||
| Excalibur_c16804_1108 | chr7D | 572,735,439 | ||
| tplb0057p21_1365 | chr7D | 573,433,563 | ||
| tplb0057p21_1042 | chr7D | 573,434,059 | ||
| E4, E6 | BobWhite_c22580_115 | chr4B | 604,051,170 | |
| E3, E4 | tplb0032k20_90 | chr7D | 16,153,942 | |
| PSR | E1, E7 | wsnp_Ex_c11827_18986376 | chr2A | 733,922,282 |
| E2, E7 | Kukri_c24962_123 | chr1A | 998,1126 | |
| BobWhite_c23632_322 | chr1A | 539,762,811 | ||
| RAC875_rep_c102485_468 | chr2A | 758,397,306 | ||
| Ra_c108749_837 | chr4A | 70,798,652 | ||
| wsnp_Ex_rep_c66426_64644630 | chr4A | 70,813,286 | ||
| wsnp_Ku_c49919_55679171 | chr4A | 71,253,251 | ||
| BobWhite_c35402_66 | chr4A | 614,241,032 | ||
| BS00045284_51 | chr5A | 109,342,918 | ||
| BS00080365_51 | chr7A | 537,058,999 | ||
| BobWhite_c19554_544 | chr2B | 637,574,105 | ||
| RAC875_c6921_1276 | chr3B | 556,682,737 | ||
| Excalibur_c49685_207 | chr7B | 744,260,654 | ||
| Kukri_c36429_687 | chr5D | 329,195,114 | ||
| KNS | E4, E7 | Kukri_c56494_585 | chr6A | 425,737,504 |
| KNMS | E2, E7 | Tdurum_contig35492_150 | chr2B | 647,109,508 |
| E2, E6 | Tdurum_contig4885_1307 | chr7A | 68,049,240 | |
| Tdurum_contig4885_1833 | chr7A | 68,049,666 | ||
| TKW | E2, E7 | RAC875_rep_c105041_121 | chr7A | 92,892,087 |
| Ex_c6196_971 | chr7A | 92,892,096 | ||
| Excalibur_c6196_668 | chr7A | 92,892,399 | ||
| RFL_Contig2200_1024 | chr7A | 93,036,212 | ||
| wsnp_Ex_c20062_29096408 | chr7A | 93,077,341 | ||
| Tdurum_contig13784_824 | chr5B | 451,179,330 | ||
| RAC875_rep_c105584_237 | chr7B | 43,881,084 | ||
| Kukri_c20975_765 | chr7D | 101,580,773 | ||
| Tdurum_contig49575_1237 | chr7D | 621,647,564 | ||
| TW | E2, E3 | IAAV3049 | chr1D | 384,511,578 |
| E2, E7 | GENE-1389_396 | chr2D | 109,700,911 |
Disclaimer/Publisher’s Note: The statements, opinions and data contained in all publications are solely those of the individual author(s) and contributor(s) and not of MDPI and/or the editor(s). MDPI and/or the editor(s) disclaim responsibility for any injury to people or property resulting from any ideas, methods, instructions or products referred to in the content. |
© 2023 by the authors. Licensee MDPI, Basel, Switzerland. This article is an open access article distributed under the terms and conditions of the Creative Commons Attribution (CC BY) license (https://creativecommons.org/licenses/by/4.0/).
Share and Cite
Tian, Y.; Liu, P.; Cui, F.; Xu, H.; Han, X.; Nie, Y.; Kong, D.; Sang, W.; Li, W. Genome-Wide Association Study for Yield and Yield-Related Traits in Chinese Spring Wheat. Agronomy 2023, 13, 2784. https://doi.org/10.3390/agronomy13112784
Tian Y, Liu P, Cui F, Xu H, Han X, Nie Y, Kong D, Sang W, Li W. Genome-Wide Association Study for Yield and Yield-Related Traits in Chinese Spring Wheat. Agronomy. 2023; 13(11):2784. https://doi.org/10.3390/agronomy13112784
Chicago/Turabian StyleTian, Yousheng, Pengpeng Liu, Fengjuan Cui, Hongjun Xu, Xinnian Han, Yingbin Nie, Dezhen Kong, Wei Sang, and Weihua Li. 2023. "Genome-Wide Association Study for Yield and Yield-Related Traits in Chinese Spring Wheat" Agronomy 13, no. 11: 2784. https://doi.org/10.3390/agronomy13112784