Article

Feasibility of Detecting Sweet Potato (Ipomoea batatas) Virus Disease from High-Resolution Imagery in the Field Using a Deep Learning Framework

1
College of Electronic Engineering (College of Artificial Intelligence), South China Agricultural University, Guangzhou 510642, China
2
Crops Research Institute, Guangdong Academy of Agricultural Sciences/Key Laboratory of Crop Genetic Improvement of Guangdong Province, Guangzhou 510640, China
*
Authors to whom correspondence should be addressed.
Agronomy 2023, 13(11), 2801; https://doi.org/10.3390/agronomy13112801
Submission received: 10 October 2023 / Revised: 25 October 2023 / Accepted: 31 October 2023 / Published: 13 November 2023
(This article belongs to the Section Precision and Digital Agriculture)

Abstract

:
The sweet potato is an essential food and economic crop that is often threatened by the devastating sweet potato virus disease (SPVD), especially in developing countries. Traditional laboratory-based direct detection methods and field scouting are commonly used to rapidly detect SPVD. However, these molecular-based methods are costly and disruptive, while field scouting is subjective, labor-intensive, and time-consuming. In this study, we propose a deep learning-based object detection framework to assess the feasibility of detecting SPVD from ground and aerial high-resolution images. We proposed a novel object detector called SPVDet, as well as a lightweight version called SPVDet-Nano, using a single-level feature. These detectors were prototyped based on a small-scale publicly available benchmark dataset (PASCAL VOC 2012) and compared to mainstream feature pyramid object detectors using a leading large-scale publicly available benchmark dataset (MS COCO 2017). The learned model weights from this dataset were then transferred to fine-tune the detectors and directly analyze our self-made SPVD dataset encompassing one category and 1074 objects, incorporating the slicing aided hyper inference (SAHI) technology. The results showed that SPVDet outperformed both its single-level counterparts and several mainstream feature pyramid detectors. Furthermore, the introduction of SAHI techniques significantly improved the detection accuracy of SPVDet by 14% in terms of mean average precision (mAP) in both ground and aerial images, and yielded the best detection accuracy of 78.1% from close-up perspectives. These findings demonstrate the feasibility of detecting SPVD from ground and unmanned aerial vehicle (UAV) high-resolution images using the deep learning-based SPVDet object detector proposed here. They also have great implications for broader applications in high-throughput phenotyping of sweet potatoes under biotic stresses, which could accelerate the screening process for genetic resistance against SPVD in plant breeding and provide timely decision support for production management.

1. Introduction

Sweet potato (Ipomoea batatas (L.) Lam.) is a significant economic crop and ranks as the fifth most important food crop in the tropics and seventh in worldwide food production, following wheat, rice, maize, potato, barley, and cassava. Sweet potatoes are utilized as food, animal feed, and traditional medicine globally, with all parts of the plant, including roots, vines, and young leaves, being used. China is the largest producer of sweet potatoes, accounting for 29.8% of the total harvested area and 53.8% of worldwide production (FAOSTAT, 2021) [1]. However, sweet potato crops are frequently affected by a complex of potyviruses, along with other potential unknown viruses, resulting in yield reductions of approximately 20 to 40% on average [2,3]. The most detrimental disease of sweet potatoes is sweet potato virus disease (SPVD) [4], which is caused by the synergistic interaction between the whitefly-transmitted crinivirus called sweet potato chlorotic stunt virus (SPCSV) and the aphid-transmitted potyvirus known as sweet potato feathery mottle virus (SPFMV). SPVD can lead to more than an 85% reduction in tuber yield compared to the mild symptoms caused by individual viral infections [5]. Currently, the most effective measure to manage SPVD in farmer fields is the use of clean planting material [6]. Genetic resistance against SPVD is not yet available. Eliminating virus-infected plants from fields can remove virus inoculum for insect vectors, thereby reducing the secondary spread of the virus [7]. Therefore, it is crucial to identify virus-infected plants in fields using sensitive and high-throughput detection methods to effectively detect and eradicate infected plants.
Plant virus disease detection methods [8] can be categorized into laboratory-based direct testing methods, such as enzyme-linked immunosorbent assay (ELISA) and polymerase chain reaction (PCR) methods, and indirect testing methods, such as traditional field scouting with visual assessment and recently popular optical sensing methods. Although direct methods are reliable and accurate, they are expensive, time-consuming, and destructive. Visual assessment by human observers is susceptible to bias due to varying levels of experience and optical illusions. Notably, the advancement of remote and proximal optical sensors, high-throughput phenotyping, and advanced digital image processing through deep learning, together with the widespread availability of computational infrastructure and resources, offers a promising solution to the challenges of rapid plant disease detection [9,10,11,12,13]. This sensing technology provides rapid and non-destructive alternatives to molecular techniques for plant disease detection and enhances the objectivity of field-based visual assessment. Additionally, thanks to the tremendous success achieved by deep neural networks in computer vision tasks, numerous studies have demonstrated the feasibility and efficiency of identifying and classifying multiple plant diseases at the leaf level using visible images [14,15,16,17,18]. However, to the best of our knowledge, no study has focused on identifying and detecting sweet potato plants under the biotic stress of SPVD in the field using deep learning algorithms with visible images.
Generic object detection is a crucial computer vision task that aims to determine the presence of objects from predefined specific categories in an image, such as cars, animals, leaves, or plants. It not only classifies objects but also predicts their spatial location and size [19,20]. Recently, single-stage object detectors, like the you only look once (YOLO) series [21], have gained popularity due to their scalability and real-time inference speed. A number of studies have utilized these detectors to improve the detection performance of various plant diseases using private datasets. For instance, Chen et al. [22] enhanced the detection performance of YOLOv5 on leaf diseases of rubber trees by incorporating an additional attention mechanism and replacing the localization loss function. Similarly, Ma et al. [23] employed an improved version of YOLOv5n to identify three common leaf diseases of maize by adding an attention module and modifying the detection head. Mao et al. [24] also improved the YOLOX [25] to detect wheat disease severity by introducing an attention module, using a different type of convolution in the detection head, and changing the localization loss function. Furthermore, Liu et al. [26] reported the enhancement of YOLOX in detecting tomato leaf diseases by augmenting the dataset, replacing the original backbone, modifying the classification loss function, and inserting an attention module between the backbone and the neck. These examples demonstrate the effectiveness of employing ground leaf-level RGB (red–green–blue) images in the deep learning framework for plant disease detection. However, these studies have only adapted existing mainstream object detectors at a modular level, lacking a systematic and comprehensive design. Moreover, while UAV-based approaches have been employed to monitor over 80 plant diseases, with a focus on leaf diseases and fungal diseases [27,28], to the best of our knowledge, no study has been conducted to detect SPVD using either UAV aerial images or ground images.
A number of challenges exist in detecting SPVD from RGB images using object detection networks. These challenges pertain to various aspects. To address these challenges, we propose a novel object detector for SPVD named SPVDet, as well as its lightweight version called SPVDet-Nano. SPVDet and SPVDet-Nano employ a single-stage anchor-free architecture, which enables real-time detection. They consist of a backbone as the feature extractor, a feature aggregation module, and a detection head that produces final predictions of object categories and localizations. In contrast to mainstream architectures like RetinaNet [29], FCOS [30], YOLOv3 [31], and YOLOv4 [32] that employ a feature pyramid design, SPVDet and SPVDet-Nano redesign the feature aggregation module using a single-level feature, as proposed in YOLOF [33] and CC-Det [34]. This modification has been demonstrated to achieve a better trade-off between performance and speed. Furthermore, the conventional decoupled detection heads are enhanced in SPVDet and SPVDet-Nano by introducing the unified attention mechanism [35] to optimize the network predictions. Furthermore, to determine the optimal component combination and hyperparameters of SPVDet, we conduct a series of ablation studies on a small-scale benchmark dataset, PASCAL VOC [36]. In contrast to current plant disease studies that only report improved performance on self-made datasets, we follow the computer vision tradition and evaluate the performance of SPVDet and SPVDet-Nano on a publicly available large-scale benchmark dataset, MS COCO [37], to provide fair comparisons with previous works. Since there are no available datasets for SPVD detection, we collect an empirical dataset covering two varieties of sweet potato and encompassing ground and UAV aerial sensing images from two different places. To avoid significant accuracy drops when inferring on high-resolution images, we introduce slicing aided hyper inference (SAHI) technologies [38]. We then verify the feasibility of detecting SPVD from ground and UAV aerial high-resolution images using our proposed object detectors, SPVDet and SPVDet-Nano. In summary, the proposed SPVDet and SPVDet-Nano integrate advanced computer vision techniques into the solution of fast and accurate SPVD detection. The contributions of this study are as follows:
  • We propose a novel, fast, one-stage, anchor-free object detector, SPVDet, and its scaled lightweight variant, SPVDet-Nano, which utilizes a single-level feature for simplicity and effectiveness.
  • We introduce a bundle of slicing aided hyper inference (SAHI) technologies to bridge the performance gap when inferring on high-resolution images.
  • We conduct extensive ablation studies and comparison experiments on benchmark datasets and our self-made SPVD dataset, demonstrating the advancements of SPVDet and SPVDet-Nano, and the feasibility of SPVD detection from ground and aerial RGB images, respectively.

2. Materials and Methods

2.1. Datasets

2.1.1. PASCAL Visual Object Classes (VOC) Challenge 2007 and 2012

PASCAL VOC 2007 [36] is a widely used benchmark dataset for small-scale object detection tasks. It comprises 20 object classes that are categorized into four groups: person (person), animal (bird, cat, cow, dog, horse, sheep), vehicle (airplane, bicycle, boat, bus, car, motorbike, train), and indoor (bottle, chair, dining table, potted plant, sofa, tv/monitor). The dataset was expanded in PASCAL VOC 2012, resulting in a total of 16,551 training images. Each training image is accompanied by an annotation file that provides bounding box coordinates and object class labels for each object within the twenty categories. The evaluation of the detector’s performance is carried out on the 4962 images in the PASCAL VOC 2007 test set. The primary quantitative measure used is the average precision (AP), which represents the overlap between the predicted bounding box and the ground truth bounding box. For a detection to be considered correct, the overlap must be greater than 0.5. Any additional detections that are not correct are counted as false detections. The mean average precision (mAP) is calculated as the average precision over all object categories, according to this evaluation protocol.

2.1.2. Microsoft Common Objects in Context (MS COCO) 2017
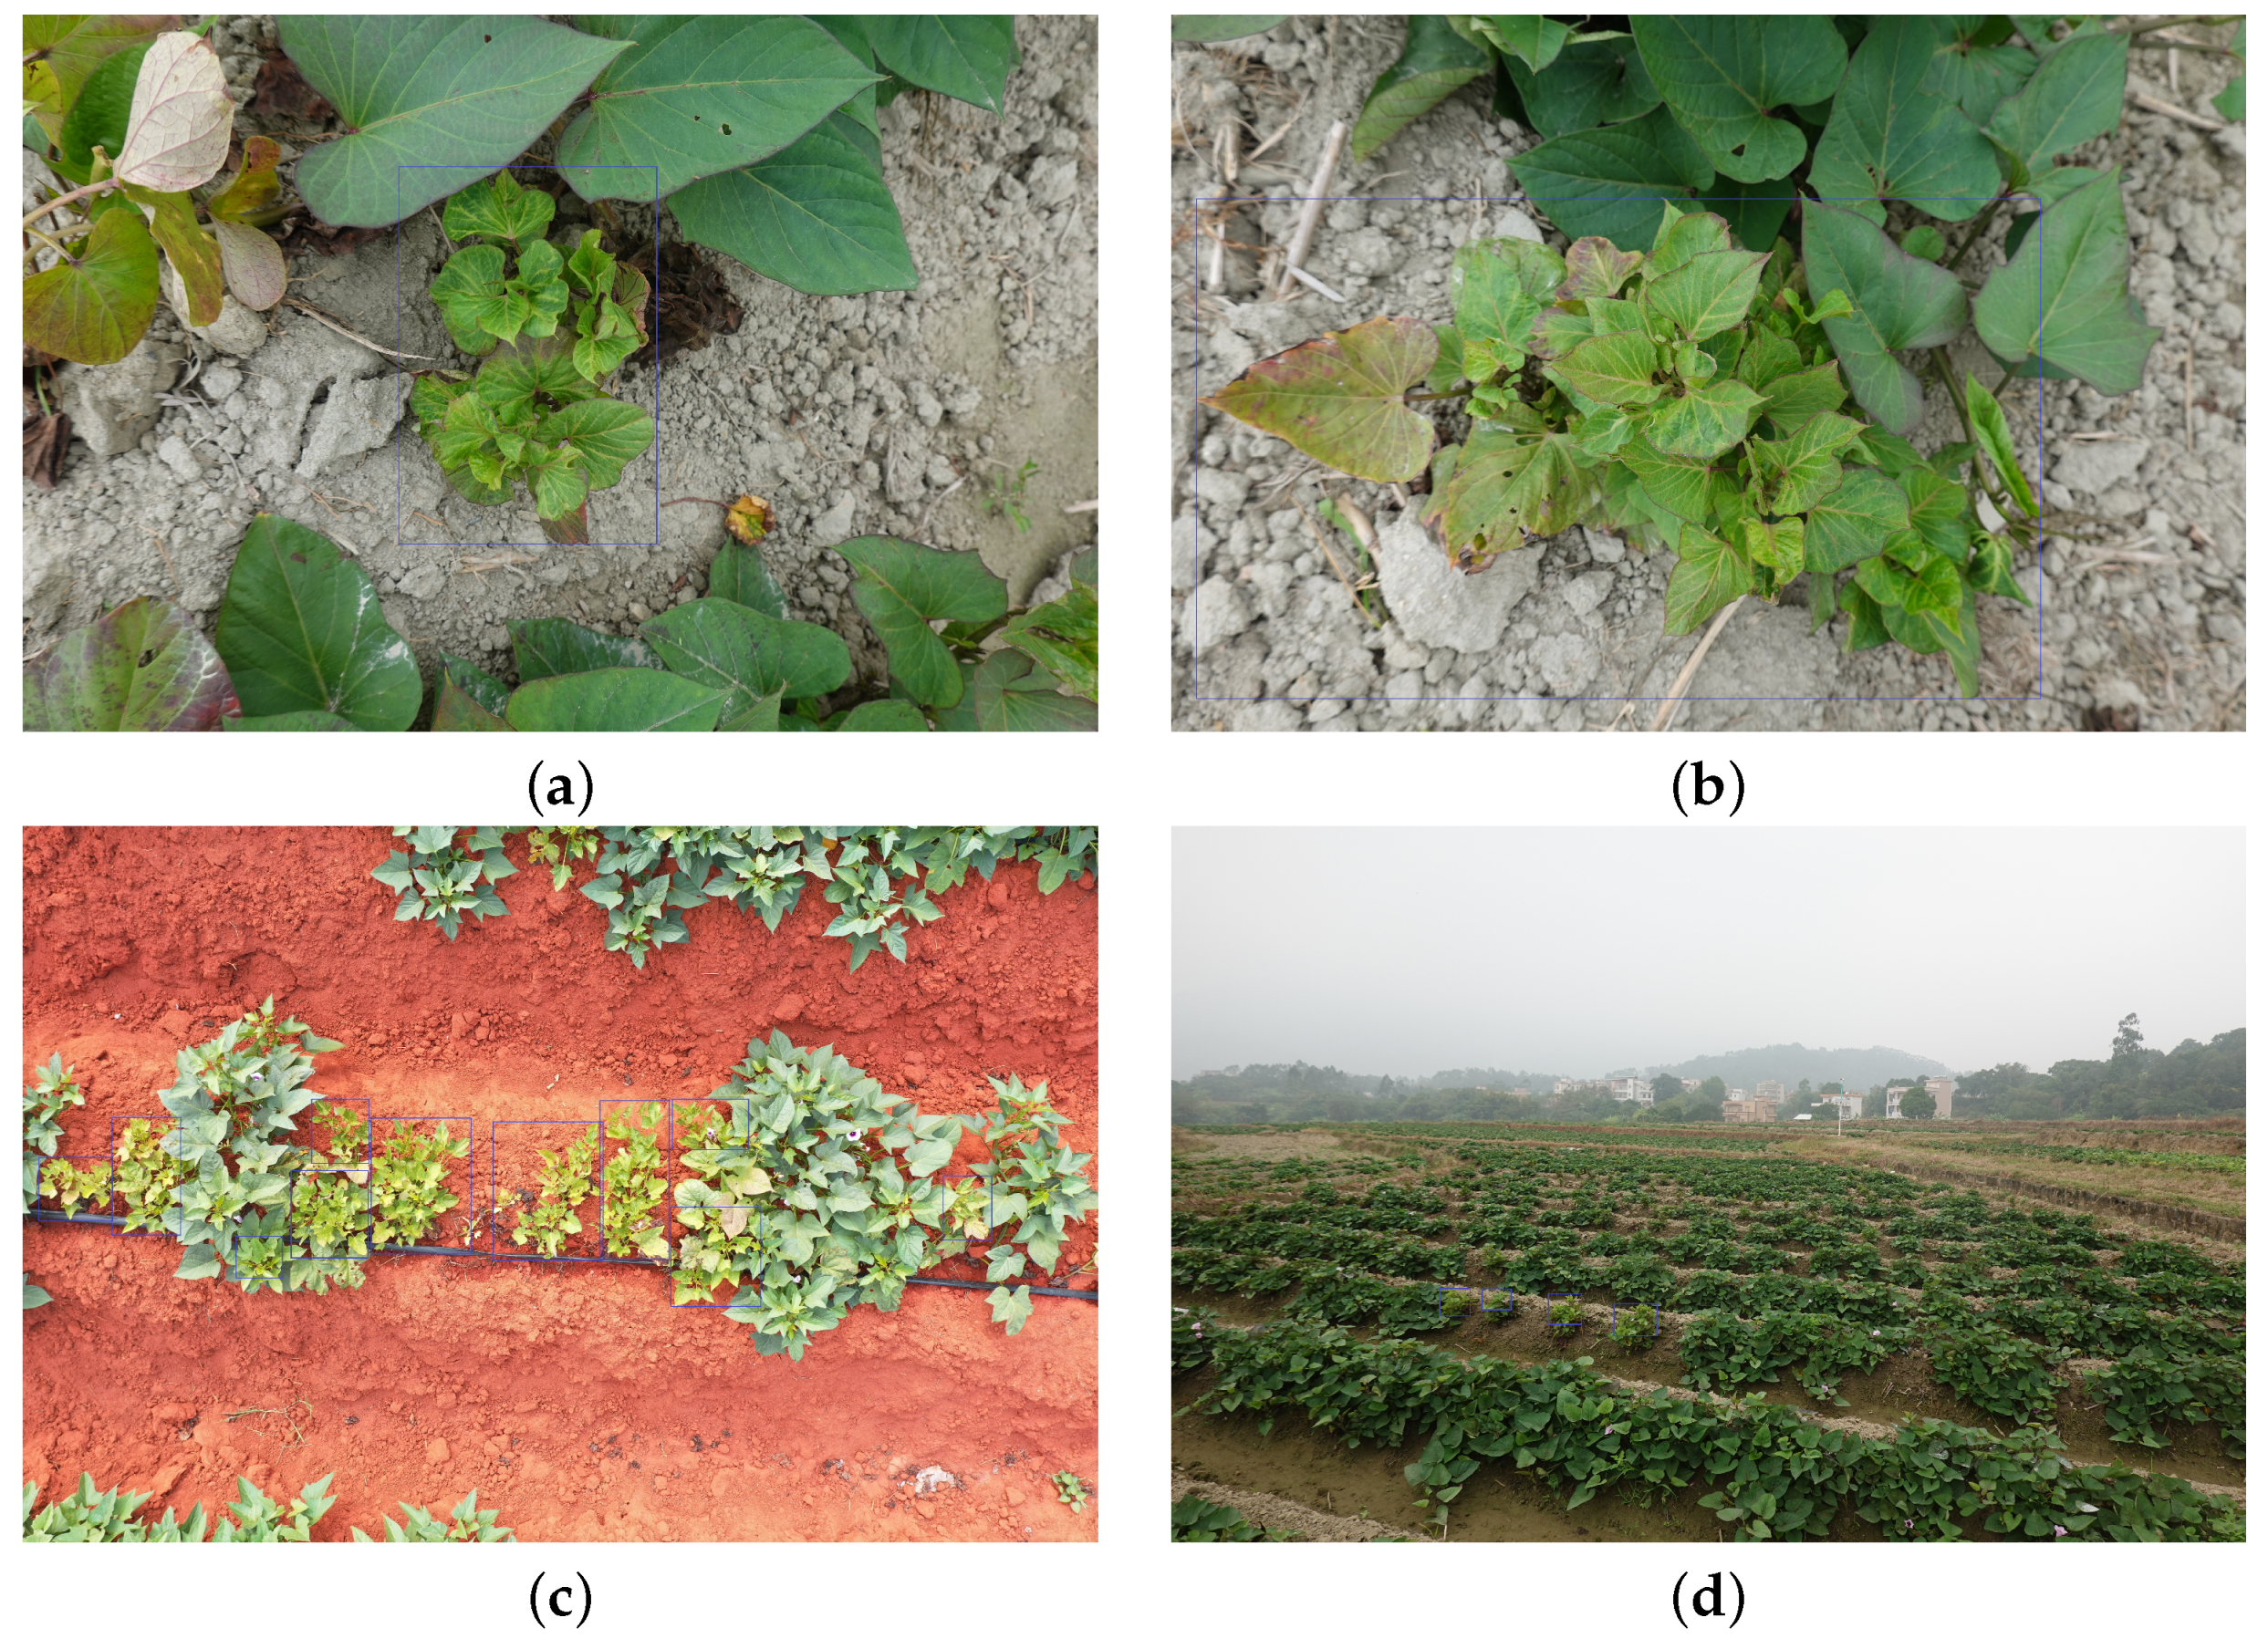
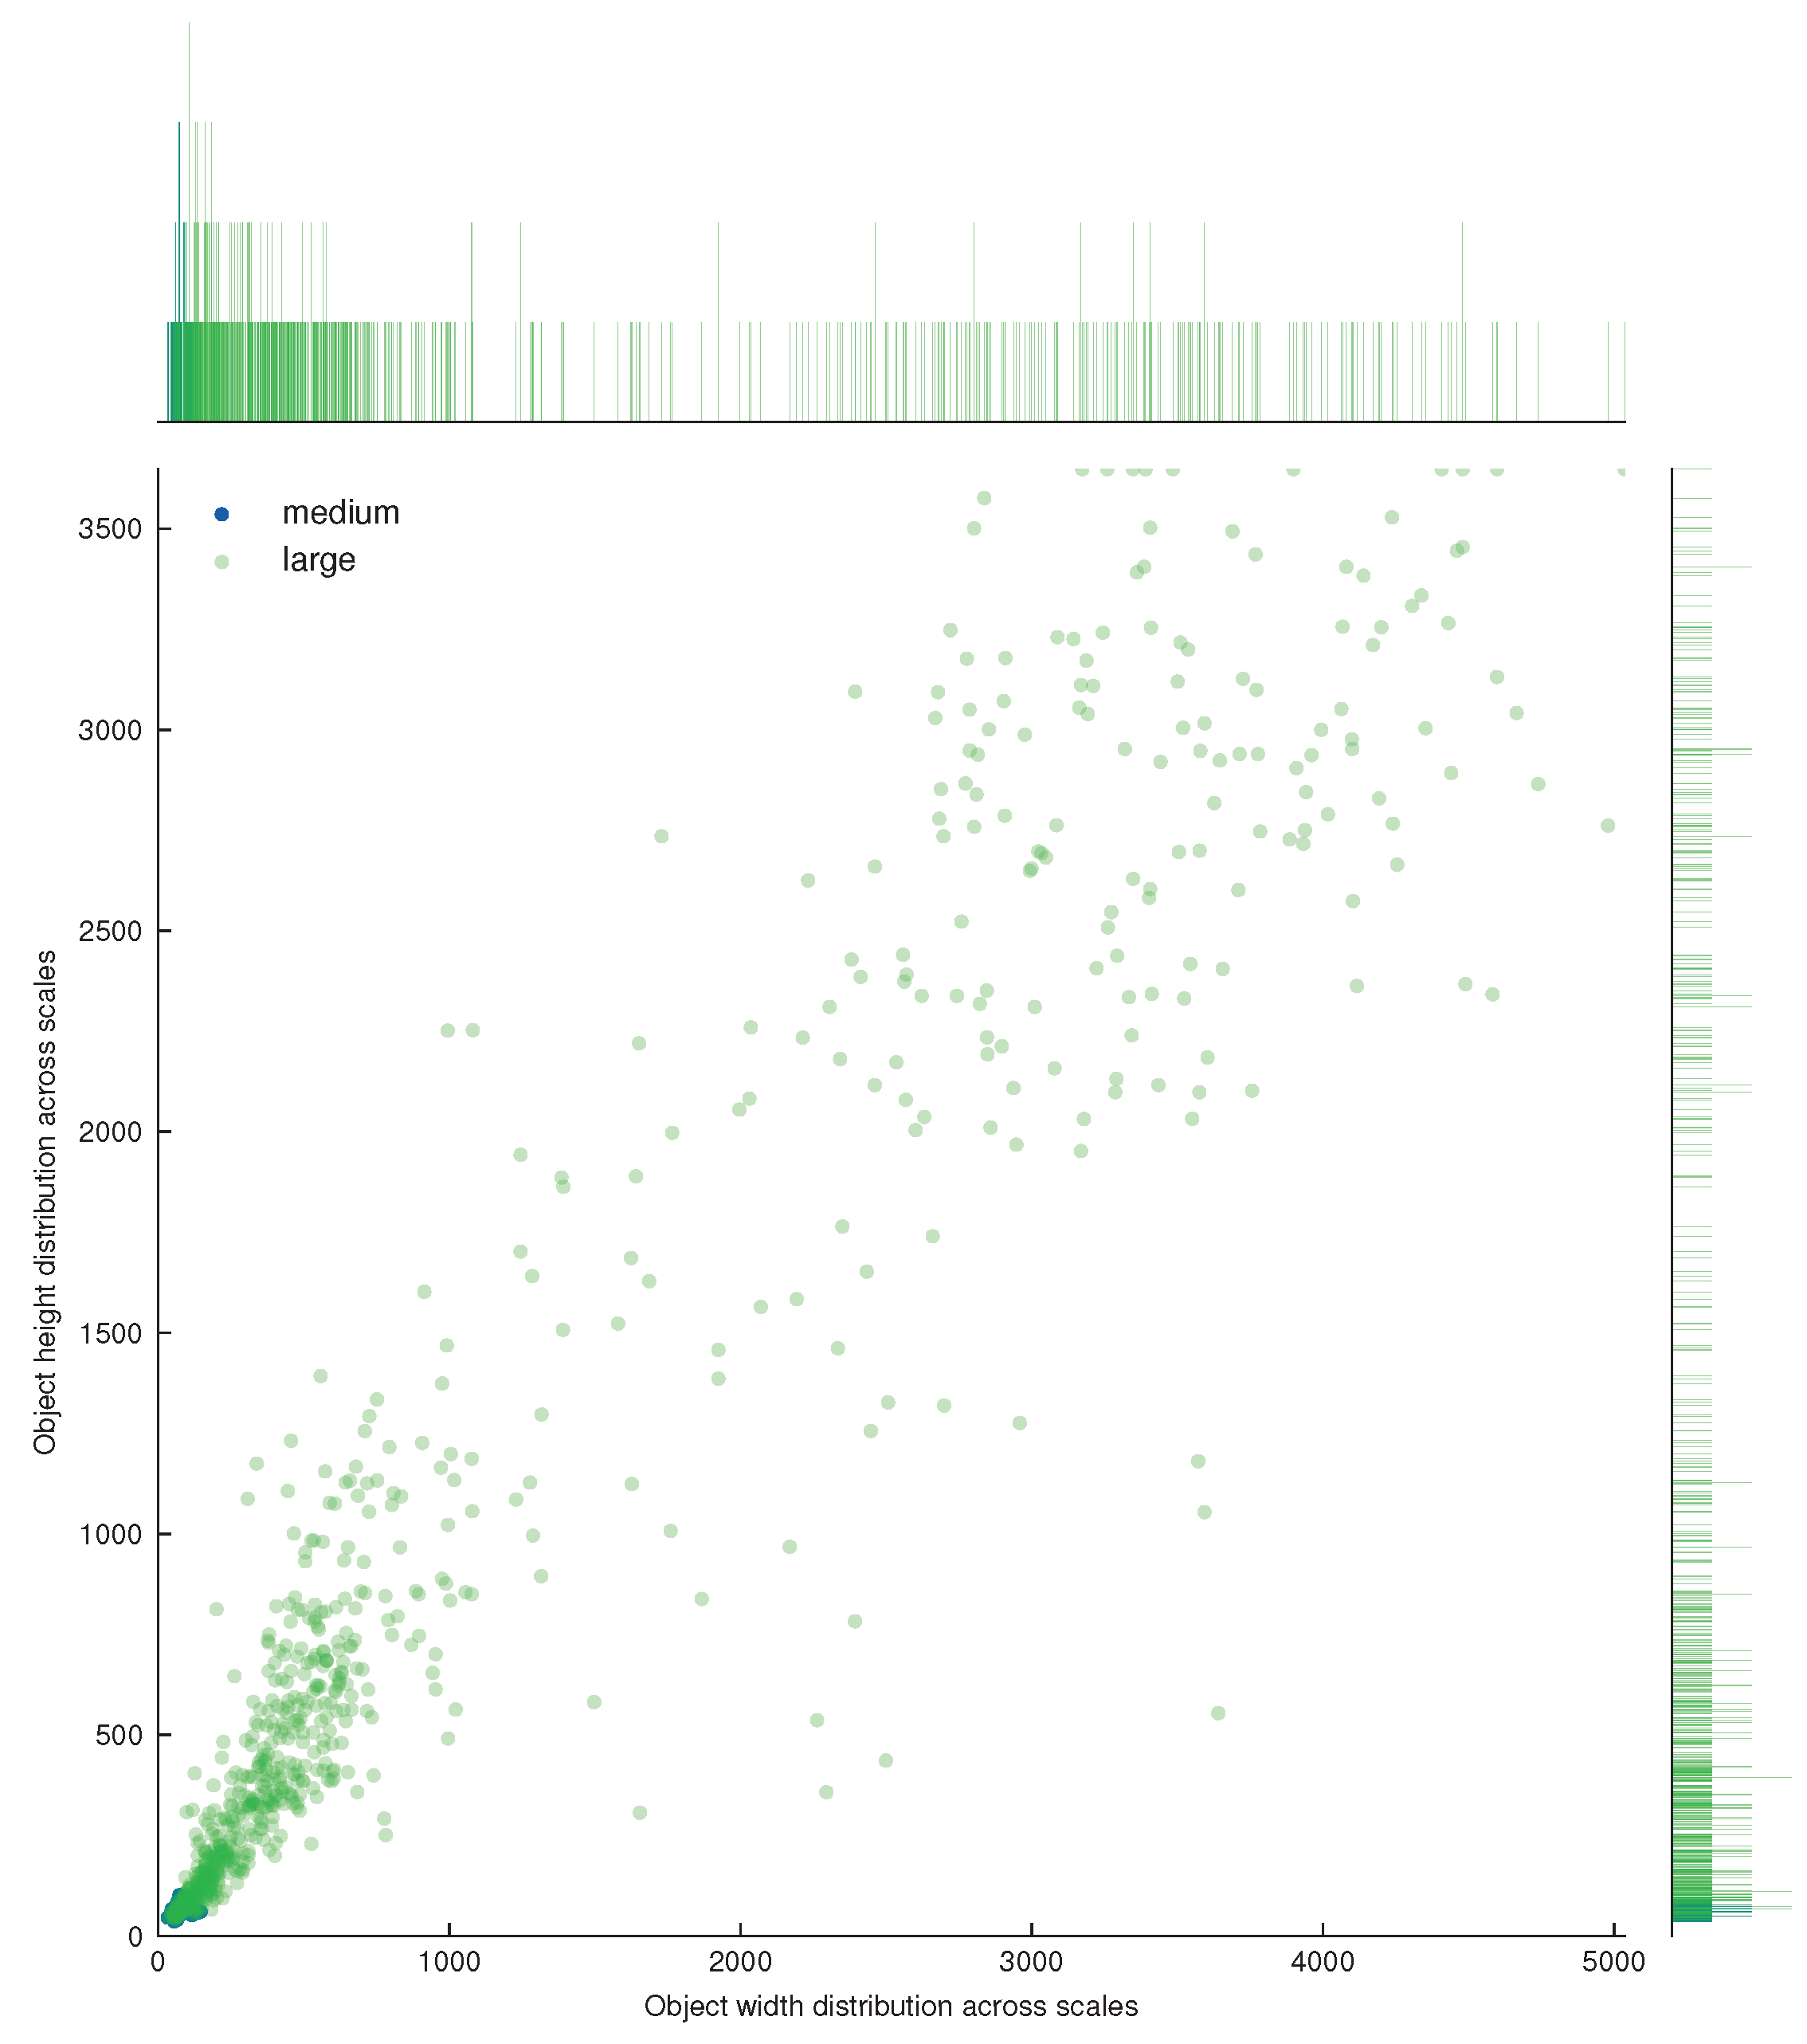
Microsoft Common Objects in Context (MS COCO) 2017 [37] is the leading large-scale benchmark dataset for generic object detection tasks. It is specifically designed to detect objects in their natural context. Compared to the PASCAL VOC dataset, MS COCO contains a larger number of categories and instances, with objects generally being smaller. This enables the training of more complex models capable of accurate localization. The object detection sub-dataset of MS COCO consists of 80 categories and includes 115,000 training images, 5000 validation images, and 20,000 test images that are not publicly accessible. To evaluate the performance of detectors on this dataset, submissions must be made to MS COCO’s evaluation server for independent evaluation. Unlike PASCAL VOC, the MS COCO evaluation measure is computed over 10 overlap threshold values, ranging from 0.5 to 0.95 in increments of 0.05. This rewards detectors that perform better in terms of localization accuracy. The metric allows for a maximum of 100 top-scoring detections per image. Given the presence of more small objects than large objects in the dataset, MS COCO also provides further distinctions based on the size of the objects: small (less than 32 × 32 pixels), medium (between 32 × 32 and 96 × 96 pixels), and large (greater than 96 × 96 pixels).

2.1.3. SPVD Dataset

Given the absence of a publicly available dataset for SPVD assessment, we gathered and constructed an RGB image dataset specifically for the SPVD detection task in various field conditions. This dataset covers perspectives taken from ground hand-held digital cameras and unmanned aerial vehicles (UAVs). To ensure the viability of quantitatively assessing SPVD in the field, we collected a total of 333 high-resolution RGB images in JPEG format (5472 × 3648 pixels) as shown in Figure 1. These images were captured using a hand-held SONY DSC-RX100M6 digital camera (Sony Group Corporation, Tokyo, Japan), employing a close-up and horizontal scanning perspective, as well as a DJI Mavic 2 Pro UAV (DJI Innovation Technology Co., Shenzhen, China) equipped with a Hasselblad L1D-20c camera. To capture the most detailed information regarding SPVD detection, we obtained 272 close-up digital camera images manually in farmland (Figure 1a,b), guided by a phytopathologist. Additionally, we collected an additional subset of 12 images from the same field using the digital camera. These images were captured from an overlook view (Figure 1d). Furthermore, we captured 49 bird’s-eye view images of plants through the UAV in a different farm field (Figure 1c). The UAV was manually controlled, and the pictures were taken at a height of 10 m above ground level (the ground sampling distance (GSD) is 0.24 cm per pixel) within one experimental plot. As the UAV flies at a higher altitude, it can perceive a wider line of sight but at the cost of lower spatial resolution, which can hinder the representation and generalization abilities of image-based deep learning models. Notably, the local variety “Fragrant Pink Potato” which had been planted for 50–60 days, exhibited the typical SPVD symptoms of plant dwarfing and crumpling, belonging to the late stage of virus infestation. These symptoms facilitated the collection of photographic data and the construction of the model in this study.
In-field phenotypic signs of dwarfing and yellowing of sweet potato plants resemble typical symptoms of SPVD, and all collected photographic data were identified by expert phytopathologists. For the disease samples from Maoming and Zhanjiang (as shown in Figure 1), a method of simultaneous detection and differentiation of four closely related sweet potato potyviruses by a multiplex one-step RT-PCR was performed. The detection results confirmed the existence of SPVD-related pathogens, demonstrating that the dataset taken for modeling analysis in this study could be applicable for SPVD detection. To annotate the plants under SPVD stress with the label “Positive”, we employed the open source computer vision annotation tool (CVAT) server version 2.0. The images from different perspectives were then recursively split into training and testing subsets in a 4:1 ratio, until finally yielding the training, validation, and testing subsets. The structure of the finalized SPVD dataset is outlined in Table 1, and the object distribution in terms of width and height within the training set is illustrated in Figure 2. Although the primary objective of constructing this SPVD dataset was to assess its feasibility, it has the potential to have a significant impact and provide insights for various derived applications. For instance, successful detection from the close-up view of plants implies the potential use of smartphone applications or in-field monitoring devices for SPVD detection and severity assessment. The same holds true for the overlook view. The bird’s-eye view of sweet potato plants can serve as an effective remote sensing medium for large-scale field studies pertaining to SPVD assessment.
This section provides an overview of the motivation and context for utilizing each dataset mentioned above in further model development. Initially, the SPVDet architecture was rapidly prototyped, including conducting ablation studies, by training and exploring various variants of SPVDet using the small-scale benchmark VOC dataset. Once the core components of SPVDet were determined, extensive training was conducted on the large-scale benchmark COCO dataset from scratch. This training aimed to acquire generalized representations of generic objects and evaluate the detection performance by comparing it with other models. The COCO dataset played a crucial role in facilitating a fair comparison with previous works and verifying the advancements made by the SPVDet model. Furthermore, the COCO dataset’s learned model weights were fine-tuned for the specialized SPVD dataset, which focuses on SPVD detection, in order to verify the effectiveness of introducing a bundle of SAHI technologies. It is worth noting that deep learning-based algorithms typically require as large a dataset as possible to learn more generalized representations. Therefore, transfer learning [39,40,41] was employed. Instead of constructing a large-scale SPVD dataset, the publicly available ImageNet-1k dataset, which contains millions of images encompassing 1000 categories, was leveraged to pre-train the backbones of SPVDet in order to learn better generalized feature representations. The ImageNet pre-trained backbones of SPVDet were then incorporated into the training procedure of the COCO dataset to specialize and strengthen the ability of generic object classification and localization. Finally, the COCO pre-trained SPVDet model was fine-tuned using the SPVD dataset to explicitly enhance the SPVD detection ability under real field conditions.

2.2. Proposed Method

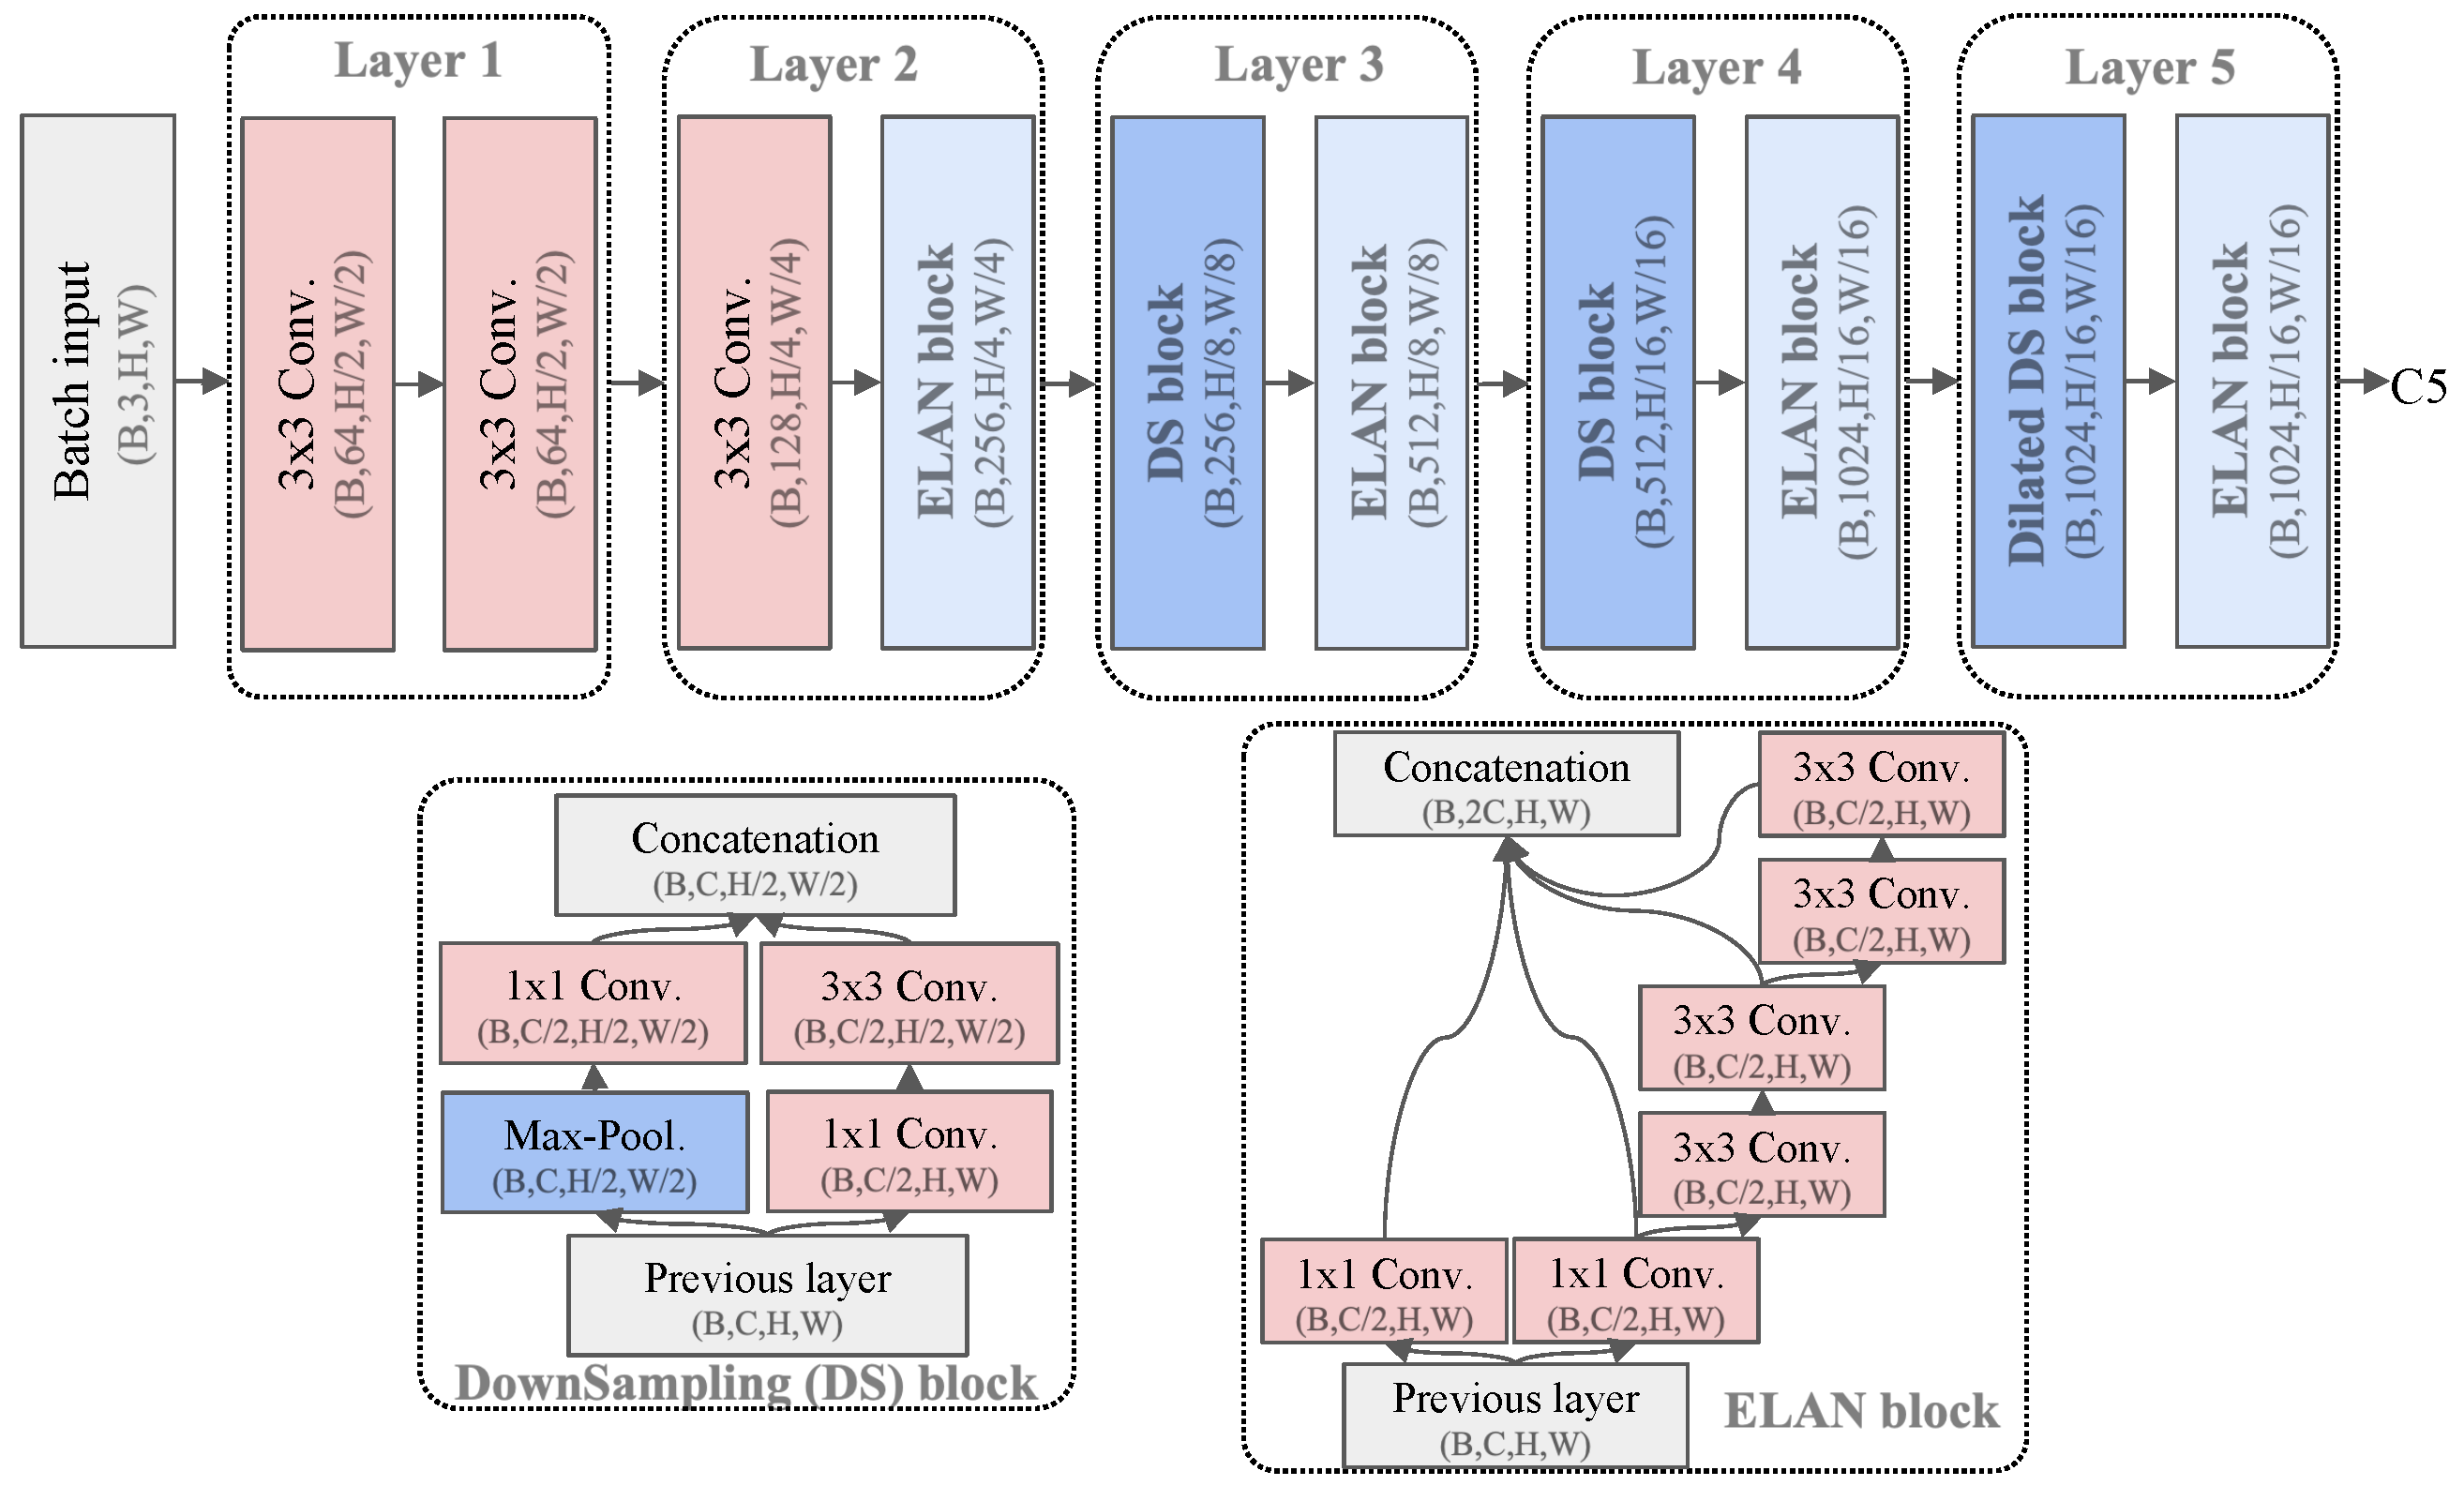
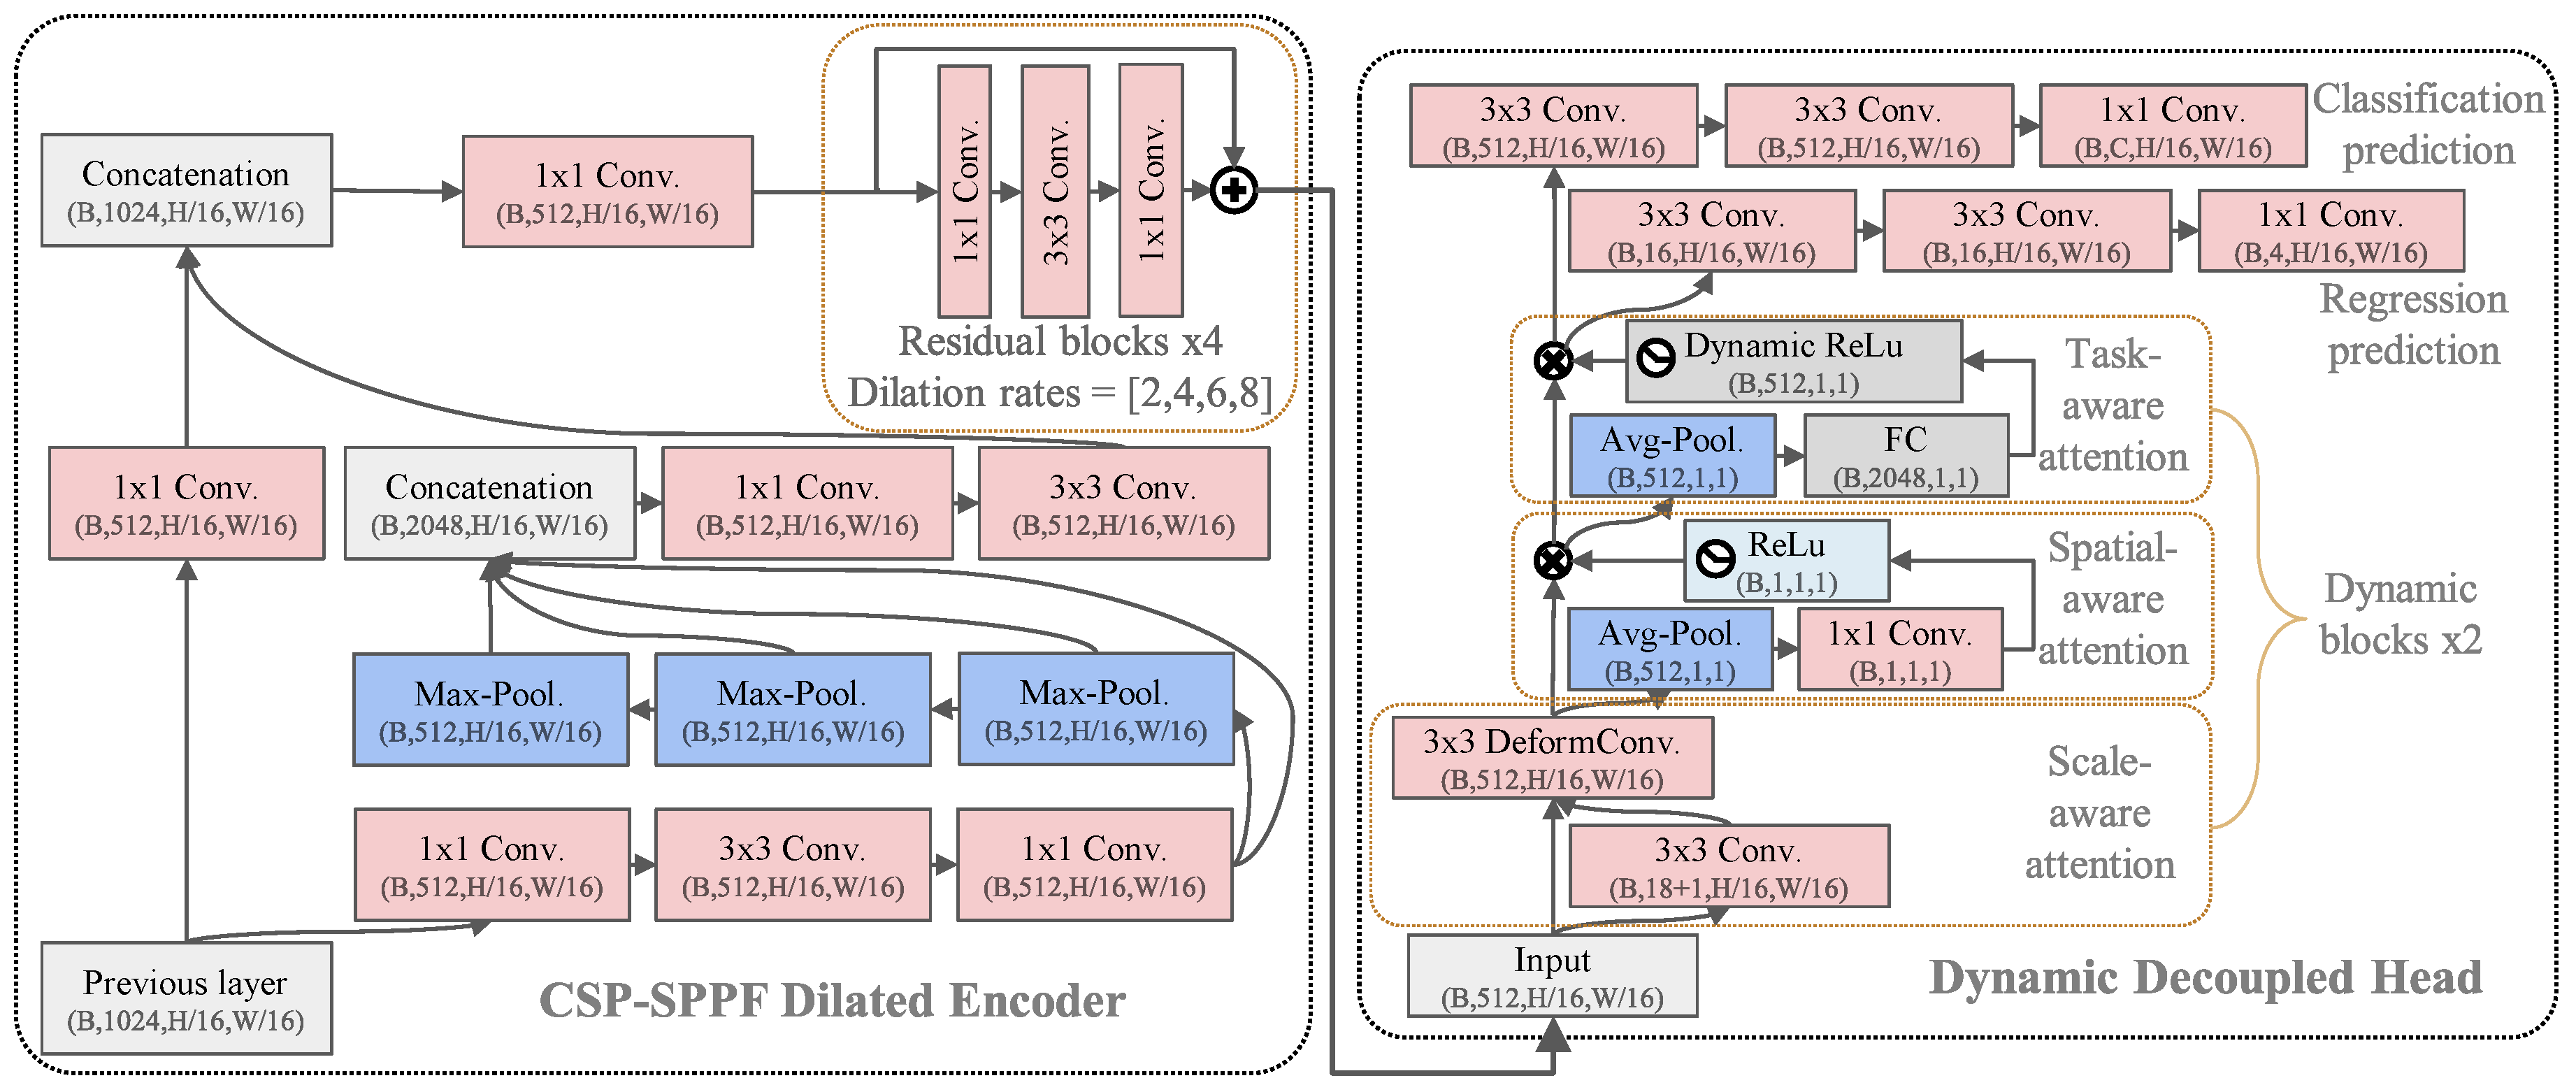
2.2.1. Systematic Designs of SPVDet

Following the design paradigm of one-stage generic object detectors, the SPVDet (shown in Figure 3) can be divided into three core parts: backbone, feature aggregation module, and detection head. The proven and renowned backbones of generic detectors, such as ResNet and the YOLO series (e.g., ResNet-50 [42], CSPDarkNet [32], ELANNet (YOLOv7) [43], and CSPELANNet (YOLOv8), are included. The ImageNet-1k pre-trained weight of the best-performing backbone was used to train the MS COCO dataset, which differs from the routine schedule of training from scratch adopted in the YOLO series. The vanilla dilated encoder from YOLOF [33] was adopted as the starting point to explore its functionality as a feature aggregation module. Additionally, the vanilla decoupled head from YOLOX [25] was utilized as a preliminary detection head. As the SPVDet is designed to be free from anchor priors, task alignment learning, which adaptively assigns sample points and corresponding weights, was adopted to yield task-aligned predictions.
Backbone: The backbone is the largest and most essential component of the model, as it accounts for most of the computation complexity and memory usage. It also determines the generalization ability of the feature extraction process from input images. Therefore, it is crucial for the backbone to learn from numerous images across different categories. In this study, we used the ImageNet-1k pre-trained weights of the backbone as our feature extractor for the subsequent detection tasks on the PASCAL VOC and MS COCO datasets. We selected four representative backbones as alternative options, all of which have the same hierarchical architecture that is commonly favored by one-stage detectors. Notably, we decided to keep the single output from the last stage (C5) for the subsequent feature aggregation module, which distinguishes our approach from mainstream feature pyramid detectors that utilize multi-level outputs from various stages. However, as previous work has pointed out, the C5 feature map suffers from information loss of small objects due to its low-resolution and excessive channels, leading to extensive computation overhead. To overcome these issues, we applied a dilated operation to the last layer, which upsamples its spatial resolution by a dilation ratio of 2 and reduces the number of channels by half. The detailed components and tensor flow in the backbone adopted in the SPVDet are illustrated in Figure 4. The dilated output is then fed into the subsequent feature aggregation module as input.
Feature aggregation module: The receptive field of a single-level input can only cover a limited range of scales. To address this limitation, the dilated encoder, as proposed in previous work [33], was utilized to generate output features with multiple receptive fields by stacking standard and dilated convolutions. This module consists of two parts: the projector, which reduces the channel dimension and refines semantic contexts, and four residual blocks. Instead of using the original projector structure, we replaced it with a cross-stage partial-spatial pyramid pooling (CSP-SPP) module. Inspired by the neck design of the YOLO series, we introduced the fast implementation of the SPP module (SPPF) into our SPVDet model to further enrich the feature representation by integrating local and global feature maps. The detailed structure of the CSP-SPP module is illustrated on the left side of Figure 5. The feature aggregation result is then used as input for the detection head module to generate predictions.
Detection head: The detection head is responsible for making high-quality predictions for both classification and localization, which can often be conflicting tasks. To resolve this issue, the decoupled head, as proposed in previous work, was introduced to enhance performance by using two parallel branches. Additionally, in a single image, multiple objects with vastly distinct scales, shapes, locations, viewpoints, and representations often co-exist, posing a challenge for the detection head to distinguish and address all these problems simultaneously. To tackle this challenge, we introduced a unified attention mechanism, called the dynamic head [35]. The detailed structure is illustrated on the right side of Figure 5. This mechanism formulates a unified head for maximizing its improvement and consists of three consecutive components: scale-aware attention, spatial-aware attention, and task-aware attention. The scale-aware attention helps learn the relative importance of semantic discrepancies to adaptively enhance the corresponding feature for an individual object based on its scale. Next, the spatial-aware attention focuses on discriminative regions consistently present across spatial locations. Finally, the task-aware attention is used to direct different feature channels to favor classification and box regression tasks separately. The regression branch predicts the localizations of bounding boxes in four margins deviated from the center point: left, top, right, and bottom distances.
Sample assignment and loss function: To calculate the training loss, object detectors often assign anchor boxes or points to positive and negative sets. However, since the SPVDet is designed to be anchor-free, there are no predefined anchor sets to compute the localization cost. Therefore, a dynamic assignment method must be adopted to automatically separate positive and negative samples based on the model’s feedback during training. In a recent study, a task alignment learning (TAL) approach [44] was proposed to explicitly align the optimal anchor points for the two branches of the detection head. This approach includes a designed sample assignment scheme and a task-aligned loss to pull the anchor points closer during training. The objective is to have well-aligned anchor points that can accurately predict both high classification scores and precise localization, which helps in preserving high-quality predictions during the post-process of non-maximum suppression (NMS) at inference.
Specifically, the joint anchor alignment metric t was proposed as follows to explicitly measure the degree of task-alignment at the anchor point level.
t = s α μ β ,
where s and μ denote a classification score and an IoU value, respectively. Empirically, α = 1 and β = 6 were chosen to control the impact of the two tasks in the anchor alignment metric.
A simple assignment rule was proposed to select the training samples based on the following criteria: for each ground-truth annotation, 13 anchor points with the largest t values were selected as positive samples, while the remaining anchor points were used as negative samples. Then, the training proceeded by computing loss functions designed for task alignment using the model weights updated through backward propagation. For the classification objective, the focal loss was adopted to mitigate the class imbalance between positive and negative samples during training. This loss is in the form of a familiar binary cross entropy (BCE) loss and is defined as follows:
L c l s = i = 1 N p o s t ^ i s i γ B C E s i , t ^ i + j = 1 N n e g s j γ BCE s j , 0 ,
L B C E = 1 N i = 1 N y i · log p y i + 1 y i · log 1 p y i ,
where y i is the label ( t i for positive samples and 0 for negative samples) and p ( y i ) is the predicted probability of the sample being positive for all N samples.
For the localization objective, the t value was used to re-weight the regression loss of bounding box in a form of Complete Intersection over Union (CIoU) [45] loss instead of original Generalized Intersection over Union (GIoU) [46] as follows:
L r e g = i = 1 N pos t ^ i L C I o U b i , b i ¯ ,
L C I o U = 1 I o U + ρ 2 b , b g t c 2 + α v ,
where ρ ( · ) is the Euclidean distance, b i and b i ¯ denote the predicted bounding boxes and the corresponding ground-truth boxes, c is the diagonal length of the smallest enclosing box covering the two boxes, α is a positive trade-off parameter, and v measures the consistency of the aspect ratio. In addition, a Distribution Focal Loss (DFL) [45] was employed to force the detector to rapidly focus on enlarging the probabilities of estimated value around the target label.
L D F L ( p y l , p y r ) = ( ( y r y ) l o g ( p y l ) + ( y y l ) l o g ( p y r ) ) ,
p y l + p y r = 1 ,
where y l and y r denote the target label values of left and right. At last, the total loss can be formulated as:
L = λ c l s L c l s + λ r e g L r e g + λ D F L L D F L ,
where λ c l s , λ r e g , and λ D F L denote the balancing coefficients for classification, regression, and DFL losses, respectively.

2.2.2. Dealing with High-Resolution Imagery

Previous studies on plant biotic or abiotic stress have reported detection performances based on sliced patches of original high-resolution images. However, this approach hinders the potential of high-throughput application in large-scale farms. To address this limitation, it is crucial for detection models in the quantitative assessment of plant stress to achieve an excellent trade-off between model complexity and inference speed, particularly for high-resolution images scanning large areas of farmland. With the aim of reducing model complexity, we propose a compact version of SPVDet (SPVDet-Nano), which is a lightweight yet powerful real-time object detector. SPVDet-Nano shares almost the same components as SPVDet, except that its backbone is significantly compressed using a compound scaling method, considering both depth and width. Additionally, we introduce a slicing aided hyper inference (SAHI) [38] technology to directly infer on the original high-resolution images. During the fine-tuning process of the SPVDet and SPVDet-Nano models, the high-resolution images are first sliced into patches, on which the detection model yields individual predictions. These coarse predictions are then registered back to the original images based on the preset overlapping ratio, and low-quality predictions are filtered out using the metric of intersection over union (IoU) or intersection over smaller (IoS) region. By slicing the patches into smaller ones, higher detection accuracy for smaller objects can be achieved. To preserve the salient objects from high-resolution close-up images, the entire unsliced original images are also used in the fine-tuning process. Specifically, the original query image is divided into multiple overlapping patches, and each patch is resized while maintaining the aspect ratio. Object detection forward pass is then independently applied to each overlapping patch. Moreover, an optional full-inference (FI) approach can be used to detect larger objects using the original image. Finally, the overlapping prediction results and, if applicable, the FI results, are merged back into the original size using non-maximum suppression (NMS). During NMS, only boxes with IoU ratios higher than a predefined matching threshold are considered, and any detections with a detection probability lower than that threshold are removed for each match.

2.2.3. Implementation Details

Unless otherwise specified, the SPVDet was trained on a single NVIDIA GeForce RTX 4090 graphics card with a batch size of 16, using Ubuntu 22.04.2 as the operating system, Python 3.10.11 as the programming language, and PyTorch 2.0.0 as the deep learning framework. During training, the Mosaic and MixUp augmentation [32] probability were set to 1.0 and 0.15, respectively. A multiscale training strategy was adopted by adjusting the image size to a random number ranging from 320 to 800 in intervals of 16. To improve the robustness of the model weight, the exponential moving average (EMA) with a decay of 0.9999 was used, as the model weight often jitters around the potential optimal parameters in the last few epochs. The stochastic gradient descent (SGD) optimizer with a weight decay of 0.0005 and a momentum of 0.937 was used in the training process. A linear learning rate scheduler was employed to regulate the learning rate during training. For the PASCAL VOC dataset, a “3×” training schedule (36 epochs) was used in the relevant ablation studies to achieve fast convergence. The learning rate of each parameter group was decayed by 0.1 when the number of epochs reached either 24 or 33. For the MS COCO dataset, a conventional long training schedule with a maximum of 300 epochs was adopted to achieve better generalization performance that can be transferred to the unseen downstream SPVD dataset. The first epoch was used as a warm-up for the model, and the data augmentation operations of Mosaic and MixUp were closed for the last 20 epochs. To be in line with previous works in the computer vision domain, we adopt well-established benchmark metrics, such as object size-specific mean average precisions (mAPs) on the COCO dataset for comparison, and the conventional mAP on the smaller-scale VOC dataset in ablation studies. Additionally, detection accuracy was evaluated using a confusion matrix, while regression metrics such as R 2 (coefficient of determination) and mean absolute error (MAE) were employed to provide a straightforward evaluation of detection and counting performance for simplicity.

3. Results

The main objective of this work was to verify the feasibility of detecting SPVD from RGB high-resolution images using a deep learning framework, specifically the proposed object detectors, SPVDet and SPVDet-Nano. The results are divided into three parts: Section 3.1 describes the results of ablation studies designed to determine the components and hyperparameters of the proposed detectors based on the VOC dataset; Section 3.2 reports their performance comparisons with mainstream one-stage object detectors based on the COCO dataset, verifying the advancements of SPVDet and SPVDet-Nano; and Section 3.3 applies the detectors to the self-made SPVD dataset by introducing the SAHI technology, demonstrating the feasibility of detecting SPVD from ground and aerial high-resolution images.

3.1. Ablation Studies on SPVDet

3.1.1. Principal Components: Backbone, Feature Aggregation Module, and Detection Head

A comprehensive comparison of the underlying components is indispensable for determining the optimal configuration of SPVDet. To determine the specific architecture of SPVDet, its performance variations on the VOC dataset were compared among four different backbones, two types of feature aggregation modules, and two different detection heads. Table 2 presents the ablation studies on SPVDet components, considering both higher model accuracy and computational complexity. This table provides valuable insights in several ways. First, it covers all the interactions between the feature aggregation module and detection head under each category of backbone, clearly demonstrating the effectiveness of each customized module. It can be observed from Table 2 that the combination of the enhanced feature aggregation module of CSP-SPPF DE and the detection head of Dynamic DH performed the best among all the alternative setups, regardless of the backbone used. Notably, the output features from the ELANNet backbone yielded the highest mAP of 80.57% using this combination. This confirms that the proposed feature aggregation module and detection head work well together to enhance the generalization ability and improve detection performance. As anticipated, the proposed CSP-SPPF DE module maintains the single-level feature architecture from the dilated encoder, which has been proven to be simple yet effective [33]. Furthermore, it replaces the original projector with the CSP-SPPF module from the well-known YOLO series. Second, the comparison not only considers the influence on model accuracy but also evaluates model complexity and memory efficiency, providing practical guidance on the lightweight properties of model architectures. It is evident from Table 2 that the combination of the ELANNet backbone, CSP-SPPF dilated encoder, and dynamic detection head yields the best candidate for SPVDet, possessing the highest model detection accuracy and minimal computation overhead. Therefore, this configuration with the best performance was adopted as the SPVDet architecture for further studies.

3.1.2. Hyperparameter Fine-Tuning: Dilation Rates, Number of Dynamic Blocks, and Loss Balancing Coefficients

Based on the prior determined architecture of SPVDet, a further hyperparameter fine-tuning procedure was conducted to maximize its potential. Specifically, two different numbers of dynamic blocks used in the detection head, three dilation rate lists used in the feature aggregation module, and four combinations of loss balancing coefficients with respect to classification coefficients of IoU and DFL were searched to deliver a rather comprehensive comparison. As can be seen from Table 3, considering detection performance and computation overhead, the dilation rates of [1, 2, 3, 4], two dynamic blocks together with the second coefficient combination reported the best performance with the highest mAP of 81.17%. Therefore, this optimized combination of hyperparameters was kept for subsequent experiments. In terms of dilation rates used in the convolutions of dilated encoder, no apparent correlated relations were observed in this table. In general, with the increase in the number of dynamic head blocks, the detection accuracy presented a slight improvement in the cost of a negligible computation overhead compared to cost of the backbone, which is in line with the previous work [35]. As for the loss balancing coefficients, the overall performance first ascended and then descended, indicating a potential peak around the second combination of coefficients. To maximize the potential of SPVDet, a hyperparameter fine-tuning procedure was conducted based on the prior determined architecture. This procedure aimed to determine the optimal number of dynamic blocks used in the detection head, the dilation rate list used in the feature aggregation module, and the combinations of loss balancing coefficients for classification, IoU, and DFL. Table 3 shows the performance evaluations of the various combinations of SPVDet hyperparameters. The dilation rates of [1, 2, 3, 4], two dynamic blocks, and the second combination of coefficients achieved the best performance, with the highest mAP of 81.17%. The loss items and precision curves during the training process on the VOC dataset can be found in Figure 6. Therefore, this optimized combination of hyperparameters was selected for subsequent experiments. Regarding the dilation rates used in the convolutions of the dilated encoder, no apparent correlated relations were observed in Table 3. Increasing the number of dynamic head blocks slightly improved the detection accuracy at the cost of a negligible computation overhead compared to the backbone, which is consistent with previous work [35]. As for the loss balancing coefficients, the overall performance first ascended and then descended, indicating a potential peak around the second combination of coefficients.

3.2. Performance Comparison with Previous Works: Quantitative Assessment of Generic Object Detection on the MS COCO

After determining the specific components of SPVDet, we proceeded to validate its effectiveness in comparison to the single-level architecture. We selected three counterparts, namely CenterNet [47], YOLOF [33], and the most recent CC-Det [34], to assess the performance using the MS COCO dataset. Additionally, we chose four feature pyramid detectors—RetinaNet [29], FCOS [30], YOLOv3 [31], and YOLOv4 [32]—to further validate the efficiency of our one-level architecture design. Since the CSPELANNet backbone is scalable, we also proposed a super lightweight version of SPVDet, called SPVDet-Nano, to significantly improve the real-time inference speed while minimizing the performance degradation caused by reducing the backbone hyperparameters. Table 4 lists the comparison results of detection performance among all the aforementioned models using different input image sizes on the MS COCO dataset. From Table 4 it is evident that our SPVDet achieved the highest mAP of 43.8 under arbitrary input size. The corresponding training records of SPVDet, including loss items and precision for the COCO dataset, are shown in Figure 7. Moreover, it outperformed the feature pyramid detectors by more than twice the speed in terms of inference. Considering the large-scale benchmark COCO dataset, our proposed architecture of SPVDet demonstrates its effectiveness and advancement, particularly in terms of inference speed. Notably, SPVDet exhibited superior performance compared to its single-level counterparts such as CenterNet, YOLOF, and CC-Det, while also slightly surpassing mainstream feature pyramid detectors. This finding supports the notion that the architecture of SPVDet can enhance the generalization ability of object detectors using a simple yet effective single-level feature. However, it is important to note that the lightweight version, SPVDet-Nano, sacrifices some accuracy, especially in detecting small objects, to achieve the highest inference speed. This trade-off may not be ideal for domain-specific applications with smaller datasets and more homogeneous scenarios.

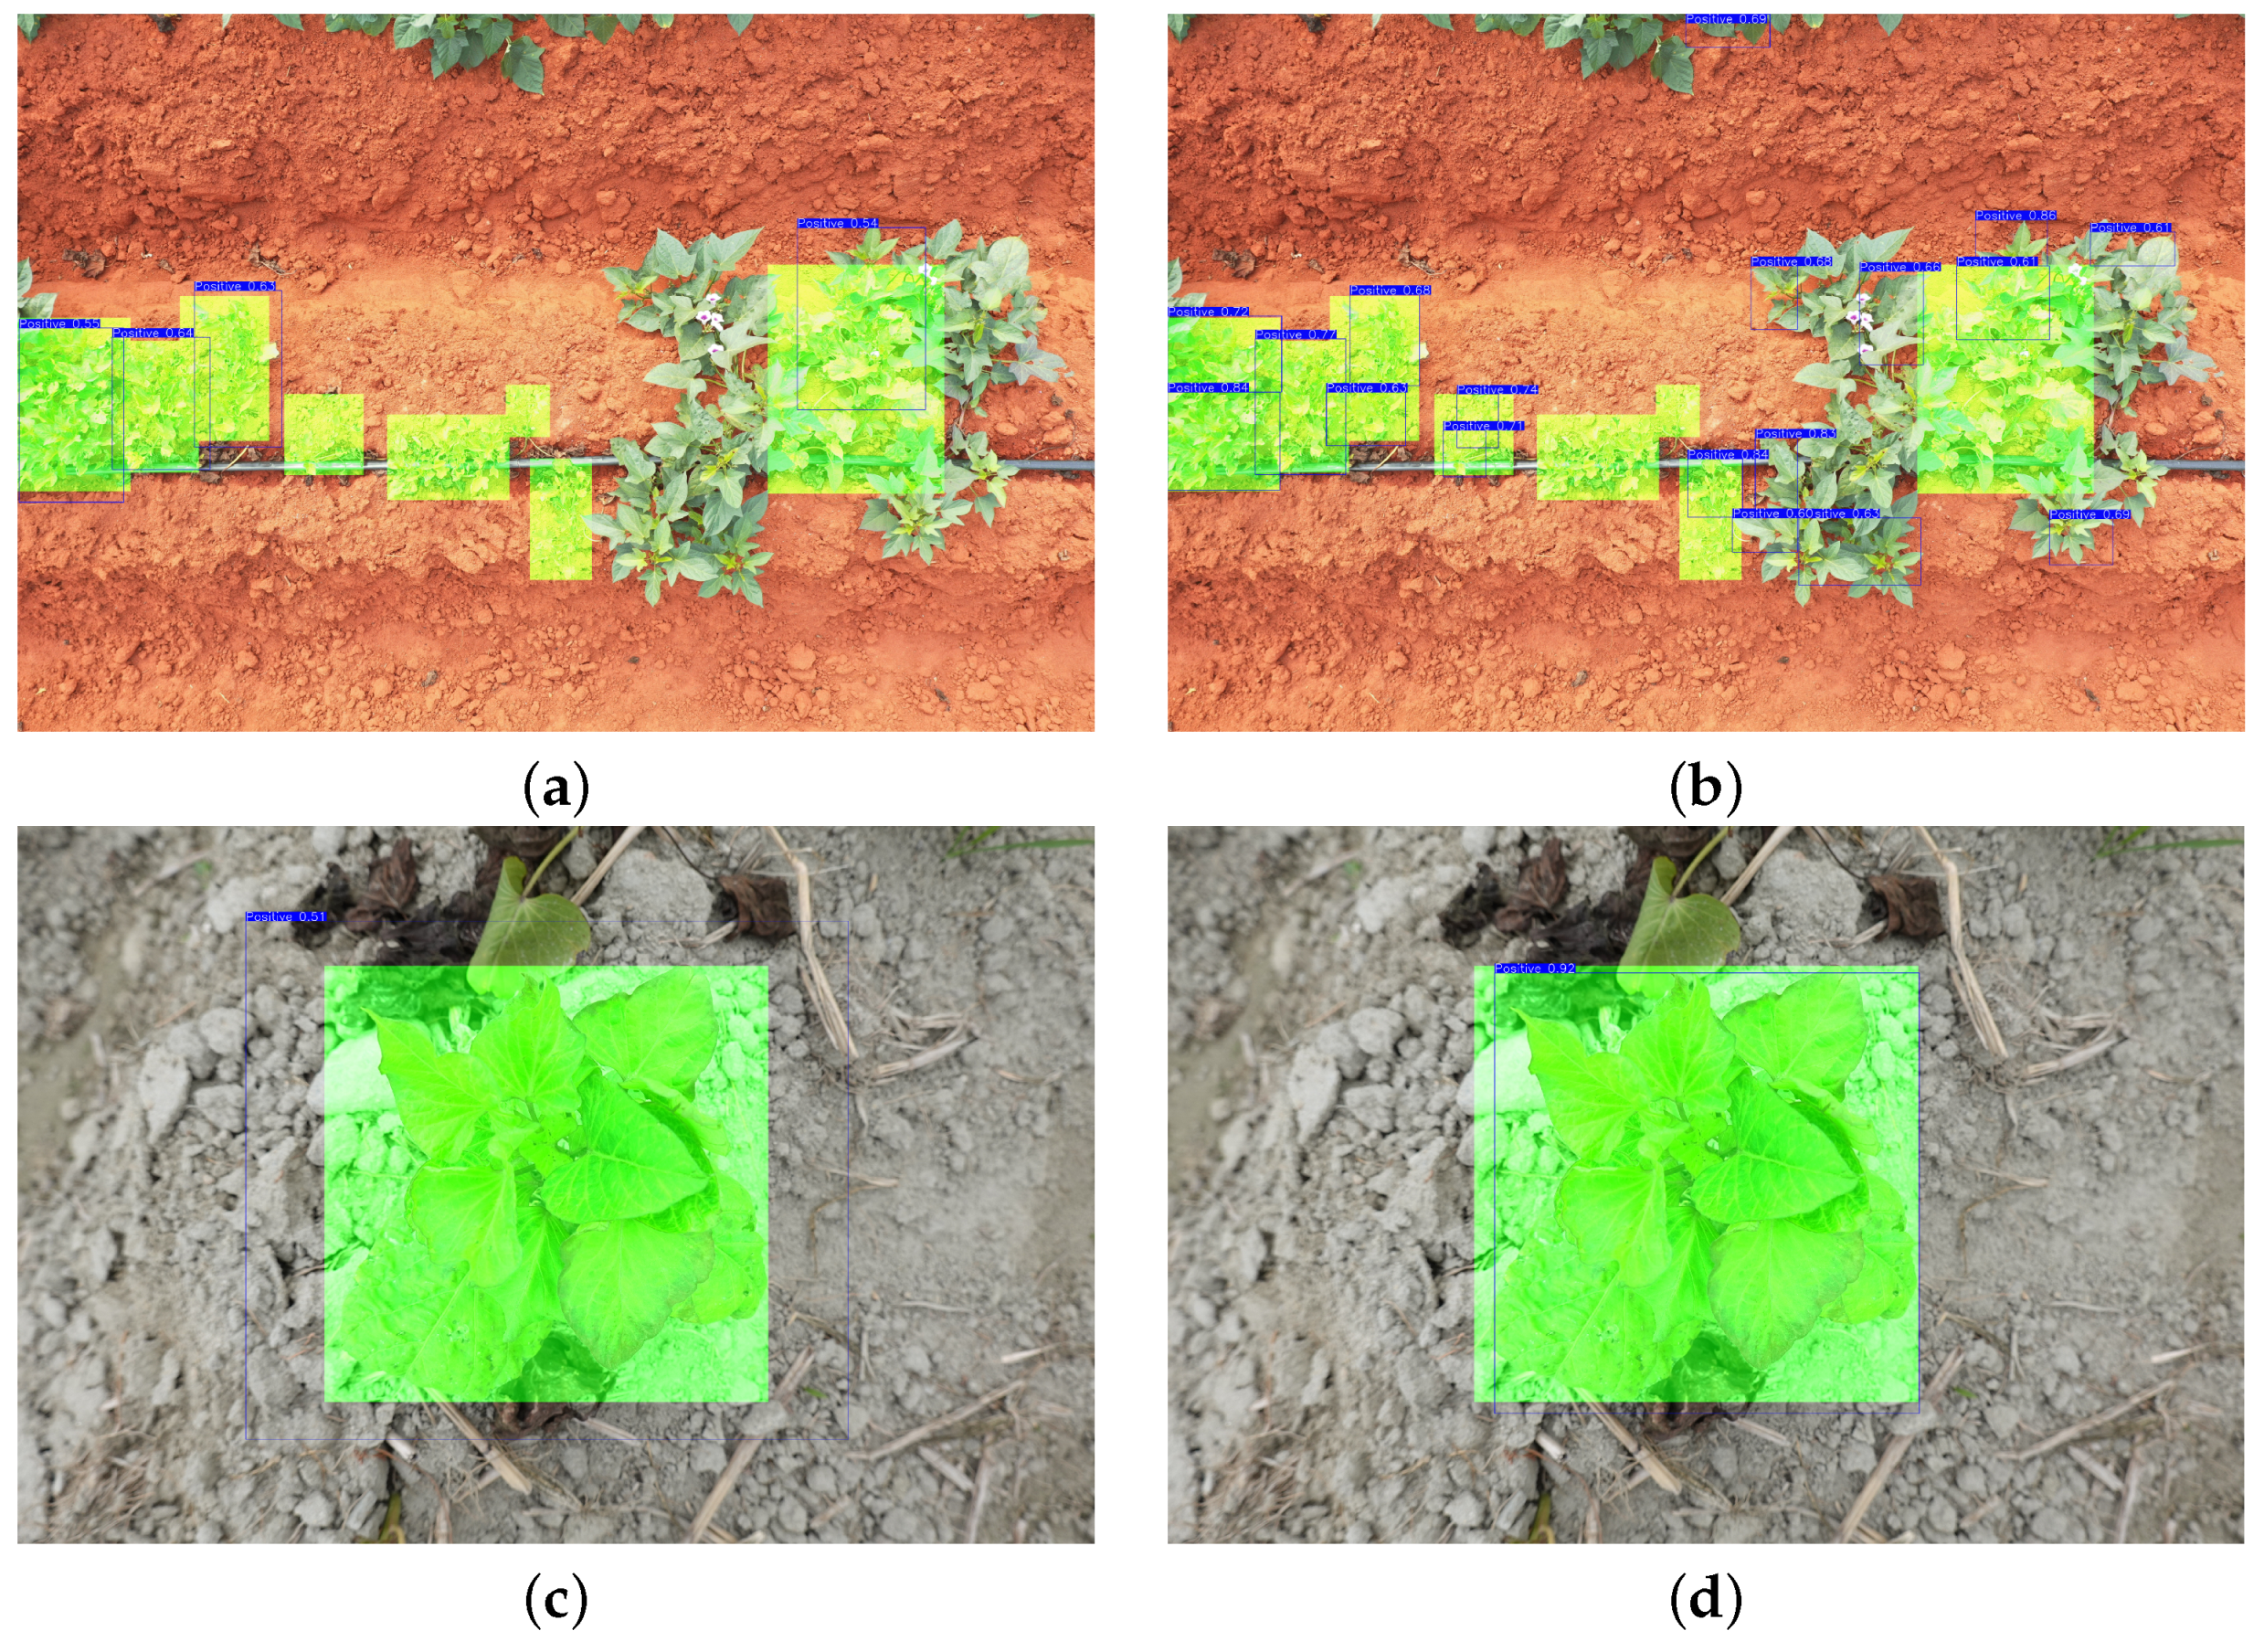
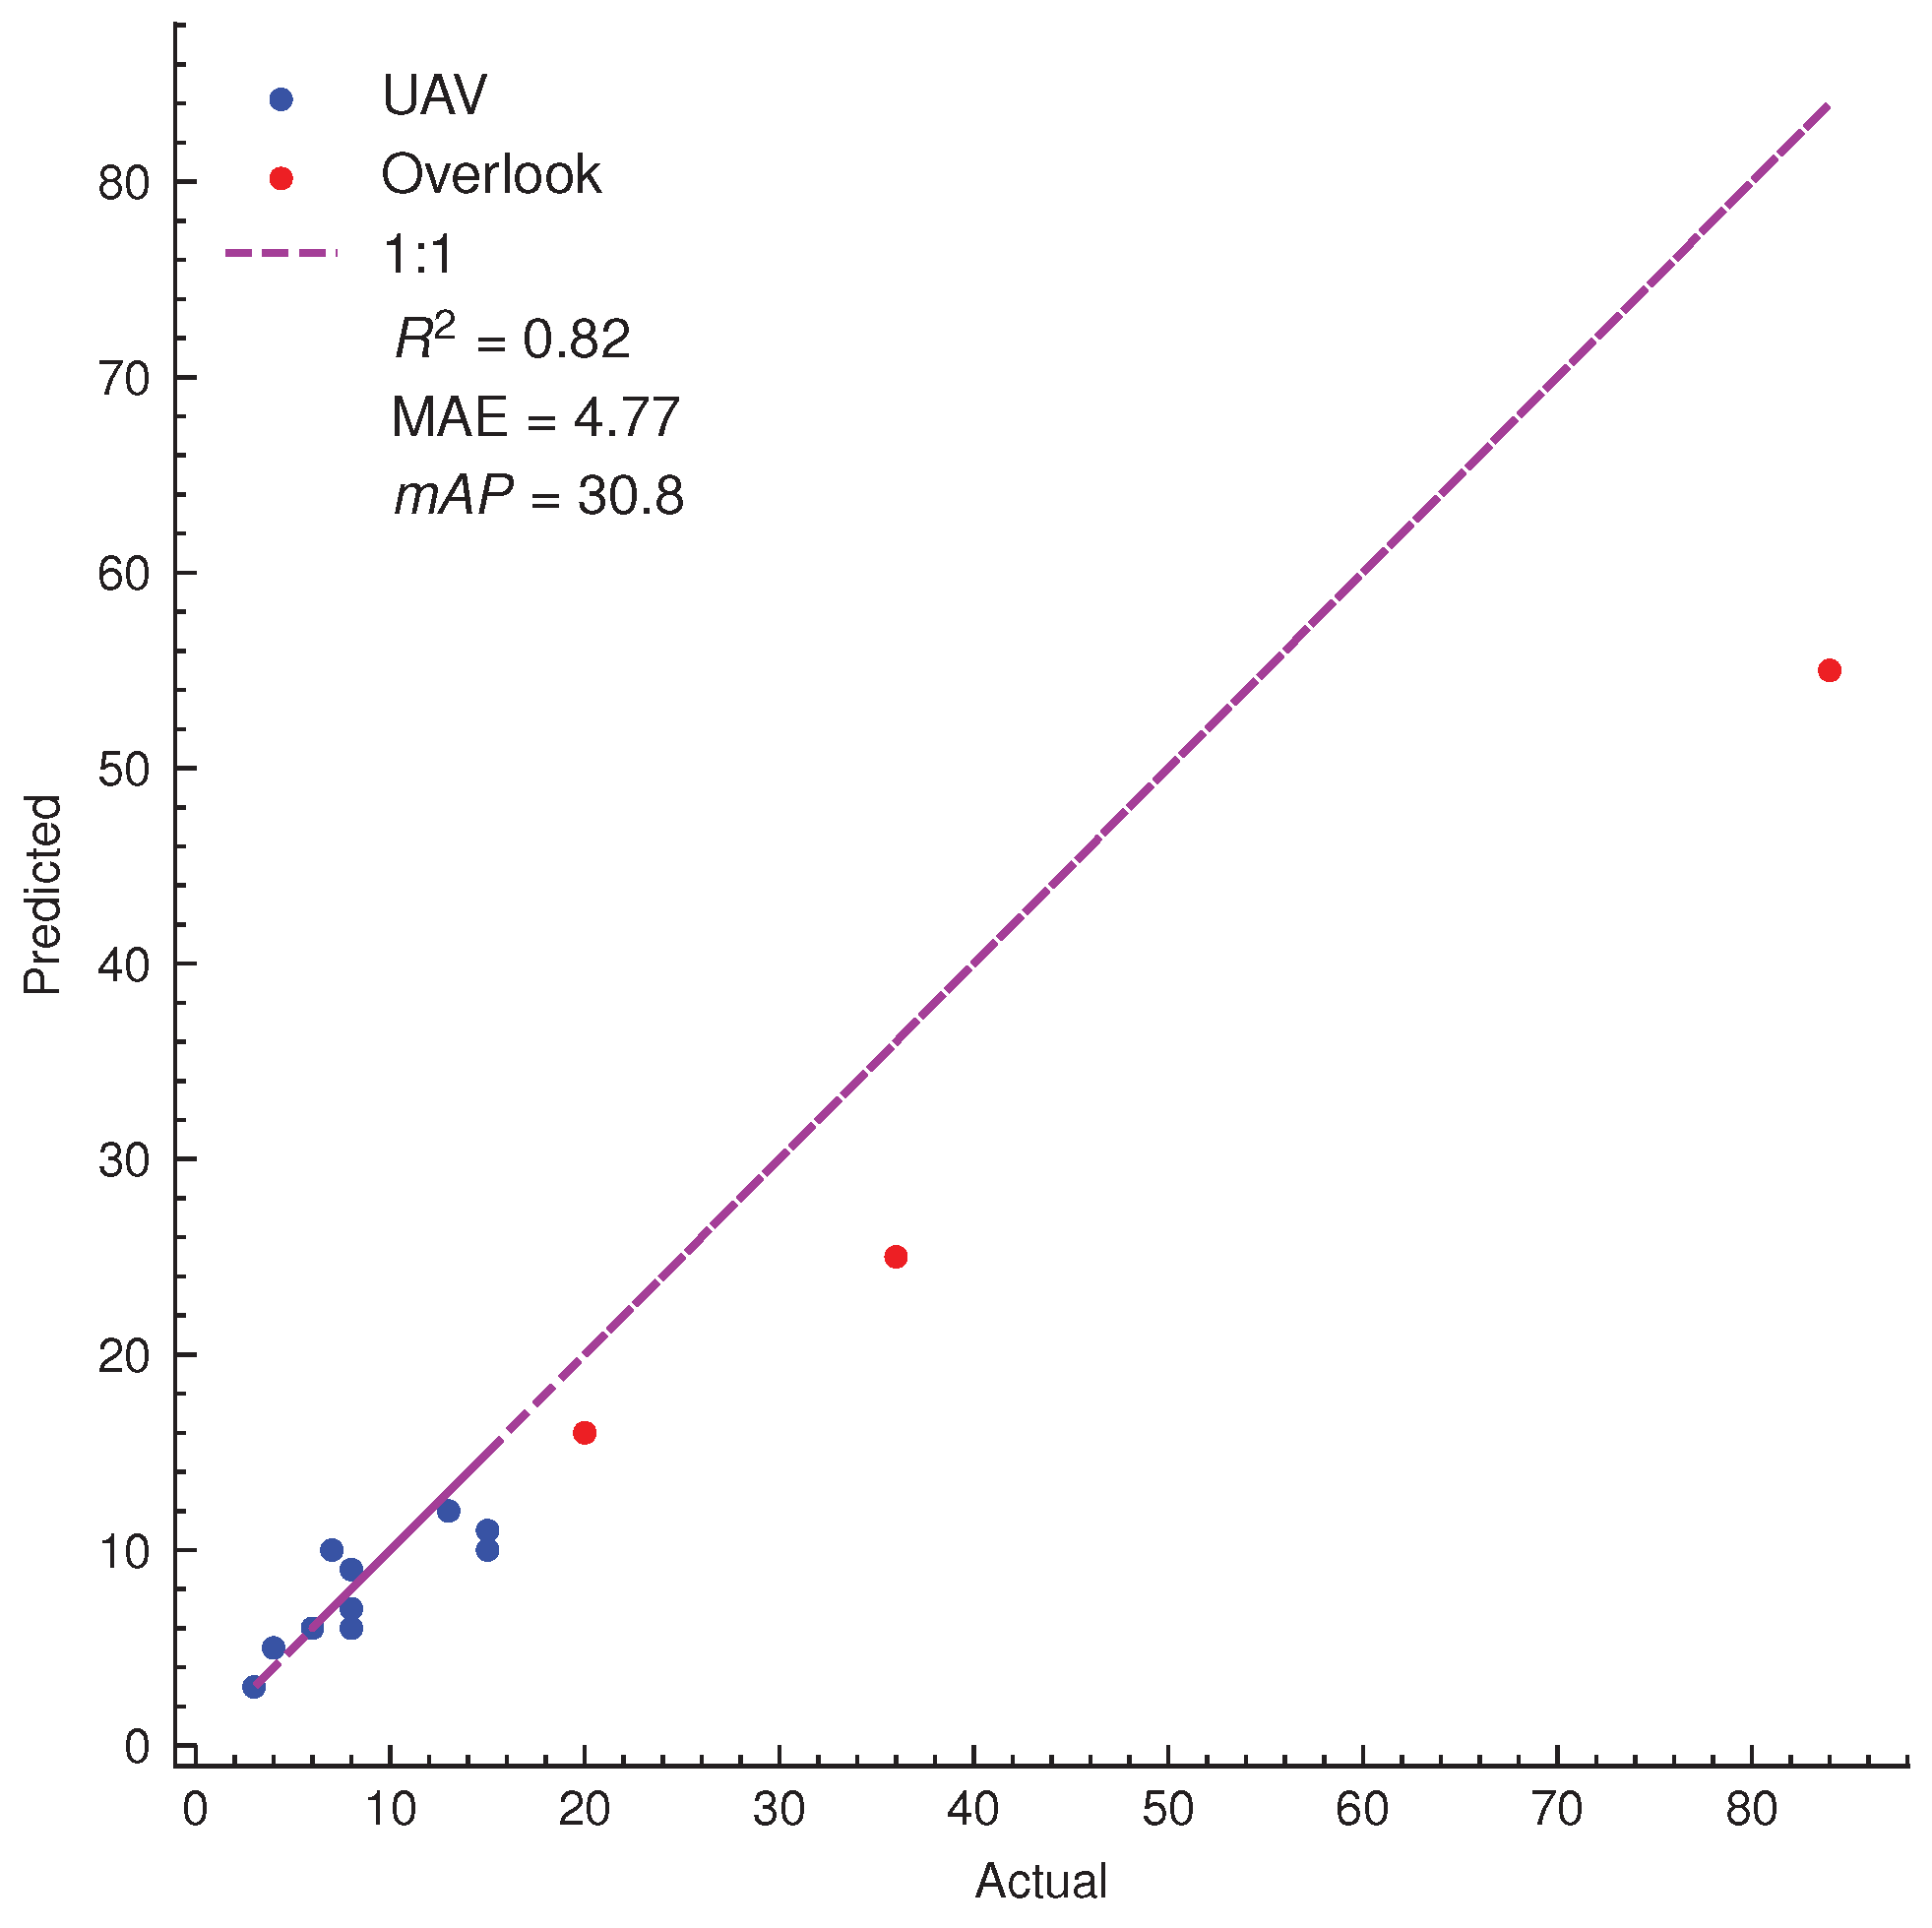
3.3. Assessments of SPVD Detection Performance on Plant Scale from High-Resolution Images in the Field

By employing the SAHI technology, our two proposed SPVDet models were utilized to directly detect plants experiencing SPVD biotic stress in the field. From Table 5, it can be observed that compared to the mAP of 16.8 achieved by directly using SPVDet for inference on the SPVD dataset test set, the model configuration of SPVDet combined with SAHI and FI achieved the highest mAP of 30.8 when employing a sliced patch size of 640 and IoS threshold of 0.5. Figure 8 presents the corresponding fine-tuning records of loss items and precision curves. This considerable enhancement in detection performance is consistent with a previous study [38], validating the effectiveness of SAHI when inferring on high-resolution images. Specifically, the introduction of SAHI technology substantially improved the accuracy of detecting small and large objects (indicated by A P S and A P L ), but it also slightly compromised the detection performance of medium-sized objects, which had not been reported before. Interestingly, the larger size of sliced patches helped alleviate this impact caused by the SAHI technology, perhaps because the relatively larger patches encompassed more complete representations of medium-sized objects. Likewise, the same model configuration and hyperparameters of SPVDet-Nano demonstrated the highest accuracy. Since SPVDet-Nano was primarily designed for real-time inference while sacrificing some representation ability, it exhibited a significant drop in accuracy for small- and medium-sized objects when SAHI technology was incorporated, as compared to SPVDet.
To provide a more intuitive understanding of the SPVD detection performance, the qualitative detection results of SPVDet and SPVDet-Nano are presented in Figure 9 and Figure 10, respectively. The above figures clearly demonstrate that the introduction of SAHI significantly improved the detection accuracy, particularly in terms of accurately localizing target objects and successfully identifying a wide range of SPVD-infected plants that were overlooked by direct inference of detectors. This presents compelling evidence that incorporating SAHI technology can greatly enhance the detection performance when working with high-resolution images, as opposed to direct inference. Furthermore, it can be inferred that ground-based SPVD detection is less challenging than aerial detection using UAV images due to the reduced background clutter and overlapping. Interestingly, the current SPVDet and SPVDet-Nano models still struggled with mistaking healthy plants for SPVD-infected plants in the UAV scenario. This issue is likely attributed to the limited size of the SPVD dataset with respect to the aerial scenario. Therefore, it suggests that there is a need for further optimization efforts with a focus on distinguishing between healthy plants and plants experiencing SPVD stress. In the future, more attention should be given to collecting and constructing a SPVD dataset through aerial sensing, which should provide more fine-grained and high-contrast images of sweet potato plants to facilitate better learning representation and more robust generalization abilities for detectors.
Moreover, the detection performance of SPVDet coupled with SAHI technology was compared under three different view angles to investigate the discrimination accuracy. The confusion matrices generated by SPVDet on the test set of the SPVD dataset for the three kinds of view angles are shown in Table 6. The close-up view captured by the ground camera reported the highest accuracy of 78.1%, accompanied by the fewest number of false positive plants. This demonstrates the feasibility of detecting infected sweet potato plants using image-based deep learning algorithms. This high accuracy is likely due to the fine-grained image features that enable the SPVDet network to learn generalized representations of infected plants during the fine-tuning process. Although the number of false positive and false negative plants was larger than that of the close-up view, the UAV view captured by the aerial camera achieved the second-best performance with a detection accuracy of 76.6%. This is likely because the UAV view incorporates a larger number of plants in a single image, which presents more challenges of cluttered background and overlapping. This suggests a promising approach for high-throughput phenotyping of plant diseases in large-scale fields. However, the overlook view reported the lowest detection accuracy of 55.3%, primarily due to severe discrimination errors regarding false negative plants. In this view, plants that are closer to the camera provide much larger pixels compared to those that are farther away. Consequently, attention should be focused on nearby plants for deep learning networks to generate reliable and accurate predictions. Based on these successful detection performances, the counting accuracy of multiple infected plants from the UAV and overlook images was evaluated. Figure 11 depicts the linear regression metrics, detection performance, and counting performance of the proposed SPVDet on the test set of the SPVD dataset under the UAV and overlook views. Similarly, it can be observed that the counting performance under the UAV view was much better than that of the overlook view. Future efforts should focus on enhancing the detection performance of the overlook view. In contrast, the counting of the number of infected plants from the UAV view showed a stable and strong positively correlated relationship with the ground-truths, indicating the effectiveness of detecting and counting SPVD cases from UAV aerial images using the proposed deep learning algorithm.

4. Discussion

Previous studies have primarily focused on laboratory-based and traditional methods for detecting sweet potato virus diseases. For example, Huang et al. [48] utilized NCM-ELISA and RT-qPCR to identify plants infected with SPFMV and SPCSV viruses, while David et al. [6] visually evaluated sweet potato virus symptoms using a scale ranging from 1 (no symptoms) to 5 (very severe symptoms). However, these methods have limitations. RT-PCR and ELISA can only be carried out in specialized institutions that are equipped with instruments and technical conditions, and they cost a certain amount of money. As far as we know, the current domestic market for detecting SPVD costs CNY 299, and the cheapest is CNY 99, which is still too costly for sweet potato growers. For this reason, our study proposes a non-destructive and scalable visual image-based method for monitoring SPVD in the field, which is convenient for sweet potato growers to implement. In cases where more precise identification is needed, then RT-PCR and ELISA can be conducted. This research is intended for initial screening of virus diseases during sweet potato cultivation. Since almost all growers have cell phones, they can take photos for identification anytime and anywhere without additional cost, which has a wide application prospect in the identification, prevention, and control of virus diseases in large-scale sweet potato cultivation.
In this study, we investigate the feasibility of detecting SPVD from visual high-resolution images by developing a novel object detector called SPVDet, which utilizes deep learning-based algorithms. We first determine the specific components of the SPVDet architecture through ablation studies. Our results, as shown in Table 2, consistently demonstrate that incorporating the SPPF block in the feature aggregation module and dynamic blocks in the detection head significantly enhance the performance of SPVDet without introducing excessive computational overhead. By replacing the original projector module of the dilated encoder proposed in YOLOF [33] with a CSP-SPPF module (see Figure 5), we are able to refine the semantic contexts and generate output features with multiple receptive fields in the residual blocks. Table 2 shows that the introduction of a dynamic block, which unifies scale-aware, spatial-aware, and task-aware attentions (see Figure 5), in the conventional detection head improves the representation ability of the object detection head without adding any computational overhead. Through further hyperparameter optimization in the feature aggregation module, dynamic head, and loss functions, we determine the final architecture of our proposed SPVDet, denoted as the bold item in Table 3, which achieves the best performance on the VOC dataset. It should be noted that most studies in this field often apply off-the-shelf mainstream architectures of object detectors and report detection results based on their private datasets, rather than using publicly available benchmark datasets. Our proposed SPVDet represents a new approach to designing object detectors from scratch and provides a solid reference for future works by demonstrating its performance on publicly available benchmark datasets.
To verify the effectiveness of SPVDet, we evaluate its performance on the large-scale benchmark COCO dataset. Table 4 shows that our proposed SPVDet outperforms comparable detectors in terms of both speed and accuracy. This finding supports and extends the results of YOLOF [33] and CC-Det [34], confirming that a single-level feature framework can achieve a better trade-off between performance and inference speed in designing an anchor-free one-stage object detector. Importantly, the improvements in network architecture were achieved and evaluated using the publicly available benchmark COCO dataset, providing strong evidence for their efficacy and objectiveness, as opposed to relying solely on an area-specific dataset. In addition, we develop a lightweight version of SPVDet called SPVDet-Nano by compressing the width and length of its backbone. SPVDet-Nano is designed to run in real-time on mobile edge devices, achieving the fastest inference speed as shown in Table 4. However, it experiences a significant drop in accuracy, particularly for small objects. This finding underscores the importance of the backbone as a feature extractor and highlights the potential degradation in detection performance resulting from backbone truncation.
In this study, we collected and constructed an SPVD dataset using UAV cameras and ground handheld cameras, covering different locations and crop variants. To the best of our knowledge, this is the first dataset to monitor SPVD using UAV and ground high-resolution images. We evaluated the performance of our proposed SPVDet model on this dataset, which is also the first study, to our knowledge, to apply a deep learning-based algorithm for SPVD detection. Quantitative analysis of the detection and counting performance, as shown in Table 5 and Table 6, demonstrated the feasibility of our SPVDet algorithm for identifying SPVD in high-resolution field images. However, in some cases, the direct application of SPVDet on the SPVD dataset failed to recognize small-sized crops. We addressed this issue by introducing SAHI technologies, which effectively improved the detection of small-sized plant canopies infected with SPVD. This finding aligns with the work of Akyon [38], which showed that applying the SAHI technique resulted in a 14% improvement in detection accuracy for small objects in high-resolution images. In Figure 11, we took one step forward to evaluate the task of counting plants infected with SPVD from UAV and overhead views, demonstrating a promising application of SPVDet in the potential high-throughput phenotyping of crop yield prediction. Regarding SPVDet-Nano, we found that it performed well in detecting infected plants with large canopies but struggled to detect small-sized infected plants. This indicates that the compression operation of the backbone significantly decreased the overall ability of feature extraction and representation. In contrast to the significant improvement achieved by SPVDet with SAHI, the performance of SPVDet-Nano was only slightly improved by 3.3% with the introduction of SAHI technologies. This suggests that SAHI technologies may not be effective when the initial feature representation ability is severely limited by the truncation of backbone parameters. The qualitative results shown in Figure 9 and Figure 10 indicate that the localization accuracy of infected sweet potato plants was better in ground imaging scenarios compared to aerial UAV sensing images. This is likely due to the proximity of ground sensors to the plants, which allows for more detailed observations of plant canopy scale. Overall, our study demonstrates the successful application of deep learning algorithms to detect SPVD using UAV and ground high-resolution images. This represents a new approach to high-throughput phenotyping of SPVD in the field and is crucial for yield protection and precision agriculture.
However, it is important to note some limitations of our study. We observed that several healthy plants were mistaken as infected with SPVD in the UAV images, while plants infected with SPVD were overlooked by the detector. These findings suggest that the current detection of SPVD from UAV visual images remains challenging, despite the use of an advanced and carefully designed modern object detector. The limited size of our SPVD dataset, collected from two small plots, could be a contributing factor. Future work should include larger-scale UAV datasets to optimize the detection accuracy of deep learning models. Additionally, the irregular boundaries of sweet potato plants pose a challenge for feature learning and representation in deep learning models. The heavily overlapped scenarios and cluttered backgrounds can significantly degrade the detection performance, particularly in the middle and late growth stages of sweet potatoes. To address this, future work should collect and construct larger-scale SPVD datasets, focusing on the early stages of growth to capture diverse features and ease the annotation procedure. Finally, while our study focused on the identification and detection of SPVD, which is the most severely damaging and symptomatic virus disease of sweet potatoes, future work could also consider progressively conducting research on different periods of infestation with multiple viruses.

5. Conclusions

In summary, our study has showcased the advancements achieved by the proposed SPVDet and SPVDet-Nano, which stem from a systematic architectural design in terms of detection accuracy and computational efficiency. Furthermore, we have established the feasibility of detecting SPVD in both ground-based and UAV aerial high-resolution RGB images by leveraging a suite of SAHI techniques. To the best of our knowledge, this study represents the inaugural attempt to employ a deep learning framework for SPVD detection in the field, taking advantage of visible images from customer-grade cameras and UAVs. This demonstrates a promising application prospect of high-throughput phenotyping of plant virus disease, facilitating smart decision support and timely management practices in large-scale crop plantations. Nevertheless, our study highlights several challenges that could be addressed in future research endeavors. For instance, the scarcity of UAV images within our SPVD dataset might undermine the representation and generalization ability of SPVDet. The multiple infections of viruses in various periods could also contribute to variations in SPVD symptoms. Consequently, future work could focus on expanding the SPVD dataset to encompass a broader range of sweet potato varieties and environmental conditions, as well as conducting a series of progressive studies to investigate the effects of multiple infections.

Author Contributions

Conceptualization, F.Z.; methodology, F.Z.; validation, F.Z.; formal analysis, F.Z.; investigation, Z.D., Q.S., J.X., J.Z., and H.L.; resources, X.Y. and L.H.; data curation, Z.D.; writing—original draft preparation, F.Z.; writing—review and editing, F.Z., Z.L., Z.W., and L.H.; visualization, F.Z.; supervision, X.Y. and L.H.; project administration, X.Y. and L.H.; funding acquisition, X.Y. and L.H. All authors have read and agreed to the published version of the manuscript.

Funding

This work was supported by the earmarked fund for CARS-10-Sweetpotato, the Key-Area Research and Development Program of Guangdong Province (No. 2020B020219001), the Sweetpotato Potato Innovation Team of Modern Agricultural Industry Technology System in Guangdong Province (2023KJ111), the Guangzhou Science and Technology Plan Project in part under Grant No. 20212100068, in part under Grant No. 202206010088, and by the Guangdong Province Rural Science and Technology Special Commissioner Project for Towns and Villages in part under the Grant of Yuekehan Agricultural Letter [2021] No. 1056.

Data Availability Statement

The data presented in this study are available on request from the corresponding author. The data are not publicly available due to personally identifiable information about individuals.

Acknowledgments

We would like to thank Jiyu Luo from Ruiying Sannong Cultivation Specialized Co-operative Society of Guangdong for advice and access to the farm.

Conflicts of Interest

The authors declare no conflict of interest.

References

  1. FAO. FAOSTAT. 2021. Available online: https://www.fao.org/faostat/en/#data/QCL (accessed on 25 October 2023).
  2. Gai, F.; Gong, Y.; Zhang, P. Production and Deployment of Virus-Free Sweetpotato in China. Crop Prot. 2000, 19, 105–111. [Google Scholar] [CrossRef]
  3. Clark, C.A.; Hoy, M.W. Effects of Common Viruses on Yield and Quality of Beauregard Sweetpotato in Louisiana. Plant Dis. 2006, 90, 83–88. [Google Scholar] [CrossRef] [PubMed]
  4. Jones, R.A.C. Global Plant Virus Disease Pandemics and Epidemics. Plants 2021, 10, 233. [Google Scholar] [CrossRef] [PubMed]
  5. Clark, C.A.; Davis, J.A.; Abad, J.A.; Cuellar, W.J.; Fuentes, S.; Kreuze, J.F.; Gibson, R.W.; Mukasa, S.B.; Tugume, A.K.; Tairo, F.D.; et al. Sweetpotato Viruses: 15 Years of Progress on Understanding and Managing Complex Diseases. Plant Dis. 2012, 96, 168–185. [Google Scholar] [CrossRef]
  6. David, M.; Kante, M.; Fuentes, S.; Eyzaguirre, R.; Diaz, F.; De Boeck, B.; Mwanga, R.O.M.; Kreuze, J.; Grüneberg, W.J. Early-Stage Phenotyping of Sweet Potato Virus Disease Caused by Sweet Potato Chlorotic Stunt Virus and Sweet Potato Virus C to Support Breeding. Plant Dis. 2023, 107, 2061–2069. [Google Scholar] [CrossRef]
  7. Tatineni, S.; Hein, G.L. Plant Viruses of Agricultural Importance: Current and Future Perspectives of Virus Disease Management Strategies. Phytopathology 2023, 113, 117–141. [Google Scholar] [CrossRef]
  8. Wang, Y.M.; Ostendorf, B.; Gautam, D.; Habili, N.; Pagay, V. Plant Viral Disease Detection: From Molecular Diagnosis to Optical Sensing Technology—A Multidisciplinary Review. Remote Sens. 2022, 14, 1542. [Google Scholar] [CrossRef]
  9. Galieni, A.; D’Ascenzo, N.; Stagnari, F.; Pagnani, G.; Xie, Q.; Pisante, M. Past and Future of Plant Stress Detection: An Overview From Remote Sensing to Positron Emission Tomography. Front. Plant Sci. 2021, 11, 609155. [Google Scholar] [CrossRef]
  10. Singh, A.; Jones, S.; Ganapathysubramanian, B.; Sarkar, S.; Mueller, D.; Sandhu, K.; Nagasubramanian, K. Challenges and Opportunities in Machine-Augmented Plant Stress Phenotyping. Trends Plant Sci. 2021, 26, 53–69. [Google Scholar] [CrossRef]
  11. Ghosh, D.; Chakraborty, S.; Kodamana, H.; Chakraborty, S. Application of Machine Learning in Understanding Plant Virus Pathogenesis: Trends and Perspectives on Emergence, Diagnosis, Host-Virus Interplay and Management. Virol. J. 2022, 19, 42. [Google Scholar] [CrossRef]
  12. Sozzi, M.; Cantalamessa, S.; Cogato, A.; Kayad, A.; Marinello, F. Automatic Bunch Detection in White Grape Varieties Using YOLOv3, YOLOv4, and YOLOv5 Deep Learning Algorithms. Agronomy 2022, 12, 319. [Google Scholar] [CrossRef]
  13. Bouguettaya, A.; Zarzour, H.; Kechida, A.; Taberkit, A.M. A Survey on Deep Learning-Based Identification of Plant and Crop Diseases from UAV-based Aerial Images. Clust. Comput. 2023, 26, 1297–1317. [Google Scholar] [CrossRef]
  14. Kaur, S.; Pandey, S.; Goel, S. Plants Disease Identification and Classification through Leaf Images: A Survey. Arch. Comput. Methods Eng. 2019, 26, 507–530. [Google Scholar] [CrossRef]
  15. Sambasivam, G.; Opiyo, G.D. A Predictive Machine Learning Application in Agriculture: Cassava Disease Detection and Classification with Imbalanced Dataset Using Convolutional Neural Networks. Egypt. Inform. J. 2021, 22, 27–34. [Google Scholar] [CrossRef]
  16. Oishi, Y.; Habaragamuwa, H.; Zhang, Y.; Sugiura, R.; Asano, K.; Akai, K.; Shibata, H.; Fujimoto, T. Automated Abnormal Potato Plant Detection System Using Deep Learning Models and Portable Video Cameras. Int. J. Appl. Earth Obs. Geoinf. 2021, 104, 102509. [Google Scholar] [CrossRef]
  17. Wang, X.; Liu, J.; Zhu, X. Early Real-Time Detection Algorithm of Tomato Diseases and Pests in the Natural Environment. Plant Methods 2021, 17, 43. [Google Scholar] [CrossRef]
  18. Li, K.; Zhang, L.; Li, B.; Li, S.; Ma, J. Attention-Optimized DeepLab V3 + for Automatic Estimation of Cucumber Disease Severity. Plant Methods 2022, 18, 109. [Google Scholar] [CrossRef]
  19. Liu, L.; Ouyang, W.; Wang, X.; Fieguth, P.; Chen, J.; Liu, X.; Pietikäinen, M. Deep Learning for Generic Object Detection: A Survey. Int. J. Comput. Vis. 2020, 128, 261–318. [Google Scholar] [CrossRef]
  20. Sharma, V.; Mir, R.N. A Comprehensive and Systematic Look up into Deep Learning Based Object Detection Techniques: A Review. Comput. Sci. Rev. 2020, 38, 100301. [Google Scholar] [CrossRef]
  21. Redmon, J.; Divvala, S.; Girshick, R.; Farhadi, A. You Only Look Once: Unified, Real-Time Object Detection. In Proceedings of the 2016 IEEE Conference on Computer Vision and Pattern Recognition (CVPR), Las Vegas, NV, USA, 27–30 June 2016; pp. 779–788. [Google Scholar] [CrossRef]
  22. Chen, Z.; Wu, R.; Lin, Y.; Li, C.; Chen, S.; Yuan, Z.; Chen, S.; Zou, X. Plant Disease Recognition Model Based on Improved YOLOv5. Agronomy 2022, 12, 365. [Google Scholar] [CrossRef]
  23. Ma, L.; Yu, Q.; Yu, H.; Zhang, J. Maize Leaf Disease Identification Based on YOLOv5n Algorithm Incorporating Attention Mechanism. Agronomy 2023, 13, 521. [Google Scholar] [CrossRef]
  24. Mao, R.; Wang, Z.; Li, F.; Zhou, J.; Chen, Y.; Hu, X. GSEYOLOX-s: An Improved Lightweight Network for Identifying the Severity of Wheat Fusarium Head Blight. Agronomy 2023, 13, 242. [Google Scholar] [CrossRef]
  25. Ge, Z.; Liu, S.; Wang, F.; Li, Z.; Sun, J. YOLOX: Exceeding YOLO Series in 2021. arXiv 2021, arXiv:2107.08430. [Google Scholar]
  26. Liu, W.; Zhai, Y.; Xia, Y. Tomato Leaf Disease Identification Method Based on Improved YOLOX. Agronomy 2023, 13, 1455. [Google Scholar] [CrossRef]
  27. Kouadio, L.; El Jarroudi, M.; Belabess, Z.; Laasli, S.E.; Roni, M.Z.K.; Amine, I.D.I.; Mokhtari, N.; Mokrini, F.; Junk, J.; Lahlali, R. A Review on UAV-Based Applications for Plant Disease Detection and Monitoring. Remote Sens. 2023, 15, 4273. [Google Scholar] [CrossRef]
  28. Shahi, T.B.; Xu, C.Y.; Neupane, A.; Guo, W. Recent Advances in Crop Disease Detection Using UAV and Deep Learning Techniques. Remote Sens. 2023, 15, 2450. [Google Scholar] [CrossRef]
  29. Lin, T.Y.; Goyal, P.; Girshick, R.; He, K.; Dollár, P. Focal Loss for Dense Object Detection. In Proceedings of the 2017 IEEE International Conference on Computer Vision (ICCV), Venice, Italy, 22–29 October 2017; pp. 2999–3007. [Google Scholar] [CrossRef]
  30. Tian, Z.; Shen, C.; Chen, H.; He, T. FCOS: Fully Convolutional One-Stage Object Detection. In Proceedings of the 2019 IEEE/CVF International Conference on Computer Vision (ICCV), Seoul, Republic of Korea, 27 October–2 November 2019; pp. 9626–9635. [Google Scholar] [CrossRef]
  31. Redmon, J.; Farhadi, A. YOLOv3: An Incremental Improvement. arXiv 2018, arXiv:1804.02767. [Google Scholar]
  32. Bochkovskiy, A.; Wang, C.Y.; Liao, H.Y.M. YOLOv4: Optimal Speed and Accuracy of Object Detection. arXiv 2020, arXiv:2004.10934. [Google Scholar]
  33. Chen, Q.; Wang, Y.; Yang, T.; Zhang, X.; Cheng, J.; Sun, J. You Only Look One-level Feature. In Proceedings of the 2021 IEEE/CVF Conference on Computer Vision and Pattern Recognition (CVPR), Nashville, TN, USA, 20–25 June 2021; pp. 13034–13043. [Google Scholar] [CrossRef]
  34. Yang, J.; Wang, K.; Li, R.; Qin, Z.; Perner, P. A Novel Fast Combine-and-Conquer Object Detector Based on Only One-Level Feature Map. Comput. Vis. Image Underst. 2022, 224, 103561. [Google Scholar] [CrossRef]
  35. Dai, X.; Chen, Y.; Xiao, B.; Chen, D.; Liu, M.; Yuan, L.; Zhang, L. Dynamic Head: Unifying Object Detection Heads with Attentions. In Proceedings of the 2021 IEEE/CVF Conference on Computer Vision and Pattern Recognition (CVPR), Nashville, TN, USA, 20–25 June 2021; pp. 7369–7378. [Google Scholar] [CrossRef]
  36. Everingham, M.; Van Gool, L.; Williams, C.K.I.; Winn, J.; Zisserman, A. The Pascal Visual Object Classes (VOC) Challenge. Int. J. Comput. Vis. 2010, 88, 303–338. [Google Scholar] [CrossRef]
  37. Lin, T.Y.; Maire, M.; Belongie, S.; Hays, J.; Perona, P.; Ramanan, D.; Dollár, P.; Zitnick, C.L. Microsoft COCO: Common Objects in Context. In Proceedings of the Computer Vision—ECCV, Zurich, Switzerland, 6–12 September 2014; Lecture Notes in Computer Science. Fleet, D., Pajdla, T., Schiele, B., Tuytelaars, T., Eds.; Springer: Cham, Switzerland, 2014; pp. 740–755. [Google Scholar] [CrossRef]
  38. Akyon, F.C.; Onur Altinuc, S.; Temizel, A. Slicing Aided Hyper Inference and Fine-Tuning for Small Object Detection. In Proceedings of the 2022 IEEE International Conference on Image Processing (ICIP), Bordeaux, France, 16–19 October 2022; pp. 966–970. [Google Scholar] [CrossRef]
  39. Zhang, L.; Gao, X. Transfer Adaptation Learning: A Decade Survey. IEEE Trans. Neural Netw. Learn. Syst. 2022, 1–22. [Google Scholar] [CrossRef]
  40. Gulzar, Y. Fruit Image Classification Model Based on MobileNetV2 with Deep Transfer Learning Technique. Sustainability 2023, 15, 1906. [Google Scholar] [CrossRef]
  41. Gulzar, Y.; Ünal, Z.; Aktaş, H.; Mir, M.S. Harnessing the Power of Transfer Learning in Sunflower Disease Detection: A Comparative Study. Agriculture 2023, 13, 1479. [Google Scholar] [CrossRef]
  42. He, K.; Zhang, X.; Ren, S.; Sun, J. Deep Residual Learning for Image Recognition. In Proceedings of the 2016 IEEE Conference on Computer Vision and Pattern Recognition (CVPR), Las Vegas, NV, USA, 27–30 June 2016; pp. 770–778. [Google Scholar] [CrossRef]
  43. Wang, C.Y.; Bochkovskiy, A.; Liao, H.Y.M. YOLOv7: Trainable Bag-of-Freebies Sets New State-of-the-Art for Real-Time Object Detectors. arXiv 2022, arXiv:2207.02696. [Google Scholar]
  44. Feng, C.; Zhong, Y.; Gao, Y.; Scott, M.R.; Huang, W. TOOD: Task-aligned One-stage Object Detection. In Proceedings of the 2021 IEEE/CVF International Conference on Computer Vision (ICCV), Montreal, BC, Canada, 11–17 October 2021; pp. 3490–3499. [Google Scholar] [CrossRef]
  45. Li, X.; Lv, C.; Wang, W.; Li, G.; Yang, L.; Yang, J. Generalized Focal Loss: Towards Efficient Representation Learning for Dense Object Detection. IEEE Trans. Pattern Anal. Mach. Intell. 2023, 45, 3139–3153. [Google Scholar] [CrossRef]
  46. Rezatofighi, H.; Tsoi, N.; Gwak, J.; Sadeghian, A.; Reid, I.; Savarese, S. Generalized Intersection Over Union: A Metric and a Loss for Bounding Box Regression. In Proceedings of the 2019 IEEE/CVF Conference on Computer Vision and Pattern Recognition (CVPR), Long Beach, CA, USA, 15–20 June 2019; pp. 658–666. [Google Scholar] [CrossRef]
  47. Duan, K.; Bai, S.; Xie, L.; Qi, H.; Huang, Q.; Tian, Q. CenterNet: Keypoint Triplets for Object Detection. In Proceedings of the 2019 IEEE/CVF International Conference on Computer Vision (ICCV), Seoul, Republic of Korea, 27 October–2 November 2019; pp. 6568–6577. [Google Scholar] [CrossRef]
  48. Huang, H.; Han, H.; Lei, Y.; Qiao, H.; Tang, D.; Han, Y.; Deng, Z.; Mao, L.; Wu, X.; Zhang, K.; et al. Application of Grafting Method in Resistance Identification of Sweet Potato Virus Disease and Resistance Evaluation of Elite Sweet Potato [Ipomoea batatas (L.) Lam] Varieties. Plants 2023, 12, 957. [Google Scholar] [CrossRef]
Figure 1. Example images under three different perspectives in the SPVD dataset with bounding box annotations (blue rectangles). Typical symptoms of SPVD in the late stage of infection can be identified by yellowed, veined, deformed leaves and dwarfed plants. (a) “Fragrant Pink Potato”; close-up view; Maoming, Guangdong province; (b) “Fragrant Pink Potato”; close-up view; Maoming, Guangdong province; (c) “Guang Potato 25”; UAV view; Zhanjiang, Guangdong province; (d) Fragrant Pink Potato”; overlook view; Maoming, Guangdong province.
Agronomy 13 02801 g001
Figure 2. The object width (horizontal) and height (vertical) distributions of the SPVD dataset with respect to the training set.
Agronomy 13 02801 g002
Figure 3. Diagram of the SPVDet forward propagation process. The term “Conv” represents a typical sequential convolution block, in which the input tensors flow through a convolution layer, followed by a batch normalization layer, and then an activation layer. In the beginning, the backbone extracts features from a batch of input images R B 3 H W , using a hierarchical approach to represent features of various object sizes with five levels in a downsampling rate of two: C1, C2, C3, C4, and C5 ( R B 2048 H / 32 W / 32 ). The dilated C5 feature map ( R B 1024 H / 16 W / 16 ) is then utilized for the subsequent feature aggregation module, which further reduces the channel dimension to 512 and refines semantic information using four consecutive residual blocks of dilated convolution with a list of dilation rates aiming to generate features with various receptive fields. Finally, the detection head consists of two blocks of three unified attentions to optimize the single level feature, convolutional layers of classification branch and regression branch to densely predict object category ( R B H / 16 W / 16 1 ) and localizations ( R B H / 16 W / 16 4 ).
Agronomy 13 02801 g003
Figure 4. The decomposition of CSPELANNet backbone adopted in the SPVDet. The input images flow through a series of hierarchical downsampling blocks and efficient layer aggregation network (ELAN) blocks, finally yielding the dilated C5 output in a stride of 16 for subsequent analysis.
Agronomy 13 02801 g004
Figure 5. The feature aggregation module on the left takes in the previous C5 output as input, utilizes the CSP-SPPF module to reduce its channels and refine semantic information, and employs four consecutive residual blocks to generate an output feature with multiple receptive fields; next, the detection head on the right further optimizes the above output feature using two dynamic blocks consisting of three unified attentions; and finally, it makes predictions in the regression branch and classification branch.
Agronomy 13 02801 g005
Figure 6. The left plot demonstrates the loss items, while the right plot shows the precision. The curves illustrate the evolution of these metrics over time in the “3×” schedule.
Agronomy 13 02801 g006
Figure 7. The loss items (left) and precision (right) curves of SPVDet evolved along with the 300 epochs during the training process of MS COCO dataset.
Agronomy 13 02801 g007
Figure 8. The loss items (left) and precision (right) curves of SPVDet during the fine-tuning process of the SPVD dataset, evolving over 30 epochs.
Agronomy 13 02801 g008
Figure 9. Qualitative results of SPVDet using FI (left column) and SAHI plus FI (right column) for ground and UAV high-resolution images in the field. The ground-truth annotations are marked in green masks and the model predictions are annotated with blue rectangles accompanied by prediction confidence scores. (a) FI, 5472 × 3648 from UAV camera; (b) SAHI + FI, 5472 × 3648 from UAV camera; (c) FI, 5472 × 3648 from ground camera; (d) SAHI + FI, 5472 × 3648 from ground camera.
Agronomy 13 02801 g009
Figure 10. Qualitative results of SPVDet-Nano using FI (left column) and SAHI plus FI (right column) for ground and UAV high-resolution images in the field. The ground-truth annotations are marked in green masks and the model predictions are annotated with blue rectangles accompanied by prediction confidence scores. (a) FI, 5472 × 3648 from UAV camera; (b) SAHI + FI, 5472 × 3648 from UAV camera; (c) FI, 5472 × 3648 from ground camera; (d) SAHI + FI, 5472 × 3648 from ground camera.
Agronomy 13 02801 g010
Figure 11. The scatter plot of counting performances of SPVDet coupled with SAHI technology on the test set of SPVD dataset under UAV view and overlook view. The linear regression metrics were used to evaluate the variance between predicted number of plants and ground-truth annotations per image.
Agronomy 13 02801 g011
Table 1. The SPVD dataset statistics of annotated bounding boxes covering training, validation, and test split sets. Each sweet potato plant under biotic stress (virus disease) is assigned with a label of “Positive”.
DatasetSubsetResolutionNo. ImagesNo. BBoxesSmallMediumLarge
SPVDtraining5472 × 3648
(0.24 cm/pixel)
211748069679
validation54161015146
test68295145249
Table 2. Performance evaluations of various backbones, feature aggregation modules, and detection heads on the test set of PASCAL VOC dataset. All the models share the same preprocessing and training pipeline under the “3×” training schedule with a batch size of 16. The number of floating point operations (FLOPs) and backbone parameters were reported clipping the last fully connected layer used in the ImageNet classification task.
BackboneFeature AggregationDetection HeadBackbone PerformanceDetector Performance
Top1-AccFLOPsParamsmAPFLOPsParams
ResNet-50Vanilla DEVanilla DH76.1%90 G20 M76.04118 G29 M
Dynamic DH76.46119 G30 M
CSP-SPPF DEVanilla DH77.54133 G34 M
Dynamic DH77.70134 G34 M
CSPDarkNet-53Vanilla DEVanilla DH75.0%125 G27 M78.18153 G36 M
Dynamic DH78.54153 G37 M
CSP-SPPF DEVanilla DH79.12168 G41 M
Dynamic DH79.33168 G42 M
CSPDarkNet-LVanilla DEVanilla DH75.1%118 G27 M79.31146 G37 M
Dynamic DH79.41146 G37 M
CSP-SPPF DEVanilla DH79.79161 G41 M
Dynamic DH80.08161 G42 M
CSPELANNetVanilla DEVanilla DH75.8%102 G19 M79.64129 G28 M
Dynamic DH80.03129 G29 M
CSP-SPPF DEVanilla DH80.34144 G32 M
Dynamic DH80.57144 G33 M
Table 3. Performance evaluations of various combinations of SPVDet hyperparameters with respect to dilation rates in the feature aggregation part, detection head, and loss computation. Model performance was measured by mAP of the test set of PASCAL VOC dataset under the “3×” training schedule.
Dilation RatesNumber of
Dynamic Head Blocks
Loss Balancing CoefficientsFLOPsParamsmAP
ClassificationIoUDFL
[1, 2, 3, 4]21.01.01.0138 G31 M79.97
1.05.01.581.17
1.07.52.080.71
1.010.02.580.02
41.01.01.0139 G32 M80.12
1.05.01.580.98
1.07.52.080.89
1.010.02.580.68
[2, 4, 6, 8]21.01.01.0138 G31 M80.12
1.05.01.580.66
1.07.52.080.85
1.010.02.580.07
41.01.01.0139 G32 M80.43
1.05.01.580.86
1.07.52.080.76
1.010.02.580.52
[4, 6, 8, 10]21.01.01.0138 G31 M80.05
1.05.01.580.92
1.07.52.080.94
1.010.02.580.50
41.01.01.0139 G32 M80.39
1.05.01.580.75
1.07.52.080.98
1.010.02.580.64
Table 4. Comparison with other one-level counterparts and feature pyramid detectors on the MS COCO dataset. The inference time was averaged using the first 2000 images among the validation set of MS COCO dataset with batch size = 1 without using tensorRT.
CategoryModelBackboneSizeAP AP 50 AP 75 AP S AP M AP L FPS
One LevelCenterNetResNet101512 × 51234.653.036.9---45
YOLOResNet1018,001,33339.859.442.920.545.554.921
CC-DetResNet101512 × 51240.659.444.222.645.755.150
Feature PyramidRetinaNetResNet-101-FPN8,001,33339.159.142.321.842.750.215
FCOSResNet-101-FPN8,001,33341.560.745.024.444.851.617
YOLOv3DarkNet-53608 × 60833.057.934.418.335.441.976
YOLOv4CSPDarkNet-53608 × 60843.565.747.326.746.753.357
One LevelSPVDet (ours)CSPELANNet512 × 51241.859.144.918.646.764.7180
608 × 60843.862.347.522.350.366.6157
SPVDet-Nano (ours)CSPELANNet-Nano512 × 51231.147.732.79.433.253.5245
608 × 60833.851.435.812.837.554.4232
Table 5. Quantitative results of plants infected with SPVD from the test set of SPVD dataset using our two proposed detection models. By introducing the SAHI technology, detection performances of SPVDet and SPVDet-Nano were compared using various SAHI technique combinations, metric thresholds, and patch sizes.
Model SetupMetric ThresholdPatch Size = 640Patch Size = 480
AP AP 50 AP 75 AP S AP M AP L AP AP 50 AP 75 AP S AP M AP L
SPVDet + Fl-16.833.015.50.014.317.816.833.015.50.014.317.8
SPVDet + SAHI + FlIoS = 0.530.847.832.060.07.834.826.038.326.560.04.529.8
IoU = 0.528.242.329.560.07.831.925.839.025.960.04.529.6
SPVDet-Nano + Fl-12.234.14.80.01.714.112.234.14.80.01.714.1
SPVDet-Nano + SAHI + FlIoS = 0.515.525.416.90.02.717.913.321.114.20.01.615.6
IoU = 0.515.124.316.40.02.217.511.117.611.80.01.812.8
Table 6. The confusion matrices of the detection results on the test set of the SPVD dataset using the proposed SPVDet object detector coupled with SAHI technology. Since it focuses only on recognizing the sweet potato plants infected with SPVD from the image foreground labeled as “Positive”, the remaining vast amount of background objects such as healthy plants and earth were not considered and are therefore represented by the “Null” label here.
PredictedClose-Up ViewUAV ViewOverlook View
ActualAccuracyActualAccuracyActualAccuracy
ForegroundBackgroundForegroundBackgroundForegroundBackground
Foreground57678.1%72776.6%841255.3%
Background11Null15Null56Null
Disclaimer/Publisher’s Note: The statements, opinions and data contained in all publications are solely those of the individual author(s) and contributor(s) and not of MDPI and/or the editor(s). MDPI and/or the editor(s) disclaim responsibility for any injury to people or property resulting from any ideas, methods, instructions or products referred to in the content.

