Article

The Impact of Mechanical Compression on the Postharvest Quality of ‘Shine Muscat’ Grapes during Short-Term Storage

1
Key Laboratory of Modern Agricultural Equipment and Technology, Ministry of Education, Jiangsu University, Zhenjiang 212013, China
2
School of Food and Biological Engineering, Jiangsu University, Zhenjiang 212013, China
*
Author to whom correspondence should be addressed.
Agronomy 2023, 13(11), 2836; https://doi.org/10.3390/agronomy13112836
Submission received: 8 October 2023 / Revised: 10 November 2023 / Accepted: 15 November 2023 / Published: 17 November 2023
(This article belongs to the Section Agricultural Biosystem and Biological Engineering)

Abstract

:
Mechanical stress induced by compression during preharvest and postharvest handling of fresh fruit is a major factor influencing the quality of fresh fruit. The degree of compression primarily governs the extent of quality deterioration. However, research on the damage mechanisms of mechanical compression in table grapes remains scarce. This investigation evaluated the impact of varying compression levels (0%, 20%, 40%, 60%, and 80%) on the postharvest quality attributes of table grapes. Changes in postharvest physical properties (overall appearance and color), structural properties (firmness, springiness, cohesiveness, and chewiness), physiological qualities (total soluble solids, titratable acidity, ascorbic acid, malonaldehyde content, and relative electrical conductivity), and cell microstructure of the berries was determined at 4 °C during 15 d of storage. Mechanical compression contributed to the deterioration of the quality of table grapes during storage, resulting in increased weight loss, decay rate, malonaldehyde content, and relative electrical conductivity; and decreased total soluble solids, titratable acidity, and ascorbic acid content. Furthermore, as compared to the control group, mechanical compression resulted in substantial yellowing and diminished textural qualities of grapes. In particular, compression treatment caused significant deformation of grape cell microstructure. In conclusion, mechanical compression stress significantly affects the physical and physiological properties of postharvest table grapes, as well as the internal cellular organization. As compression levels increase, the quality of table grapes progressively deteriorates, leading to a substantial reduction in storage life and commercial value. This study offers essential information for devising damage prevention strategies in preharvest and postharvest handling of table grapes.

1. Introduction

Grapes (Vitis vinifera L.) are widely cultivated throughout the world, with a global planted area of 6.95 million hectares in 2020 and an annual production of 78.03 million tons [1]. The grape is abundant in minerals, vitamins, carbohydrates, organic acids, and polyphenolic antioxidants [2]. China is the largest producer of grapes, accounting for 19.02% of world production. In China, 80% of grapes are consumed fresh, with the remainder being used to make wine, raisins, and juice [3].
From the field to the point of consumption, fresh produce undergoes several primary processes, including harvesting, sorting, packing, storage, transportation, and retail in stores [4]. Fruit and vegetables are vulnerable to static or dynamic stress throughout these procedures, which may result in mechanical damage [5]. The quality and market value of the fruit are severely impacted by mechanical injury, which raises the risk of microbial infection in addition to sensory changes and nutrient loss [6,7]. Therefore, reducing mechanical damage during the circulation of fruit and vegetables is an important research topic in their transport, storage, processing, and marketing [8].
Mechanical damage to fruit and vegetables is affected by different types of mechanical loading, including vibration, compression, impact, friction, puncture, and cutting [9]. In recent years, a significant number of studies have investigated the damage mechanisms of simulated vibration, impact, and compression tests during the distribution process, providing an effective way to develop or improve postharvest handling techniques for fruit and vegetables [10]. For example, Chaiwong, ET al. [11] analyzed vibration damage caused by simulated transportation of guava and indicated that vibration acceleration was an important factor in causing vibration abrasion in guava. Hussein, Fawole and Opara [6] studied the sensitivity of pomegranate cultivars to impact damage, and the results showed that impact energy was the main parameter affecting the bruising of pomegranate fruit. Sun, et al. [12] used hyperspectral imaging to examine tomatoes damaged by falls and revealed that the greater the height of the fall and the larger the fruit, the more severely the tomatoes were damaged. Lin, et al. [13] studied the effect of buffer materials and temperature on the quality damage of ripe peaches through vibration tests and found that in peach fruit, under low-temperature vibration, the damaged area size was smaller and the decay rate was lower. Xu, et al. [14] discovered that fall impact had a significant impact on the physiological response of apples, reducing the storage life and commodity value of postharvest apples significantly. Mir and Shahbazi [15] observed that vibration frequency is a significant factor affecting persimmon vibration damage, resulting in the deterioration of the physical, mechanical, and chemical properties of persimmon. The aforementioned findings have significant practical implications for alleviating fruit loss as well as preserving fruit commodity value, which additionally offer an achievable way of developing or enhancing fruit postharvest treatment technology [16].
Grapes belong to the berry category which presents differences in quality characteristics from drupes [17]. After being subjected to mechanical stress, grapes usually show delayed damage, which is not easy to observe visually, except in more destructive cases [18]. In general, grape berries are subjected to mechanical compression loads well below the critical load for berry rupture [7]. The effects of such loads on grapes are not easily detectable but are gradually revealed during the period between postharvest and sale, resulting in economic losses [19,20]. So far, there have been few studies on the bruising damage of table grape fruit caused by mechanical compression load before the critical value of rupture. Our research group has conducted preliminary studies on the vibration characteristics of grape clusters during transport, which indicate that vertical vibration results in higher grape dropping rates compared to horizontal vibration [3,21]. However, more research is needed on the impact of imperceptible mechanical compression damage on the quality of table grapes. Therefore, the objective of this study was to use a texture analyzer to apply five different levels of compressive stress to table grapes (‘Shine Muscat’ grape) to determine the physical and physiological quality indexes of fresh grapes, observe the changes in grape fruit tissue and cell microstructure, and synthesize the development law of physical, physiological, and microstructural damage of table grapes. The results of this research offer significant insight into the possible causes of fresh grape damage produced by mechanical compressive loads, which could provide the essential knowledge required for the development or improvement of postharvest handling strategies for fresh grapes.

2. Materials and Methods

2.1. Grape Samples and Treatments

Six-year-old vines of the table grape cultivar ‘Shine Muscat’ were grown under rain shelter cultivation at the Rose Grape Garden in Zhenjiang City, Jiangsu Province, China. The planting system used an H-shaped trellis, and all grapevines were subjected to identical pruning and cultivation practices. In this study, we selected 10 vines and harvested 30 clusters at commercial maturity (total soluble solids, TSS ≥ 18%). The grapes were screened to ensure consistent ripeness, uniform size, no mechanical damage, and no pests or diseases. The harvested grapes were transported to the laboratory within one hour.
Grape clusters transported to the laboratory were left at room temperature for 2 h to remove field heat. The grapes were cut from the stems and the berries were selected. Berry size (average): longitudinal diameter = 28.58 mm, transverse diameter = 27.72 mm, berry weight (average) = 16.75 g.
In preliminary tests, 100 ‘Shine Muscat’ grapes were compressed with the Texture Analyzer at different compression distances: 14 mm, 12 mm, 10 mm, 8 mm, and 6 mm. The aim of these treatments was the determination of the maximum compression deformation that would not cause external rupture of the berries.
According to the critical value of 10 mm for the compression deformation of the grape berries obtained in the preliminary experiment, the compression deformation amounts that did not cause the grape berries to break were set at 8 mm, 6 mm, 4 mm, and 2 mm, which was 80%, 60%, 40%, and 20% of the compression deformation of the grape berries. A total of 870 berries were selected and randomly divided into five groups. The grape berries were compressed using the texture analyzer (TA. XT Plus, Stable Micro Systems, UK), and a circular plate of 36 mm diameter was selected as the compression probe, with the compression direction being transverse, as shown in Figure 1A. The test parameters were as follows: pre-test speed = 5.0 mm/s, test speed = 2.0 mm/s, post-test speed = 2.0 mm/s. Five compression levels were set: 0, Cps20%, Cps40%, Cps60%, and Cps80%. The force–compression distance curves were recorded by a computer in real time, as shown in Figure 1B. The treatment and control grapes were stored in an incubator at 4 ± 0.2 °C and 85% humidity for 15 days. The physiological and biochemical parameters of the grape pulp were measured at 0 day, 3 day, 6 day, 9 day, 12 day, and 15 day, respectively, by taking the peeled pulp from the equatorial part of the grapes. The results were averaged over three replicates per group. The experimental design for this study is illustrated in Figure 2.

2.2. Physical Properties

2.2.1. Visual Appearance

During storage, photographs were taken every three days to track the changes in the appearance of the ‘Shine Muscat’ grape.

2.2.2. Determination of Color

The surface color of the grape peel was measured using a colorimeter (Chroma Meter CR-400, Konica Minolta, Tokyo, Japan), according to the method described by Champa, et al. [22], with minor modifications. The indices of L* (light/dark), a* (red/green), and b* (yellow/blue) were recorded. Color differences (ΔE) were obtained by Equation (1):
E = ( L *   L 0 * ) 2 +   ( a *   a 0 * ) 2 + ( b *   b 0   * ) 2 2
where L 0 * , a 0 * , and b 0 * were the initial values of peel color, while L*, a*, and b* were the color parameters at the time of sampling.

2.3. Cell Structure Changes

A scalpel was used to take three pulp slices along the peeled berry’s equatorial part. The slice size was corrected using a hole punch (10 mm diameter). Slice size: diameter × thickness = 10 mm × 0.1 mm. Slices were quickly placed on a slide, covered with a coverslip, and wiped dry of excess liquid. The alterations in the cell structure of ‘Shine Muscat’ grape berry tissue were studied using a fluorescence electron microscope (Nexcope NE910, Ningbo, China). As the pulp samples would lose water and shrink, each observation was limited to 3 min at the most. Image analysis of the sliced tissues was performed using ImageJ software v.2.1.0 (National Institutes of Health, Bonn, Germany) to obtain cellular morphological parameters. The experiment was repeated with three berries per group, and the experimental results were expressed as mean ± SE.

2.4. Textural Properties

The texture of fresh grapes was determined using texture multifaceted analysis as described in [23] with slight modifications. The textural characteristics of the grapes were measured by a texture analyzer (TA. XT Plus, Stable Micro Systems, Godalming, UK). The grapes were placed on the test platform of the texture analyzer, and texture profile analysis was performed on the grapes using the standard compression plate (SMSP/36R). The test parameters were as follows: pre-test speed = 5.0 mm/s, test speed = 2.0 mm/s, post-test speed = 2.0 mm/s, deformation value = 25%, interval time = 5.0 s, trigger force = 4.0 g. Five berries were analyzed per group and the results were expressed as mean ± SE. According to the texture characteristic curve, firmness, springiness, cohesiveness, and chewiness were determined, which could be used for further analysis. Herein, firmness is defined as the maximum peak value during the first compression; cohesiveness is the ratio of the areas under the curve for two compressions; springiness refers to the displacement from the target deformation in the first cycle to the trigger point in the second cycle; chewiness equals the product of hardness, cohesiveness, and springiness.

2.5. Physiological Properties

2.5.1. Total Soluble Solids (TSS), Titratable Acidity (TA) and Ascorbic Acid (AsA)

The determination method of total soluble solids (TSS) content in the ‘Shine Muscat’ grape refers to Dhital, et al. [24], slightly modified. Pulp (10 g) was taken from five berries and the pulp was pressed through four layers of gauze to extract the juice. The TSS content in grapes was measured using a portable digital refractometer LC-DR-32B (Shanghai Lichen Bang xi Instrument Technology Co., Ltd., Shanghai, China). The measurement was repeated three times and the mean value was reported. Results of TSS measurements were expressed as °Brix.
TA was calculated based on the method of Dhital, et al. [24], with minor adjustments. We took 10 g of pulp from five berries and ground them in a mortar. The homogenate was reduced to 100 mL with distilled water. Then, it was filtered and 100 μL 5% phenolphthalein indicator was added to the supernatant (10 mL). Next, the mixture was titrated with 0.1 mol/L NaOH until the solution turned pale pink (pH 8.1) and did not fade within 30 s. We recorded the volume of NaOH consumed. This was repeated three times and the mean value was reported. The results are presented by tartaric acid percentage.
The ascorbic acid content determination of the ‘Shine Muscat’ grape was based on the method of [25] with minor changes. We took 10 g of pulp from five berries, mixed it with 2% oxalic acid solution and ground it to a homogenate under ice bath conditions. Then, it was centrifuged at 8000× g for 10 min and we collected 10 mL of the supernatant. This was titrated with calibrated 2,6-dichlorophenol indophenol until a pink color appeared and remained for 15 s. This was repeated three times and the mean value was reported. The results for AsA content were expressed as g Kg−1.

2.5.2. Weight Loss (WL) and Decay Incidence (DI)

During the storage period, the mass of berries in each group was measured every three days. Ten berries were randomly selected from each group to measure their weight and the experiment was repeated three times. The results of the experiment were expressed as mean + SE. The weight loss was calculated by Equation (2):
Weight   loss   % =   Initial   weight post - storage   weight Initial   weight   ×   100
The decay incidence of the ‘Shine Muscat’ grape was defined as the percentage of rotten grapes in the total number of grapes. During the storage period, deterioration of the berries occurred, such as pitting, microbial growth and disease spots. An area of deterioration of up to 10% of the total fruit surface is considered rotten. All samples were checked every three days for decay incidence. Three members of the research team were assigned to count decayed berries on each inspection day. The results of the experiment were expressed as mean + SE. The decay incidence was assessed by Equation (3):
Decay   incidence   ( % ) = Number   of   decayed   grapes Total   number   grapes   ×   100

2.5.3. Malondialdehyde (MDA) Content and Relative Conductivity (RC)

MDA content was assessed using a slightly modified approach provided by Xiao, et al. [26]. Pulp (1 g) was homogenized in 5 mL of 10% (w/v) trichloroacetic acid (TCA) solution. Then, it was centrifuged at 4 °C at 10,000× g for 20 min, and the supernatant was collected and stored at low temperature. A 2 mL sample of the supernatant was taken and mixed with 2 mL of thiobarbituric acid TBA (0.67%) in a test tube, boiled in a water bath for 20 min, cooled to room temperature and then centrifuged. The absorbance values at 450 nm, 532 nm, and 600 nm were then determined. This was repeated three times and the mean value was reported. MDA content was determined using the following Equation (4) with the results represented in μmol L−1
MDA   μ mol   L 1 = 6.45 × A 532 nm A 600 nm   0.56 × A 450 nm × V V S × m
The relative conductivity measurement was performed based on the procedure described by Min, et al. [27] with minor alterations. Ten pieces of pulp tissue (10 mm diameter and 1 mm thickness) from the equatorial region of grapes were taken from five berries using a perforator, rinsed three times, and immersed in 20 mL of distilled water for 30 min. The initial conductivity (P0) was measured using a DDSJ-308A conductivity meter (Leici, Shanghai, China). The tissues were then heated at 100 °C for 10 min, cooled to room temperature, and the final conductivity (P1) was measured. The relative conductivity was determined using Equation (5) and given as a percentage.
Relative   conductivity   ( % ) = P 1 P 0 P 0 ×   100

2.6. Statistical Analysis

All data were analyzed using the software SPSS 22.0 (IBM, Armonk, NY, USA), and the graphs were plotted using the software Origin 2022 (OriginLab Corp. Northampton, MA, USA). Significant differences were calculated by Duncan’s test (p < 0.05).

3. Results

3.1. Physical Properties

3.1.1. Visual Appearance

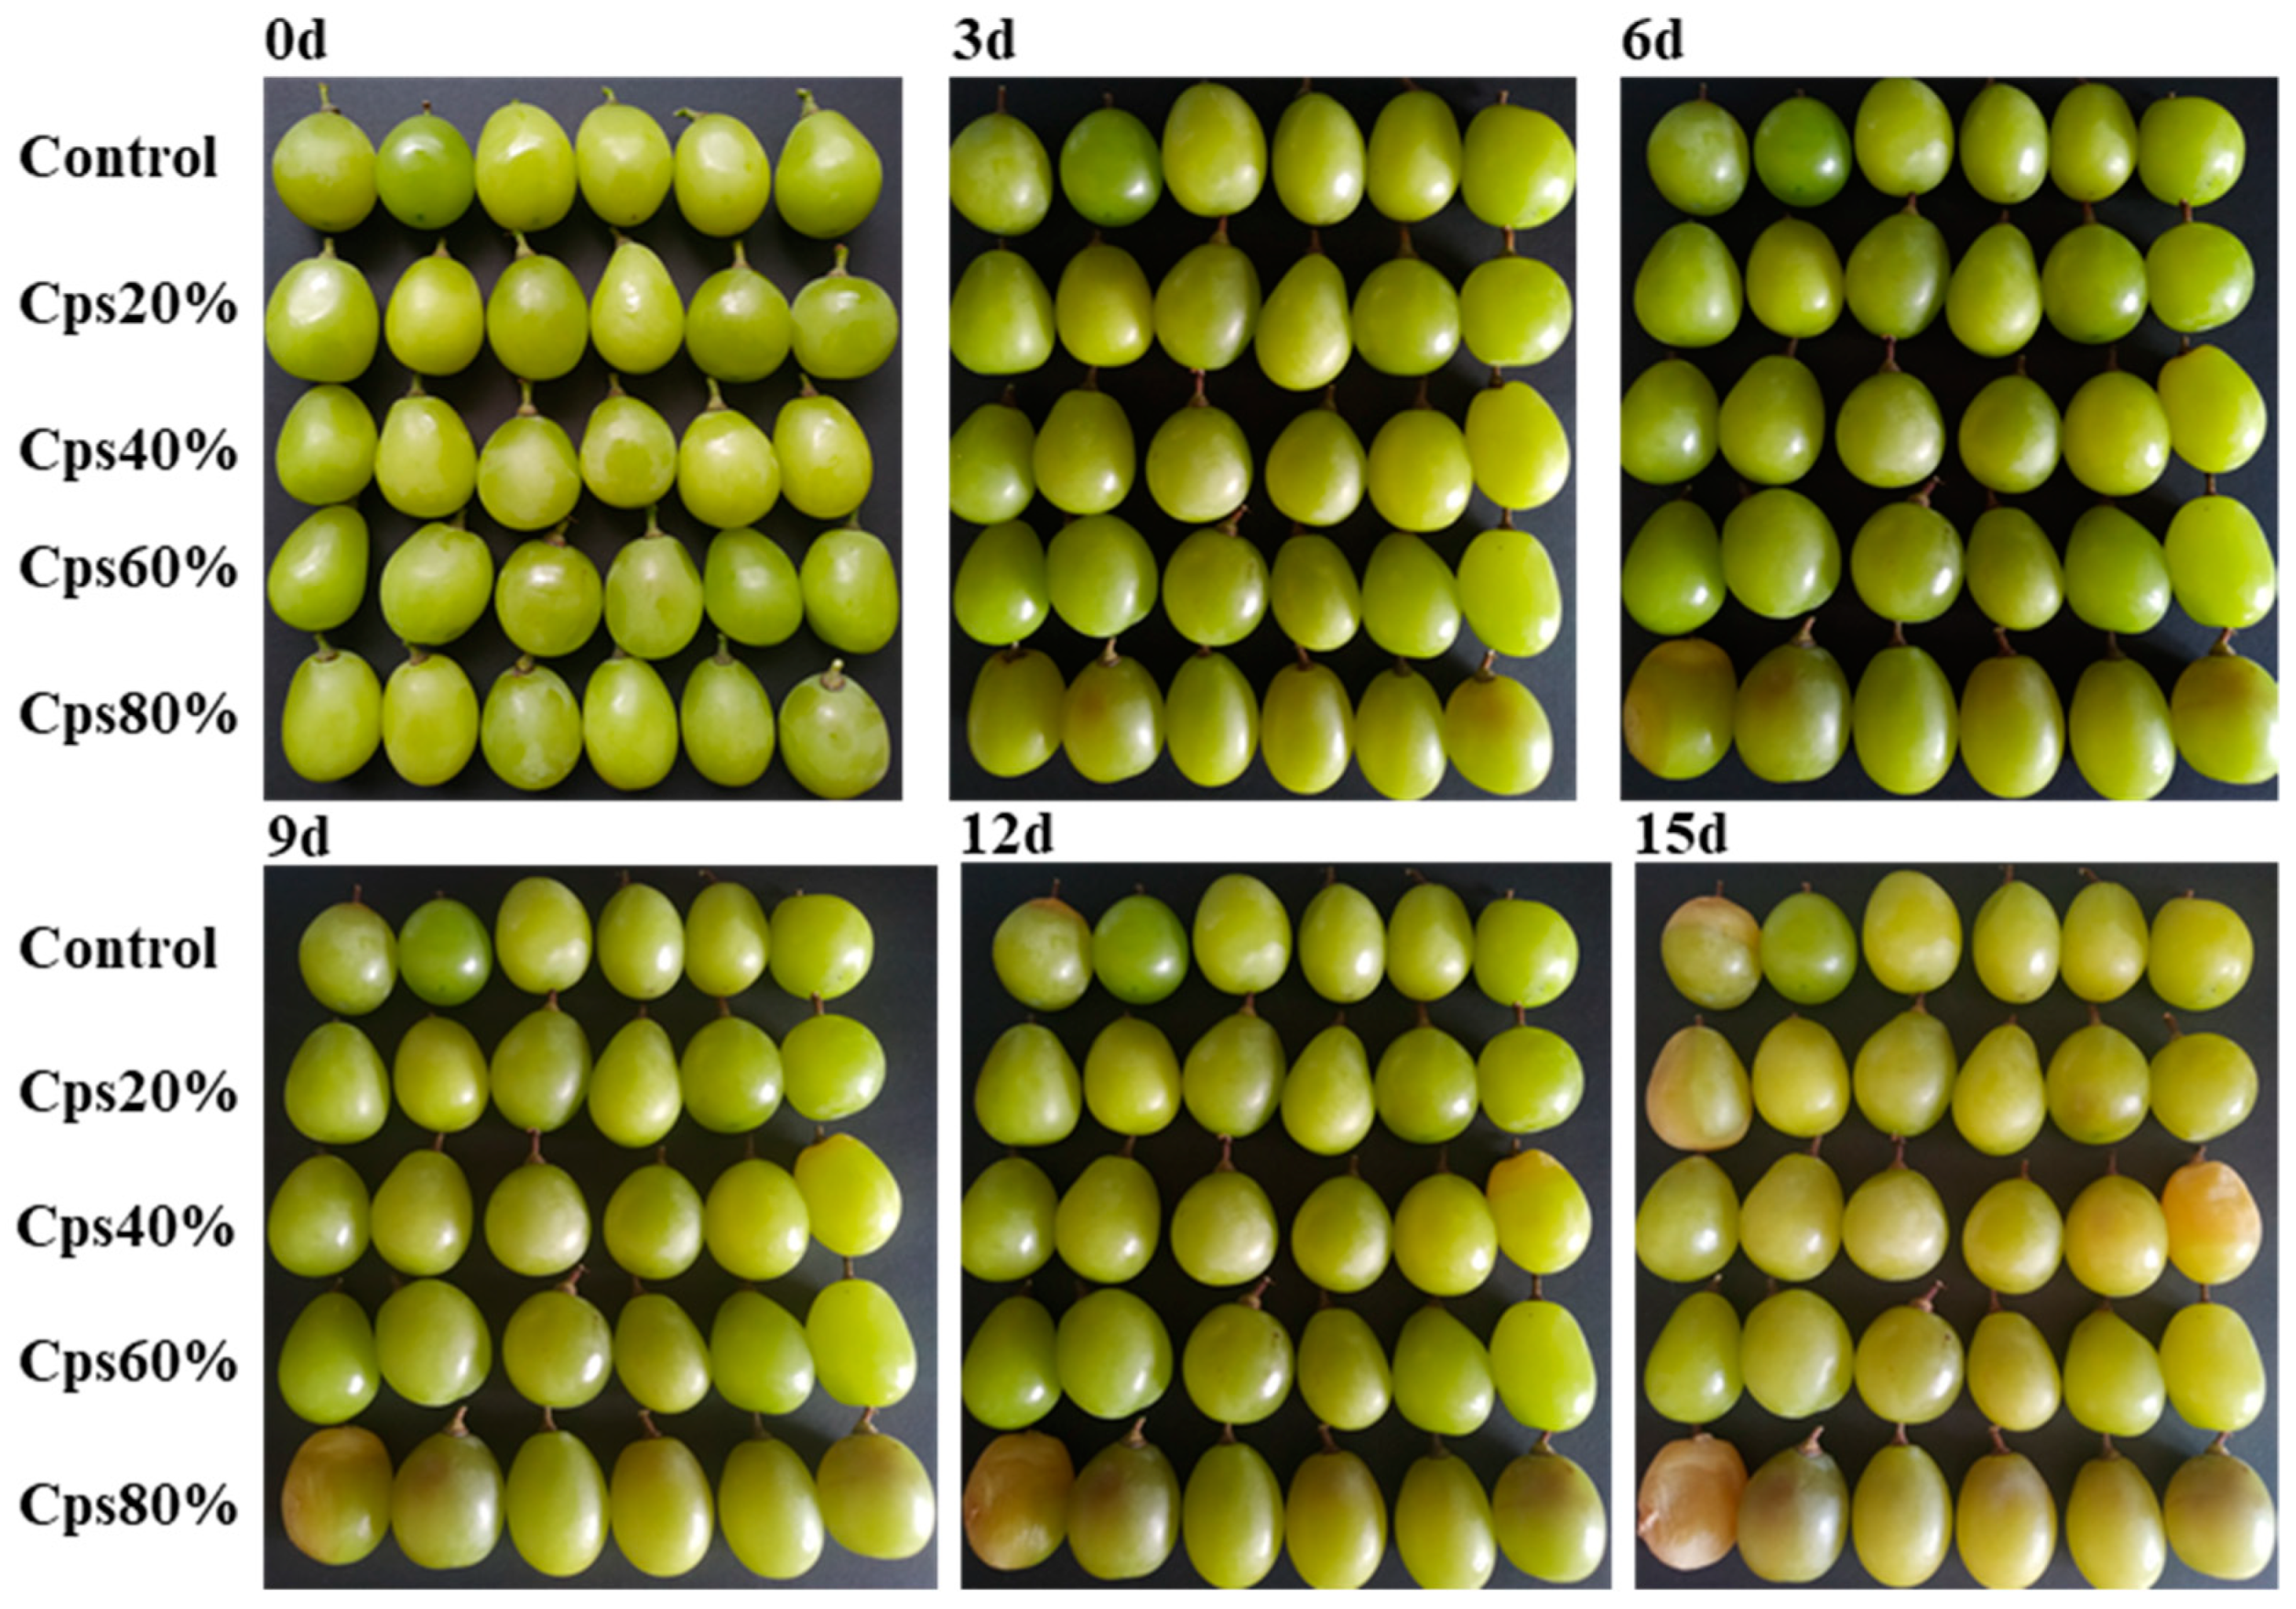
With the increase in storage time, softening, browning and decay were the main problems of the ‘Shine Muscat’ grape after compression damage. As shown in Figure 3, with increasing storage time and compression level, grape skin yellowing and pulp browning were severe in the treatment groups. After 6 days of storage, the degree of yellowing of the grape skin and browning of the flesh increased dramatically. After 9 days, flesh decay was severe, and the area of decay expanded in the Cps80% treatment group. After 15 days of storage, the number and the area size of berries rotted increased in the treatment groups, with the Cps80% group being the most severe. Compared with the treated groups, the control group showed low browning and yellowing of the grapes.

3.1.2. Color

The color of grapes is a key quality criterion that is thought to be a primary factor influencing customer approval. The degree of peel color variation can be reflected by L* (brightness value), a* (red-green value), and b* (yellow-blue value). As shown in Table 1, the L*, a*, b*, and ΔE values of ‘Shine Muscat’ grapes during storage were displayed. During storage, the a*, b*, and ΔE values were significantly increased in both the control and compression groups. The L* value of the compression groups was significantly lower than that of the control group and continued to decrease throughout the storage process. A lower L* value indicates a duller skin color of the grape. Particularly, the treatment group Cps80% displayed a lower L* value. At the end of the storage period, the a* color value of the treatment groups increased by 4.1 to 4.7 units, indicating a greater loss of green color in the treated samples. The b* color value of the control group increased by 4.16 units, while that of the treatment groups increased by 5.13–6.80 units, indicating that the control group had more severe yellowing of the grape peel than the treatment groups.

3.2. Cell Structure

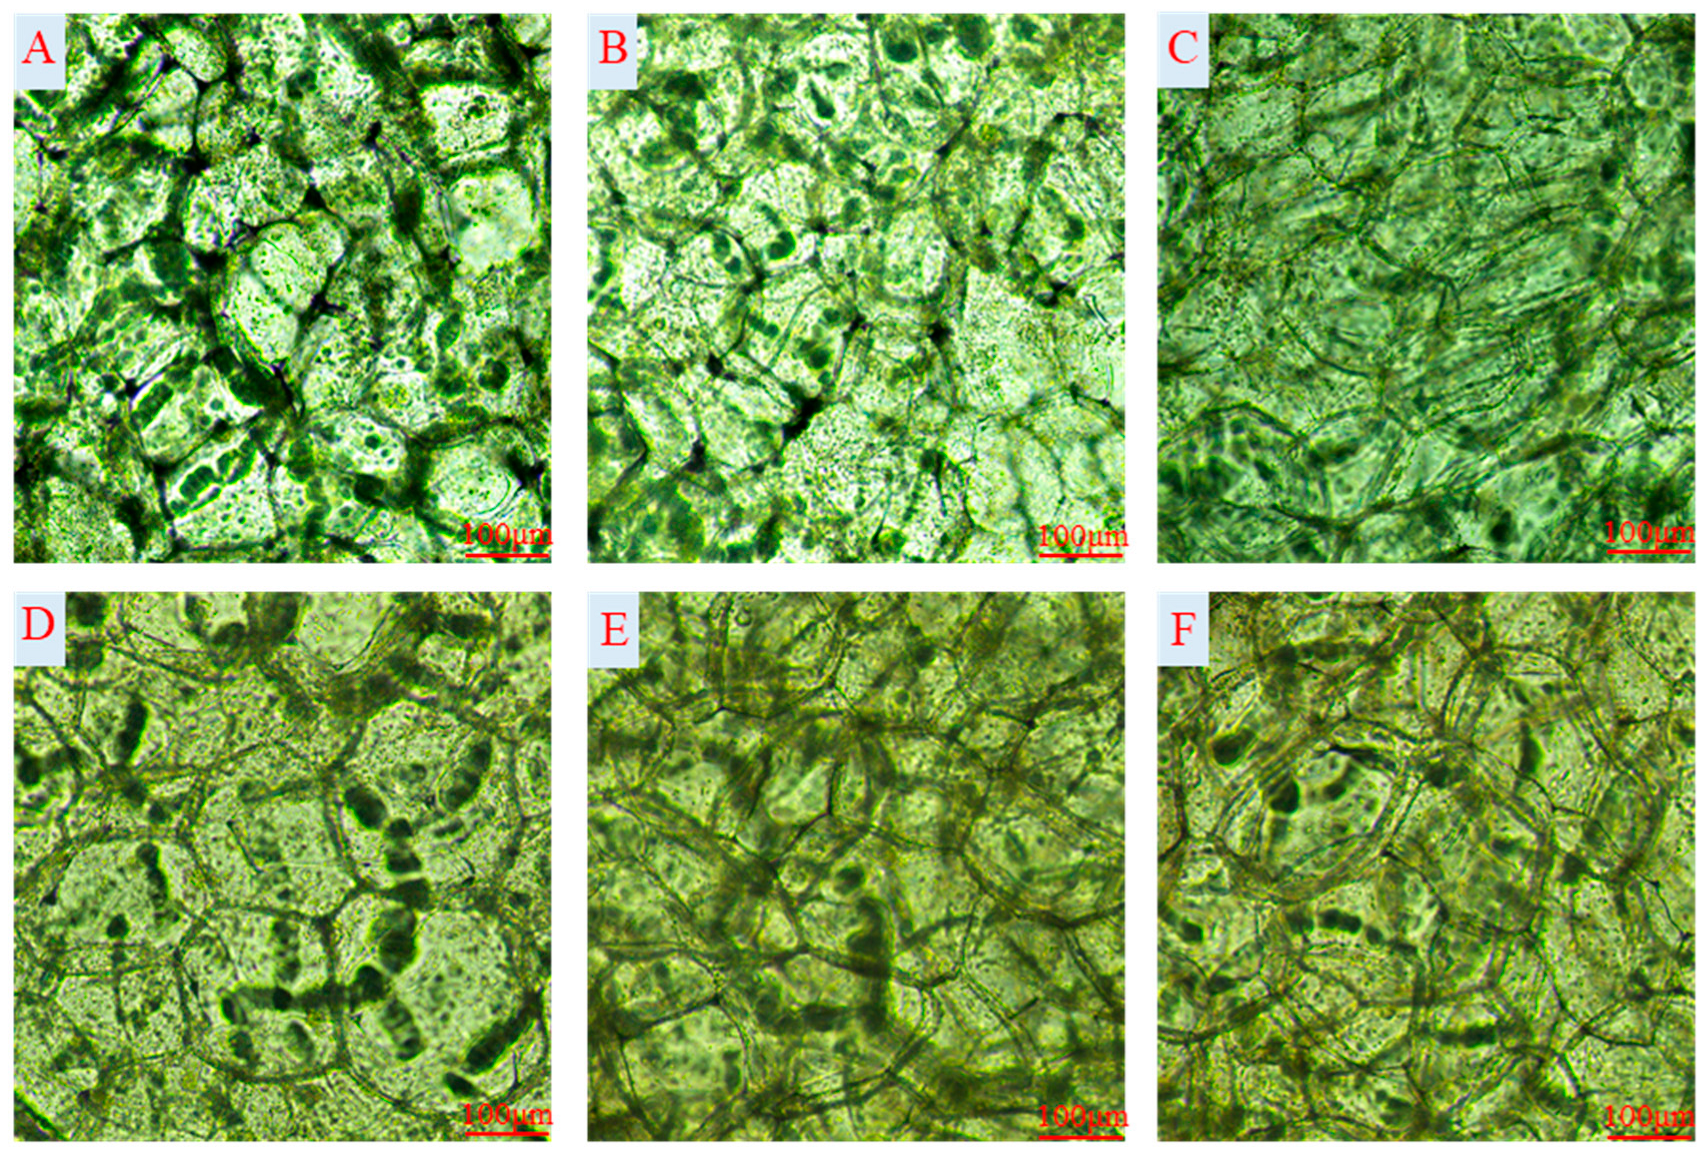
Changes in the microstructure of ‘Shine Muscat’ grape cells at different compression levels were observed by electron microscopy. On day 0, the control grapes had an intact and plump cell structure with tightly arranged cell layers (Figure 4A). After 15 days of storage, the treated groups had severely deformed cell structure and loose flesh cells with incomplete cell edges (Figure 4C–F) while the control group maintained better cell structure during storage with clear overall tissue structure (Figure 4B). It is noteworthy that the Cps80% group suffered the highest degree of compression, with severe cell deformation, broken cell walls, and spillage of cell contents.
As shown in Table 2, the geometric parameters of the pulp cells of ‘Shine Muscat’ grapes changed significantly after different compression treatments. After 15 days of storage, the grape flesh cell area of control group and the Cps20%, Cps40%, Cps60%, and Cps 80% treatment groups was 11,773.78 ± 862.91 μm2, 16,500.66 ± 6654.17 μm2, 30,748.30 ± 3259.18 μm2, 30,997.73 ± 5644.37 μm2, and 33,255.06 ± 3023.24 μm2, respectively. The cell area of pulp tissue in the treated groups was significantly higher than that in the control group (p < 0.05). The perimeter of grape pulp cells was 422.46 ± 31.35 μm, 480.31 ± 99.39 μm, 667.03 ± 31.46 μm, 690.42 ± 47.69 μm, and 738.23 ± 29.52 μm, in the control and treated groups, respectively. Compared with the control group, the pulp cell perimeter in the treatment groups was significantly higher. The long and short diameters of pulp cells in the treatment groups were higher than those in the control group. The circular rate of the Cps20% and Cps40% groups was significantly different from that of the Cps80% group (p < 0.05). The Cps80% treatment group had the lowest rate of rounding of grape flesh cells, indicating the most deformation of flesh cells.

3.3. Texture Profile Analysis

The textural property values of each group deteriorated to various degrees during storage (Figure 5). In comparison to the control group, the firmness of grapes in the treatment groups dramatically decreased after storage (Figure 5A). After 3 days of storage, the reduction in the hardness of the grape berries was more pronounced in the treatment groups than in the control group. At the end of 15 day of storage, compared with the initial value, the fruit firmness of ‘Shine Muscat’ grapes in the control group and the Cps20%, Cps40%, Cps60%, and Cps80% treatment groups decreased by 38.10%, 42.10%, 51.06%, 60.62% and 67.89%, respectively, and the degree of decrease in the Cps80% treatment group was 1.70 times that of the control group. The springiness of grape berries in the control group decreased by 33.96%, while that of the treated groups decreased by 37.43%, 42.48%, 44.92%, and 49.65%, respectively (Figure 5B). After the storage period, the cohesiveness of grapes in the Cps20%, Cps40%, Cps60% and Cps80% treatment groups decreased by 38.74%, 41.41%, 45.95% and 51.73%, respectively, while the cohesiveness of grapes in the control group reduced by 36.87% (Figure 5C). After 15 days of storage, the control grapes retained 66.63% of their original chewiness while the treated grapes retained only 53.39%, 48.15%, 47.76%, and 46.36% of their original chewiness, respectively (Figure 5D).

3.4. Physiological Properties

3.4.1. Total Soluble Solids (TSS), Titratable Acidity (TA), and Ascorbic Acid (AsA)

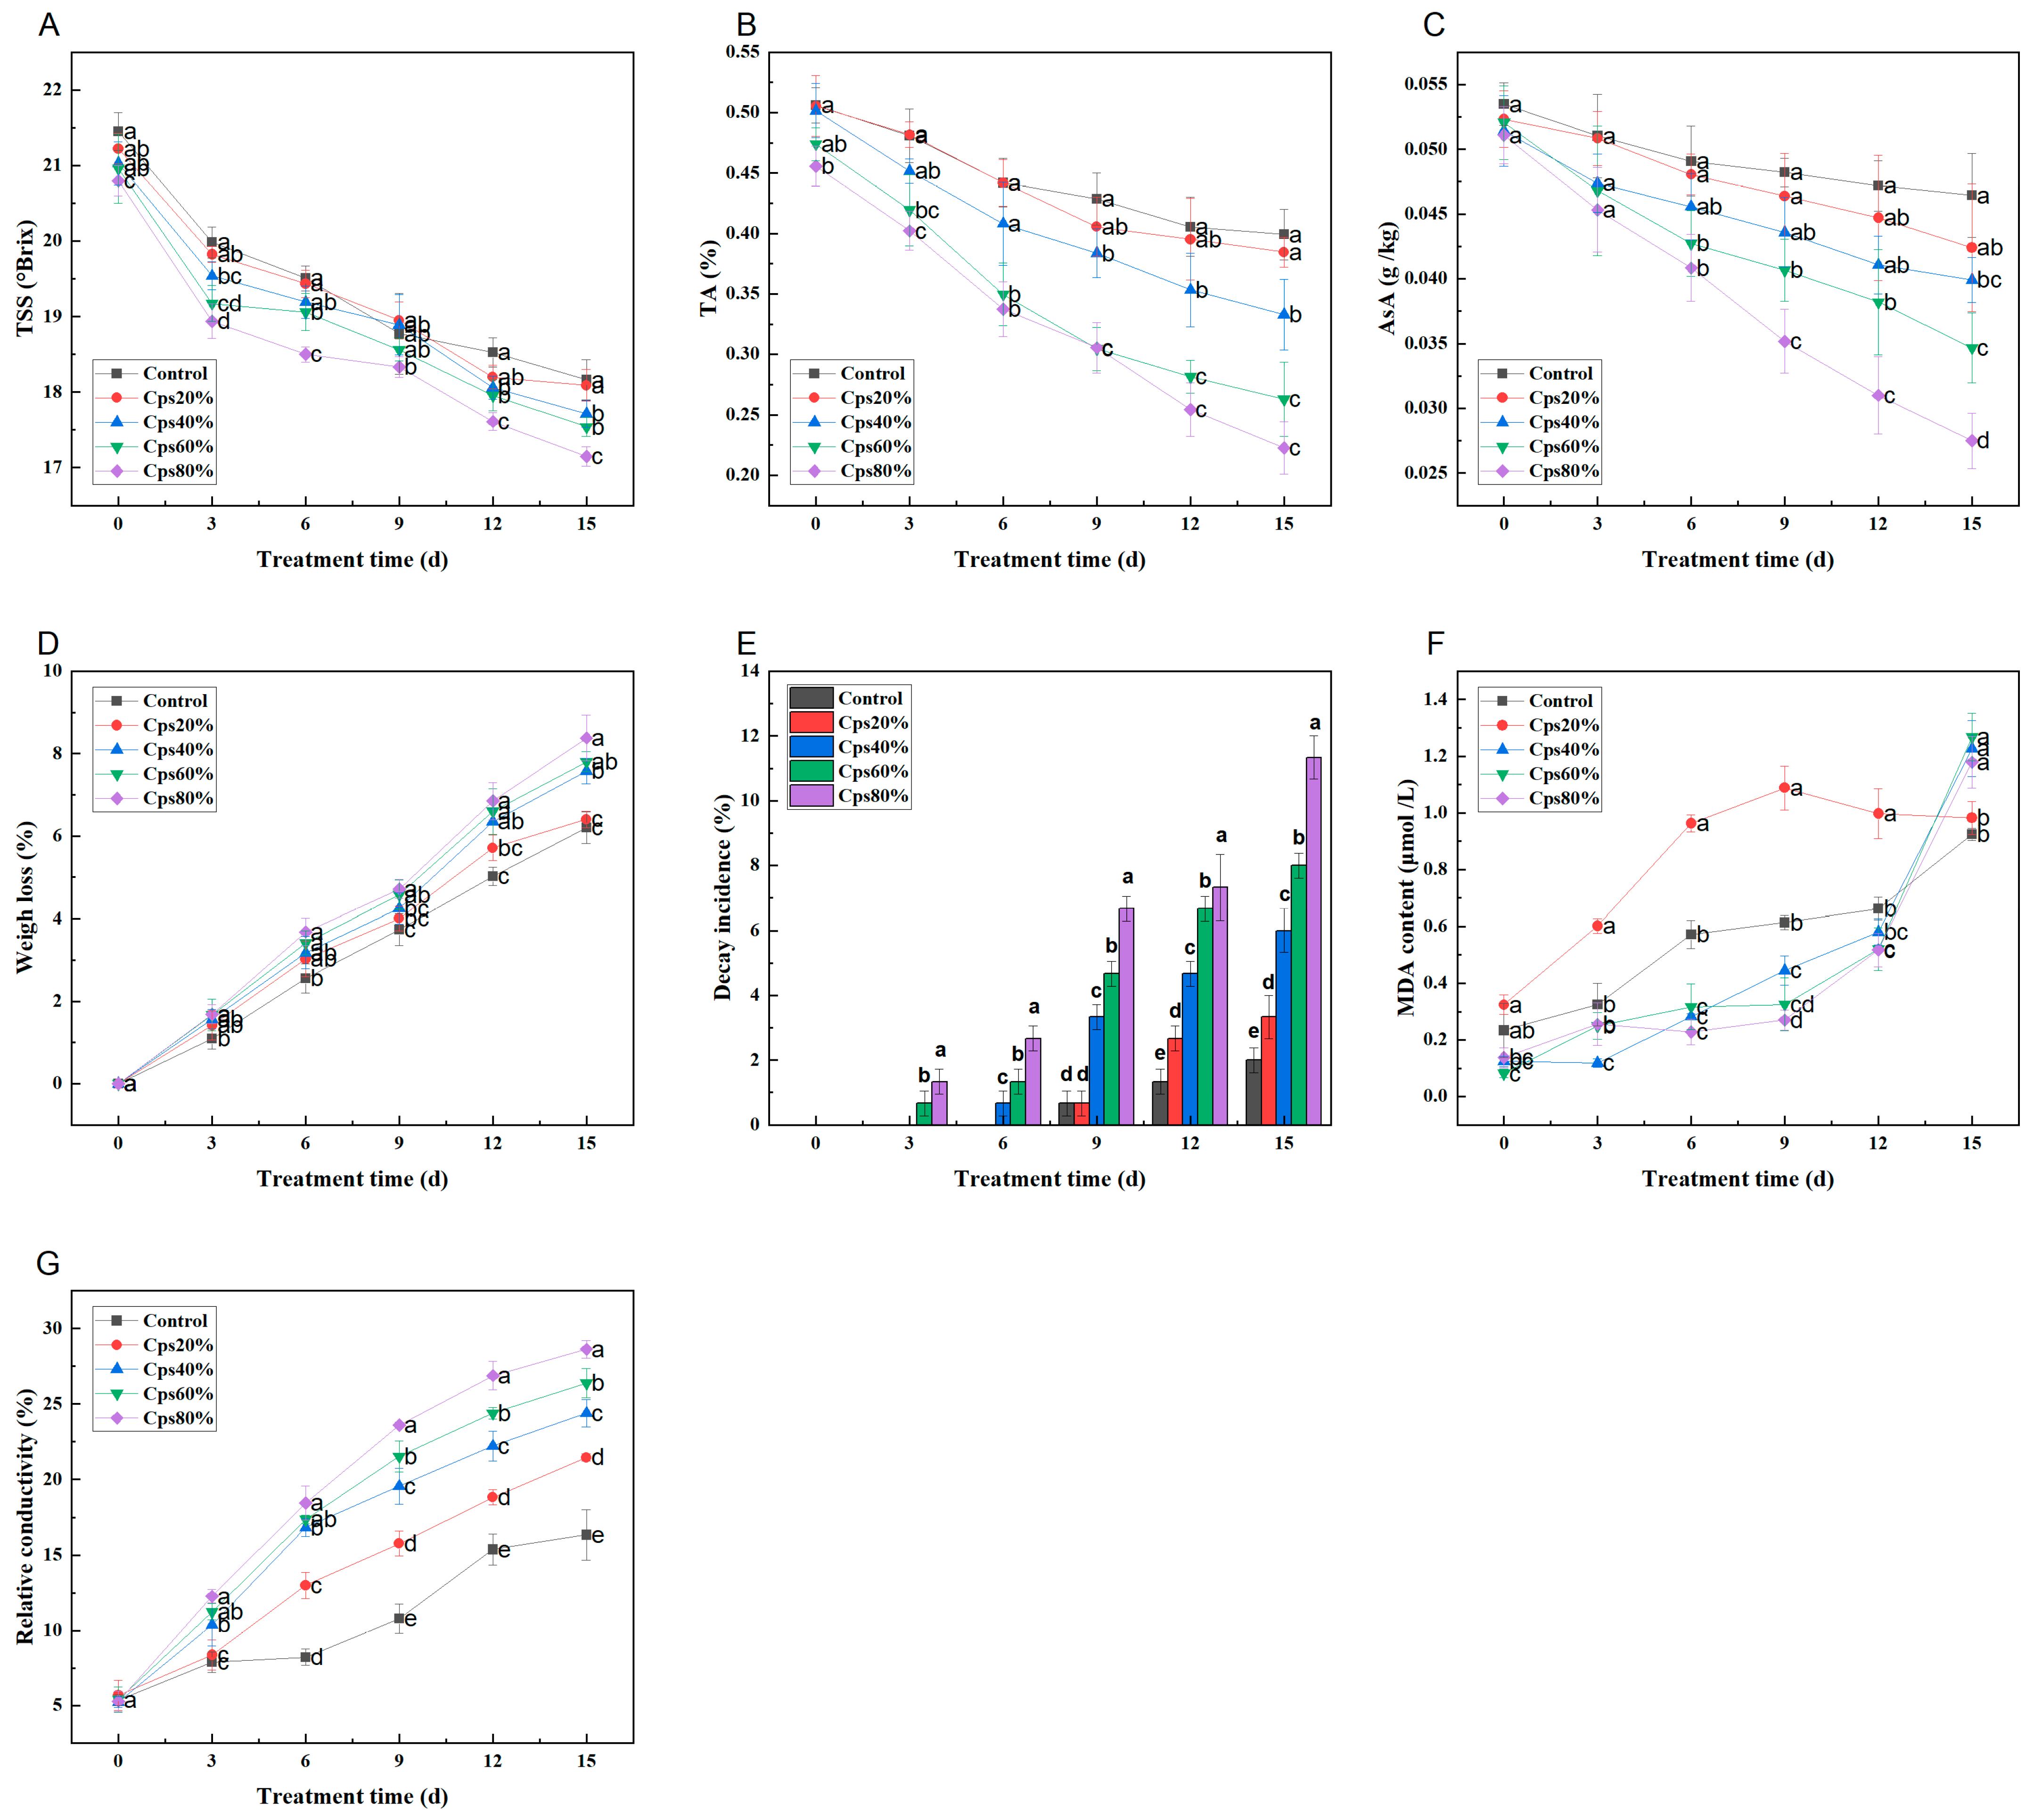
TSS is a significant index for evaluating the postharvest quality of the ‘Shine Muscat’ grape. The TSS of each group decreased with storage time (Figure 6A). The TSS of each group reached the lowest value at 15 day. Compared with the original values, the TSS content of the control and Cps20%, Cps40%, Cps60%, and Cps80% treatment groups decreased by 15.33%, 15.76%, 15.77%, 16.31%, and 17.54%, respectively. The degree of decrease in the Cps80% treatment group was 1.14 times that of the control group. The results showed that the compression treatment would accelerate the reduction in the TSS content of the ‘Shine Muscat’ grapes and accelerate the consumption of nutrients in grapes.
TA content correlates with the flavor and taste qualities of the ‘Shine Muscat’ grape. The variation of TA content in the ‘Shine Muscat’ grapes is shown in Figure 6B. With increasing storage time, the TA content of all groups displayed a declining trend. After 15 days of storage, the TA content of the ‘Shine Muscat’ grapes in the control and Cps20%, Cps40%, Cps60%, and Cps80% treatment groups decreased by 21.12%, 23.91%, 33.63%, 44.57%, and 51.13%, respectively. The degree of decrease in the Cps80% treatment group was 2.42 times that of the control group. The above results indicated that compression treatment was the possible reason for the loss of TA content in ‘Shine Muscat’ grapes during storage.
As shown in Figure 6C, the ascorbic acid content of the ‘Shine Muscat’ grapes generally showed a downward trend. The more severe the compression degree, the faster the ascorbic acid content decreased. After storage for 3 days, there was no significant difference between the control and treatment groups. After storage for 9 d, the ascorbic acid content of ‘Shine Muscat’ grapes in the Cps20%, Cps40%, Cps60%, and Cps80% compression treatment groups dropped sharply, dropping to 81.02%, 77.65%, 66.58%, and 53.82% of the initial value, respectively. The ascorbic acid content of ‘Shine Muscat’ grapes in the control group did not decrease significantly during storage. At the end of the storage period, the control group’s ascorbic acid content was 95.51% of the initial value. The results showed that the compressive stress accelerated the decomposition of ascorbic acid.

3.4.2. Weight Loss (WL) and Decay Incidence (DI)

Weight loss can reflect the postharvest quality change of ‘Shine Muscat’ grapes. Weight loss of ‘Shine Muscat’ grapes in all groups increased significantly during storage (Figure 6D). Weight loss in the control group increased the least (6.21 ± 0.38%), followed by the Cps20% group (6.41 ± 0.20%), Cps40% group (7.58 ± 0.31%), Cps60% group (7.80 ± 0.24%), and Cps80% group (8.38 ± 0.55%). The results showed that variable degrees of mechanical compression had different effects on the weight loss of table grapes. The more severely the grapes were compressed, the higher the weight loss. This may be due to mechanical compression causing different degrees of bruising to the grape skin and cell structure.
The incidence of decay of ‘Shine Muscat’ grape berries during storage is illustrated in Figure 6E. Degradation began in the treatments subjected to the greatest compression (60% and 80%) on day 3, while it was not apparent in the control group until day 9. With the extension of storage time, the berries’ decay showed an increasing trend, and the decay incidence in the treatment groups was significantly higher than that of the control group (p < 0.05). At the end of the storage period, the decay incidence in the Cps20%, Cps40%, Cps60%, and Cps80% treated groups was 1.67 times, 3 times, 4 times, and 5.67 times that of the control group, respectively. The results showed that ‘Shine Muscat’ grape berries damaged by compression were more susceptible to spoilage. In particular, the Cps80% treatment group achieved the highest decay rate at the later stage of storage.

3.4.3. Malondialdehyde (MDA) and Relative Conductivity (RC)

The effect of different compression degrees on the MDA content is shown in Figure 6F. During storage, the MDA content of all samples showed an overall upward trend. After storage for 15 days, the MDA content in the Cps20%, Cps40%, Cps60%, and Cps80% treatment groups was 1.06 times, 1.33 times, 1.37 times, and 1.28 times that of the control group, respectively. The above results indicated that compression treatment would aggravate the degree of membrane lipid peroxidation in the storage process of the ‘Shine Muscat’ grape, leading to oxidative damage of grapes and adversely affecting the preservation of grapes.
The relative conductivity of all samples exhibited a similar tendency, progressively rising with storage time (Figure 6G). After 15 days of storage, the relative conductivity of the control group was 16.34 ± 1.66%, which was 3.05 times the initial value. The relative conductivity of the Cps20%, Cps40%, Cps60%, and Cps80% treatment groups was 21.46 ± 0.23%, 24.39 ± 0.90%, 26.38 ± 0.96%, and 28.62 ± 0.59%, which were 3.78 times, 4.66 times, 4.89 times, and 5.41 times the initial value, respectively. The relative conductivity of the control group was the lowest, which was significantly different from the other treatment groups (p < 0.05). The results showed that each treatment group could exacerbate the increase in relative conductivity to different degrees. Mechanical compression can accelerate the destruction of the membrane integrity of table grapes during storage and promote grape senescence.

3.5. Correlation Analysis

In this study, correlation coefficients were evaluated for the measured parameters (Figure 7). There were significant differences between the loss of texture properties (firmness, springiness, cohesiveness, and chewiness) (p < 0.05). The contents of TSS, TA, and AsA were positively correlated with the loss of texture properties, whereas they were negatively correlated with weight loss, decay incidence, ΔE, MDA content, and relative conductivity. Notably, TSS had a significant positive correlation with TA and AsA (p < 0.01). These results indicated that the reduction in table grape fruit quality was accompanied by a reduction in textural properties and biochemical quality with increasing storage time after mechanical extrusion treatment, thus confirming the close relationship between mechanical extrusion damage and the reduction in textural properties and biochemical quality of table grapes.

4. Discussion

Previous research has shown that mechanical stressors, such as vibration, impact, friction, and compression, have a deleterious influence on postharvest fruit and vegetables throughout transport and storage [28,29]. However, the above mechanical stress treatments have mainly been applied to drupes and pears, while further research is necessary for soft and juicy berries such as cherries, blueberries, and grapes. In this study, we found that imperceptible compression treatments significantly reduced the physical and physiological characteristics of ‘Shine Muscat’ grapes, thus accelerating postharvest senescence and making it difficult to maintain the overall quality during storage.
Appearance is one of the most crucial quality criteria affecting consumer preferences [30]. Generally speaking, the most apparent feature of senescence of the ‘Shine Muscat’ grape is the yellowing of the epidermis and browning of flesh. Early on in storage, ‘Shine Muscat’ grapes did not exhibit exterior tissue damage, but as time went on, it was noticed that the glossiness of the skin gradually degraded, and the color of the fruit’s skin gradually changed from yellow-green to pale yellow. The internal tissues of the fruit are subjected to compressive stresses that can destroy cells in the subcutaneous tissues [7]. The external tissues of the fruit are prone to being subjected to higher stresses than the internal tissues, which can cause the internal tissues to fail before the external tissues rupture [18]. Although imperceptible on the surface, such damage bring enzymes and substrates into contact, releasing phenolic compounds and decisively affecting physiological changes in the fruit [31]. Dagdelen and Aday [10] demonstrated that the L* value of the peach decreased with the increase in storage time, and the control sample had a greater L* value than the vibrated sample. In the current investigation, we discovered that the brightness of the table grape epidermis’ L* value reduced after storage. The other color parameters a*, b*, and ΔE showed an upward trend throughout the storage process, which may have been due to enzymatic browning inside the table grape fruit caused by mechanical extrusion treatment. As a result, the grape flesh tissue was brown and the skin was tarnished. In particular, pulp tissue cell deformation was significant in the Cps60% and Cps80% groups. Compared with other groups, the pulp browning in the Cps 80% group was more severe, and the cell deformation was the greatest.
The texture of fruit and vegetables reveals their ripeness and softness [32]. According to studies, the alteration of pulp texture during fruit preservation is a remarkably complicated physiological process [33]. Fruit softening is principally caused by the gradual breakdown of the primary cell wall structure and components [34,35,36]. Previous research has reported that the hardness of the ‘Huangguan’ pear under random vibration decreased by 9~26%. With the increase in vibration time, the pulp hardness and damage volume decreased exponentially [37]. The results of the present study indicated that the texture properties of the Cps 80% treatment group changed the most and the pulp softened the most compared to the control and other treatment groups. This might be brought on by mechanical compression weakening the cell wall’s mechanical strength, decreased cell turgor pressure, and breakdown of the cell wall and polysaccharides. Mechanical extrusion treatment may stimulate the activity of cell wall degrading enzymes, thereby accelerating the softening of grape texture.
TSS, TA, and AsA are crucial physiological and nutritional indices that should be taken into consideration when storing fruit and vegetables, as we are all aware [38]. The consumption of TSS is usually associated with the metabolic process of the fruit, especially the physiological activities [38]. Ascorbic acid is an important nutrient element in fresh fruit, which has an antioxidant effect [39]. Early research suggests that mechanical damage during harvesting and loading leads to a reduction in soluble solids, titratable acidity and ascorbic acid in oranges [40]. Similarly, Montero discovered that impact damage caused by varying impact heights on two citrus cultivars resulted in a considerable drop in soluble solids, titratable acids, and ascorbic acid [41]. Blueberries showed similar outcomes after compression treatment during storage. This could be attributed to mechanical damage leading to oxidation of ascorbic acid exposure or mechanical damage stimulating fruit physiological metabolism and consuming more acid [42]. Xu, et al. [16] and Jung, et al. [43] also noted that simulated vibration significantly reduced soluble solid content (SSC) of postharvest blueberry and grape compared to the control group. Our findings suggest that mechanical compressive stress can reduce TSS, TA, and AsA levels in postharvest table grapes, particularly when stored for an extended period of time. It is worth noting that the primary nutrients in grape berries reduced dramatically in the Cps 80% treatment group.
In most cases, increased rates of respiration and transpiration are the principal causes of postharvest grape weight loss. This may be due to varying degrees of bruising of grape skins and cell walls by different degrees of mechanical extrusion. In the injured fruit, the original cell wall and cell membrane structure were destroyed, the respiration rate increased, the water loss and transpiration rate increased, and the fruit weight loss rate increased. Celik, et al. [44] reported that the weight loss of apple fruit increased with the prolongation of storage time and fruit damage. Mir and Shahbazi [15] and Tao, et al. [45] reported similar results. The results of this study showed that the ‘Shine Muscat’ grapes’ weight loss was greater in the compression treatment groups compared to the control group. In particular, the weight loss rate was higher in the Cps80% treatment group.
Relative conductivity and MDA content are commonly used to assess membrane integrity and degradation [46]. Fruit cell membrane permeability can reflect the degree of fruit senescence, and a rise in cell membrane permeability indicates cell membrane damage [47]. Similar findings were reported by Cui, et al. [28], who observed that simulated transport vibrations caused an apricot cell membrane to rupture, causing the cytosol to extravasate while also increasing relative conductivity and MAD concentration. The current study found that compression treatment improved the MDA concentration and relative electrical conductivity of the ‘Shine Muscat’ grape. Mechanical compression may have aggravated the membrane lipid peroxidation of the berries and disrupted the integrity of the cell membrane system. This indicated that mechanical compression treatment might accelerate membrane deterioration and exacerbate berry senescence during storage. MDA content and relative conductivity increased with storage time and were more noticeable in the compressed treatment groups, which was similar to results observed in sweet cherry fruit [46].

5. Conclusions

The effects of mechanical compression (20%, 40%, 60% and 80%) on the appearance, color, soluble solids content, titratable acid content, ascorbic acid content, weight loss, textural characteristics and microstructure of ‘Shine Muscat’ grapes during short-term cold storage were investigated. The results revealed that mechanical compression treatment accelerated the loss of nutrients and reduced the textural properties of ‘Shine Muscat’ grapes during storage, resulting in severe cell membrane lipidation, increased weight loss, exterior shrinkage, reduction in skin glossiness, and severe microstructural damage. The higher the degree of compression, the more severe the loss of quality of ‘Shine Muscat’ grapes. Correlation analysis showed that rot and senescence were remarkably correlated with physical, physiological, and qualitative characteristics of ‘Shine Muscat’ grapes after compression damage. Compression damage causes changes in outward physical attributes in addition to interior physiological, biochemical, and microstructural changes in ‘Shine Muscat’ grapes. Therefore, a series of careful and gentle treatments are essential to maintain the high quality of fresh grapes. At the same time, to potentially lessen the negative impacts of pressure stress on the postharvest quality of table grapes, more study is required to create suitable packaging materials and novel packaging techniques. The results of this study can be used to help quantitatively predict the internal damage evolution of table grapes and determine grape damage sensitivity, providing theoretical support for reducing grape mechanical damage.

Author Contributions

Conceptualization, S.Z. (Shan Zhu) and J.L.; methodology, S.Z. (Shan Zhu) and J.L.; software, S.Z. (Shan Zhu); validation, S.Z. (Shan Zhu) and J.L.; formal analysis, S.Z. (Shan Zhu), J.L., and Q.Y.; investigation, S.Z. (Shan Zhu); resources, J.L.; data curation, S.Z. (Shan Zhu), Z.T., and J.Q.; writing—original draft preparation, S.Z. (Shan Zhu); writing—review & editing, S.Z. (Shan Zhu), J.L., Q.Y., Y.J., H.Z. and S.Z. (Shengyi Zhao). All authors have read and agreed to the published version of the manuscript.

Funding

This work was supported by National Natural Science Foundation of China (N 4SFC) (No. 31971795), Project of Jiangsu Modern Agricultural Machinery Equipment & Technology Demonstration and Promotion (No. NJ2021-13), Modern Agriculture Project of Jiangsu Province Key R&D Program (No. BE2022363), and Jiangsu Province Modern Agricultural Machinery Equipment and Technology Demonstration Promotion Project (No. NJ2022-03).

Data Availability Statement

Data are contained within the article.

Conflicts of Interest

The authors declare no conflict of interest.

References

  1. FAO. Grapes Production Quantity and Area Harvested. Available online: https://www.fao.org/faostat/en/#data/QCL (accessed on 1 February 2023).
  2. Zhang, L.; Li, X.; Pang, Y.; Cai, X.; Lu, J.; Ren, X.; Kong, Q. Phenolics composition and contents, as the key quality parameters of table grapes, may be influenced obviously and differently in response to short-term high temperature. LWT 2021, 149, 111791. [Google Scholar] [CrossRef]
  3. Faheem, M.; Liu, J.; Chang, G.; Ahmad, I.; Peng, Y. Hanging force analysis for realizing low vibration of grape clusters during speedy robotic post-harvest handling. Int. J. Agric. Biol. Eng. 2021, 14, 62–71. [Google Scholar] [CrossRef]
  4. Mohammad Shafie, M.; Rajabipour, A.; Mobli, H. Determination of Bruise Incidence of Pomegranate Fruit under Drop Case. Int. J. Fruit Sci. 2017, 17, 296–309. [Google Scholar] [CrossRef]
  5. Hussein, Z.; Fawole, O.A.; Opara, U.L. Preharvest factors influencing bruise damage of fresh fruits—A review. Sci.Hortic. 2018, 229, 45–58. [Google Scholar] [CrossRef]
  6. Hussein, Z.; Fawole, O.A.; Opara, U.L. Bruise damage susceptibility of pomegranates (Punica granatum L.) and impact on fruit physiological response during short term storage. Sci. Hortic. 2019, 246, 664–674. [Google Scholar] [CrossRef]
  7. Opara, U.L.; Pathare, P.B. Bruise damage measurement and analysis of fresh horticultural produce—A review. Postharvest Biol. Technol. 2014, 91, 9–24. [Google Scholar] [CrossRef]
  8. Fadiji, T.; Coetzee, C.; Chen, L.; Chukwu, O.; Opara, U.L. Susceptibility of apples to bruising inside ventilated corrugated paperboard packages during simulated transport damage. Postharvest Biol. Technol. 2016, 118, 111–119. [Google Scholar] [CrossRef]
  9. Li, Z.; Thomas, C. Quantitative evaluation of mechanical damage to fresh fruits. Trends Food Sci. Technol. 2014, 35, 138–150. [Google Scholar] [CrossRef]
  10. Dagdelen, C.; Aday, M.S. The effect of simulated vibration frequency on the physico-mechanical and physicochemical properties of peach during transportation. LWT 2021, 137, 110497. [Google Scholar] [CrossRef]
  11. Chaiwong, S.; Yoythaisong, P.; Arwatchananukul, S.; Aunsri, N.; Tontiwattanakul, K.; Trongsatitkul, T.; Kitazawa, H.; Saengrayap, R. Vibration damage in guava during simulated transportation assessed by digital image analysis using response surface methodology. Postharvest Biol. Technol. 2021, 181, 111641. [Google Scholar] [CrossRef]
  12. Sun, Y.; Pessane, I.; Pan, L.; Wang, X. Hyperspectral characteristics of bruised tomatoes as affected by drop height and fruit size. LWT 2021, 141, 110863. [Google Scholar] [CrossRef]
  13. Lin, M.; Chen, J.; Chen, F.; Zhu, C.; Wu, D.; Wang, J.; Chen, K. Effects of cushioning materials and temperature on quality damage of ripe peaches according to the vibration test. Food Packag. Shelf Life 2020, 25, 100518. [Google Scholar] [CrossRef]
  14. Xu, F.; Lu, F.; Xiao, Z.; Li, Z. Influence of drop shock on physiological responses and genes expression of apple fruit. Food Chem. 2020, 303, 125424. [Google Scholar] [CrossRef] [PubMed]
  15. Mir, H.; Shahbazi, F. Simulated transit vibration effects on the postharvest quality of persimmon during storage. Postharvest Biol. Technol. 2022, 189, 111918. [Google Scholar] [CrossRef]
  16. Xu, F.; Liu, S.; Liu, Y.; Wang, S. Effect of mechanical vibration on postharvest quality and volatile compounds of blueberry fruit. Food Chem. 2021, 349, 129216. [Google Scholar] [CrossRef] [PubMed]
  17. Solairaj, D.; Yang, Q.; Guillaume Legrand, N.N.; Routledge, M.N.; Zhang, H. Molecular explication of grape berry-fungal infections and their potential application in recent postharvest infection control strategies. Trends Food Sci. Technol. 2021, 116, 903–917. [Google Scholar] [CrossRef]
  18. Miraei Ashtiani, S.-H.; Sadrnia, H.; Mohammadinezhad, H.; Aghkhani, M.H.; Khojastehpour, M.; Abbaspour-Fard, M.H. FEM-based simulation of the mechanical behavior of grapefruit under compressive loading. Sci. Hortic. 2019, 245, 39–46. [Google Scholar] [CrossRef]
  19. Al-Dairi, M.; Pathare, P.B.; Al-Yahyai, R.; Opara, U.L. Mechanical damage of fresh produce in postharvest transportation: Current status and future prospects. Trends Food Sci. Technol. 2022, 124, 195–207. [Google Scholar] [CrossRef]
  20. Hussein, Z.; Fawole, O.A.; Opara, U.L. Harvest and Postharvest Factors Affecting Bruise Damage of Fresh Fruits. Hortic. Plant J. 2020, 6, 1–13. [Google Scholar] [CrossRef]
  21. Faheem, M.; Liu, J.; Chang, G.; Abbas, I.; Xie, B.; Shan, Z.; Yang, K. Experimental Research on Grape Cluster Vibration Signals during Transportation and Placing for Harvest and Post-Harvest Handling. Agriculture 2021, 11, 902. [Google Scholar] [CrossRef]
  22. Champa, W.A.H.; Gill, M.I.S.; Mahajan, B.V.C.; Arora, N.K. Postharvest treatment of polyamines maintains quality and extends shelf-life of table grapes (Vitis vinifera L.) cv. Flame Seedless. Postharvest Biol. Technol. 2014, 91, 57–63. [Google Scholar] [CrossRef]
  23. Najafi Marghmaleki, S.; Mortazavi, S.M.H.; Saei, H.; Mostaan, A. The Effect of Alginate-Based Edible Coating Enriched with Citric Acid and Ascorbic Acid on Texture, Appearance and Eating Quality of Apple Fresh-Cut. Int. J. Fruit Sci. 2020, 21, 40–51. [Google Scholar] [CrossRef]
  24. Dhital, R.; Joshi, P.; Becerra-Mora, N.; Umagiliyage, A.; Chai, T.; Kohli, P.; Choudhary, R. Integrity of edible nano-coatings and its effects on quality of strawberries subjected to simulated in-transit vibrations. LWT 2017, 80, 257–264. [Google Scholar] [CrossRef]
  25. Awad, M.A.; Al-Qurashi, A.D.; Mohamed, S.A. Postharvest trans -resveratrol and glycine betaine treatments affect quality, antioxidant capacity, antioxidant compounds and enzymes activities of ‘El-Bayadi’ table grapes after storage and shelf life. Sci. Hortic. 2015, 197, 350–356. [Google Scholar] [CrossRef]
  26. Xiao, J.; Gu, C.; Zhu, D.; Huang, Y.; Luo, Y.; Zhou, Q. Development and characterization of an edible chitosan/zein-cinnamaldehyde nano-cellulose composite film and its effects on mango quality during storage. LWT 2021, 140, 110809. [Google Scholar] [CrossRef]
  27. Min, D.; Dong, L.; Shu, P.; Cui, X.; Zhang, X.; Li, F. The application of carbon dioxide and 1-methylcyclopropene to maintain fruit quality of ‘Niuxin’ persimmon during storage. Sci. Hortic. 2018, 229, 201–206. [Google Scholar] [CrossRef]
  28. Cui, K.; Yang, L.; Shu, C.; Liu, J.; Zhu, Z.; Yang, Z.; Zhu, X.; Jiang, W. Near freezing temperature storage alleviates cell wall polysaccharide degradation and softening of apricot (Prunus armeniaca L.) fruit after simulated transport vibration. Sci. Hortic. 2021, 288, 110296. [Google Scholar] [CrossRef]
  29. Stopa, R.; Szyjewicz, D.; Komarnicki, P.; Kuta, Ł. Limit values of impact energy determined from contours and surface pressure distribution of apples under impact loads. Comput. Electron. Agric. 2018, 154, 1–9. [Google Scholar] [CrossRef]
  30. Abbasi, N.; Ali, I.; Hafiz, I.; Alenazi, M.; Shafiq, M. Effects of Putrescine Application on Peach Fruit during Storage. Sustainability 2019, 11, 2013. [Google Scholar] [CrossRef]
  31. Spricigo, P.C.; Freitas, T.P.; Purgatto, E.; Ferreira, M.D.; Correa, D.S.; Bai, J.; Brecht, J.K. Visually imperceptible mechanical damage of harvested tomatoes changes ethylene production, color, enzyme activity, and volatile compounds profile. Postharvest Biol. Technol. 2021, 176, 111503. [Google Scholar] [CrossRef]
  32. Cheng, C.; Liu, J.; Wang, X.; Wang, Y.; Yuan, Y.; Yang, S. PpERF/ABR1 functions as an activator to regulate PpPG expression resulting in fruit softening during storage in peach (Prunus persica). Postharvest Biol. Technol. 2022, 189, 111919. [Google Scholar] [CrossRef]
  33. Chea, S.; Yu, D.J.; Park, J.; Oh, H.D.; Chung, S.W.; Lee, H.J. Fruit softening correlates with enzymatic and compositional changes in fruit cell wall during ripening in ‘Bluecrop’ highbush blueberries. Sci. Hortic. 2019, 245, 163–170. [Google Scholar] [CrossRef]
  34. Chen, Y.; Hung, Y.-C.; Chen, M.; Lin, H. Effects of acidic electrolyzed oxidizing water on retarding cell wall degradation and delaying softening of blueberries during postharvest storage. LWT 2017, 84, 650–657. [Google Scholar] [CrossRef]
  35. Fan, X.; Jiang, W.; Gong, H.; Yang, Y.; Zhang, A.; Liu, H.; Cao, J.; Guo, F.; Cui, K. Cell wall polysaccharides degradation and ultrastructure modification of apricot during storage at a near freezing temperature. Food Chem. 2019, 300, 125194. [Google Scholar] [CrossRef]
  36. Zhao, Y.; Zhu, X.; Hou, Y.; Wang, X.; Li, X. Effects of nitric oxide fumigation treatment on retarding cell wall degradation and delaying softening of winter jujube (Ziziphus jujuba Mill. cv. Dongzao) fruit during storage. Postharvest Biol. Technol. 2019, 156, 110954. [Google Scholar] [CrossRef]
  37. Wang, L.-J.; Zhang, Q.; Song, H.; Wang, Z.-W. Mechanical damage of ‘Huangguan’ pear using different packaging under random vibration. Postharvest Biol. Technol. 2022, 187, 111847. [Google Scholar] [CrossRef]
  38. Li, Z.; Zhang, W.; Li, X.; Liu, H.; Li, F.; Zhang, X. Combined effects of 1-methylcyclopropene and tea polyphenols coating treatment on the postharvest senescence and reactive oxygen species metabolism of bracken (Pteridium aquilinum var. latiusculum). Postharvest Biol. Technol. 2022, 185, 111813. [Google Scholar] [CrossRef]
  39. Pintos, F.M.; Lemoine, M.L.; Gergoff Grozeff, G.E.; Hasperué, H.J.; Vicente, A.R.; Rodoni, L.M. Use of riboflavin to reduce decay and extend the shelf-life of fresh-cut sweet pepper. Postharvest Biol. Technol. 2022, 188, 111882. [Google Scholar] [CrossRef]
  40. Miranda, M.; Spricigo, P.C.; Ferreira, M.D. Mechanical damage during harvest and loading affect orange postharvest quality. Eng. Agríc. 2015, 35, 154–162. [Google Scholar] [CrossRef]
  41. Montero, C.R.S.; Schwarz, L.L.; Santos, L.C.d.; Andreazza, C.S.; Kechinski, C.P.; Bender, R.J. Postharvest mechanical damage affects fruit quality of ‘Montenegrina’ and ‘Rainha’ tangerines. Pesqui. Agropecu. Bras. 2009, 44, 1636–1640. [Google Scholar] [CrossRef]
  42. Zheng, Z.; An, Z.; Yang, Y.; Chen, J.; Liu, X.; Lu, L. Metabolic profiling of blueberries (Vaccinium Spp.) to quantitatively and qualitatively assess bruise damage and fruit deterioration. Postharvest Biol. Technol. 2023, 195, 112135. [Google Scholar] [CrossRef]
  43. Jung, H.M.; Lee, S.; Lee, W.-H.; Cho, B.-K.; Lee, S.H. Effect of vibration stress on quality of packaged grapes during transportation. Eng. Agric. Environ. Food 2018, 11, 79–83. [Google Scholar] [CrossRef]
  44. Celik, H.K.; Ustun, H.; Erkan, M.; Rennie, A.E.W.; Akinci, I. Effects of bruising of ‘Pink Lady’ apple under impact loading in drop test on firmness, colour and gas exchange of fruit during long term storage. Postharvest Biol. Technol. 2021, 179, 111561. [Google Scholar] [CrossRef]
  45. Tao, F.; Chen, W.; Jia, Z. Effect of simulated transport vibration on the quality of shiitake mushroom (Lentinus edodes) during storage. Food Sci. Nutr. 2021, 9, 1152–1159. [Google Scholar] [CrossRef]
  46. Zhao, H.; Liu, B.; Zhang, W.; Cao, J.; Jiang, W. Enhancement of quality and antioxidant metabolism of sweet cherry fruit by near-freezing temperature storage. Postharvest Biol. Technol. 2019, 147, 113–122. [Google Scholar] [CrossRef]
  47. Wang, H.; Wu, Y.; Yu, R.; Wu, C.; Fan, G.; Li, T. Effects of postharvest application of methyl jasmonate on physicochemical characteristics and antioxidant system of the blueberry fruit. Sci. Hortic. 2019, 258, 108785. [Google Scholar] [CrossRef]
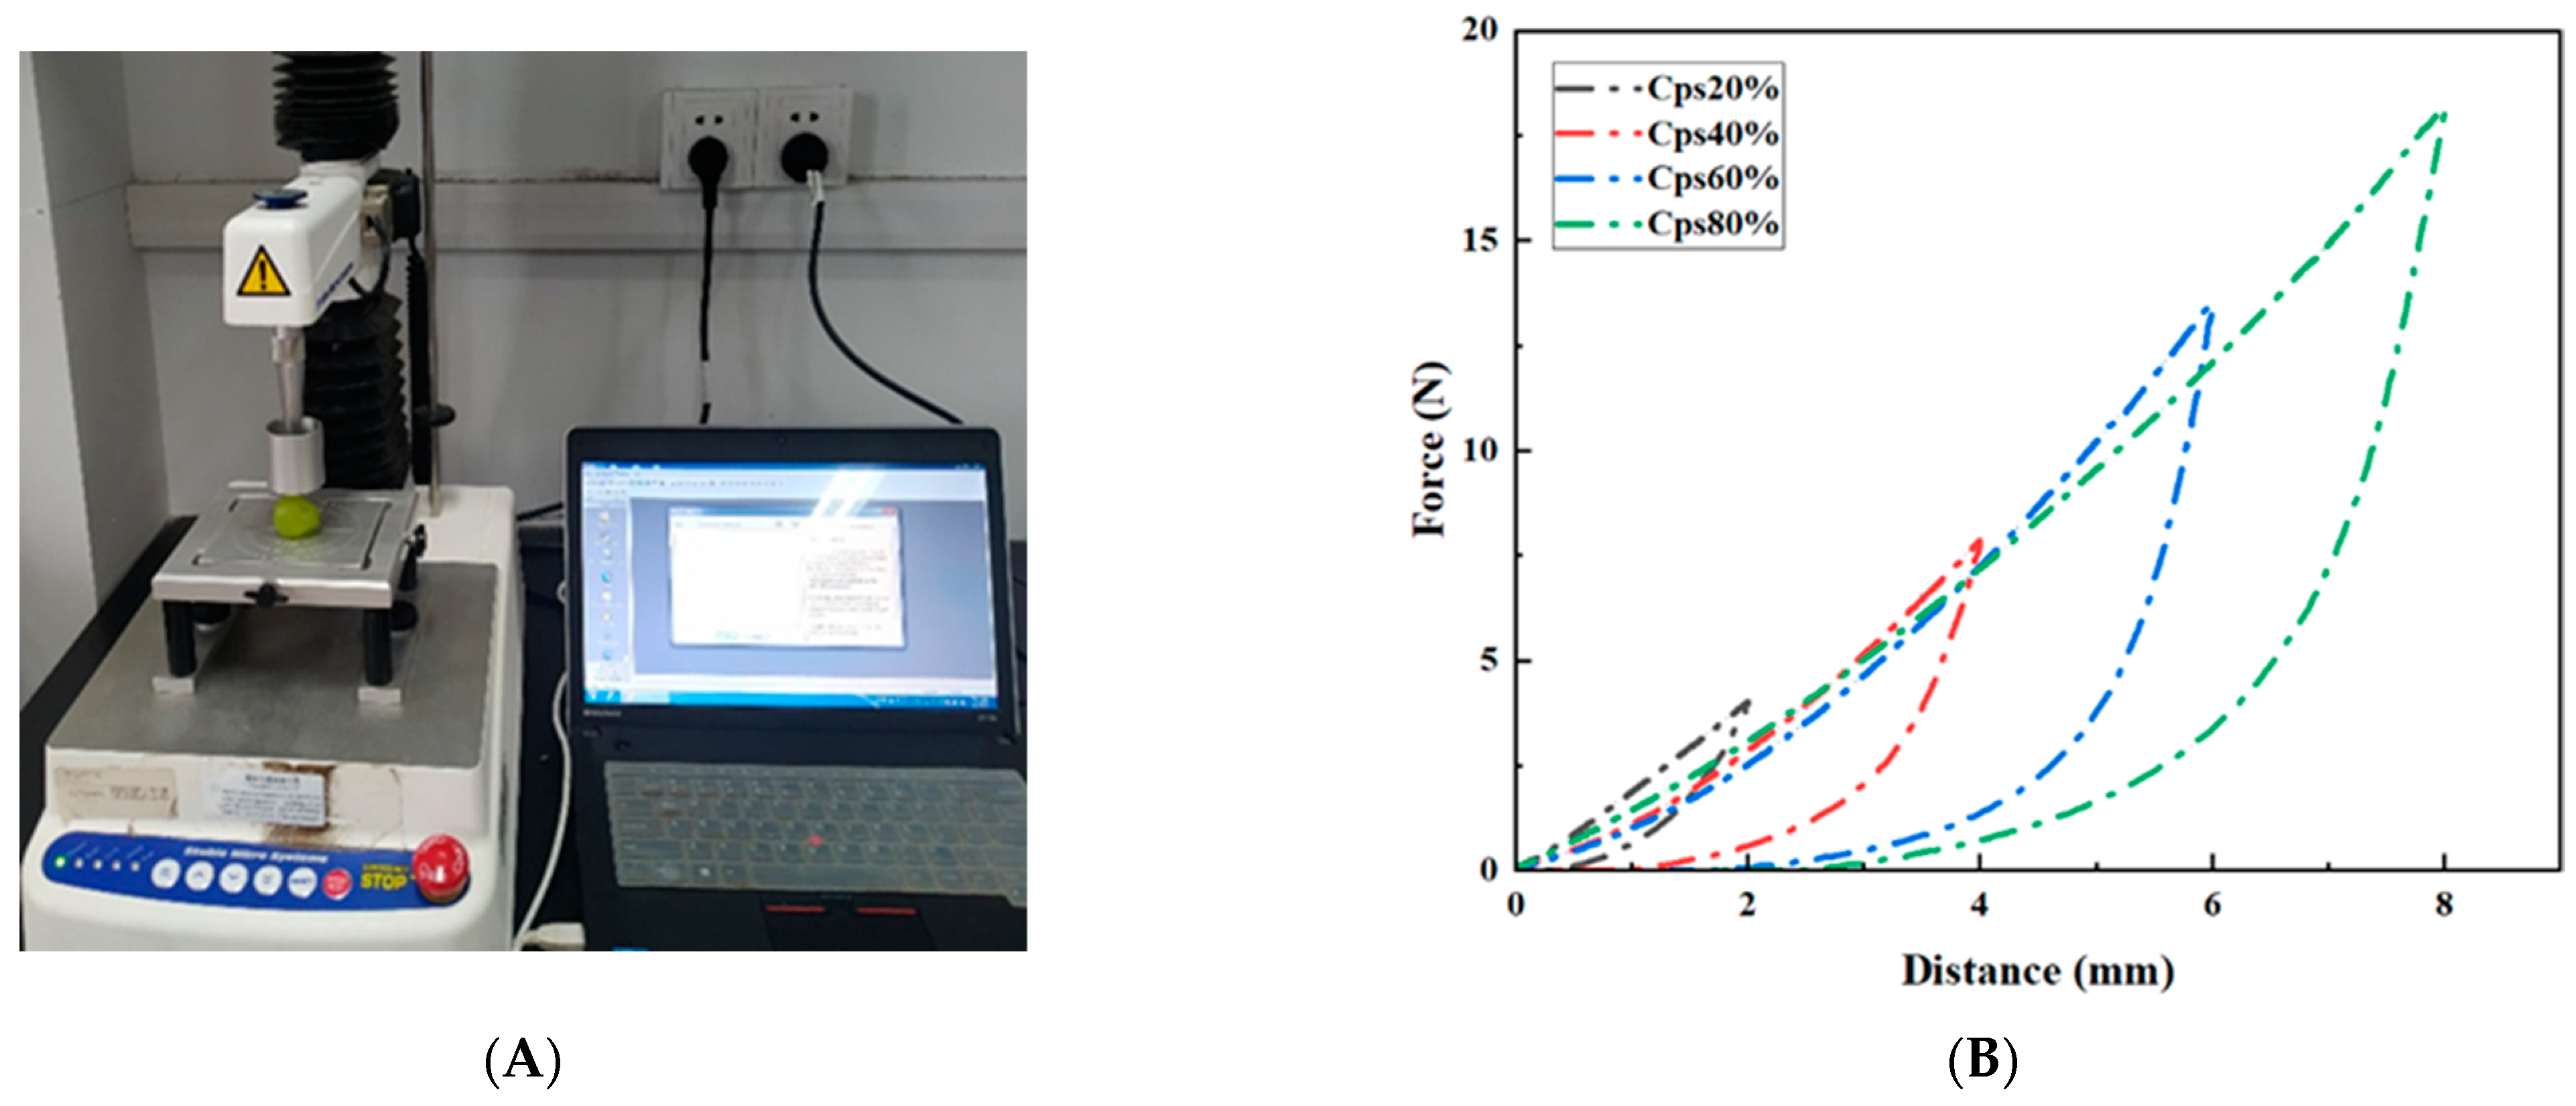
Figure 1. (A) Compression test of ‘Shine Muscat’ grapes; (B) typical force–compression distance curves.
Agronomy 13 02836 g001
Figure 2. Diagram of experimental arrangement of preparation of ‘Shine Muscat’ grape berries for postharvest quality determination.
Agronomy 13 02836 g002
Figure 3. Changes in the appearance of ‘Shine Muscat’ grapes in the treatment and control groups throughout storage.
Agronomy 13 02836 g003
Figure 4. Microstructure of ‘Shine Muscat’ grape pulp. (A) on 0 day, control group; (B) on 15 day, control group; (C) on 15 day, Cps20% group; (D) on 15 day, Cps40% group; (E) on 15 day, Cps60% group; (F) on 15 day, Cps80% group.
Agronomy 13 02836 g004
Figure 5. The firmness (A), springiness (B), cohesiveness (C), and chewiness (D) of ‘Shine Muscat’ grapes treated with Cps20%, Cps40%, Cps60%, and Cps80% compared with control during storage. Each value is presented as the mean ± SE. Different letters indicate statistically significant differences between treatments based on Duncan’s test (p < 0.05).
Agronomy 13 02836 g005
Figure 6. The TSS (A), TA (B), AsA (C), weight loss (D), decay incidence (E), MDA content (F), and relative conductivity (G) of ‘Shine Muscat’ grapes treated with Cps20%, Cps40%, Cps60%, and Cps80% compared with control during storage. Each value is presented as the mean ± SE. Different letters indicate statistically significant differences between treatments based on Duncan’s test (p < 0.05).
Agronomy 13 02836 g006
Figure 7. Heatmap of Pearson’s correlations for ‘Shine Muscat’ grapes stored at 4 ± 0.2 °C for 15 days based on measured parameters. * p < 0.05, and ** p < 0.01. Blue shows a positive correlation, while red indicates a negative one.
Agronomy 13 02836 g007
Table 1. Effect of mechanical compression treatment on ‘Shine Muscat’ grape peel color during 15 days of storage at 4 ± 0.2 °C.
IndexTreatmentStorage Time (Day)
03691215
L*Control47.67 ± 0.54 a46.32 ± 0.88 a45.87 ± 0.61 a44.83 ± 0.89 a44.51 ± 0.89 a43.72 ± 0.61 a
Cps20%46.08 ± 0.35 c44.65 ± 1.00 b43.83 ± 0.86 bc42.91 ± 0.94 b41.88 ± 0.99 b40.43 ± 0.40 b
Cps40%47.27 ± 0.56 ab46.07 ± 0.61 ab44.48 ± 0.56 b42.41 ± 0.46 bc40.95 ± 0.90 bc39.33 ± 0.21 bc
Cps60%46.52 ± 0.51 bc46.33 ± 0.65 a44.31 ± 0.44 b42.87 ± 0.56 cd40.03 ± 0.91 cd38.82 ± 0.96 c
Cps80%46.11 ± 0.46 c45.13 ± 0.69 ab42.88 ± 0.77 c41.44 ± 0.38 d38.84 ± 0.91 d38.11 ± 0.82 c
a*Control−8.04 ± 0.20 a−8.13 ± 0.41 a−7.79 ± 0.749 b−6.51 ± 0.478 b−5.08 ± 0.32 b−4.39 ± 0.26 a
Cps20%−8.12 ± 0.119 a−8.02 ± 0.20 a−7.22 ± 0.658 b−6.14 ± 0.5 ab−5.03 ± 0.39 b−4.02 ± 0.82 a
Cps40%−8.12 ± 0.230 a−7.80 ± 0.56 a−6.82 ± 0.74 ab−5.75 ± 0.72 ab−4.32 ± 0.24 ab−3.52 ± 0.55 a
Cps60%−8.03 ± 0.40 a−7.68 ± 0.64 a−6.09 ± 0.33 a−5.54 ± 0.8 ab−4.27 ± 0.62 ab−3.33 ± 0.88 a
Cps80%−8.013 ± 0.37 a−7.54 ± 0.549 a−6.05 ± 0.27 a−5.00 ± 0.44 a−4.08 ± 0.45 a−3.28 ± 0.48 a
b*Control10.27 ± 0.21 a11.88 ± 0.36 bc11.05 ± 0.59 c12.72 ± 0.26 b13.22 ± 0.66 c14.43 ± 0.51 c
Cps20%10.78 ± 0.73 a11.21 ± 0.19 c12.34 ± 0.55 b13.45 ± 0.54 b14.88 ± 0.63 b15.91 ± 0.41 b
Cps40%10.88 ± 0.65 a12.34 ± 0.46 ab12.72 ± 0.67 b13.41 ± 0.77 b14.68 ± 0.55 b15.9 ± 0.35 b
Cps60%10.91 ± 0.59 a12.45 ± 0.44 ab13.99 ± 0.66 a14.764 ± 0.58 a15.465 ± 0.36 b16.63 ± 0.39 b
Cps80%10.64 ± 0.43 a12.98 ± 0.55 a14.02 ± 0.37 a15.23 ± 0.22 a17.35 ± 0.32 a17.449 ± 0.33 a
ΔEControl0.61 ± 0.28 a2.50 ± 0.86 a2.53 ± 0.21 c4.51 ± 0.59 c5.72 ± 0.07 c7.24 ± 0.19 d
Cps20%1.33 ± 0.19 a2.67 ± 0.76 a4.04 ± 1.15 b5.72 ± 1.18 bc7.74 ± 1.21 b9.79 ± 0.39 c
Cps40%1.10 ± 0.89 a3.11 ± 0.11 a4.73 ± 0.54 ab7.02 ± 1.00 ab9.37 ± 0.51 b11.52 ± 0.22 ab
Cps60%0.89 ± 0.29 a2.07 ± 0.16 a4.77 ± 0.36 ab6.36 ± 1.08 ab9.29 ± 1.13 b11.23 ± 0.89 b
Cps80%1.04 ± 0.49 a3.18 ± 0.65 a5.84 ± 0.86 a7.99 ± 0.33 a11.43 ± 1.01 a12.33 ± 0.57 a
Values are means ± SE. Different letters in the same column indicate significant differences between treatments based on Duncan’s test (p < 0.05).
Table 2. The geometric parameters of ‘Shine Muscat’ grape flesh cells in the control, Cps20%, Cps40%, Cps60%, and Cps80% groups during storage.
TreatmentIndex
Area/μm2Perimeter/μmMajor/μmMinor/μmCircularity
0 day7805.27 ± 1746.28 c335.02 ± 36.30 c110.22 ± 11.91 c89.57 ± 12.32 c0.86 ± 0.02 a
15 day—Control11,773.78 ± 862.91 bc422.46 ± 31.35 bc136.94 ± 11.51 bc109.54 ± 1.97 c0.83 ± 0.07 ab
15 day—Cps20%16,500.66 ± 6654.17 b480.31 ± 99.39 b163.94 ± 32.30 b124.58 ± 30.91 bc0.86 ± 0.01 a
15 day—Cps40%30,748.30 ± 3259.18 a667.03 ± 31.46 a221.97 ± 13.01 a177.46 ± 28.14 a0.86 ± 0.03 a
15 day—Cps60%30,997.73 ± 5644.37 a690.42 ± 47.69 a248.15 ± 7.96 a158.55 ± 24.40 ab0.81 ± 0.04 ab
15 day—Cps80%33,255.06 ± 3023.24 a738.23 ± 29.52 a253.60 ± 24.42 a167.44 ± 13.89 a0.76 ± 0.05 b
Values are means ± SE. Different letters in the same column indicate significant differences between treatments based on Duncan’s test (p < 0.05).
Disclaimer/Publisher’s Note: The statements, opinions and data contained in all publications are solely those of the individual author(s) and contributor(s) and not of MDPI and/or the editor(s). MDPI and/or the editor(s) disclaim responsibility for any injury to people or property resulting from any ideas, methods, instructions or products referred to in the content.