Article

The Design of and Experiments with a Double-Row Seed-Metering Device for Buckwheat Breeding in an Experimental Area

1
College of Agricultural Engineering, Shanxi Agricultural University, Jinzhong 030801, China
2
Dryland Farm Machinery Key Technology and Equipment Key Laboratory of Shanxi Province, Jinzhong 030801, China
*
Author to whom correspondence should be addressed.
Agronomy 2023, 13(12), 2857; https://doi.org/10.3390/agronomy13122857
Submission received: 16 October 2023 / Revised: 8 November 2023 / Accepted: 16 November 2023 / Published: 21 November 2023

Abstract

:
Existing plot seeders have several problems, e.g., seeding uniformity is poor, the breakage rate is higher, and so on. The design of a cone-grid format seed-metering device can both meet the experimental area’s seeding-operation requirements and the plant-to-row seeding requirements. We clarified the overall structure, working principle, and technical parameters of a novel seed-metering device. The gap-adjustment range of the seed-distributing mechanism was determined by analyzing the force on buckwheat seeds. A kinematic simulation using Simulink clarified that the seed-metering control mechanism is capable of realizing precise seed-discharge control. In this experiment, we used the layout of seed gaps, seed displacement, and the rotation rate as influencing factors, respectively. We determined the sowing uniformity coefficient of variation and the broken rate as indicators of the orthogonal experiment. The test results were then subjected to modeling analysis and optimization using Design-Expert12 software to determine the optimal operating parameters. Subsequently, validation experiments were conducted. The results show that the optimal configuration of parameters consisted of a layout seed gap of 13.42 mm, a seed displacement of 17.67 g, and a rotation rate of 15.59 min−1. Under these optimal conditions, the coefficient of variation for sowing uniformity was measured at 14.56%, while the broken rate was 0.39%. The test results meet the technical requirements of buckwheat seed experimental-area sowing and plant-to-row sowing; for further research on buckwheat experimental-area breeding, this study provides a reference.

1. Introduction

Buckwheat is an important miscellaneous grain crop; buckwheat products are indispensable foods in people’s dietary structures. Buckwheat-breeding technology has an important impact on the development of the buckwheat industry. At present, the degree of mechanization of buckwheat planting is low, especially as buckwheat plot-seeding production has not been seen in use [1].
Sowing operations for plot breeding play an important role in the process of mechanized field trials [2]. The process of sowing is heavy and labor-intensive, and the quality of sowing directly affects the implementation of the field mechanization trial program and the effectiveness of the trial [3,4]. Plot seeders are special seeders used for breeding new varieties and for carrying out comparative trials of varieties [5]. Plot sowing requires that a certain number of seeds is evenly distributed over a defined row length and no seed is allowed to remain or be damaged after seeding is completed [6,7]. With traditional buckwheat plot-seeding machines, the main problems are (1) that manual work is very labor intensive, unproductive, and poor in quality [8]; (2) the operation of traditional seeding devices, seed-clearing difficulties, high residual rate, and the likelihood of seed mixing affecting the quality of breeding; (3) the existing seeding machine makes meeting the requirements of the plant-to-row plot seeding difficult [9,10,11].
The key to improving the accuracy and efficiency of plot breeding trials lies in the design and research of seed-metering devices. Egil Oyjord [12] was the first to develop a conical lattice disc seed-metering device for plot breeding, which is widely used by agribusinesses. Wintersteiger [13] designed the cone-centrifugal grid disc seed-metering device on this basis. This type of seed-metering device can meet the requirements of plot sowing operations, but it is difficult to meet the requirements of seed breeding with this device. Zhang et al. [14], from Qingdao Agricultural University, designed a conical seed-metering device for sowing three rows simultaneously. However, the seed-metering device was mainly applied to the seeding research of single-grain wheat and has difficulty in meeting the buckwheat seeding requirements. Liu et al. [15] designed a cone canvas belt seed-metering device and improved the adaptability of the seed storage device to crop seeds and the uniformity of sowing. However, it has difficulty meeting the requirements of plant-to-row seeding. Yang et al. [16] analyzed the force of seeds in seed-metering devices by observing the movement state of seeds in the seed-metering devices to improve the uniformity of seed discharge in the cone-centrifugal seed-metering device. However, the seed-metering device had a greater impact on seed fragmentation and affected the seedling emergence rate. Yang et al. [17] designed a magazine-fed seed-distributing device for a row-seeding spaced planter to solve the problems of considerable manual labor and low efficiency. However, the operation of this seed-metering device was complicated and the precision of the machine’s movement was poor.
For the purposes of buckwheat seeding, a device was designed based on the force analysis and physical parameters of buckwheat grain. According to the requirements of buckwheat experimental-area seeding and plant-to-row seeding, a study was conducted on the design of a double-row seed-metering device for buckwheat breeding in an experimental area.

2. Materials and Methods

This experiment used the JPS-12 Metering Device Performance Test Bench (Heilongjiang Agricultural Mechanical Engineering and Science Research Institute, Heilongjiang, China) for the bench experiments. Referring to the GB/T 9478-2005 testing methods of sowing in lines [18], Design-Expert12 software was used to design one-way and orthogonal tests, which were conducted using the layout of seed gaps, the seed displacement (mass of seed discharged per 5 m of seed-metering device), and the rotation rate as test factors at the levels of 7–23 mm, 10–35 g, and 5–30 min−1, respectively. The measuring tools were vernier calipers and an electronic balance with an accuracy of 0.01 g and a range of 500 g. The sowing uniformity coefficient of variation and the rate of broken seeds were selected as the test indicators [19]. Based on the experimental results, it was verified whether the seed-metering device can meet the requirements of the experimental-area seeding and plant-to-row seeding.
Design-Expert12 (developed by Stat-Ease, Inc., Minneapolis, MN, USA) is a software program for designing experiments and analyzing data, supporting a variety of experimental design methods and data analysis techniques, including response surface analysis, factorial analysis, etc.

2.1. Physical Performance Parameters of Buckwheat Seeds

We tested a selection of buckwheat seeds from the Shanxi Agricultural University experimental field. These were a variety of Hongshan buckwheat, and the buckwheat was randomly sampled to determination the physical parameters, as shown in Table 1 [20].

2.2. Overall Structure of Seed-Metering Device

The structure of the double-row seed-metering device for buckwheat breeding in the experimental area is shown in Figure 1 [21].
When working, the seed-metering control mechanism was opened, the seeds in seed box dropped down to the cone grid format seed-distributing mechanism via the layout-seed-regulating mechanism, and the seeds were evenly distributed in the homogeneous grid located at the bottom thereof by means of the smooth conical surface. When the seed planter advanced, the cone grid format seed-distributing mechanism was rotated by the ground wheels, and the seeds in the grid were brought into the two evenly spaced seed dispenser ports and fell into the seed furrow through the seed discharge pipe to complete the seed discharge process.
The technical parameters of the double-row seed-metering device for breeding buckwheat in the experimental area are shown in Table 2.

2.3. Seed-Metering Device Structural Design and Theoretical Analysis

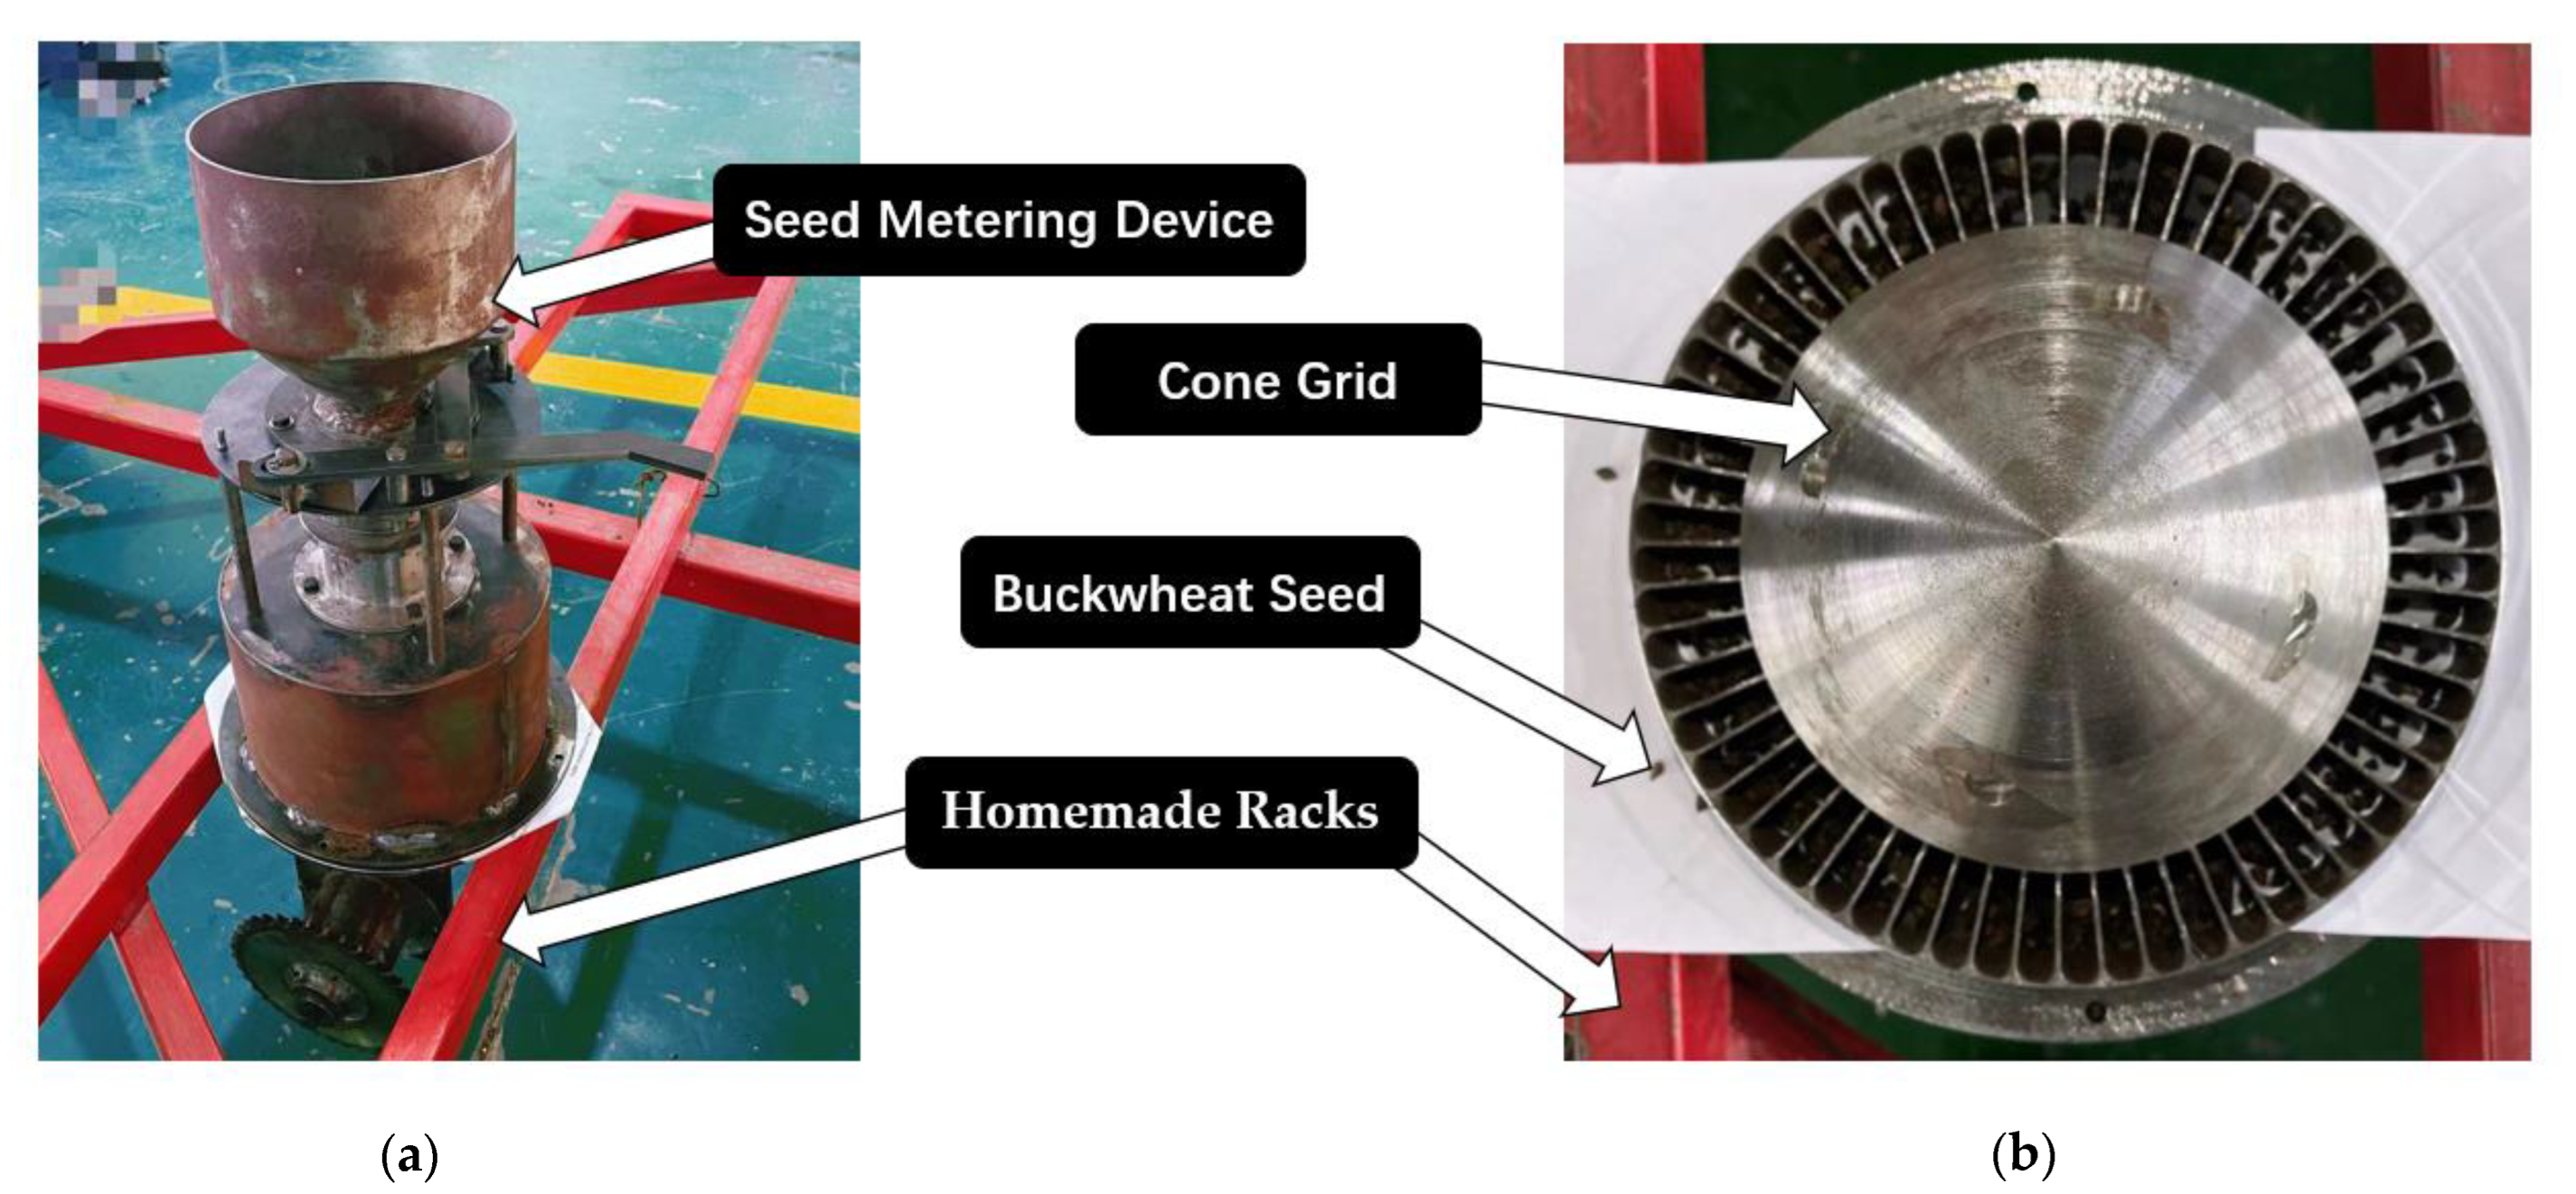
2.3.1. Design of the Cone Grid Format Seed-Distributing Mechanism

The structure of the cone grid format seed-distributing mechanism is shown in Figure 2. It mainly consisted of a seed guide tube (1), a layout seed mechanism (2), and a cone grid format seed-distributing disk (3).
At work, the seeds fall into the conical seed guide inside the bottom of the seed guide tube (1) through the seed-metering control mechanism. After the cooperation between the seed guide port and the cone grid format seed-distributing disk (3), the secondary homogenization is completed by adjusting the layout seed tube (2) and the seeds fall into the grid below the cone along the surface of the cone, completing the seed distribution process.
The seed guide tube (1), the layout seed tube (2), and the cone grid format seed-distributing disk (3) are coaxial and have a conical seed guide opening below the seed guide tube (1) to concentrate the seed at the top of the cone and to enable a flow downward along the cone to ensure the uniformity of seed dispensing. In order to ensure a smooth seed flow and to prevent clogging, the following conditions need to be met:
D > 4 L β > γ
In Equation (1), D is the cone seed guide tube outlet diameter (mm); L is the long diameter of buckwheat seeds (mm); β is the cone inclination of the seed outlet of the conical seed guide tube (°); and γ is the natural angle of repose of the buckwheat seeds (°), where γ = 30.5°. So, we chose D = 20 mm and β = 66°.
The layout seed tube works by adjusting the gap h between the outlet of the seed distribution tube and the seed distribution cone. The aim is to achieve a secondary homogenization of the seed flow on the cone surface. The main structural parameters affecting the working performance of the layout seed tube are the layout seed gaps h and the cone inclination angle θ, where θ was taken as 50° (θ > γ ). The determination of the value of h needed to consider the different states of the seed at the exit of the layout seed mechanism, as shown in Figure 3. We simplified the seed as a sphere with the long axis L of buckwheat as the diameter.
In Figure 3a, when the centers of the two spheres at the exit are at the same horizontal position, no clogging will occur at this time, and seed 1 and seed 2 are subject to pressure from the seed above, causing seed 2 to be the first to be extruded. However, the contact of seed 2 with the surface of the cone creates a bouncing force that will affect the uniformity.
h = L 2 + 3 2 L s i n θ = 1.649 L
In Figure 3b, when the line connecting the centers of the two spheres at the outlet is perpendicular to the cone busbar, seed 1 is pressurized by the seed above it and will be extruded preferentially without rebounding.
h = 3 2 L + L 2 s i n θ = 1.883 L
In Figure 3c, using seed 1 as the object of force, we consider the equilibrium equation for the seed in the direction of the bus line along the surface of the cone:
m g s i n θ + N 1 N 21 s i n φ F f = 0
F f = N τ
In Equations (2)–(5), mg is the gravity of seed 1 (N); N1 is the pressure of other seeds (N); N21 is the normal pressure of seed 2 on seed 1 (N); θ is the cone angle of inclination (°), θ = 50 °; Ff is the friction between seed 1 and the cone surface (steel) (g); φ is the N21 and the angle perpendicular to the surface of the cone (°); N is the support reaction force of the cone on seed 1 (N); and τ is the friction angle between the seed and steel (°).
It follows that when φ < τ, seed 1 is self-locked, and jamming may occur at the cloth seed outlet; when φ > τ, there may be a tendency for seed 1 to move upward when seed 2 falls to the cone first, which tends to cause seed bouncing and affect the uniformity of the seed distribution.
In Figure 3d, when the lines connecting the geometric centers of all three seeds are in a perpendicular direction to the bus of the cone, we have
h = 5 2 L + L 2 s i n θ = 2.883 L
At this point, all three seeds are in a critical state of self-locking. When h > 2.883L, seed 2 and seed 3 have a higher probability of falling first. The same phenomenon of bouncing was observed [22]. Therefore, we selected 1.883L < h < 2.883L, with the design results of h = 9.5~14.5 (mm).

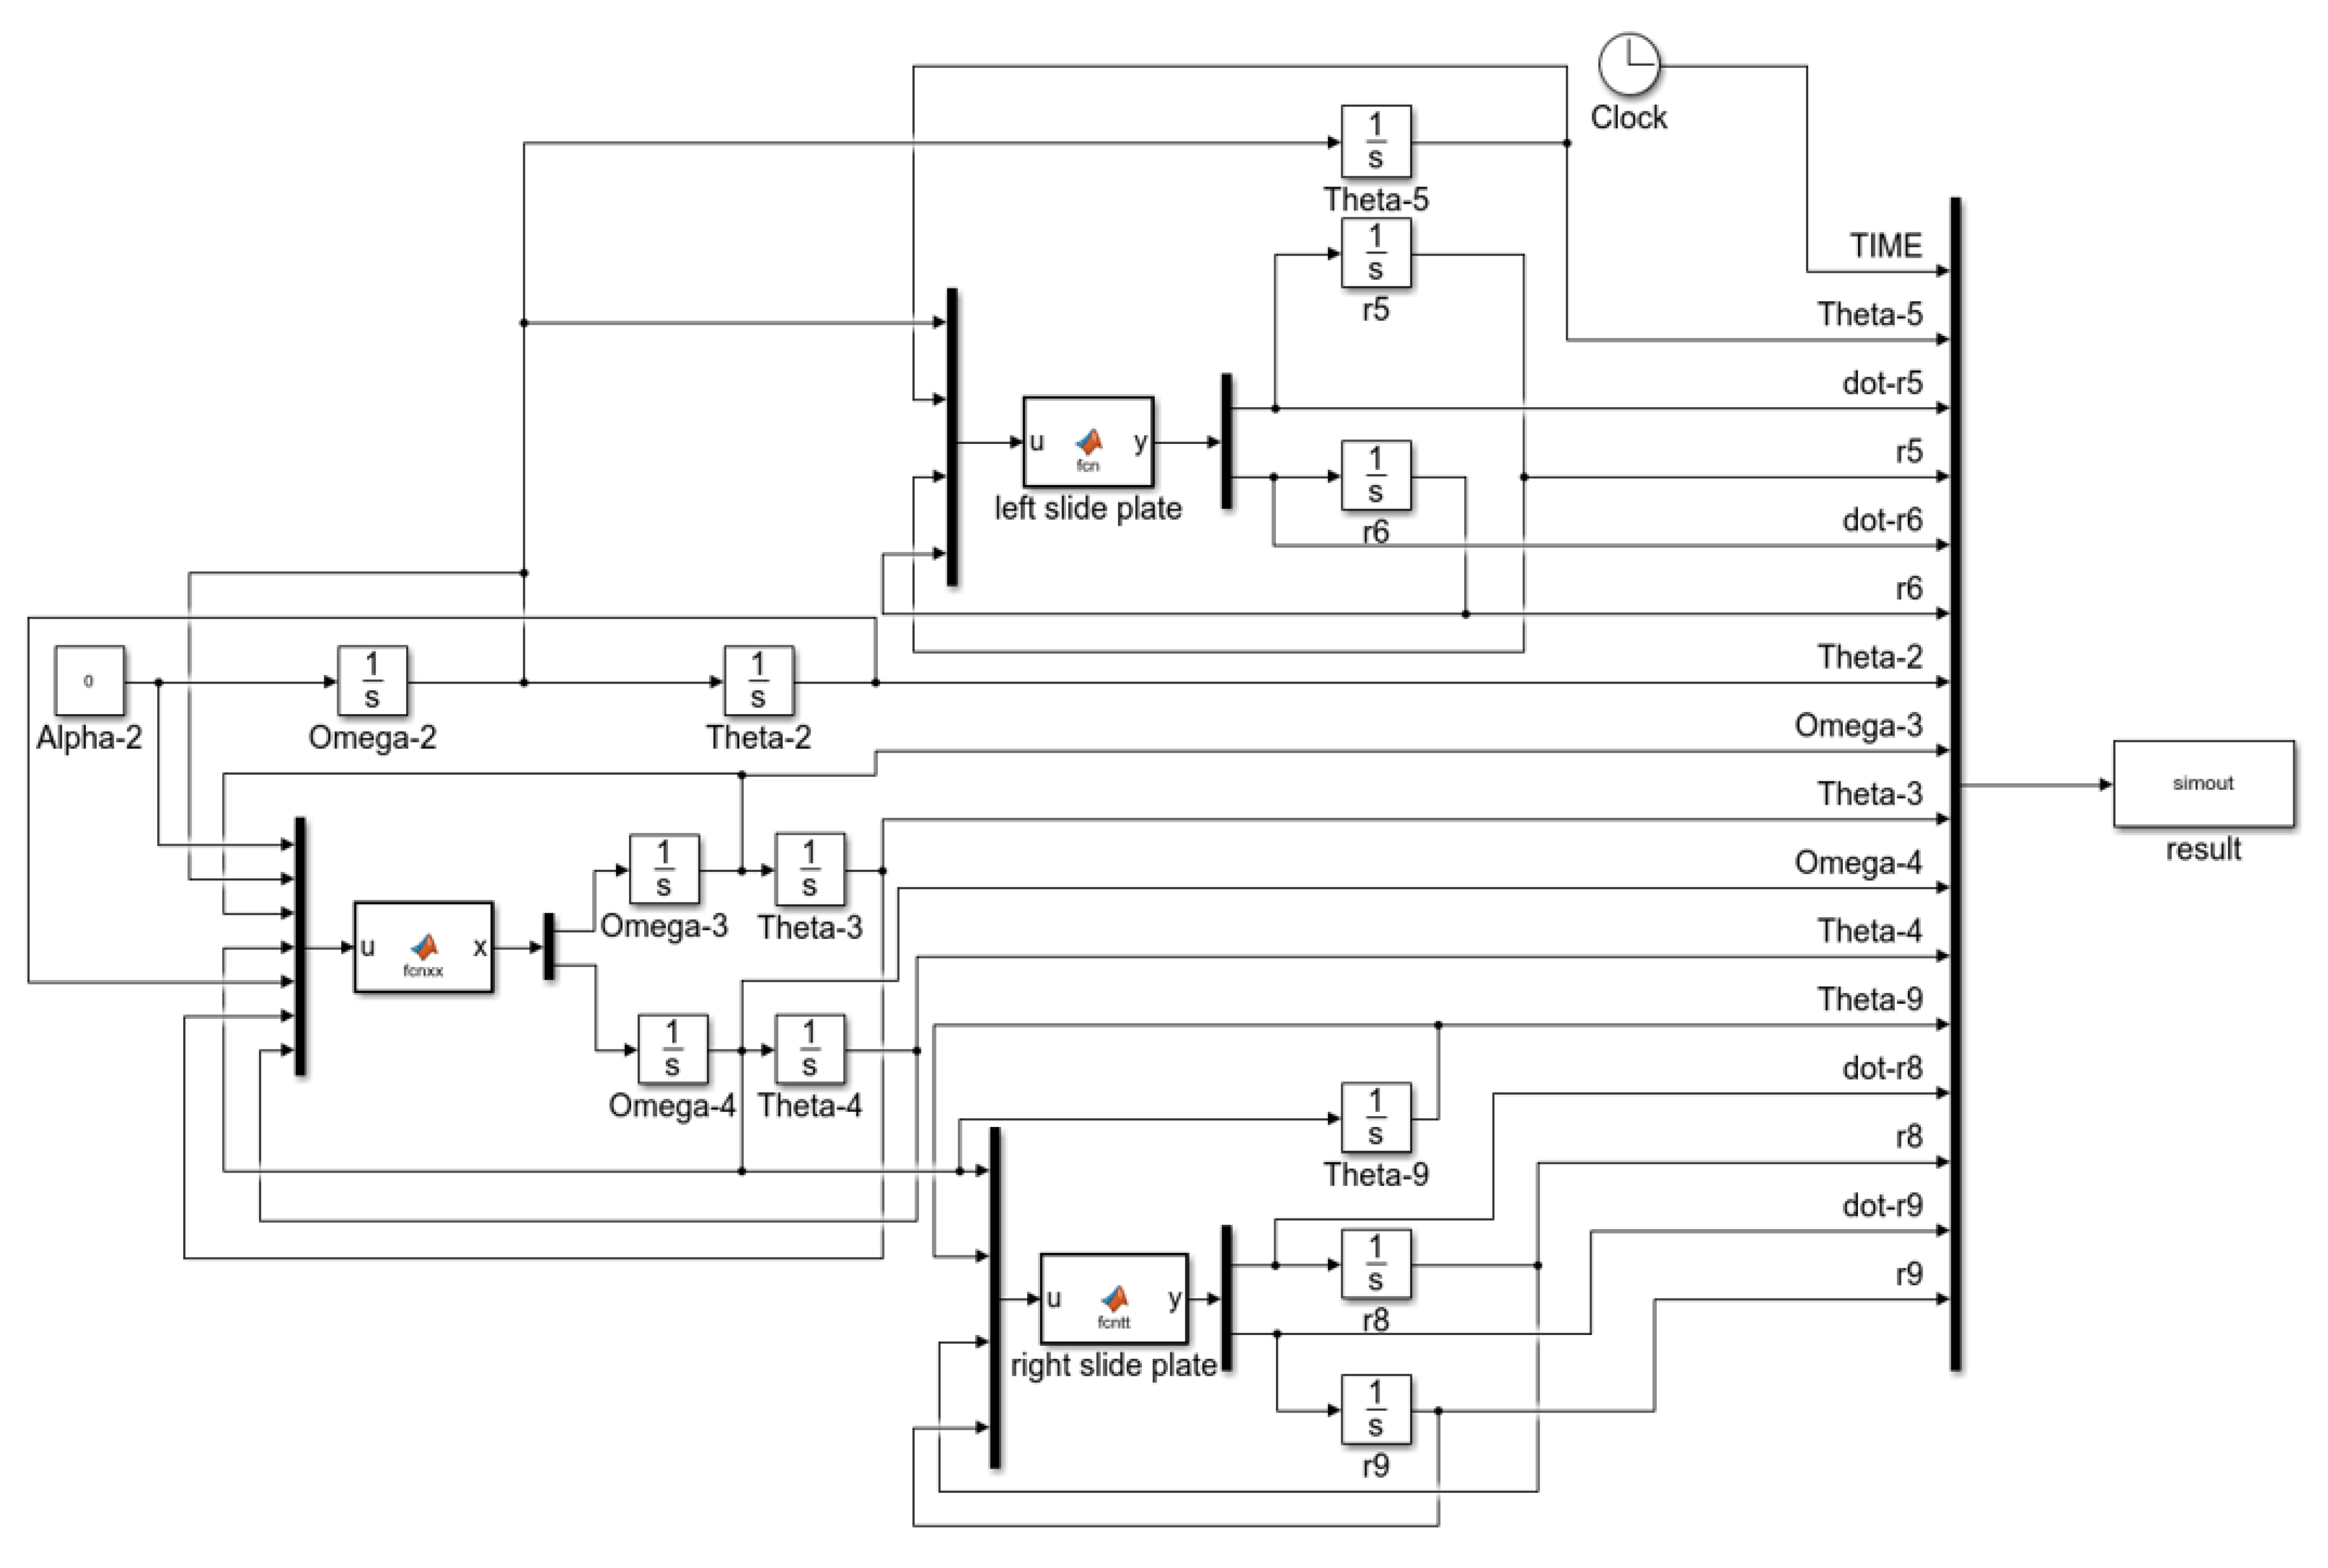
2.3.2. Design and Kinematic Simulation of the Seed-Metering Control Mechanism

The seed-metering control mechanism is shown in Figure 4 and consists mainly of the support plate (1), the left sliding plate (2), the adjusting lever (3), the right sliding plate (4), the rotating lever (5), and the connecting rod (6).
The left slide plate (2) and right slide plate (4) were mounted in the support plate (1) and could be slid left and right, respectively, to realize the opening and closing of the seed box outlet. The movement of the slide plate was actuated by a four-bar mechanism comprising a manual adjusting lever (3), a connecting rod (6), and a rotating rod (5). In operation, by turning the adjusting lever (3), the left slide plate (2) and right slide plate (4) are made to open or close at the same time, ensuring that the seeds can fall down from the center of the seed guide tube so that the dispersal uniformity of the seeds is improved.
The principle of the seed-metering control mechanism is shown in Figure 5. The working range of the manual adjustment lever was 0–40°, and the left and right sliders moved from 0 to 40 mm.
The vector diagram of the seed-metering control mechanism is shown in Figure 6. We took the center “O” of the hinge of the manual adjustment lever (3) as the coordinate origin and the moving direction of the slide plate as the x-axis direction and established a right-handed system of right-angled coordinates [23,24].
The purpose of the design simulation was to determine whether the left slide (2) and right slide (4) opened and closed at the same time when the lever (3) was turned. This would ensure that the seed falls through the center of the seed guide tube so as to enhance the uniformity of the seed sowing.
The vector equations of the mechanism were established as shown in Equation (7).
r 2 + r 3 = r 1 + r 4 r 5 + r 6 = r 7 r 1 + r 9 = r 7 + r 8
The two-component expressions of the closed-loop vector equation can be obtained using the sine and cosine functions of the vector pinch angle as follows:
r 2 cos θ 2 + r 3 cos θ 3 = r 1 cos θ 1 + r 4 cos θ 4 r 2 sin θ 2 + r 3 sin θ 3 = r 1 sin θ 1 + r 4 sin θ 4
r 5 cos θ 5 + r 6 cos θ 6 = r 7 cos θ 7 r 5 sin θ 5 + r 6 sin θ 6 = r 7 sin θ 7
r 1 cos θ 1 + r 9 cos θ 9 = r 7 cos θ 7 + r 8 cos θ 8 r 1 sin θ 1 + r 9 sin θ 9 = r 7 sin θ 7 + r 8 sin θ 8
Derivation of the displacement equation yields the velocity equation in matrix form as follows:
r 3 s i n θ 3 r 4 s i n θ 4 r 3 c o s θ 3 r 4 c o s θ 4 ω 3 ω 4 = ω 2 r 2 s i n θ 2 ω 2 r 2 c o s θ 2
c o s θ 5 c o s θ 6 s i n θ 5 s i n θ 6 r 5 ´ r 6 ´ = ω 5 r 5 s i n θ 5 + ω 6 r 6 s i n θ 6 ω 5 r 5 c o s θ 5 ω 6 r 6 c o s θ 6
c o s θ 8 c o s θ 9 s i n θ 8 s i n θ 9 r 8 ´ r 9 ´ = ω 8 r 8 s i n θ 8 + ω 9 r 9 s i n θ 9 ω 8 r 8 c o s θ 8 ω 9 r 9 c o s θ 9
Derivation of the velocity equation yields the acceleration equation in matrix form as follows:
r 3 s i n θ 3 r 4 s i n θ 4 r 3 c o s θ 3 r 4 c o s θ 4 α 3 α 4 = α 2 r 2 s i n θ 2 + ω 2 2 r 2 c o s θ 2 + ω 3 2 r 3 c o s θ 3 ω 4 2 r 4 c o s θ 4 α 2 r 2 c o s θ 2 + ω 2 2 r 2 s i n θ 2 + ω 3 2 r 3 s i n θ 3 ω 4 2 r 4 s i n θ 4
Based on the above mathematical model, the program was prepared to build a Simulink simulation model, as shown in Figure 7.
The initial values for the simulation of the seed-metering control mechanism are shown in Table 3.
According to the simulation results, the displacement curves of r 6 and r 8 were derived, as shown in Figure 8. The incremental displacement of the left slide moving to the right was the same as the incremental displacement of the right slide moving to the left in the same amount of time.
The velocity profile is shown in Figure 9. In the same amount of time, the left slide moved to the right with the same incremental velocity as the right slide moved to the left.
Through simulation, it was concluded that the displacement of the left slide r 6 and the displacement of the right slide r 8 had equal increments per unit of time when the adjusting lever r 2 rotated at a constant speed, and the velocities were equal at any moment and in the opposite direction. Therefore, the performance of the seed-metering control mechanism was good and met the requirements of seed-metering discharge regulations [25].

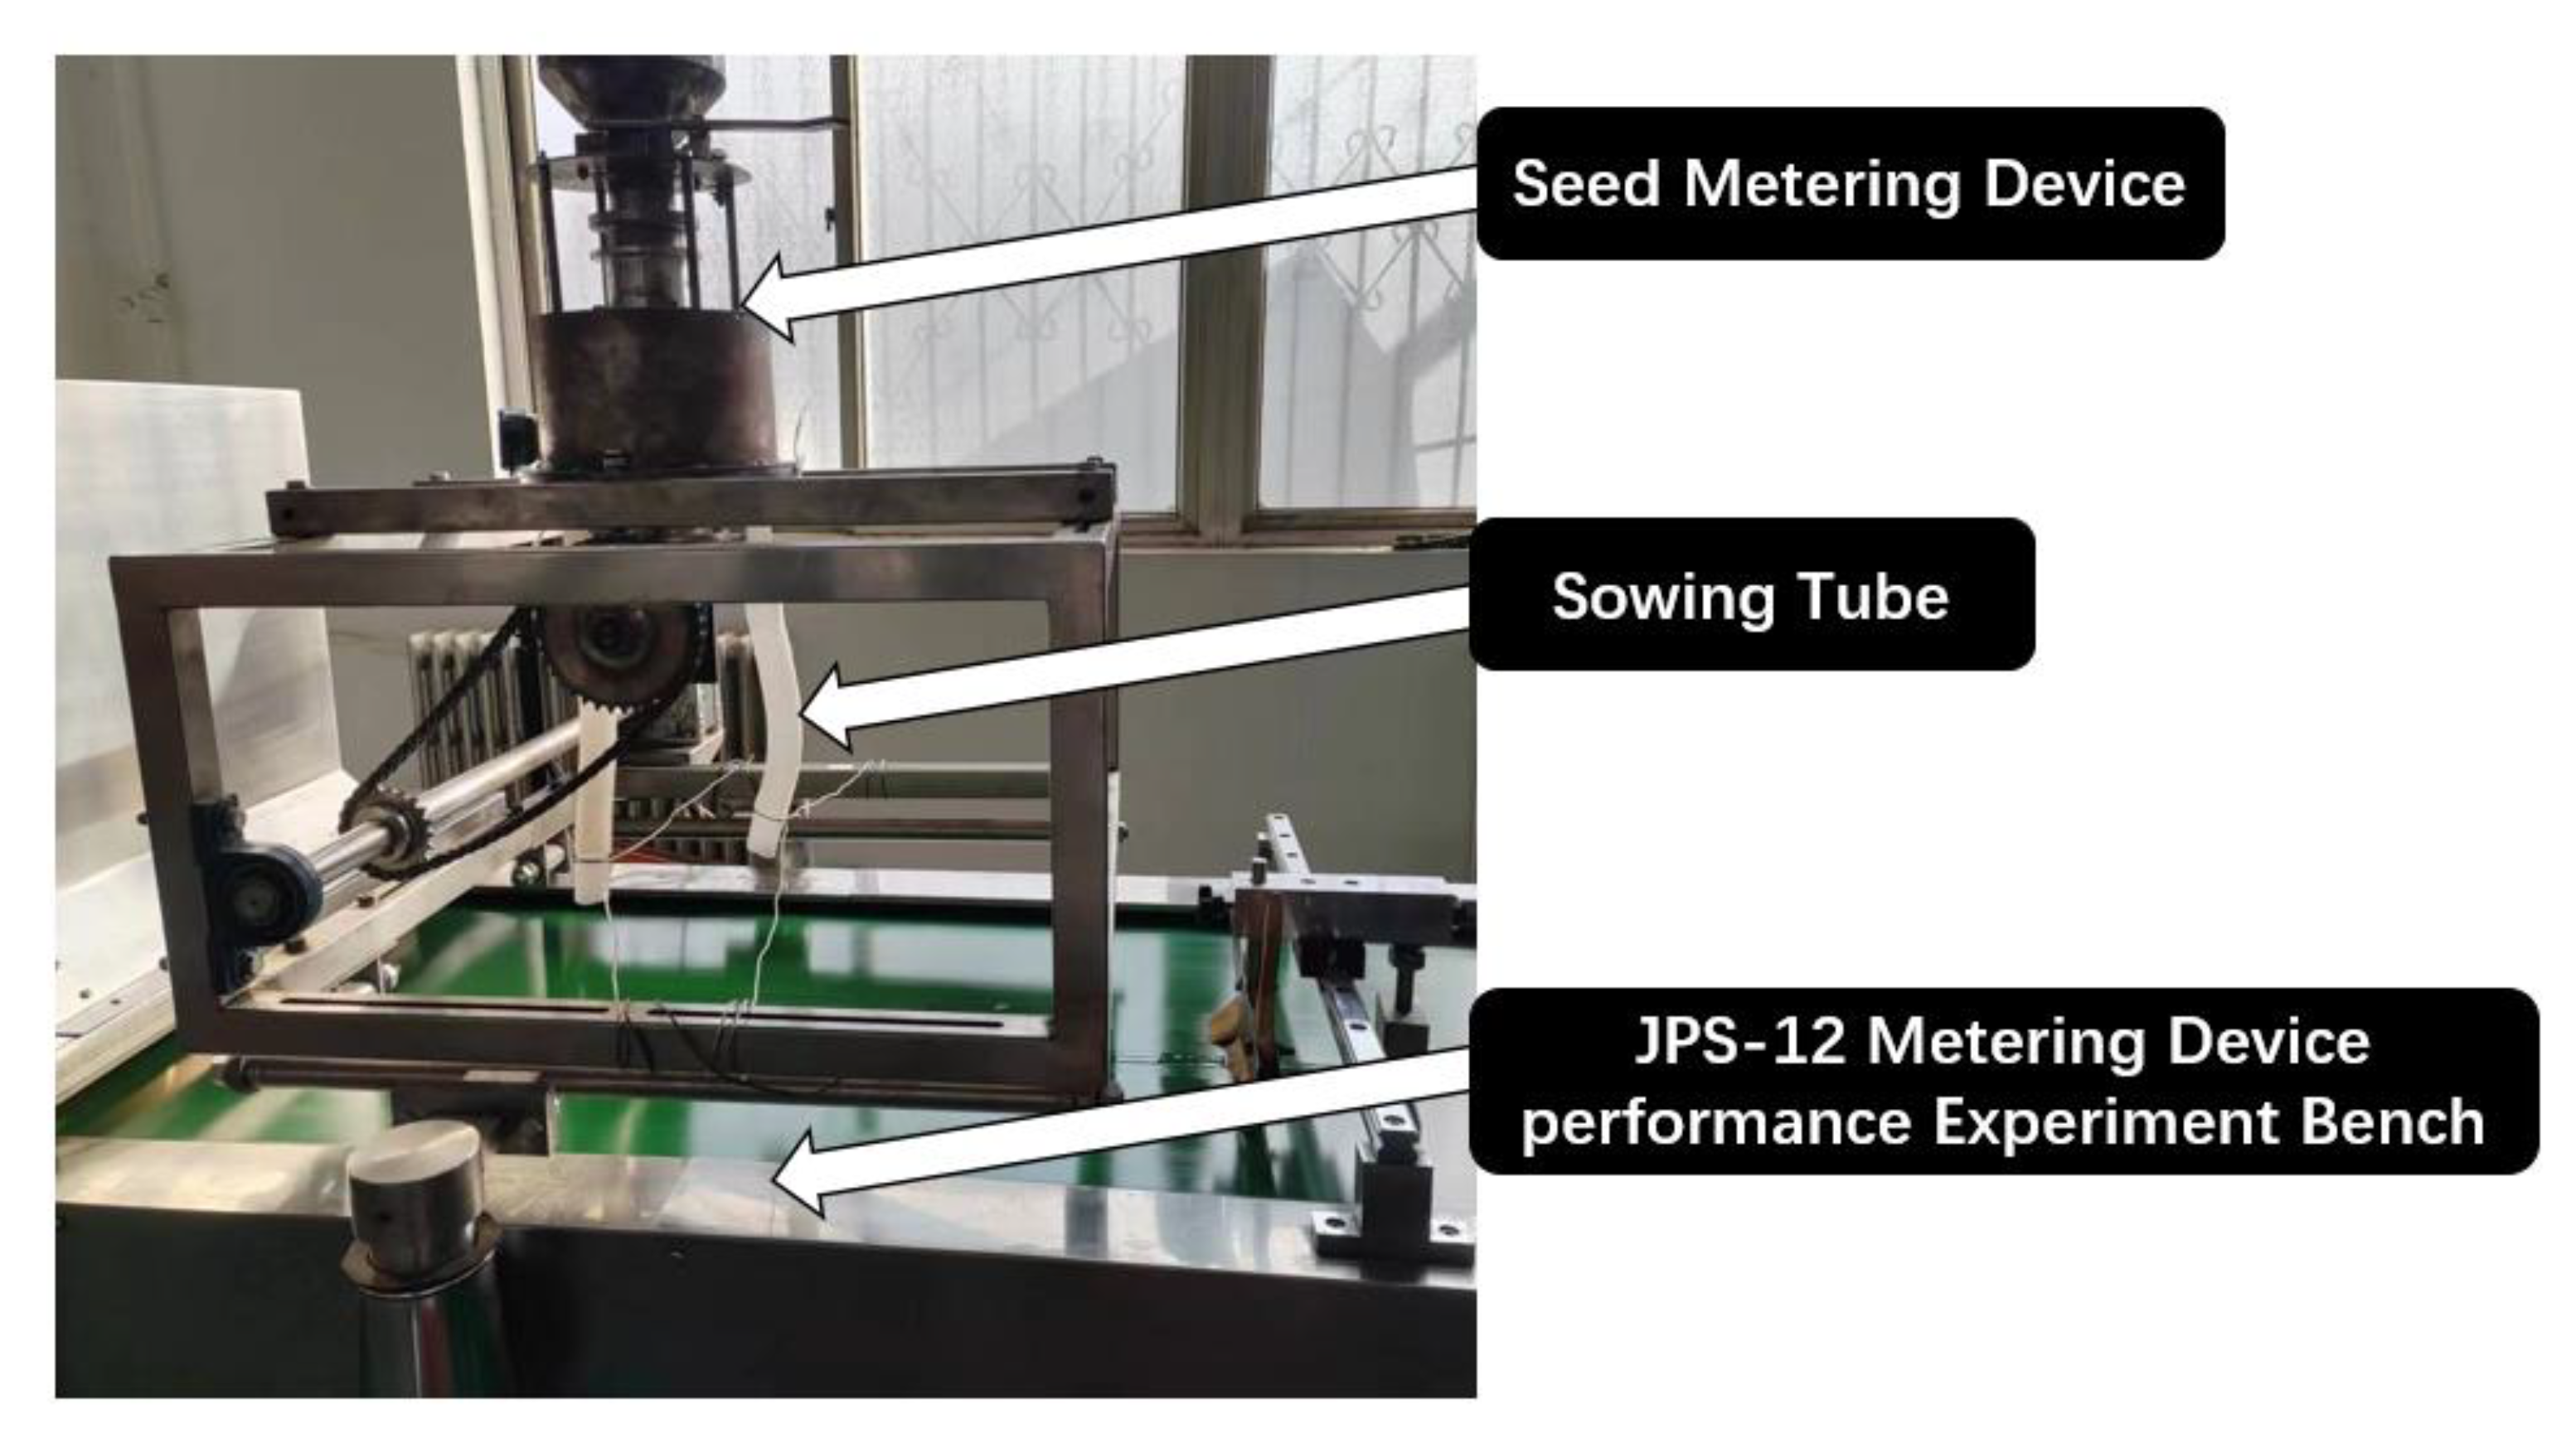
2.4. Performance Parameter Test Methods

Separate tests were conducted on homemade racks and the seed dispenser test stand.
1
The tests on homemade racks were calculated as follows [26]:
V = i = 1 n ( M i i = 1 n M i / n ) 2 / ( n 1 ) i = 1 n M i / n × 100 %
In Equation (15), V is the raster uniformity coefficient of variation (%); i is the grid number; M i is the mass of seeds in the corresponding grid cell (g); and n is the total number of grid cells.
2
The seed dispenser test bed was calculated as follows [27]:
x ¯ = n i X n i
S = 1 n 1 X x ¯ 2
When n < 30, the denominator takes n − 1; the test plot row length was 5 m and the total number of segments selected was n = 10.
a = 100 S x ¯
In Equations (16) and (17), x ¯ is the average mass of seeds per segment (g); X is the mass of seeds per 100 mm segment; n i is the number of occurrences of the x-value; n is the total number of segments; S is the standard deviation; and a is the sowing uniformity coefficient of variation (%).

3. Result and Discussion

3.1. Single-Factor Experiment

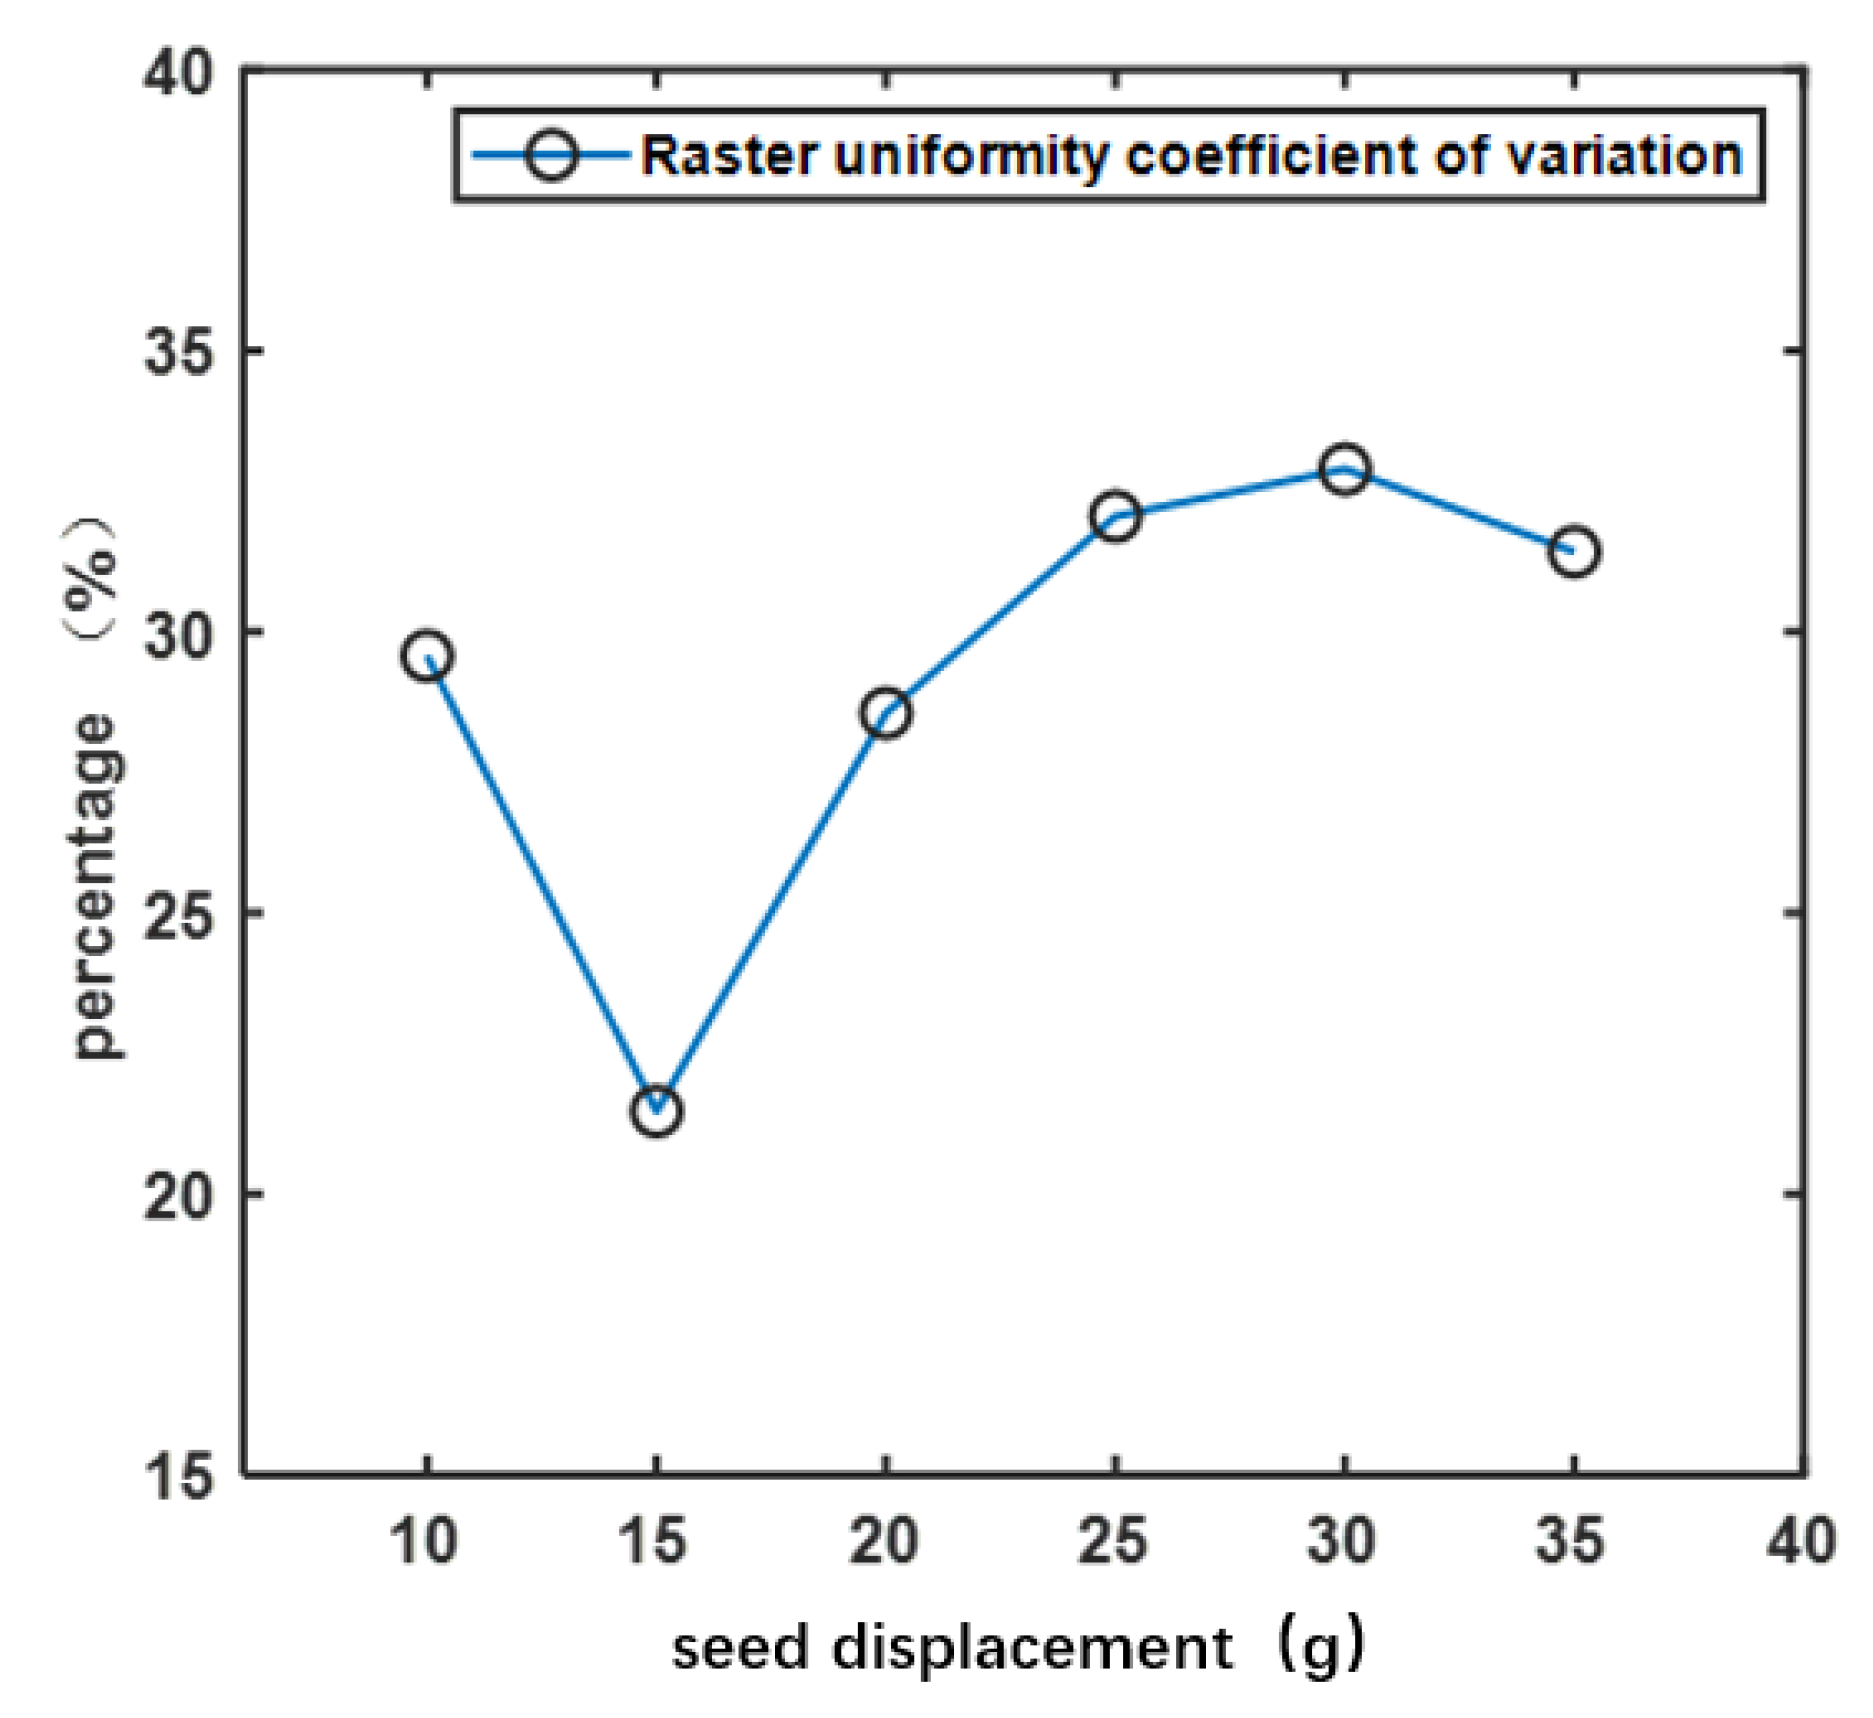
3.1.1. Experimental Design and Results

In the trial conducted on 11 March 2023 at the Mechanical Laboratory of Shanxi Agricultural University, we suspended the seed dispenser smoothly on the homemade frame, as shown in Figure 10.
In accordance with the one-factor experimental design program for laying out the seed gaps, the experiments were conducted by sequentially varying the layout of seed gaps at a certain seed displacement. The design scheme of the one-way experimental design for the layout of seed gaps is shown in Table 4.
By analyzing the one-factor test of laying out the seed gaps, the layout seed gaps with optimal uniformity were selected for the one-factor test of seed displacement. We fixed the layout seed gaps at 13 mm and sequentially increased the seed displacement during the experiment. The design scheme of the one-way trial design for the seed displacement is shown in Table 5.
Experimental areas are generally sown in lengths of 2 to 10 m; the working traveling speed of the machine is 2.5~5.5 km/h. This results fall in a range of 5 to 30 min−1 for the speed of the seed discharge disk during the test. The design plan of the one-factor test of rotational speed is shown in Table 6.

3.1.2. Analysis of Results

The experiment results show that when the layout of the seed gaps was in the range of 7–13 mm, the raster uniformity coefficient of variation decreased as the gap increased. Beyond 13 mm, the raster uniformity coefficient of variation increased with the increase in the layout of the seed gaps, and the raster uniformity coefficient of variation was lowest when the layout seed gap was 13 mm, as shown in Figure 11.
The raster uniformity coefficient of variation decreased with the increasing seed displacement in the range of 10–15 g. The raster uniformity coefficient of variation increased with seed displacement above 15 g. By 30 g, the raster uniformity coefficient of variation was horizontal. The lowest raster uniformity coefficient of variation was observed when the seed displacement was 15 g, as shown in Figure 12.
An insufficiently low rotation rate of the seed-metering device can create a buildup of seeds in the seed-distributing mechanism affecting the uniformity of seed distribution; too high a rotation rate and the seeds may collide, leading to an increased broken rate. As shown in Figure 13, the raster uniformity coefficient of variation reached the minimum value, and the best effect was achieved when the rotation rate of the seed-metering device was 15 min−1; the broken rate reached the lowest value when the rotation rate of the seed-metering device was 10 min−1.

3.2. Orthogonal Experiment

3.2.1. Experimental Program and Process

Orthogonal experiments were conducted on the JPS-12 Seed Displacer Performance Bench, as shown in Figure 14.
A three-factor, five-level, quadratic orthogonal, center-rotated, combination experimental design based on a one-factor test was conducted. The results of the one-way test of the layout seed gaps showed that the raster uniformity coefficient of variation appeared low at 13 mm; so, 13 mm was chosen as the center-level point of the layout seed gaps. The results of the one-way test of the seed displacement showed that the raster uniformity coefficient of variation reached the lowest value at 15 g; so, 15 g was chosen as the center-level point of the seed displacement. The results of the one-way test of the rotation rate showed that the raster uniformity coefficient of variation and the broken rate reached the lowest value at 15 min−1; therefore, 15 min−1 was selected as the center-level point of the rotation rate.
Multiple regression fitting and analysis of variance (ANOVA) of the experimental data were performed using Central Composite in Design-Expert12 software. The experimental design factor codes are shown in Table 7. The orthogonal test setup scheme and results are shown in Table 8. In this table, the test factor x 1 is the layout seed gaps, x 2 is the seed displacement, x 3 is the rotation rate, the test index Y 1 is the sowing uniformity coefficient of variation, and Y 2 is the broken rate. In total, 23 sets of tests were conducted, and each set of tests was repeated three times to take the average.

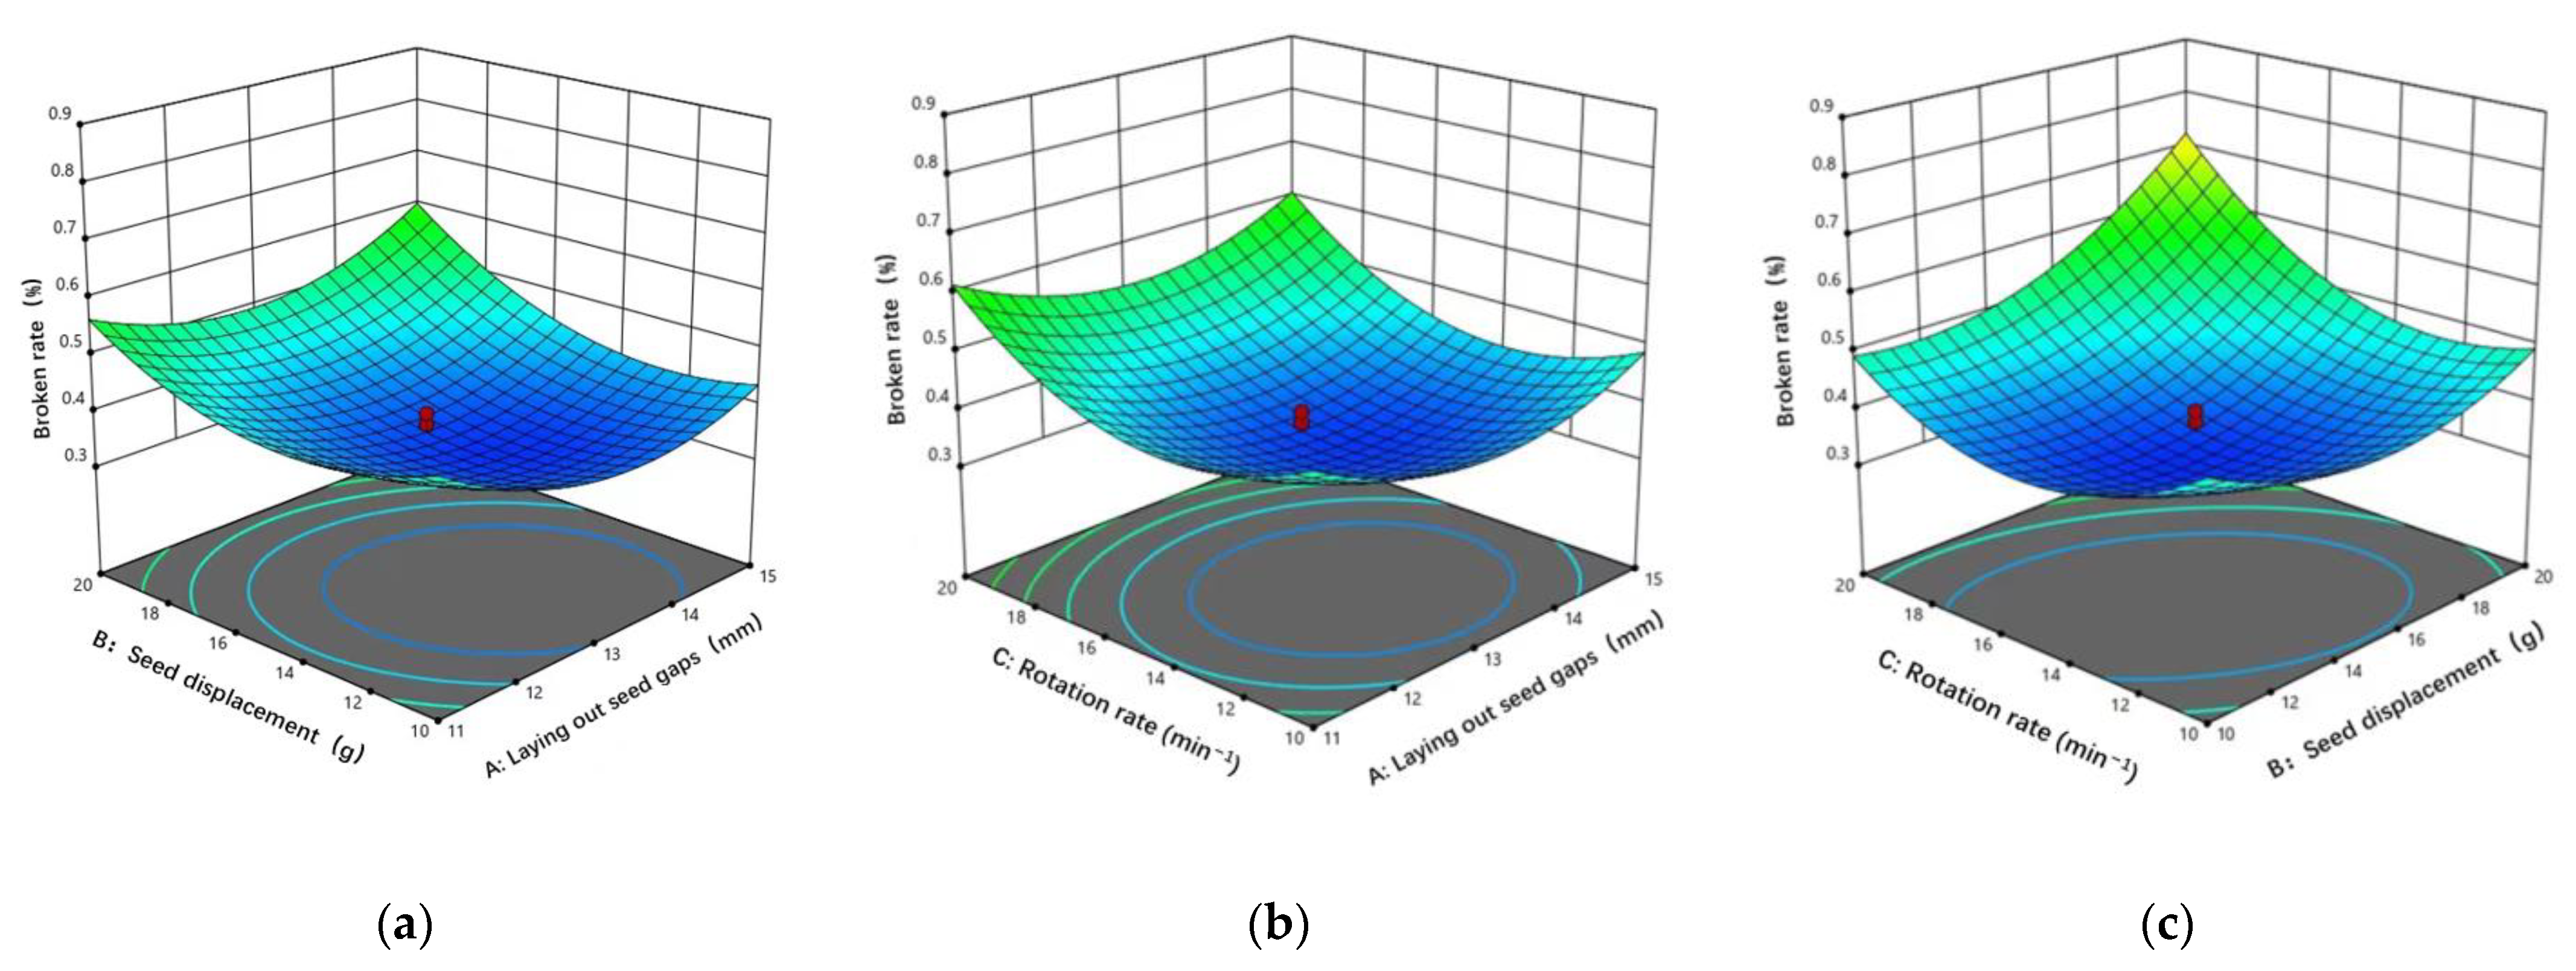
3.2.2. Analysis of Results

The regression equations for the sowing uniformity coefficient of variation and breakage rate using the layout of the seed gaps, the seed displacement, and the rotation rate were obtained by multiple regression fitting analysis of the test results using Design-Expert12 software.
As can be seen from Table 9, there was an effect of the three factors of the test on the sowing uniformity coefficient of variation, where the primary term x 3 ; the interaction term x 2 x 3 ; and the squared terms x 1 2 , x 2 2 , and x 3 2 had a more significant effect on the sowing uniformity. The regression equations of the sowing uniformity with the layout seed gaps x 1 , the seeding rate x 2 , and the rotation rate x 3 were obtained.
Y 1 = 13.05 + 0.1777 x 1 + 0.1591 x 2 + 2.09 x 3 + 0.2550 x 1 x 2 + 0.1050 x 1 x 3 0.6525 x 2 x 3 + 3.29 x 1 2 + 2.72 x 2 2 + 4.23 x 3 2
As can be seen from Table 10, there was an effect of the three factors of the test on the broken rate, where the primary term x 3 ; the interaction terms x 1 x 2 ,   x 2 x 3 ; and the squared terms x 1 2 , x 2 2 , and x 3 2 had a more significant effect on the broken rate. The regression equations of the sowing uniformity with the layout seed gaps x 1 , the seeding rate x 2 , and the rotation rate x 3 were obtained.
Y 2 = 0.3548 0.0048 x 1 + 0.0072 x 2 + 0.0813 x 3 0.0275 x 1 x 2 0.0075 x 1 x 3 + 0.0125 x 2 x 3 + 0.1041 x 1 2 + 0.1217 x 2 2 + 0.1041 x 3 2 .
The response surface of the two-by-two interaction of laying out the seed gaps, the seed displacement, and the rotation rate on the sowing uniformity coefficient of variation and the broken rate was obtained using Design-Exper12 software, as shown in Figure 15 and Figure 16.
As shown in Figure 15a, when the seed displacement was certain, the effect of the layout seed gaps on the sowing uniformity coefficient of variation showed a decreasing and then increasing trend, and there existed a minimum coefficient of variation of the layout seed gaps. When the layout seed gaps were too small, the seeds easily formed a pile, and it took longer to drop the seeds, thus affecting the uniformity of the seed distribution; conversely, if the layout seed gaps were too large, the seeds were prone to collide with other seeds in the process of dropping, thus affecting the uniformity of sowing.
As shown in Figure 15b, when the layout seed gaps were certain, with the increase in the rotation rate, the sowing uniformity coefficient of variation showed a trend of decreasing and then increasing. If the rotation rate was too slow, the length of the seed drop increased, affecting the uniformity of the seed distribution; if the rotation rate was too fast, the seed easily formed a collision with the annular space, which made the uniformity deteriorate.
As shown in Figure 15c, when the rotation rate was certain, with the increase in the seed displacement, the sowing uniformity coefficient of variation showed the trend of decreasing and then increasing, in which the seed displacement of 15 g was optimal. If the seed displacement was too small, the seeds were prone to mutual collision in the process of falling, which led to uneven seeding; if the seed displacement was too large, the seeds were prone to piling up and the time of seed falling increased, which caused the uniformity to deteriorate.
As shown in Figure 16a, when the seed displacement was certain, the influence of the layout seed gaps on the broken rate showed a decreasing and then increasing trend. When the layout seed gaps were too small, the gap between the seed guide port and the cone was too small and the seeds were easily crushed; when the layout seed gaps was too large, the seeds were prone to impact when falling, resulting in an increase in the breakage rate.
As shown in Figure 16b, when the layout seed gaps were certain, the influence of the rotation rate on the broken rate showed a decreasing and then increasing trend. When the rotation rate was too low, the seeds fell more slowly, the seeds easily piled up at the exit of the seed guide port, and the seeds easily formed an extrusion, which led to an increase in the broken rate; when the rotation rate was too high, the seeds easily made contact with each other, and the seeds and the annular space also easily contacted each other, which led to an increase in the broken rate.
As shown in Figure 16c, when the rotation rate was certain, the influence of the seed displacement on the broken rate showed a decreasing and then increasing trend. When the seed displacement was low, the seeds easily contacted each other in the annular space, which led to an increase in the broken rate; when the seed displacement was high, the seeds easily formed a pile in the seed guide port, which easily formed an extrusion, thus increasing the broken rate.

3.2.3. Verification Experiment

In order to obtain the optimum seeding performance operating parameters of the seed-metering device, parameter optimization of the experimental results was carried out using Design-Expert12 software, with the constraints that the sowing uniformity coefficient of variation was less than 45% and the broken rate was less than 1%. The optimized solution had a layout seed gap of 13.42 mm, a seed displacement of 17.67 g, and a rotation rate of 15.59 min−1; at this time, the sowing uniformity coefficient of variation was 14.56% and the broken rate was 0.39%. The test seeding effect is shown in Figure 17.
In order to verify the above test conclusions, three verification tests were conducted under the above optimal working conditions; the results are shown in Table 11. The sowing uniformity coefficient of variation and broken rate were maintained at a low level, and the seed-metering device performance was good.

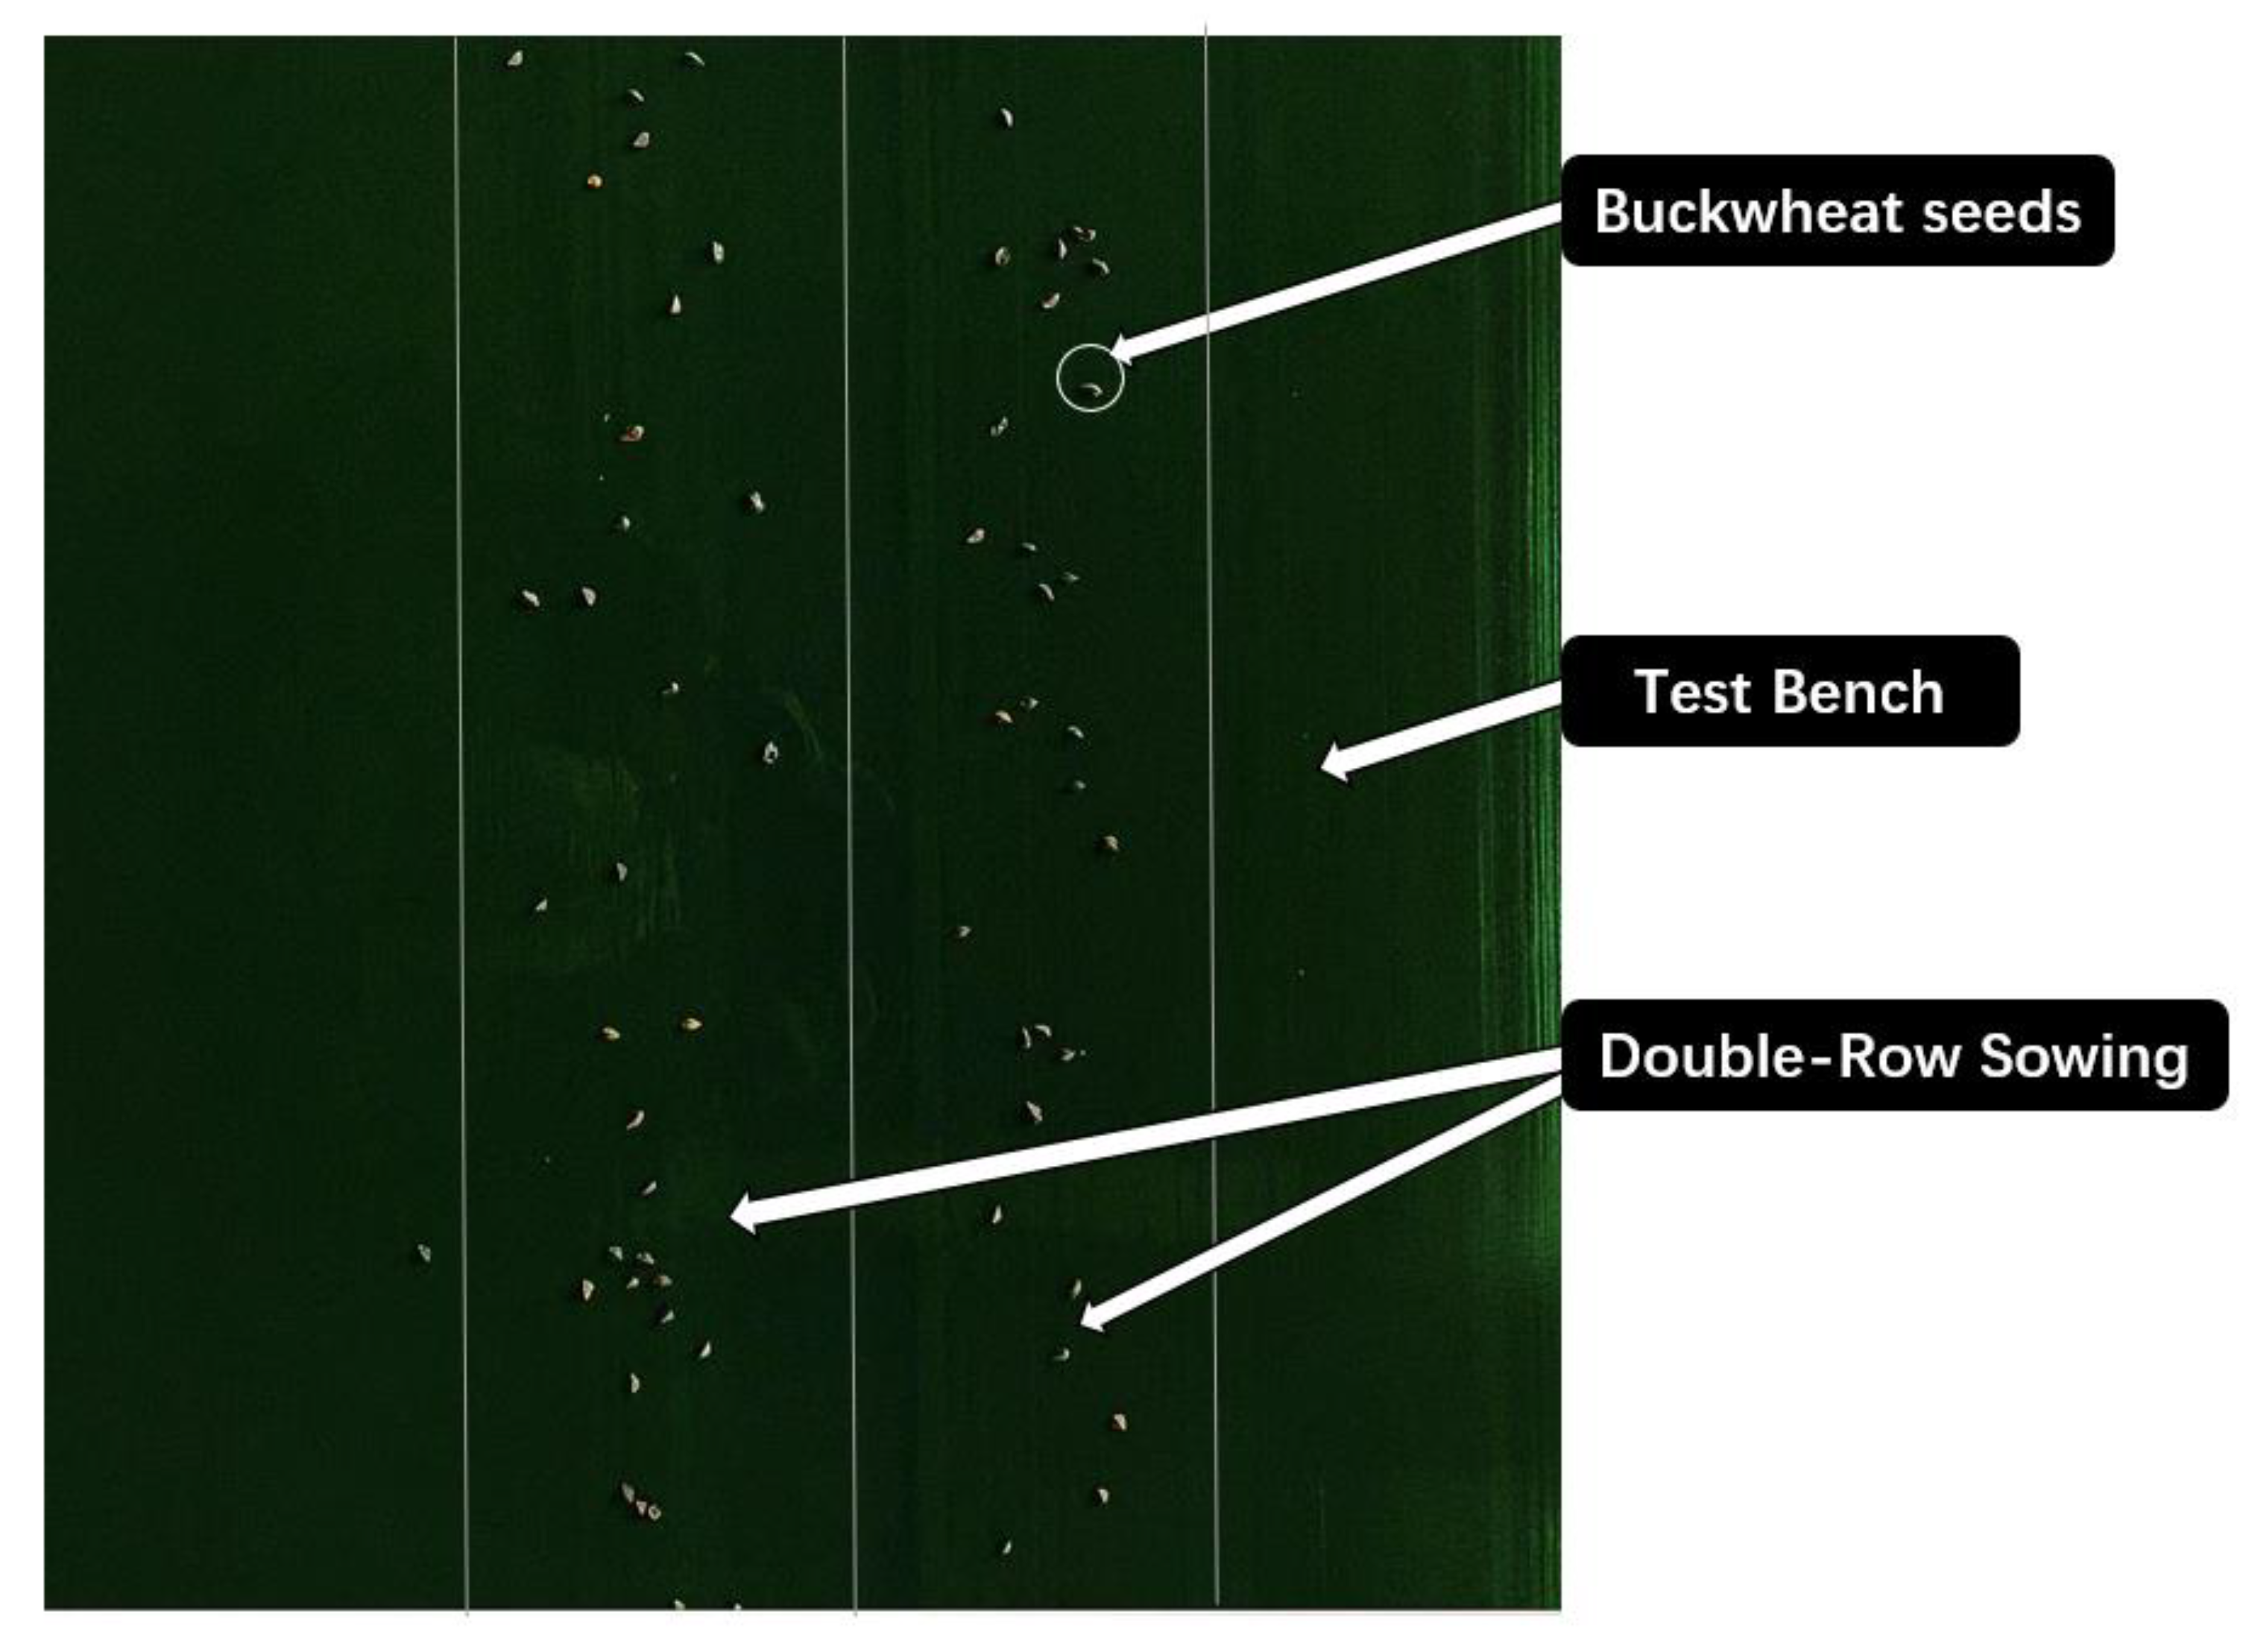
3.3. Sowing Row Length Pass Rate Testing

In order to ensure that the sowing length control met the requirements after the seed-metering device completed its operation, the accuracy of the sowing row length was tested according to the distribution of seeds on the test bed belt of the test bed, and the qualified range of the sowing length was ±5 cm.
The test was carried out by using fixed layout seed gaps, seed displacement, and rotation rate; pouring the seed into the seed box; observing the seed discharge tube; waiting until no seed was discharged; closing the seed bed belt; and measuring the length of the seed sown on the seed bed belt, as shown in Table 12.
The test results showed that the total error in the row length of the double-row seed-metering device for breeding buckwheat in the experimental area was around 5 cm, which was in line with the permissible range of the breeding trials in the test area.

4. Conclusions

In this paper, on the basis of analyzing the current status of the existing research on plot seeders, we adopted theoretical analysis, simulation analysis, and experimental research to carry out a systematic study on the seed-metering device and reached the following conclusions:
  • In order to improve the level of experimental-area breeding mechanization, this paper designs a cone grid format seed-metering device based on the seeding requirements of plot breeding and plant breeding. An experimental study was carried out and the optimal parameters were verified using layout seed gaps, seed displacement, and rotation rate as experimental factors, and sowing uniformity coefficient of variation and broken rate as evaluation criteria. The results showed that the interaction of the layout seed gaps, the seed displacement, and the rotation rate had extremely significant effects on the sowing uniformity coefficient of variation and the broken rate. By modeling the regression equations, the optimum layout seed gap was 13.42 mm, the optimum seed displacement was 17.67 g, and the optimum rotation rate was 15.59 min−1. Under the optimal working conditions, several verification tests were carried out; the average value of the sowing uniformity coefficient of variation was obtained as 14.56%, and the broken rate was 0.39%, which was lower than the national standard. In summary, the double-row seed-metering device for breeding buckwheat in experimental areas can meet the requirements of experimental-area breeding and can achieve the buckwheat seeding requirements.
  • On this basis, further research is needed depending on the operational purpose and characteristics of the seed-metering device: First, this study focuses on experimental breeding of buckwheat; we will carry out further structural modifications and performance tests to make it meet the sowing requirements of different seeds and improve the applicability of the seed-metering devices. Secondly, we will utilize discrete element simulation software to dynamically simulate the seed-rowing process. Further, we aim to study the principle of seed-metering devices, analyze the movement trajectory of the seeds, change the structural parameters of the seed-metering devices, and improve the performance of seed-metering devices.

Author Contributions

Conceptualization, D.L.; methodology, D.L.; validation, D.L. and J.M.; data curation, X.Z., P.X. and X.Q.; writing—original draft preparation, D.L.; writing—review and editing, D.L.; supervision, D.Z. and J.W.; project administration, D.Z.; funding acquisition, D.Z. and J.W. All authors have read and agreed to the published version of the manuscript.

Funding

This research was funded by National Modern Agricultural Industrial Technology System “Research and Development and Demonstration of Diversified Intelligent Harvesting Equipment for Oats and Buckwheat” (CARS-07-D-2), Shanxi Province Excellent Doctoral Work Award-Scientific Research Project “Development of Seeder for Crop Breeding in Plots” (No. SXBYKY2021074), and Shanxi Agricultural University Ph.D. Research Startup Project “Development of Combine Harvester for Oats and Buckwheat in Hilly Areas” (No. 2021BQ18).

Data Availability Statement

Data are contained within the article.

Conflicts of Interest

The authors declare no conflict of interest.

References

  1. Bohorquez Ruiz, Y.L.; Scott, I.M.; McNeil, J.N. The Buckwheat Effect: A Biopesticide for Wireworm? J. Econ. Entomol. 2019, 112, 625–632. [Google Scholar] [CrossRef] [PubMed]
  2. Ye, Y.; Wu, Z.; Yu, T.; Dong, Z.; Liu, J. Experimental Study on Seed Uniformity of Cone Seeder of Community Planter. J. Agric. Mech. Res. 2024, 46, 179–183. [Google Scholar] [CrossRef]
  3. Lian, Z.; Wang, J.; Yang, Z.; Shang, S. Development of Plot-Sowing Mechanization in China. Trans. Chin. Soc. Agric. Eng. 2012, 28, 140–145. [Google Scholar]
  4. Song, J.; Zhang, S. Current Situation and Developmental Orientation of Plot Seeder. J. Agric. Mech. Res. 2004, 4, 14–16. [Google Scholar]
  5. Shang, S.; Wu, X.; Yang, R.; Li, G.; Yang, X.; Chen, D. Research Status and Prospect of Plot-sowing Equipment and Technology. Trans. Chin. Soc. Agric. Mach. 2021, 52, 1–20. [Google Scholar]
  6. Chang, J.; Liu, X.; Ye, T.; Du, M. Agricultural Plot Field Trial Breeding Status and Development of Machinery. J. Agric. Mech. Res. 2011, 33, 238–241. [Google Scholar] [CrossRef]
  7. Liu, S.G.; Ma, Y.F. Development History, Status and Trends of Plot Seeder. Appl. Mech. Mater. 2012, 268–270, 1966–1969. [Google Scholar] [CrossRef]
  8. Zhang, X.; Yang, R.; Shang, S. Research Present Situation and Development about Ditching Device of Plot Planting Machinery. Agric. Eng. 2014, 4. 1–3+6. [Google Scholar]
  9. Shang, S.; Yang, R.; Yin, Y.; Guo, P.; Sun, Q. Current Situation and Development Trend of Mechanization of Field Experiments. Trans. Chin. Soc. Agric. Eng. 2010, 26, 5–8. [Google Scholar]
  10. Guo, P.; Shang, S.; Wang, Y. Popularizing and Increasing The Level of Mechanization Field Breeding Equipment; Chinese Society of Agricultural Engineering: Beijing, China, 2004; pp. 60–62. [Google Scholar]
  11. Zhang, H.; Han, Z.; Wang, L. Present Researching Status and Development of Pot Seed Harvesting Machinery. Hunan Agric. Sci. 2008, 38. 102–104+139. [Google Scholar] [CrossRef]
  12. Oyjord, E. A Simple Apparatus for Field or Laboratory Tenting of Seed Drills. Int. Assoc. Mech. Field Exp. 1987, 23, 46. [Google Scholar]
  13. Eskandari, I.; Sartipi, N. Construction of an Experimental Plot Seeder of Wheat Planting and Compare It by Imported One. J. Agric. Mach. 2016, 6, 298–311. [Google Scholar]
  14. Zhang, X. Design Analysis and Experiment Research of Three-Piece Type Seed-Metering Device for Single Ear Drilling Machinery. Master’s Thesis, Qingdao Agricultural University, Qingdao, China, 2016. [Google Scholar]
  15. Liu, S.; Shang, S.; Yang, R.; Zheng, Y.; Zhao, D.; Zhao, J. Test and Optimization of Parameters for the Storing Device of Plot Seeder. Trans. Chin. Soc. Agric. Eng. 2010, 26, 101–108. [Google Scholar]
  16. Yang, C.; Shang, S.; Yang, R.; Wang, C. Theoretical Study on the Cone-Centrifugal Seed Metering Device. J. Agric. Mech. Res. 2015, 37, 63–66. [Google Scholar] [CrossRef]
  17. Yang, W.; Li, J.; Zhang, X.; Yang, R.; He, Z.; Zhang, D. Design and Experiment of Magazine-fed Seed-distributing Device for Row-seeding Spaced Planter. J. Agric. Mech. Res. 2016, 38, 72–76. [Google Scholar] [CrossRef]
  18. Testing Methods of Sowing in Lines. Available online: https://openstd.samr.gov.cn/bzgk/gb/newGbInfo?hcno=16D7B4F44A54CF5D7FB39D44D539CF3D:URL (accessed on 15 October 2023).
  19. Liu, H.; Wang, F. The Choice and Analysis of Factors in Seed-metering Device Experimental Study. J. Agric. Mech. Res. 2007, 29, 77–79. [Google Scholar]
  20. Wu, S. Design and Research of 2BT-4 Type Buckwheat and Precision Seeder. Master’s Thesis, Shanxi Agricultural University, Jinzhong, China, 2022. [Google Scholar]
  21. Gao, Z. Design Analysis and Experiment Research of the Seeger in Buckwheat and Oat Plot. Master’s Thesis, Shanxi Agricultural University, Jinzhong, China, 2021. [Google Scholar]
  22. Yang, S.; Yin, M.; Zhang, S. Experimental Research of the Grass Seed Motion and Distribution Uniformity on Distributor Cone. J. China Agric. Univ. 2013, 18, 178–184. [Google Scholar]
  23. Luo, J.; Feng, S. Kinetostatic Analysis of Tangent Mechanism in Brake Loosing Device of Crane during Accident. Mech. Eng. Autom. 2016, 45, 53–55. [Google Scholar]
  24. Zhou, X.; Ma, B. Motion Simulation of New Tangential Mechanism Shoe Polisher by Pro/E and Simulink. Light Ind. Mach. 2015, 33, 69–73. [Google Scholar]
  25. Xu, H.; Ma, X.; Guo, F.; Wang, T. Kinematics Analysis and Simulation of Oscillating Guard Bar Mechanism Based on MATLAB and Pro/E. Mech. Eng. 2014, 46, 117–119. [Google Scholar]
  26. Liu, S. Study on Design and Mechanism Analysis of Main Parts of Plot Seeder. Ph.D. Thesis, Shenyang Agricultural University, Shenyang, China, 2011. [Google Scholar]
  27. Zhang, X.; Liu, Y.; Wu, Y. Initial Study on the Index System of the Quality Evaluation of the Drilling-Irrigating-Manuring Seedier; Chinese Society for Agricultural Machinery: Beijing, China, 2000; pp. 54–57. [Google Scholar]
Figure 1. Structure diagram of a double-row seed-metering device for buckwheat breeding in an experimental area: (a) 3D structure diagram; (b) 2D structure diagram. (1) seed box; (2) seed-metering control mechanism; (3) layout-seed-regulating mechanism; (4) cone grid format seed-distributing mechanism; (5) frame; (6) transmission system; (7) seed dispenser port.
Agronomy 13 02857 g001
Figure 2. Structure diagram of the cone grid format seed-distributing mechanism: (1) seed guide tube; (2) layout seed tube; (3) cone grid format seed-distributing disk.
Agronomy 13 02857 g002
Figure 3. Schematic diagram of seed stress analysis in layout seed gaps: 1, 2 and 3 are buckwheat seeds.
Agronomy 13 02857 g003
Figure 4. Schematic diagram of the seed-metering control mechanism: (1) support plate; (2) left sliding plate; (3) adjusting lever; (4) right sliding plate; (5) rotating lever; (6) connecting rod.
Agronomy 13 02857 g004
Figure 5. Working principle of the seed-metering control mechanism.
Agronomy 13 02857 g005
Figure 6. Closed-loop vector diagram of the seed-metering control mechanism.
Agronomy 13 02857 g006
Figure 7. Simulink simulation model of the seed-metering control mechanism.
Agronomy 13 02857 g007
Figure 8. Displacement curve diagram: (a) displacement curve diagram of r 6 ; (b) displacement curve diagram of r 8 .
Agronomy 13 02857 g008
Figure 9. Velocity curve diagram: (a) velocity curve diagram of r 6 ; (b) velocity curve diagram of r 8 .
Agronomy 13 02857 g009
Figure 10. Hardware setup for Single-Factor Experiment: (a) overall structure of the seed-metering device; (b) internal grid of the seed-metering device during the experiment.
Agronomy 13 02857 g010
Figure 11. Schematic diagram of the effect of layout seed gaps on the raster uniformity coefficient of variation.
Agronomy 13 02857 g011
Figure 12. Schematic diagram of the effect of the seed displacement on the raster uniformity coefficient of variation.
Agronomy 13 02857 g012
Figure 13. Schematic diagram of the effect of the rotation rate on the raster uniformity coefficient of variation.
Agronomy 13 02857 g013
Figure 14. Schematic diagram of the bench test.
Agronomy 13 02857 g014
Figure 15. Schematic representation of the effect of factor interactions on the sowing uniformity coefficient of variation: (a) interaction effects of the layout seed gaps and seed displacement on the sowing uniformity coefficient of variation; (b) interaction effects of the layout seed gaps and the rotation rate on the sowing uniformity coefficient of variation; (c) interaction effects of the seed displacement and rotation rate on the sowing uniformity coefficient of variation.
Agronomy 13 02857 g015
Figure 16. Schematic representation of the effect of factor interactions on the broken rate: (a) interaction effects of the layout seed gaps and the seed displacement on the broken rate; (b) interaction effects of the layout seed gaps and the rotation rate on the broken rate; (c) interaction effects of the seed displacement and the rotation rate on the broken rate.
Agronomy 13 02857 g016
Figure 17. Schematic diagram of the seeding effect at the time of the test.
Agronomy 13 02857 g017
Table 1. Physical parameters of buckwheat grains.
VarietyLength
(mm)
Width
(mm)
Thickness
(mm)
Thousand Grains Weight
(g)
Moisture Content
(%)
Natural Angle of Repose (°)
Hongshan buckwheat4.84–5.013.60–3.733.26–3.4227.624.3231.42
Table 2. Technical parameter table of the double-row seed-metering device for breeding buckwheat in the experimental area.
Project NameUnitsParameter
Structure of the seed-metering control mechanism Split sliding block mechanism
Range of control of the layout-seed-regulating mechanismmm11–35
Structural type of the seed distribution mechanism cone grid format
Cone angle of inclination 50°
Cone dimensions (diameter × height)mm150 × 90
Number of grid cells 60
Grid Sizemm37 × 30
Transmission system type-chain drive
Diameter of seed discharge diskmm260
Number of seeding rows 2
Table 3. Initial simulation value of the seed-metering control mechanism.
ProjectValue
r 1 / m m 147.45
r 2 / m m 30
r 3 / m m 126
r 4 / m m 30
r 5 / m m 63.67
r 6 / m m 37.28
r 7 / m m 51.62
r 8 / m m 184.72
r 9 / m m 63.67
θ 1 / r a d 0
θ 2 / r a d 5.3407
θ 3 / r a d 0.4189
θ 4 / r a d 2.0769
θ 5 / r a d 5.3407
θ 6 / r a d 0
θ 7 / r a d 1.5708
θ 8 / r a d 0
θ 9 / r a d 0.9425
ω 2 / ( r a d · s 1 ) −3.14
ω 3 / ( r a d · s 1 ) 0.0915
ω 4 / ( r a d · s 1 ) 3.0831
ω 5 / ( r a d · s 1 ) 3.14
ω 6 / ( r a d · s 1 ) 0
ω 7 / ( r a d · s 1 ) 0
ω 8 / ( r a d · s 1 ) 0
ω 9 / ( r a d · s 1 ) 3.0831
time/(s)0.20
Table 4. Test plan parameters of layout seed gaps.
Test NumberLayout Seed Gaps
(mm)
Seed Displacement (g)
1715
2915
31115
41315
51515
61715
71915
82115
92315
Table 5. Test plan parameters of the seed displacement.
Test NumberSeed Displacement (g)Layout Seed Gaps
(mm)
11013
21513
32013
42513
53013
63513
Table 6. Test plan parameters of the rotation rate.
Test NumberRotation Rate
(min−1)
Seed Displacement (g)Layout Seed Gaps
(mm)
151513
2101513
3151513
4201513
5251513
6301513
Table 7. Coding parameters table for test factors.
Factor Level Layout   Seed   Gaps x 1
(mm)
Seed   Displacement   x 2
(g)
Rotation   Rate   x 3
(min−1)
1.68216.363623.40923.409
1152020
0131515
−1111010
−1.6829.636416.591046.59104
Note: “0” is the center point; “1” and “−1” are cube points; “1.682” and “−1.682” are the axis points.
Table 8. Parameters of the experimental program and results.
Test Number Layout   Seed   Gaps   x 1
(mm)
Seed   Displacement   x 2
(g)
Rotation   Rate   x 3
(min−1)
Sowing   Uniformity   Coefficient   of   Variation   Y 1
(%)
Broken   Rate   Y 2
(%)
111101017.460.51
211202024.350.84
311201020.220.53
411102025.370.76
515201023.140.55
615202028.860.82
715102027.690.86
815101020.530.63
99.63641151525.230.73
1016.3636151519.050.56
11136.591041521.510.66
121323.4091519.520.63
1313156.5910423.730.63
14131523.40925.860.66
1513151514.010.39
1613151512.410.32
1713151513.140.37
1813151512.710.33
1913151513.430.37
2013151512.650.35
2113151512.920.47
2213151513.180.33
2313151512.860.35
Table 9. Variance analysis table of the sowing uniform coefficient of variation.
SourceSum of SquaresDFMean SquareF Valuep ValueSignificance
Model503.89955.998.230.0014**
x 1 0.431110.43110.06340.8063
x 2 0.345810.34580.05090.8261
x 3 59.48159.488.750.0144
x 1 x 2 0.520210.52020.07650.7877
x 1 x 3 0.088210.08820.01300.9116
x 2 x 3 3.4113.410.50080.4953
x 1 2 156.441156.4423.000.0007**
x 2 2 106.641106.6415.680.0027**
x 3 2 258.281258.2837.980.0001**
Residual68.01106.80
Lack of fit66.25513.2537.670.0006**
Pure error1.7650.3518
R20.8811
Cor total571.9019
Note: “**” indicates extreme significance.
Table 10. Variance analysis table of the broken rate.
SourceSum of SquaresDFMean SquareF Valuep ValueSignificance
Model0.538490.05987.840.0017**
x 1 0.000310.00030.04170.8424
x 2 0.000710.00070.09160.7684
x 3 0.090310.090311.820.0063**
x 1 x 2 0.006010.00600.79230.3943
x 1 x 3 0.000410.00040.05890.8131
x 2 x 3 0.001310.00130.16370.6943
x 1 2 0.156010.156020.440.0011**
x 2 2 0.213610.213627.970.0004**
x 3 2 0.156010.156020.440.0011**
Residual0.0764100.0076
Lack of fit0.072850.014620.510.0024**
Pure error0.003650.0007
R20.9475
Cor total0.614819
Note: “**” indicates extreme significance.
Table 11. Table of the validation test results.
Test NumberLayout Seed Gaps
(mm)
Seed Displacement
(g)
Rotation Rate
(min−1)
Sowing Uniformity Coefficient of Variation
(%)
Broken Rate
(%)
113.4217.6715.5915.340.36
213.760.39
314.590.44
Table 12. Analysis of the sowing row length pass rate test program and results.
NumberTheoretical Length
(m)
Layout Seed Gaps
(mm)
Seed Displacement (g)Rotation Rate
(min−1)
Actual Length
(m)
Deviation
(m)
15.0013.4217.6715.595.040.04
25.000
35.020.02
45.040.04
55.050.05
65.000
Disclaimer/Publisher’s Note: The statements, opinions and data contained in all publications are solely those of the individual author(s) and contributor(s) and not of MDPI and/or the editor(s). MDPI and/or the editor(s) disclaim responsibility for any injury to people or property resulting from any ideas, methods, instructions or products referred to in the content.

