Article

Water and Nitrogen Balance under Various Water and Fertilizer Regulation Modes

1
Agricultural Water Conservancy Department, Chang Jiang River Scientific Research lnstitute, Wuhan 430010, China
2
College of Resources and Environment, Yangtze University, Wuhan 430100, China
*
Authors to whom correspondence should be addressed.
Agronomy 2023, 13(12), 2870; https://doi.org/10.3390/agronomy13122870
Submission received: 20 October 2023 / Revised: 9 November 2023 / Accepted: 17 November 2023 / Published: 22 November 2023

Abstract

:
A experiment was conducted at the Jiangxi Province Center Station of Irrigation Experiment from 2019 to 2021 to study the water and nitrogen balance under water and fertilizer regulation modes. The study aimed to propose a recommended mode for paddy fields that could save water, control pollution, reduce gas emission, and improve fertilizer use efficiency. This study examined the impact of different irrigation methods and nitrogen application levels on water saving and emission reduction in paddy fields. The experiment included six treatments, which involved two irrigation methods (intermittent irrigation and flooding irrigation, referred to as W1 and W0, respectively) and three application rates of nitrogen fertilizer (0 kg/ha, 135 kg/ha, 180 kg/ha, referred to as N0, N1 and N2, respectively). The study found that irrigation methods had a significant effect on the amount of irrigation, drainage, leakage, nitrogen load from drainage, soil nitrification potential, and ammonia volatilization. The results showed that compared to flooding irrigation, intermittent irrigation reduced the amount of irrigation, drainage, leakage and nitrogen load from drainage by an average of 25.98%, 16.03%, 8.43% and 10.86%, respectively. However, the study also found that the nitrification potential and ammonia volatilization increased by an average of 6.45% and 4.32%, respectively. Fertilization levels had a significant effect on drainage nitrogen load, early soil nitrification potential and ammonia volatilization. Compared with the treatment of N2 (180 kg N/ha), the drainage nitrogen load under the treatment of N1 (135 kg N/ha) decreased by 10.86% on average, while nitrification potential and ammonia volatilization increased by 38.74% and 3.33%, respectively. In terms of nitrogen output, the amount of nitrogen absorbed by crops was the largest, followed by the nitrogen load from field drainage, then ammonia volatilization, and then denitrification. Considering the goals of water saving, emission reduction, and the efficient utilization of water and fertilizer in paddy fields, the optimal water and fertilizer regulation mode was the W1N1 mode (intermittent irrigation combined with reduced nitrogen fertilizer application rate, 135 kg N/ha).

1. Introduction

Rice is one of the four major food crops in China, which is mainly planted in the northeast and southern areas. The middle and lower reaches of the Yangtze River as an important producing area are of great significance to ensure the stability of rice production in China. In 2020, the sown area of rice in China was 30.076 million ha, accounting for 25.76% of the total sown area of grain. And the sown area of rice in the southern region accounts for 70.89% of the country [1]. A high and stable rice yield are mainly dependent on irrigation and fertilization. Due to the abundant precipitation in the southern region, the extensive irrigation methods of rice are widespread, and most of them are flooding irrigation, which leads to the low utilization rate of irrigation water of 40%. China is the largest consumer of nitrogen fertilizer, accounting for 30% of the global nitrogen fertilizer, according to survey statistics. And the amount of nitrogen fertilizer in paddy fields accounts for about 24% of total nitrogen consumption in China [2], but the fertilizer utilization rate is only 39.2%, which is lower 10–20 percentage points than developed countries [1]. During the rice growth period, the large quantity of drainage and irrigation, excessive fertilization and the coincidence of rainfall and fertilization result in a large amount of nitrogen and phosphorus loss, which can easily cause non-point source pollution. The key to improving the efficient utilization of water resources and controlling non-point source pollution in agriculture is source governance. In other words, the water cycle and the law of migration and transformation of non-point source pollution in paddy fields are studied to tap the potential of water saving and emission reduction through water and fertilizer regulation. Therefore, water saving and emission reduction strategies that adapt to the characteristics of southern paddy fields are proposed, which is of great practical significance to improve the utilization efficiency of water and fertilizer, reduce agricultural non-point source pollution emissions in southern China and promote the environmental protection and high-quality development of the Yangtze River Economic Belt.
The loss of nitrogen and phosphorus from farmland has been a focus as the problem of non-point source pollution has become more severe and environmental awareness has increased. Studies showed that agricultural water and fertilizer management in the Yangtze River Basin significantly affected the water cycle and the migration and transformation of nitrogen and phosphorus. It not only reduced ineffective water loss but also significantly reduced nitrogen and phosphorus loads and gas emissions from paddy fields. In order to reduce the loss of pollutants such as nitrogen and phosphorus, many scholars have conducted much research on the theory of rice water-saving irrigation and the mechanisms of water and fertilizer regulation in paddy fields. The research focus has also shifted from the traditional water-saving and production-increasing effect to water-saving and emission reduction or water-saving and pollution control, mainly focusing on the study of the loss of nitrogen and phosphorus pollutants under different irrigation methods. In terms of water saving, Yan et al. [3] conducted a field experiment in the Jianghan Plain and found that the amount of irrigation water, total water consumption, runoff and leakage were reduced by 41.7%, 18.5%, 45.8% and 21.9%, respectively, under conventional treatment compared to shallow irrigation and deep storage treatment, rainfall utilization were increased by 16.2%, and the amount of total nitrogen loss in the runoff was decreased by 32.6% to 35.9%. In terms of pollution control, Geng et al. [4] showed that the height of surface water level was mainly affected by rainfall and irrigation. Field water and fertilizer management were the main factors affecting the dynamic changes in soil water content, surface water and nitrogen concentration in soil water at different depths. The greening stage was the critical growth period for the leaching loss of nitrogen and tillering stage, and the jointing and booting stage were the critical growth periods for nitrogen loss from surface runoff. Liu et al. [5] found that the accumulated leaching of NH4+-N and NO3-N from the top 100 cm of soil increased with the irrigation amount. Increasing the irrigation amount boosted mineralization, and the soil water content in the proximity of the soil surface increased drastically in the first four days after the irrigation, and the spatiotemporal change in N was dominated by its movement more than by its transformation. After that, soil water in the topsoil stabilized asymptotically and the N change was dominated by transformation. Cui et al. [6] conducted a water-saving and emission-reduction experiment with middle rice using 15N tracer technology at the Tuanlin Irrigation Experimental Station in Zhanghe Irrigation District, Hubei Province. The results revealed that after one season of rice cultivation, the residual soil and ammonia volatilization accounted for approximately one-third of the total applied nitrogen. Moreover, rice absorption accounted for 20% to 30% of the total applied nitrogen. Ammonia volatilization was higher under water-saving irrigation compared to flooding irrigation due to the higher soil solution concentration.
Although the concentration of NH4+-N and NO3-N in the percolation water was elevated under water-saving irrigation, the total nitrogen leaching loss was lower because the overall percolation loss was significantly reduced compared to flooding irrigation. In general, the mode of water-saving irrigation and more nitrogen supply splits was the best regulation mode of water and fertilizer management. Okubo and Kreyea [7] found that reducing irrigation water in paddy fields could effectively reduce total nitrogen loss from surface runoff, and controlling surface drainage could reduce nutrient loss.
While focusing on nitrogen and phosphorus losses from surface runoff in paddy fields, some scholars have also studied gas emissions from paddy fields and crop uptake and utilization under water-saving irrigation and nitrogen-reduced fertilization. Wang et al. showed that water-saving irrigation could significantly reduce N2O emissions and ammonia volatilization by changing the water status of paddy fields [8]. Zhang et al. showed that different nitrogen application levels had an effect on gaseous nitrogen emissions, and the amount of nitrogen applied significantly affected soil NH3 volatilization and N2O emissions. The higher the nitrogen application level, the more gaseous nitrogen emission [9]. Liu et al. [10] and Wang et al. [11] showed that nitrogen reduction could significantly reduce the total nitrogen loss rate from surface runoff, the peak value and the total loss from ammonia volatilization in paddy fields, but which had no significant reduction in yield. Wang et al. [12] conducted a 15N tracer-based long-term in situ experiment to continuously monitor the fate and residual effects of soil-residual fertilizer N over 17 years of nonfertilizer N application in a rice-wheat cropping system. Their findings indicated that 34.5–37.9% of the initially applied fertilizer N was absorbed by the first wheat crop. Subsequently, the amount of residual N uptake by rice and wheat exhibited an exponential decrease during the following rice–wheat rotation years. Over the course of the next 17 years, approximately 12.2–15.8% of the initially applied fertilizer N was taken up by subsequent crops, with 9.2–11.8% by rice and 3.3–4.0% by wheat [12]. For nitrogen balance, Xiao et al. investigated the mechanism of nitrogen migration and transformation as well as the fertilizer nitrogen utilization trend under different irrigation methods using isotope 15N tracer technology. The findings revealed that water-saving irrigation modes (flooding irrigation W1 and intermittent irrigation W2) could effectively reduce NO3-N leaching loss by decreasing leakage and the NO3-N concentration, resulting in a reduction in nitrogen leaching loss of 62% and 64%, respectively. Additionally, the water-saving irrigation mode increased the nitrogen utilization rate by 5.0% and 9.7%, respectively, significantly enhancing nitrogen uptake capacity. Moreover, the water-saving irrigation mode was proved to be effective in reducing NH3 volatilization loss in paddy fields while simultaneously decreasing the proportion of ammonia volatilization from fertilizer nitrogen to total ammonia volatilization. This approach also led to a notable increase by 14% in soil’s total nitrogen content and reduced the residual nitrogen rate from soil fertilizers by 14.6% [13].
Wang et al. had studied that a 15N tracer long-term in situ experiment was used to continuously monitor the fate and the residual effect of soil-residual fertilizer N in the following 17 years under non-fertilizer N application in a rice–wheat cropping system, which found that 34.5–37.9% of the applied fertilizer N was taken up by the first wheat crop, and then the amount of residual N uptake by the rice and wheat decreased exponentially in the following rice–wheat rotation years. Over the following 17 years, 12.2–15.8% of the applied fertilizer N was taken up by the subsequent crops (9.2–11.8% for rice and 3.3–4.0% for wheat) [12]. For nitrogen balance, Xiao et al. studied the mechanism of nitrogen migration and conversion and the trends of fertilizer nitrogen utilization under different irrigation methods using isotope 15N tracer techniques. The results showed that water-saving irrigation modes (flooding irrigation W1 and intermittent irrigation W2) could reduce the NO3-N leaching loss by reducing the water leakage amount and the NO3-N concentration, and effectively inhibit the leaching loss of fertilizer nitrogen. Compared with conventional irrigation (W0), the leaching loss amount of fertilizer nitrogen in W1 and W2 decreased by 62% and 64%, respectively. Under the same amount of fertilizer, water-saving irrigation mode can significantly reduce the total amount of ammonia (NH3) volatilization and the proportion of NH3 volatilization of fertilizer nitrogen in total NH3 volatilization, and significantly increase the nitrogen uptake of rice plants. Meanwhile, water-saving irrigation mode can increase the total nitrogen content of paddy soil by 14.0% but reduce the residual rate of fertilizer nitrogen in soil by 14.6%. Moreover, crop nitrogen uptake can be significantly increased under water-saving irrigation. Compared with W0, the nitrogen fertilizer use rate of W1 and W2 increased by 5.0% and 9.7%, respectively [13].
In summary, different water and fertilizer managements significantly affect the water cycle process of paddy fields, thereby affecting fertilizer utilization and nitrogen and phosphorus pollution load emissions and changing the emission characteristics of nitrogen gases. However, the current research focuses on the mechanism of water saving, production increase, pollution control and emission reduction under different irrigation and drainage modes and fertilizer application systems. However, there are few studies on the process of water and nitrogen balance under water and fertilizer regulation, especially the coupling effect and mechanism of water and fertilizer, and the effect of water and fertilizer regulation on the soil–plant–atmosphere continuum (SPAC). Based on the above studies, in this paper, we discuss the water cycle and nitrogen migration and transformation processes under water and fertilizer regulation modes, and quantitatively analyze the elements of water and nitrogen balance.

2. Materials and Methods

2.1. Overview of the Study Area

This study was carried out at the Jiangxi Province Center Station of Irrigation Experiment (115°58′ east longitude, 28°26′ north latitude, 22.6 m above sea level) from 2019 to 2021. The study area is a typical subtropical humid monsoon climate zone, with an annual average temperature of 18.1 °C, an annual average sunshine duration of 1720 h, and an annual average precipitation of 1634 mm. The soil is paddy soil, and the soil texture of the plow layer is silt loam, in which sand grains account for 8.13%, silt grains account for 70.01% and clay grains account for 21.86%. The thickness of the soil culture layer is approximately 15–20 cm, the soil bulk density is 1.36 g/cm3, and the mass fractions of organic matter, total nitrogen, total phosphorus, and total potassium are 1.74%, 0.82%, 0.25%, and 1.18%, respectively. The rice growing system and natural conditions at the experimental station are representative of the Poyang Lake basin.

2.2. Experimental Design

The three-year mid-season rice experiment was conducted on a field plot measuring 8 m in length and 3.5 m in width. Plots and ridges of irrigation and drainage ditches was wrapped in plastic to prevent water and fertilizer from crossing between plots. Two irrigation modes were set up in the experiment: flooding irrigation (W0) and intermittent irrigation (W1). Three levels of nitrogen fertilization (calculated as pure nitrogen) were adopted: no nitrogen fertilization (N0, 0 kg/ha), reduced nitrogen fertilization (N1, 135 kg/ha) and conventional nitrogen fertilization (N2, 180 kg/ha). Potassium and phosphate fertilizers were treated in the same way. The field water-depth control standards of different irrigation modes are shown in Table 1. Due to space constraints, no duplicate plots were set for the treatment of W1N0 and W0N0 in 2019 and 2021, nor for the treatment of W1N0 and W0N0 in 2020. Additionally, other treatments were repeated three times. Each plot was randomly arranged. The rice variety was Huanghuazhan (Nanchang Chongxi Eco-Agriculture Co., Ltd., Nanchang, China) and was grown according to a plant spacing of 13 cm and a row spacing of 27 cm. Nitrogen fertilizer was applied at a ratio of 50% base, 30% tillering and 20% panicle. The base fertilizer was 45% compound fertilizer (N-P2O5-K2O: 15-15-15) (Sichuan Meifeng Chemical Co., Ltd., Sichuan, China) in 2019 and 2020, and 45% urea in 2021. The fertilizer used for tillering and panicle was also 45% urea for three years. Phosphate fertilizer was calcium magnesium phosphate fertilizer (calculated as P2O5) (Hubei Golden Pearl Chemical Co., Ltd., Hubei, China) with the application rate of 67.5 kg/ha, which was all used as base fertilizer. Potassium fertilizer (calculated as K2O) (Henan Ezhong Fertilizer Co., Ltd., Henan, China) was potassium chloride with the application rate of 150 kg/ha, and the proportion of base fertilizer and panicle fertilizer was 4.5:5.5. And nitrogen, phosphate and potassium fertilizers were spread out using artificial fertilization. The specific fertilization ratio of different plots is shown in Table 2. The division of growth stages and field management measures and the specific fertilization date are shown in Table 3.

2.3. Sample Collection and Analysis

2.3.1. Observation of Water Balance Elements and Determination of Water Samples

Precipitation and irrigation were observed by meteorological stations and water meters, respectively. And the drainage, water consumption and seepage were calculated according to the field water depth before and after drainage, the daily water depth in the field and the daily water depth in the seepage measuring cylinder.
Water samples from surface and leakage water (burial depths of 20 cm and 40 cm) in the field were taken at draining, the end of growth period and 1, 3, 5, 7 and 9 days after fertilization, which were taken at least once in each growth stage of rice. After each rainfall, samples were taken from the rain gauge barrels in the weather station, and water samples were taken for each irrigation. The total nitrogen, ammonia and nitrate-nitrogen concentrations in the water samples were determined using UV spectrophotometry.

2.3.2. Determination of Nitrogen Content in Plant

The samples were collected once in each growth period. The stems, leaves and panicles were separated, and the dry matter was measured by taking three-legged rice with an average number of tiller-heads. The total nitrogen content of the dried rice plants was measured using a Kjeldahl nitrogen analyzer. The formula for calculating nitrogen use efficiency is as follows:
F U N = ( N P N P 0 ) / N F
In the formula, F U N is the fertilizer nitrogen use efficiency; N P is the total nitrogen uptake of nitrogen treatment by plants, kg/ha; N P 0 is the total nitrogen uptake of non-nitrogen treatment by plants, kg/ha; N F is the total nitrogen uptake of nitrogen treatment, kg/ha.

2.3.3. Testing of Soil Physical and Chemical Properties

Soil samples were collected from the upper layer (0–20 cm) and lower layer (20–40 cm) of the plowing layer before soaking and after harvesting. And the total nitrogen content of the soil samples was determined using the semi-micro Kjeldahl method. The soil sample from the soil layer of 20 cm was taken at each growth period, and its nitrification and denitrification potentials were measured using the acetylene inhibition method.

2.3.4. Sampling and Determination of Ammonia Volatilization

The aeration method was used to measure ammonia volatilization in paddy fields. The sampling frequency was once a day within 7 days after fertilization and once every 1–3 days, which depended on the rate of ammonia volatilization in the later period. The sampling frequency was extended to once every five days after the jointing and booting period until the rice harvest. After sampling, the sponge in the middle and lower layers was soaked with KCl solution and the sample was determined using the Nessler’s reagent colorimetric method. The formula for calculating the ammonia volatilization rate of ammonia is as follows:
V = M A × 10 1
In the formula, V is the volatilized amount of ammonium nitrogen per unit area and time in the field, kg/(ha·d); M is the amount of ammonia nitrogen captured by the sponge in one day, μg/d; and A is the cross-sectional area of the glass cylinder, cm2.

2.3.5. Data Processing

Excel was used for data calculation, and SPSS 21.0 software (IBM, Armonk, NY, USA) was used for significance analysis.

3. Results and Discussion

3.1. Analysis of Water Balance of Paddy Fields

The calculation results of water balance of paddy fields from 2019 to 2021 are shown in Table 4. According to the significance analysis, the irrigation mode was the main factor affecting the water balance of paddy fields, and had a significant impact on the amount of irrigation, drainage and leakage, while the nitrogen application level and water–fertilizer interaction had no significant impact on the water balance elements. From 2019 to 2021, the amount of irrigation under intermittent irrigation mode was less than that under flooding irrigation, and the difference reached a significant level. The amount of leakage under intermittent irrigation was less than that under flooding irrigation in 2020 and 2021, and the difference reached a significant level. In 2019, due to untimely irrigation at the late tillering stage, the field water depth was low under flooding irrigation, and the difference was not significant. The amount of drainage of intermittent irrigation was less than that of flooding irrigation, and the difference reached a significant level in 2019 and 2020. However, because the field water layer exceeded the upper limit of the water layer after rainfall in 2021, the displacement and drainage times are less, so the difference in drainage in the paddy fields was insignificant.
According to the three-year experiment, compared with the flooding irrigation mode, the amount of field irrigation, drainage and seepage reduced by 25.98%, 16.03% and 8.43%, respectively, under the intermittent irrigation mode. The intermittent irrigation mode could reduce irrigation and drainage volumes by precision control of the water depth in paddy fields. Meanwhile, the intermittent irrigation mode could enhance the field water storage capacity and reduce leakage effectively. The result was consistent with the conclusion of Mao [14]. It was most beneficial to use intermittent irrigation W1 in paddy fields, and the level of nitrogen application had little effect on water balance elements. Therefore, the optimal water and fertilizer regulation mode was W1N1.

3.2. Nitrogen Balance Process in Paddy Field

3.2.1. Nitrogen Wet Deposition

According to the measured rainfall nitrogen concentration and rainfall, the average nitrogen load for wet deposition during the three-year rice season was 6.31 kg/ha, 8.23 kg/ha and 6.27 kg/ha, respectively. The total nitrogen (TN), nitrate nitrogen and ammonia nitrogen from wet deposition all showed a decreasing trend with the increase in rainfall. The reason was that the raindrops in light rain were smaller and the surface area in contact with the atmosphere was larger than that in moderate rain and heavy rain. Therefore, it could adhere and dissolve more aerosols of nitrogen-containing substances [15], thereby increasing the nitrogen concentration. The nitrogen of wet deposition in the rice season was dominated by reduced NH4+, accounting for 45.8–47.1% [16]. The total nitrogen (TN) flux of wet deposition had a significant linear positive correlation with rainfall (r2 = 0.8858) in the rice season, which was consistent with the conclusions of Zhou et al. [17] and Chen et al. [18].

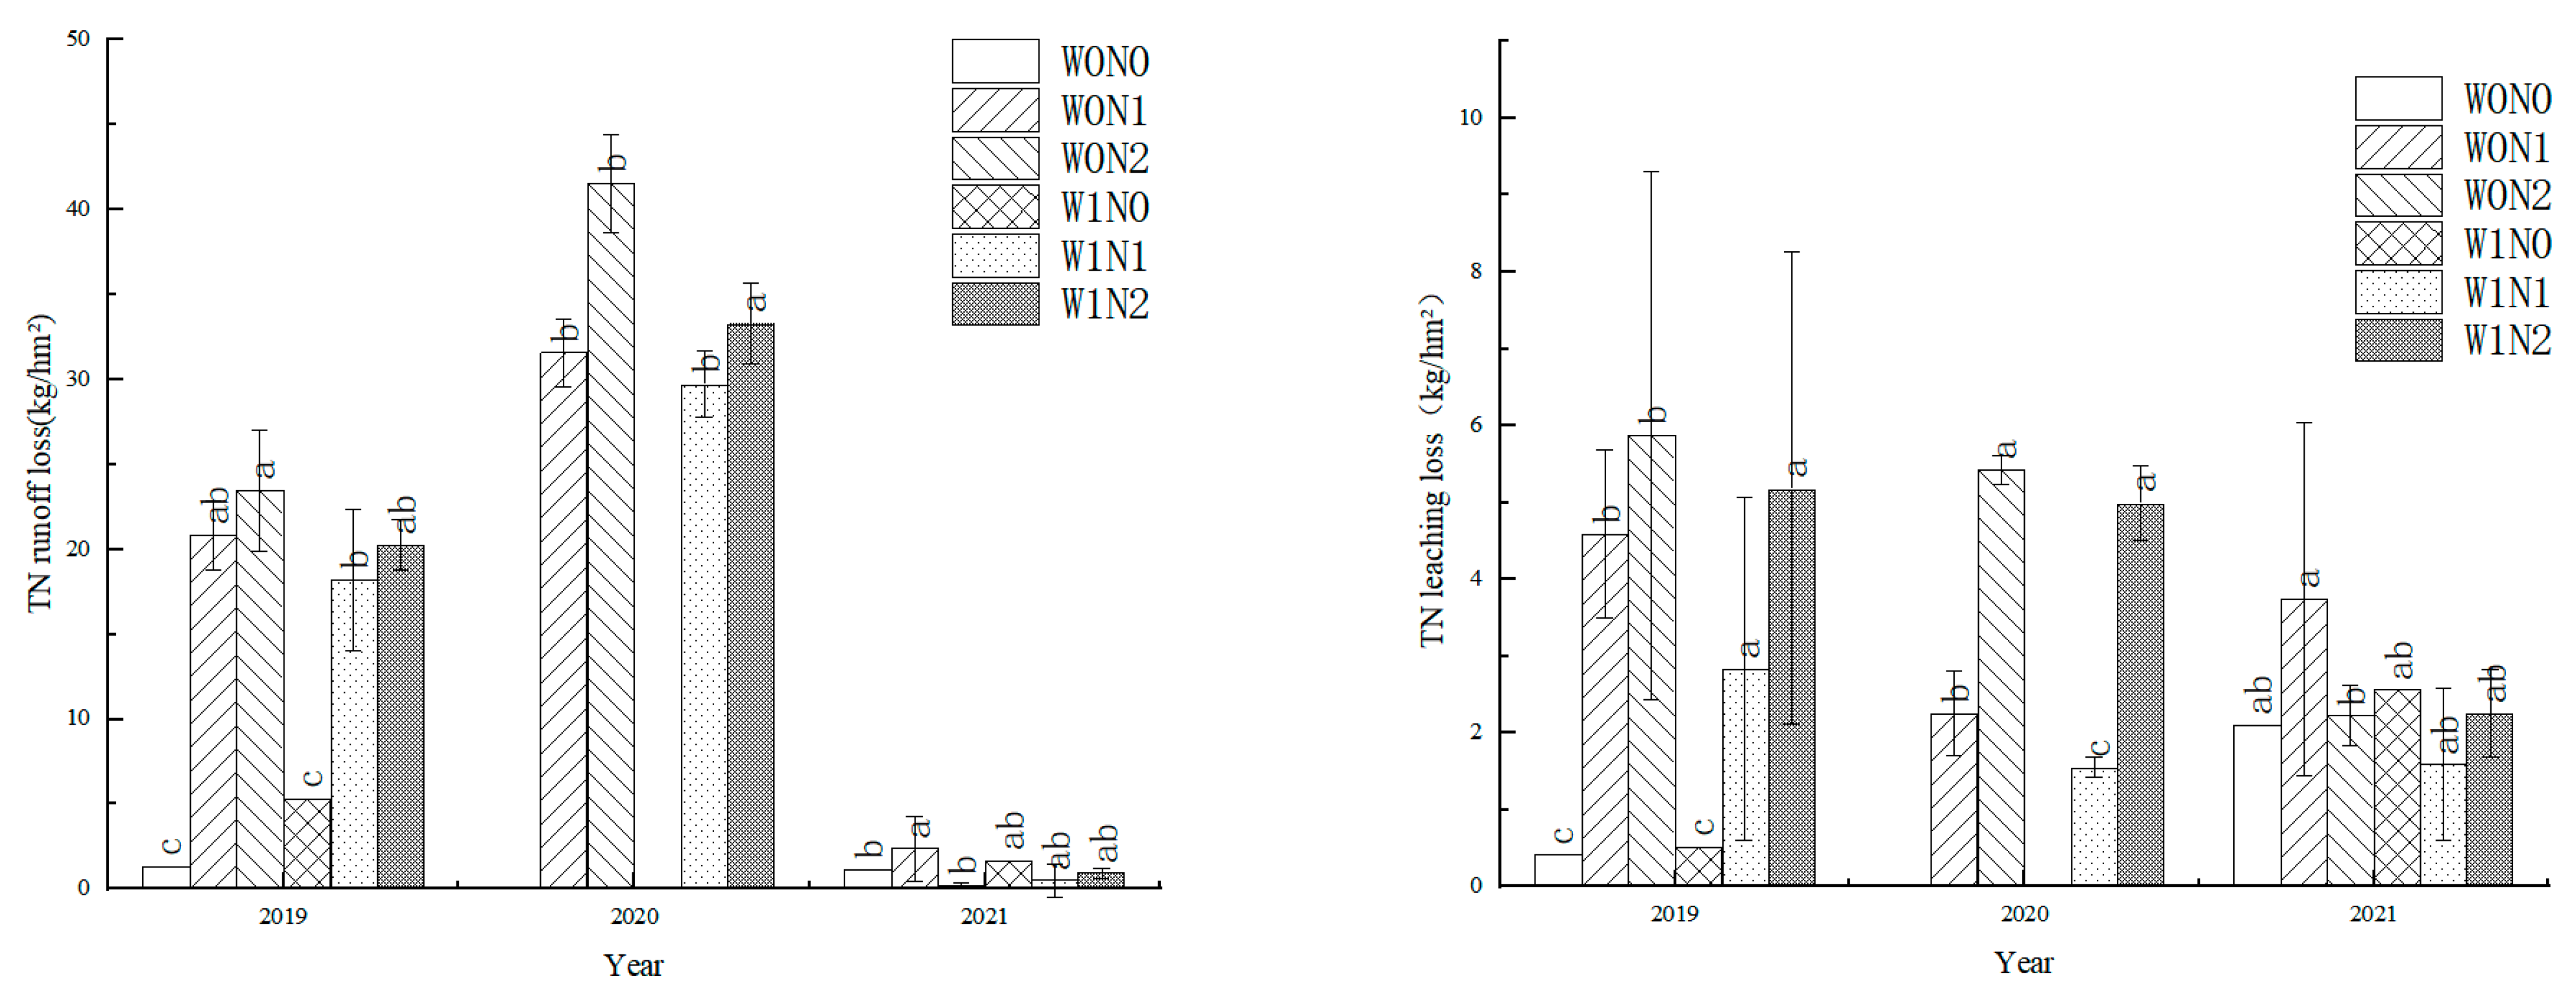
3.2.2. Nitrogen Loss in Surface Water and Seepage Water

The nitrogen loads from surface drainage and seepage under different treatments were calculated using Formula (2), as shown in Figure 1. The average nitrogen loss from surface drainage of rice paddies under different treatments in the rice season from 2019 to 2021 were 14.89 kg/ha, 34.04 kg/ha and 1.12 kg/ha, respectively. The stage at which the amount of nitrogen loss from field surface water and seepage water in the 20 cm soil layer was greatest was the return green stage, when basal fertilizer was applied, and the early tillering stage, when tillering fertilizer was applied, followed by the joining and booting stage after joining fertilizer application. The average loads of surface nitrogen loss in these three periods were 12.5 kg/ha, 3.10 kg/ha and 1.02 kg/ha, accounting for 75.2%, 18.6% and 6.1% of total surface nitrogen loss during the growth period, and the average load from seepage water at the 20 cm soil layer were 1.87 kg/ha, 1.05 kg/ha and 0.15 kg/ha, respectively, accounting for 61.0%, 34.1% and 4.9% of the total leakage loss during the growth period. The reason for the large loss of nitrogen was that these periods were those at which fertilization increased the concentration of surface water and seepage water, and which were in the rainy period. Therefore, it led to more drainage and increased nitrogen loss in the field. The nitrogen loss of field surface water and seepage water at 20 cm soil layer in different periods was mainly ammonium nitrogen, and the average proportions were 82.75%, 76.95% and 50.75% within seven days after applying basal fertilizer, tiller fertilizer and panicle fertilizer, respectively, which was the most dominant form of nitrogen from filed drainage at the initial period after fertilization [19].
Both the irrigation mode and fertilization level affected the nitrogen load from drainage of paddy fields, and the irrigation mode had a significant impact on the nitrogen load of seepage water in 2019–2020 and the nitrogen load of surface water in 2020. The impact of fertilization level on the nitrogen load from surface and seepage water in 2019 and 2020 and the nitrogen load from seepage water in 2021 reached a very significant level. As the surface drainage during the rice season in 2021 was only four times and the amount of drainage was less, all of which were between 50 and 90 mm, it could be seen that the difference of the drainage was not significant from Table 1, so the nitrogen load of surface drainage was not significant.
Compared with flooding irrigation, the total nitrogen (TN) loss of surface and leaching loss decreased by 4.06–17.66% and 14.73–21.53%, respectively, under intermittent irrigation in rice fields, and the average rate of pollution control was 11.82% and 18.91%, respectively. The reason was that the intermittent irrigation mode could reduce the drainage and leakage greatly, which were the main factors affecting the total nitrogen loss in the field. Shao et al. [20] and Peng et al. [21] had confirmed the same conclusions.
It can be seen that compared with flooding irrigation, the nitrogen load of the surface and leakage could be reduced under intermittent irrigation, thereby reducing the nitrogen loss in the field. The surface and percolation nitrogen discharge loads were reduced by an average of 13.74% and 36.16%, respectively, under nitrogen-reduced fertilization (N1, 135 kg/ha) compared to the conventional fertilization mode (N2, 180 kg/ha). At different levels of nitrogen application, the TN emission load increased significantly with the nitrogen application rate [22]. The reason for this was that the average TN concentration of surface and seepage water were significantly increased by the application of nitrogen.
Treatments for surface drainage and leaching during the rice season with the largest and smallest nitrogen losses were W0N2 and W1N1, respectively. Compared to the traditional W0N2 mode, the nitrogen loss from surface drainage and leaching was reduced by 5.57 kg/ha and 2.51 kg/ha, respectively, and the total nitrogen load was controlled by 25.67% and 55.78%, respectively, under the W1N1 treatment of W1N1.

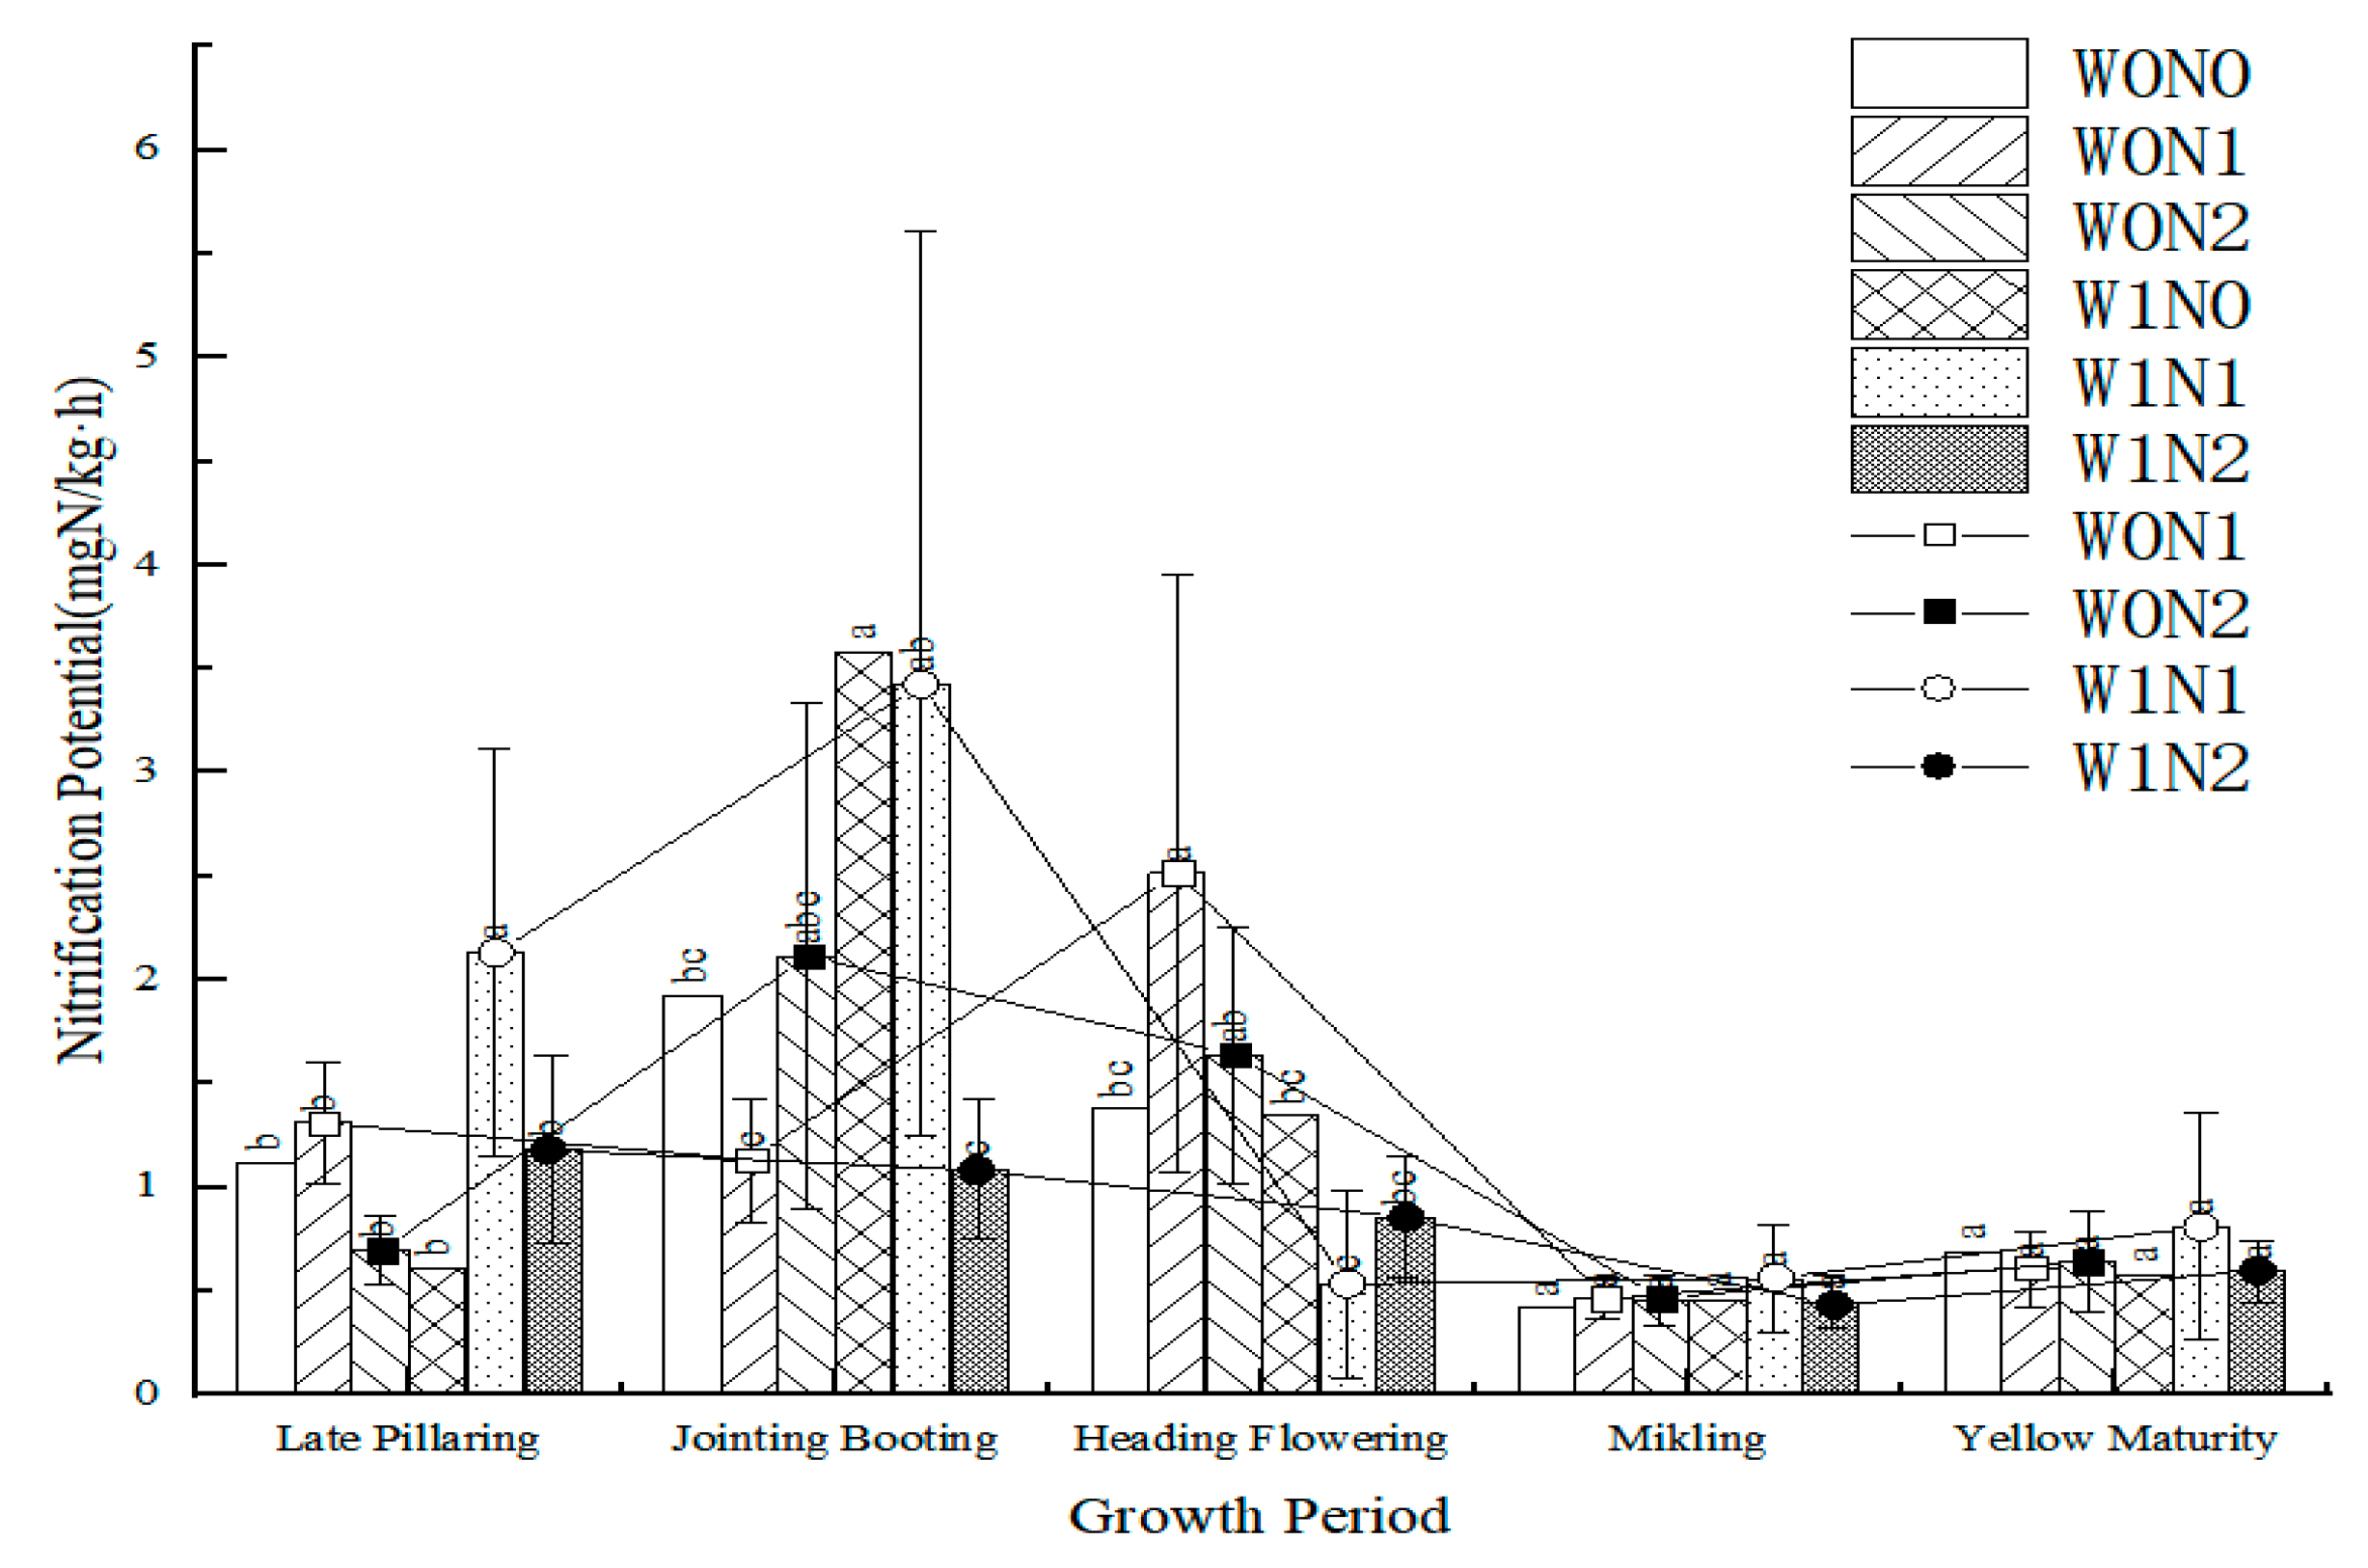
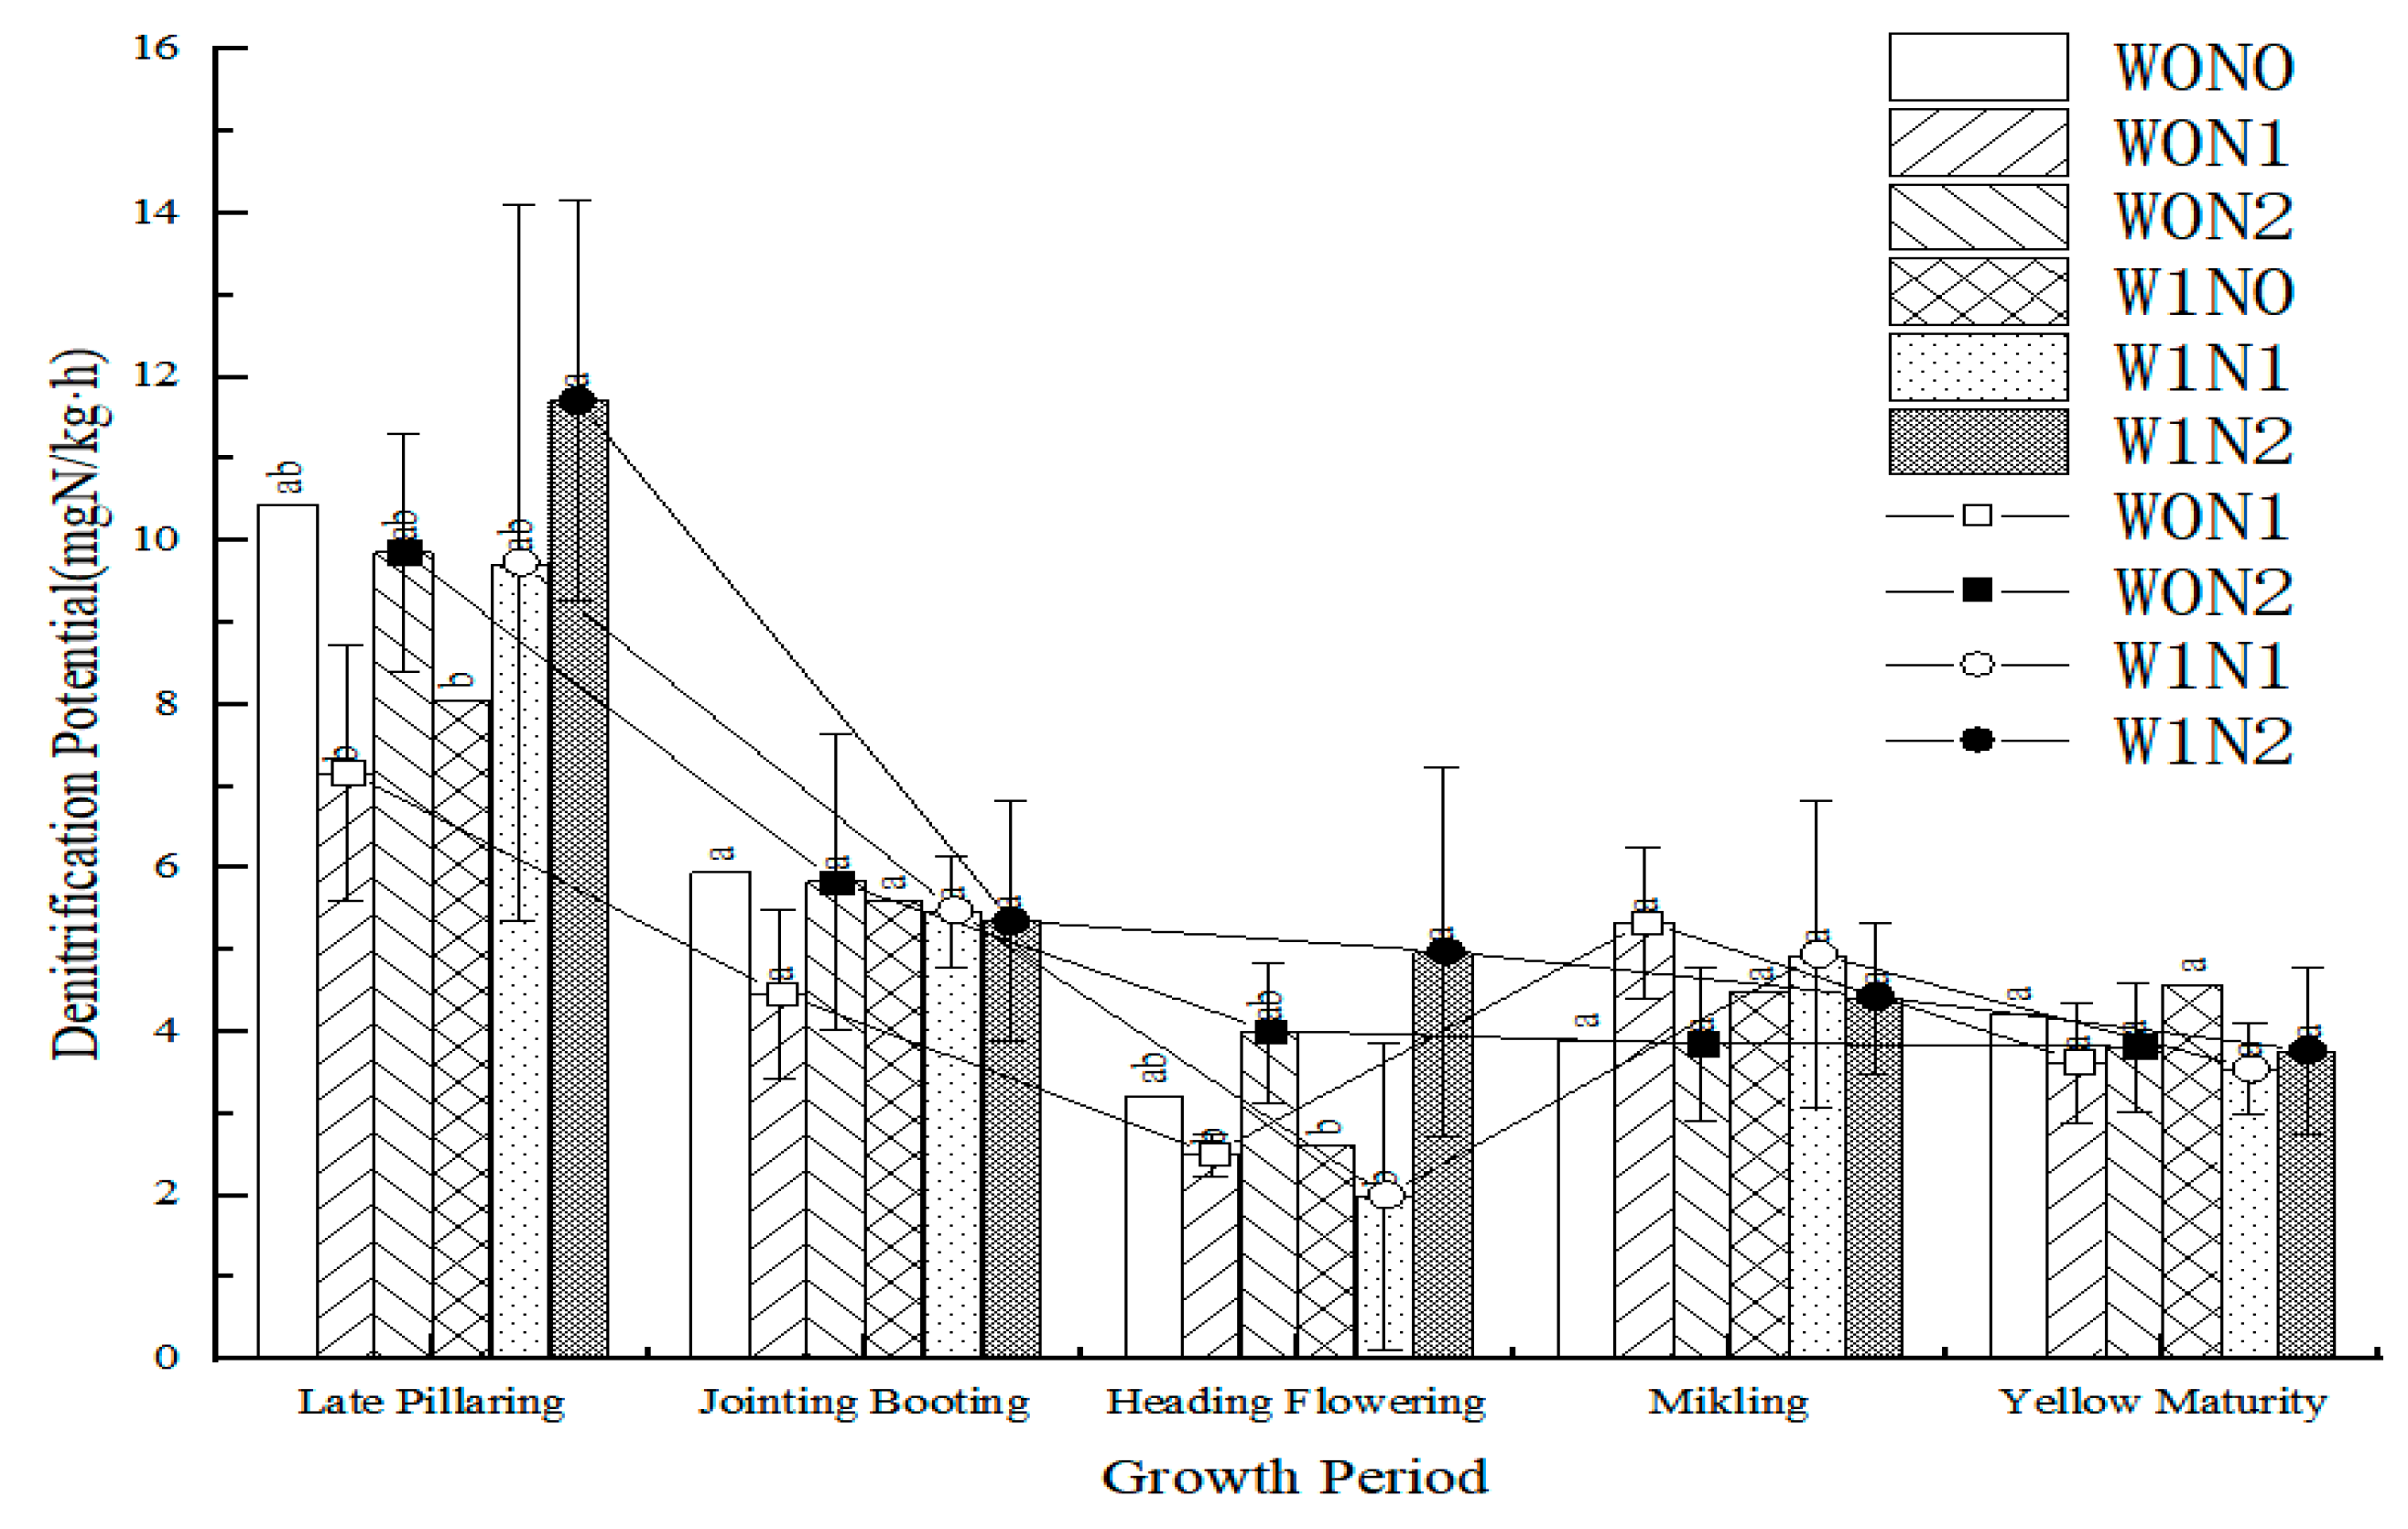
3.2.3. Denitrification Process in Paddy Field

The nitrification potential and denitrification potential under different treatments in 2021 were shown in Figure 2 and Figure 3. The denitrification potential was higher than the nitrification potential in the rice season from Figure 2 and Figure 3, indicating that denitrification was the main action. The denitrification potential decreased first and then increased in the rice season, and reached the maximum in the late tillering stage. However, the nitrification potential increased first and then decreased, and reached a maximum at the jointing and booting stage. The denitrification potential was highest under N2 treatment and lowest under N1 treatment during the late tilling stage in 2020 and 2021. However, the influence of irrigation mode on the nitrification potential and denitrification potential was different. There were significant differences in the nitrification potential among different irrigation methods at the late tillering stage, joining and booting stage and heading and flowering stage; however, there were no significant differences in the denitrification potential. The nitrification potential under flooding irrigation was higher than that under intermittent irrigation at the late tillering stage and jointing and booting stage, and lower than that at the heading and flowering stage. At other stages, there was no significant difference in the nitrification potential between the different irrigation methods.
Compared with intermittent irrigation, the denitrification potential under flooding irrigation was higher, indicating that soil moisture conditions could affect denitrification intensity [23]. The increasing of soil water content would improve the mineralization rate and utilization rate of soil nutrient elements, and increase the activity of denitrifying microbes and the oxygen consumption, which made it easier to form an anaerobic environment and thereby improved the denitrification rate [24]. The intermittent irrigation could reduce denitrification loss by improving soil aeration, increasing dissolved oxygen in soil and inhibiting the activity of the N2O enzyme [25,26,27].
Under the same irrigation mode, there was no significant difference in the denitrification potential between fertilization treatment (N1, 135 kg/ha; N2, 180 kg/ha) and no-fertilization treatment (N0, 0 kg/ha), but there were significant differences in the nitrification potential of N1 and nitrification potential of N0 and N2 at the late tillering stage, jointing and booting stage, and heading and flowering stage. The denitrification potential under the nitrogen reduction treatment was lower than that under the conventional nitrogen application. Studies have shown that the concentration of NO3 in soil was an essential substrate and an important limiting factor for denitrification, and there was a significant positive correlation between the denitrification rate and the concentration of NO3 from soil substrate [27]. Thus, reducing the use of nitrogen fertilizer could reduce the denitrification potential to some extent [28]. Compared with the conventional mode of W0N2, the mode of W1N1 could reduce the denitrification potential by 6.12% and increase the nitrification potential by 34.55% on average.

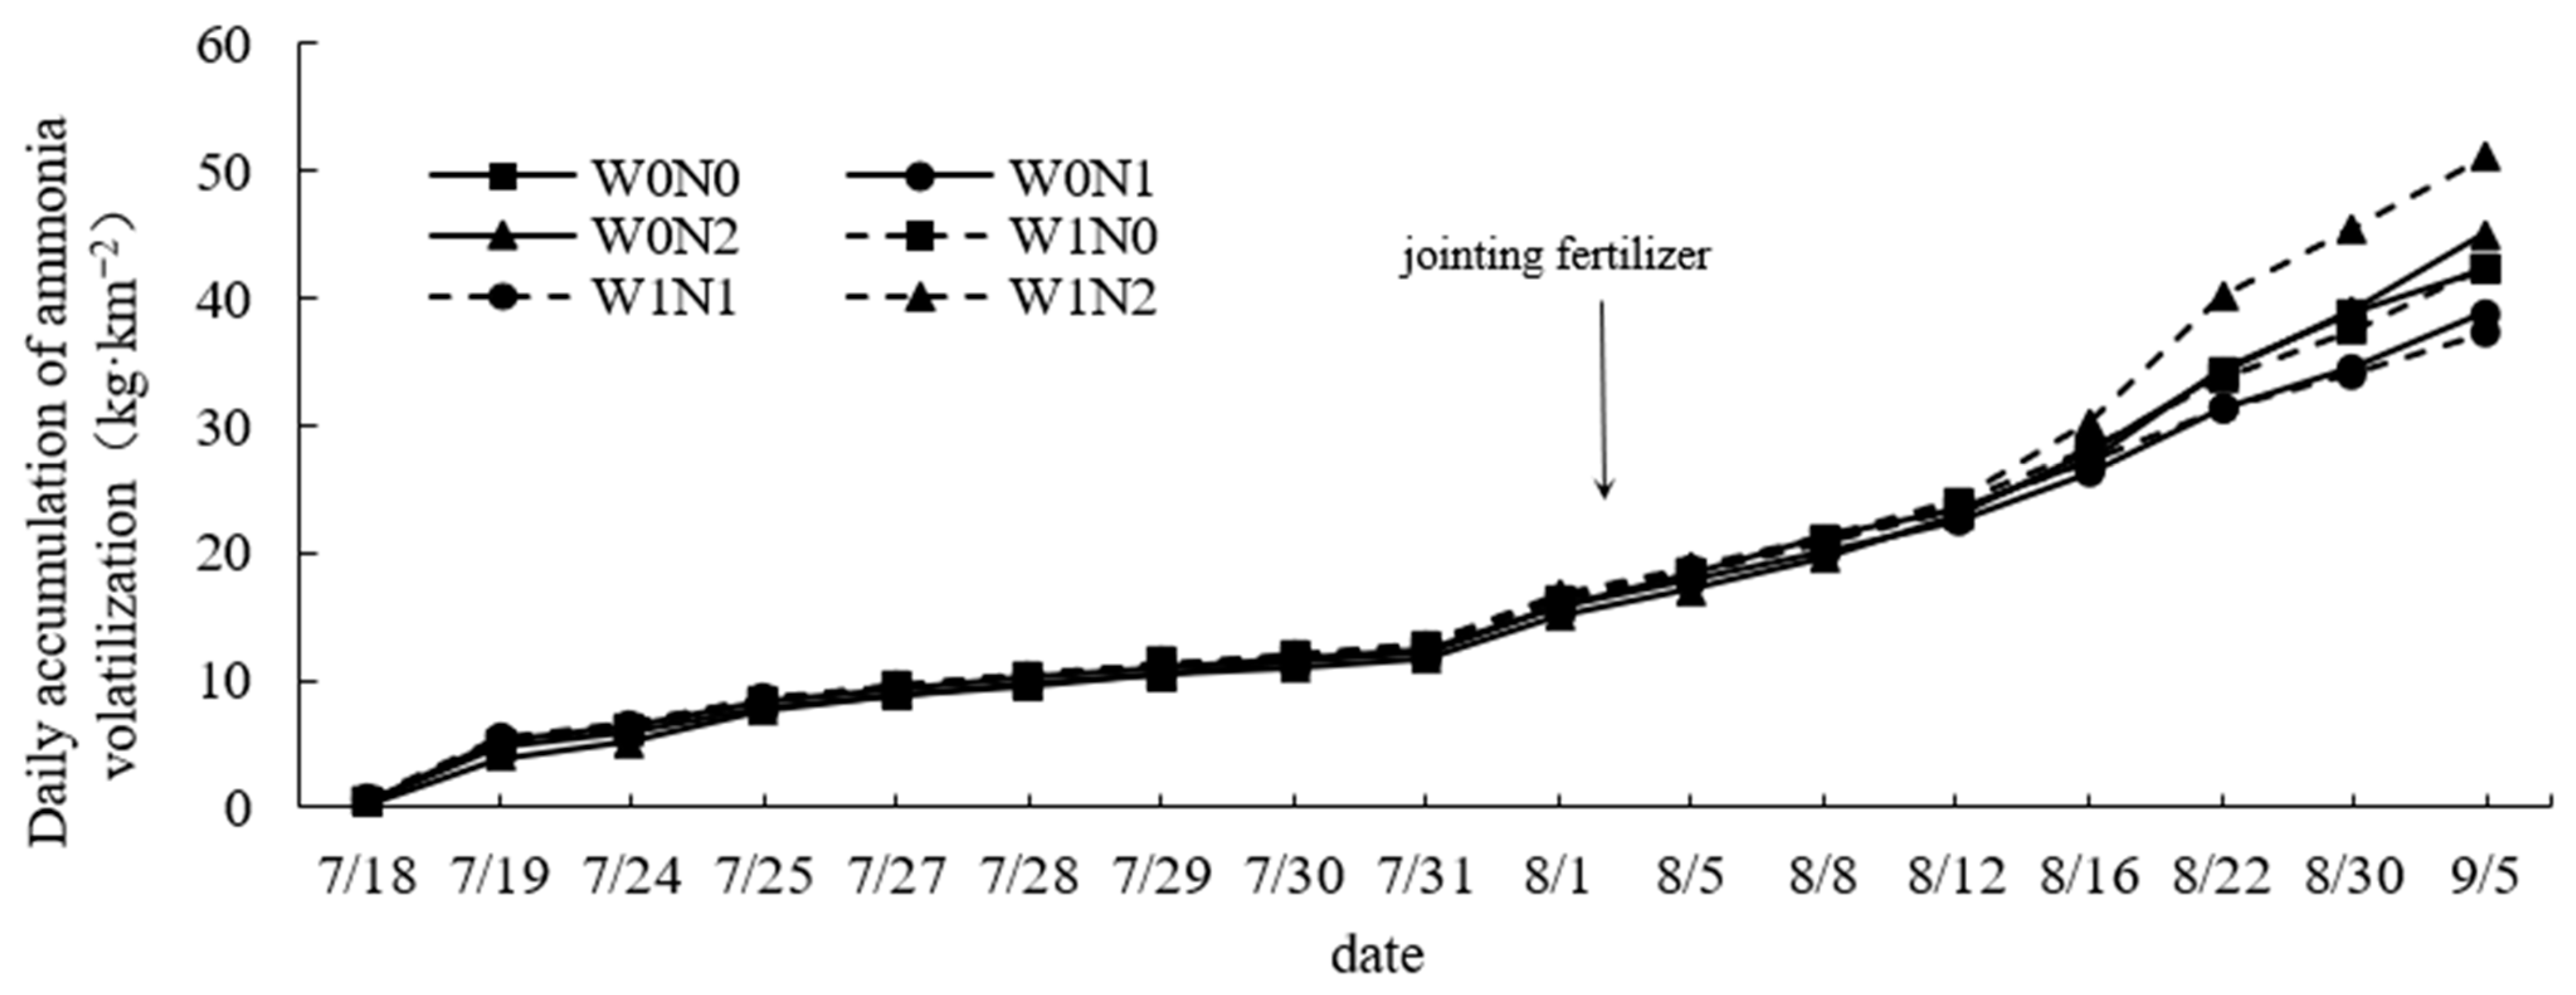
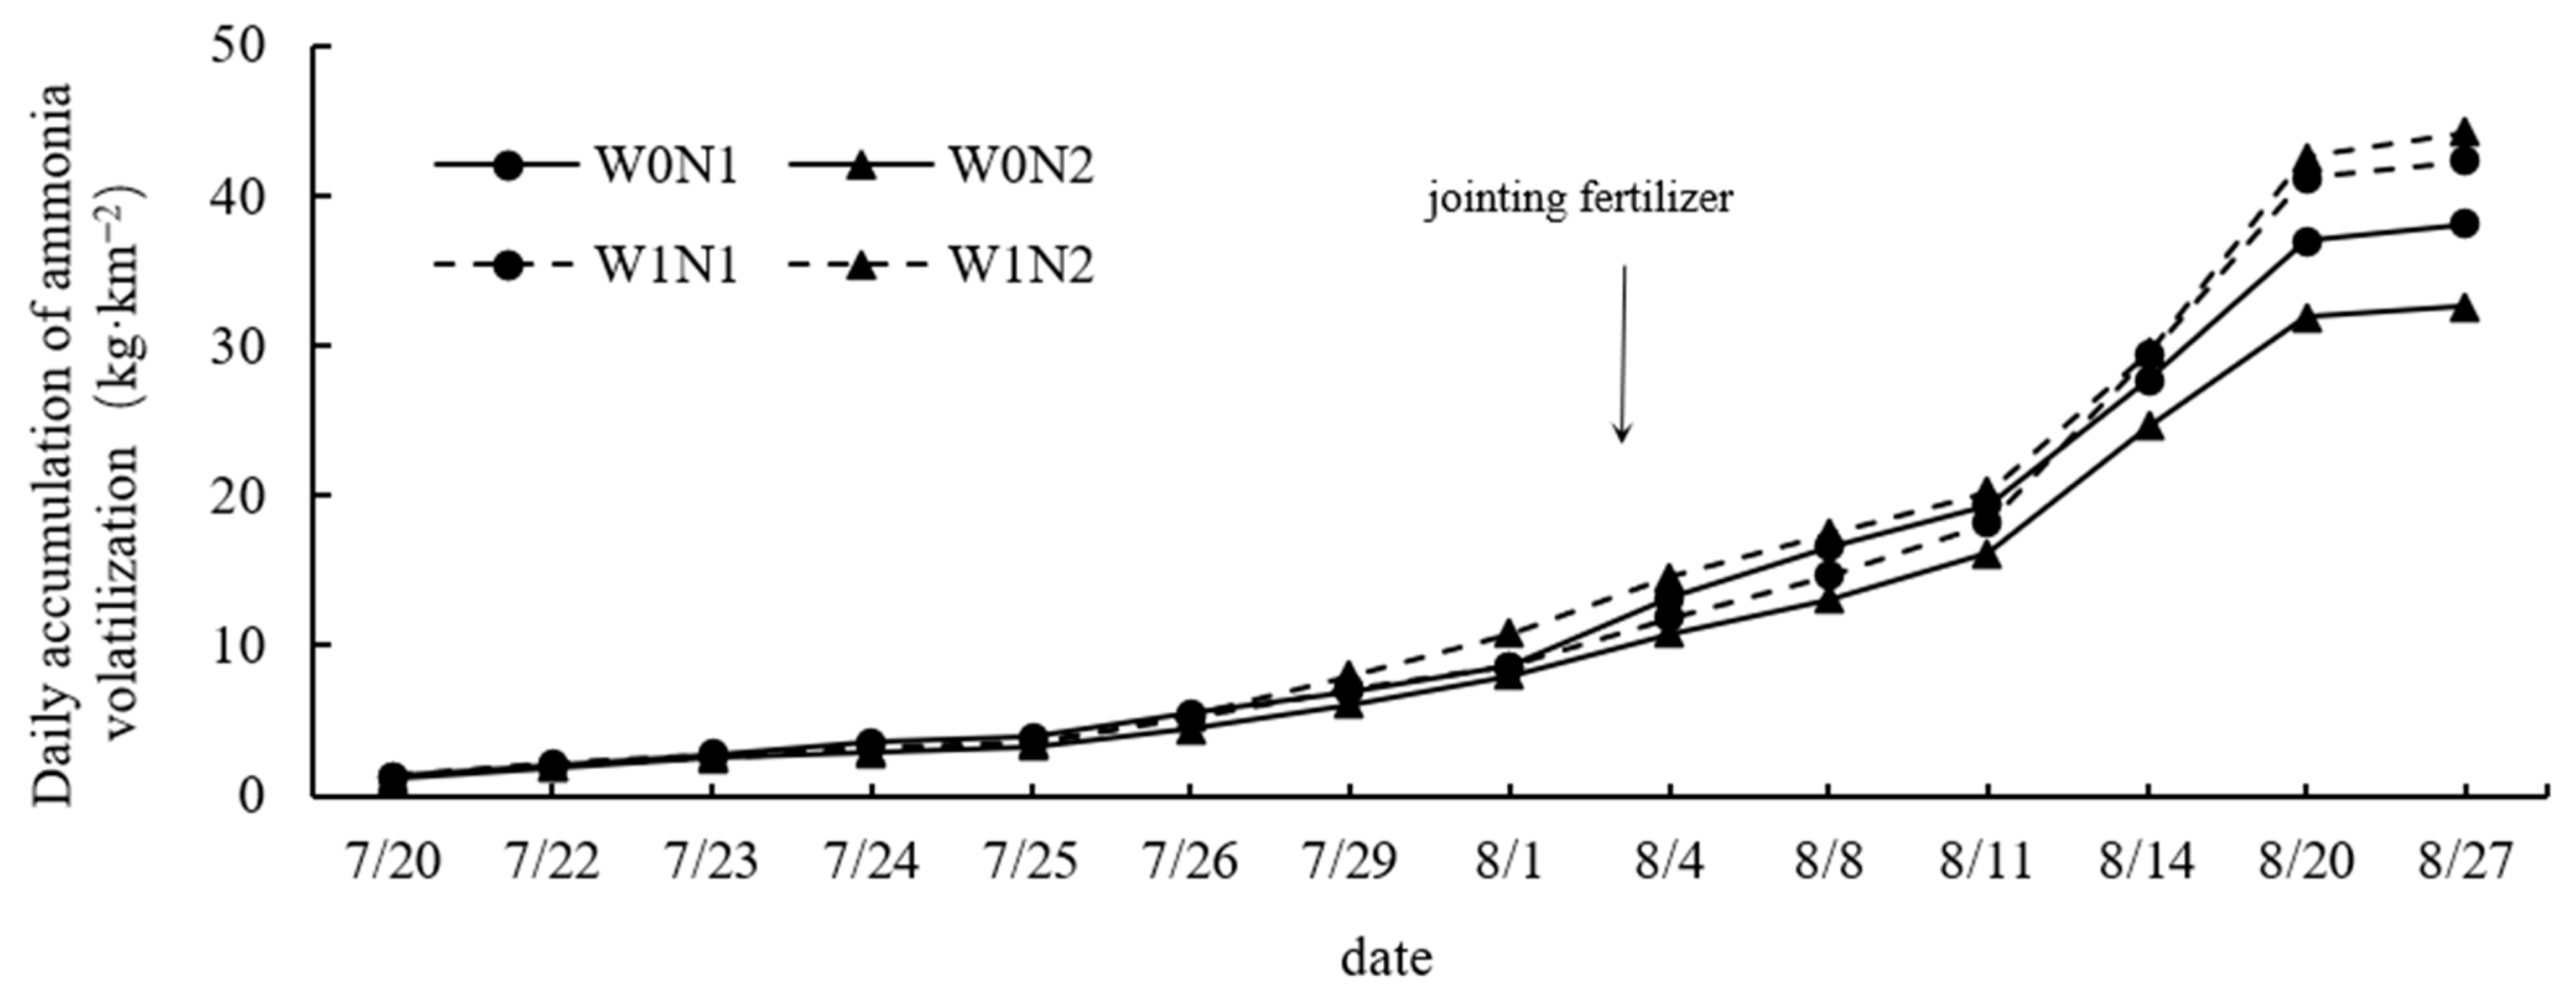
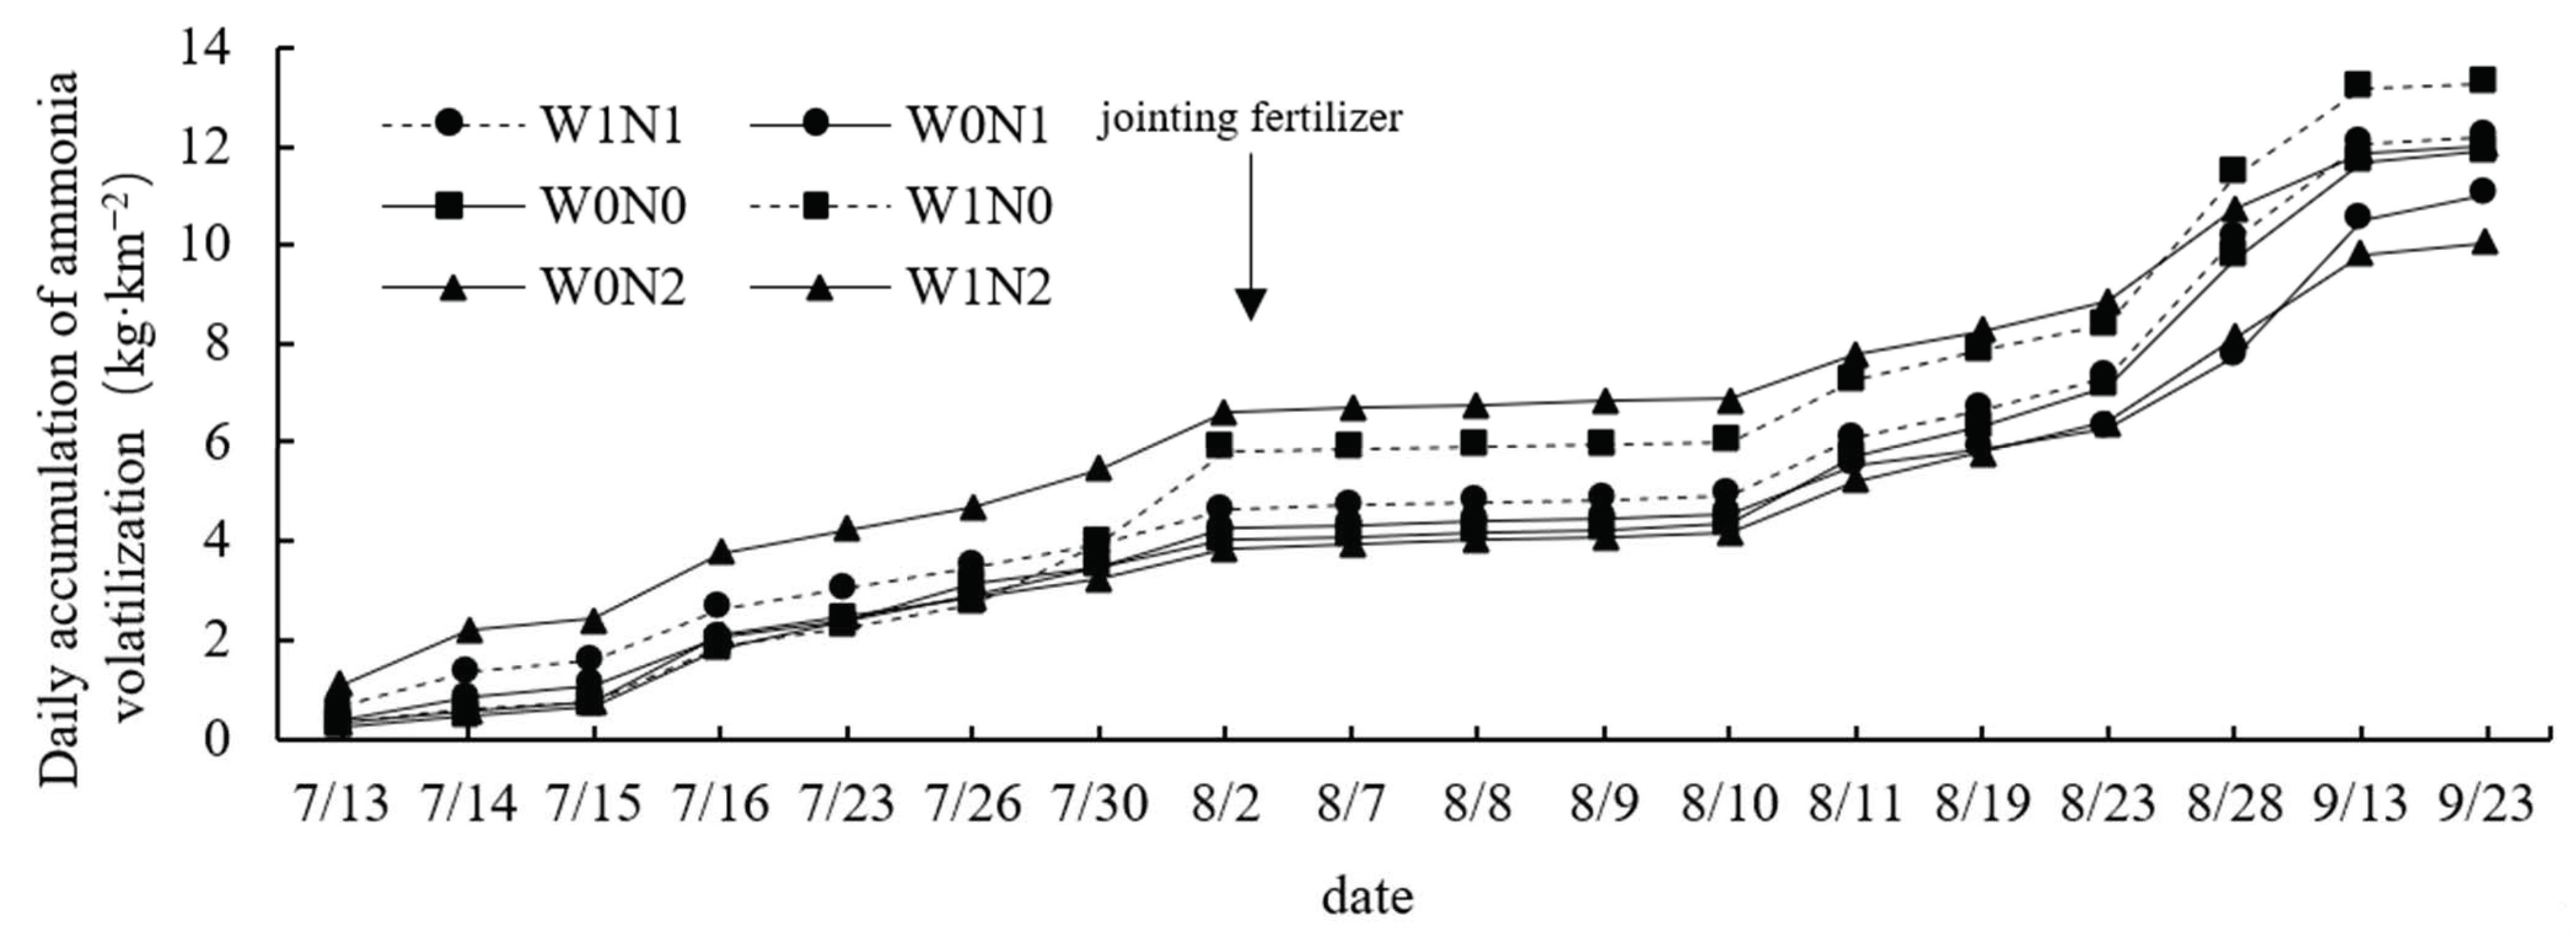
3.2.4. Variations in Ammonia Volatilization in Paddy Field

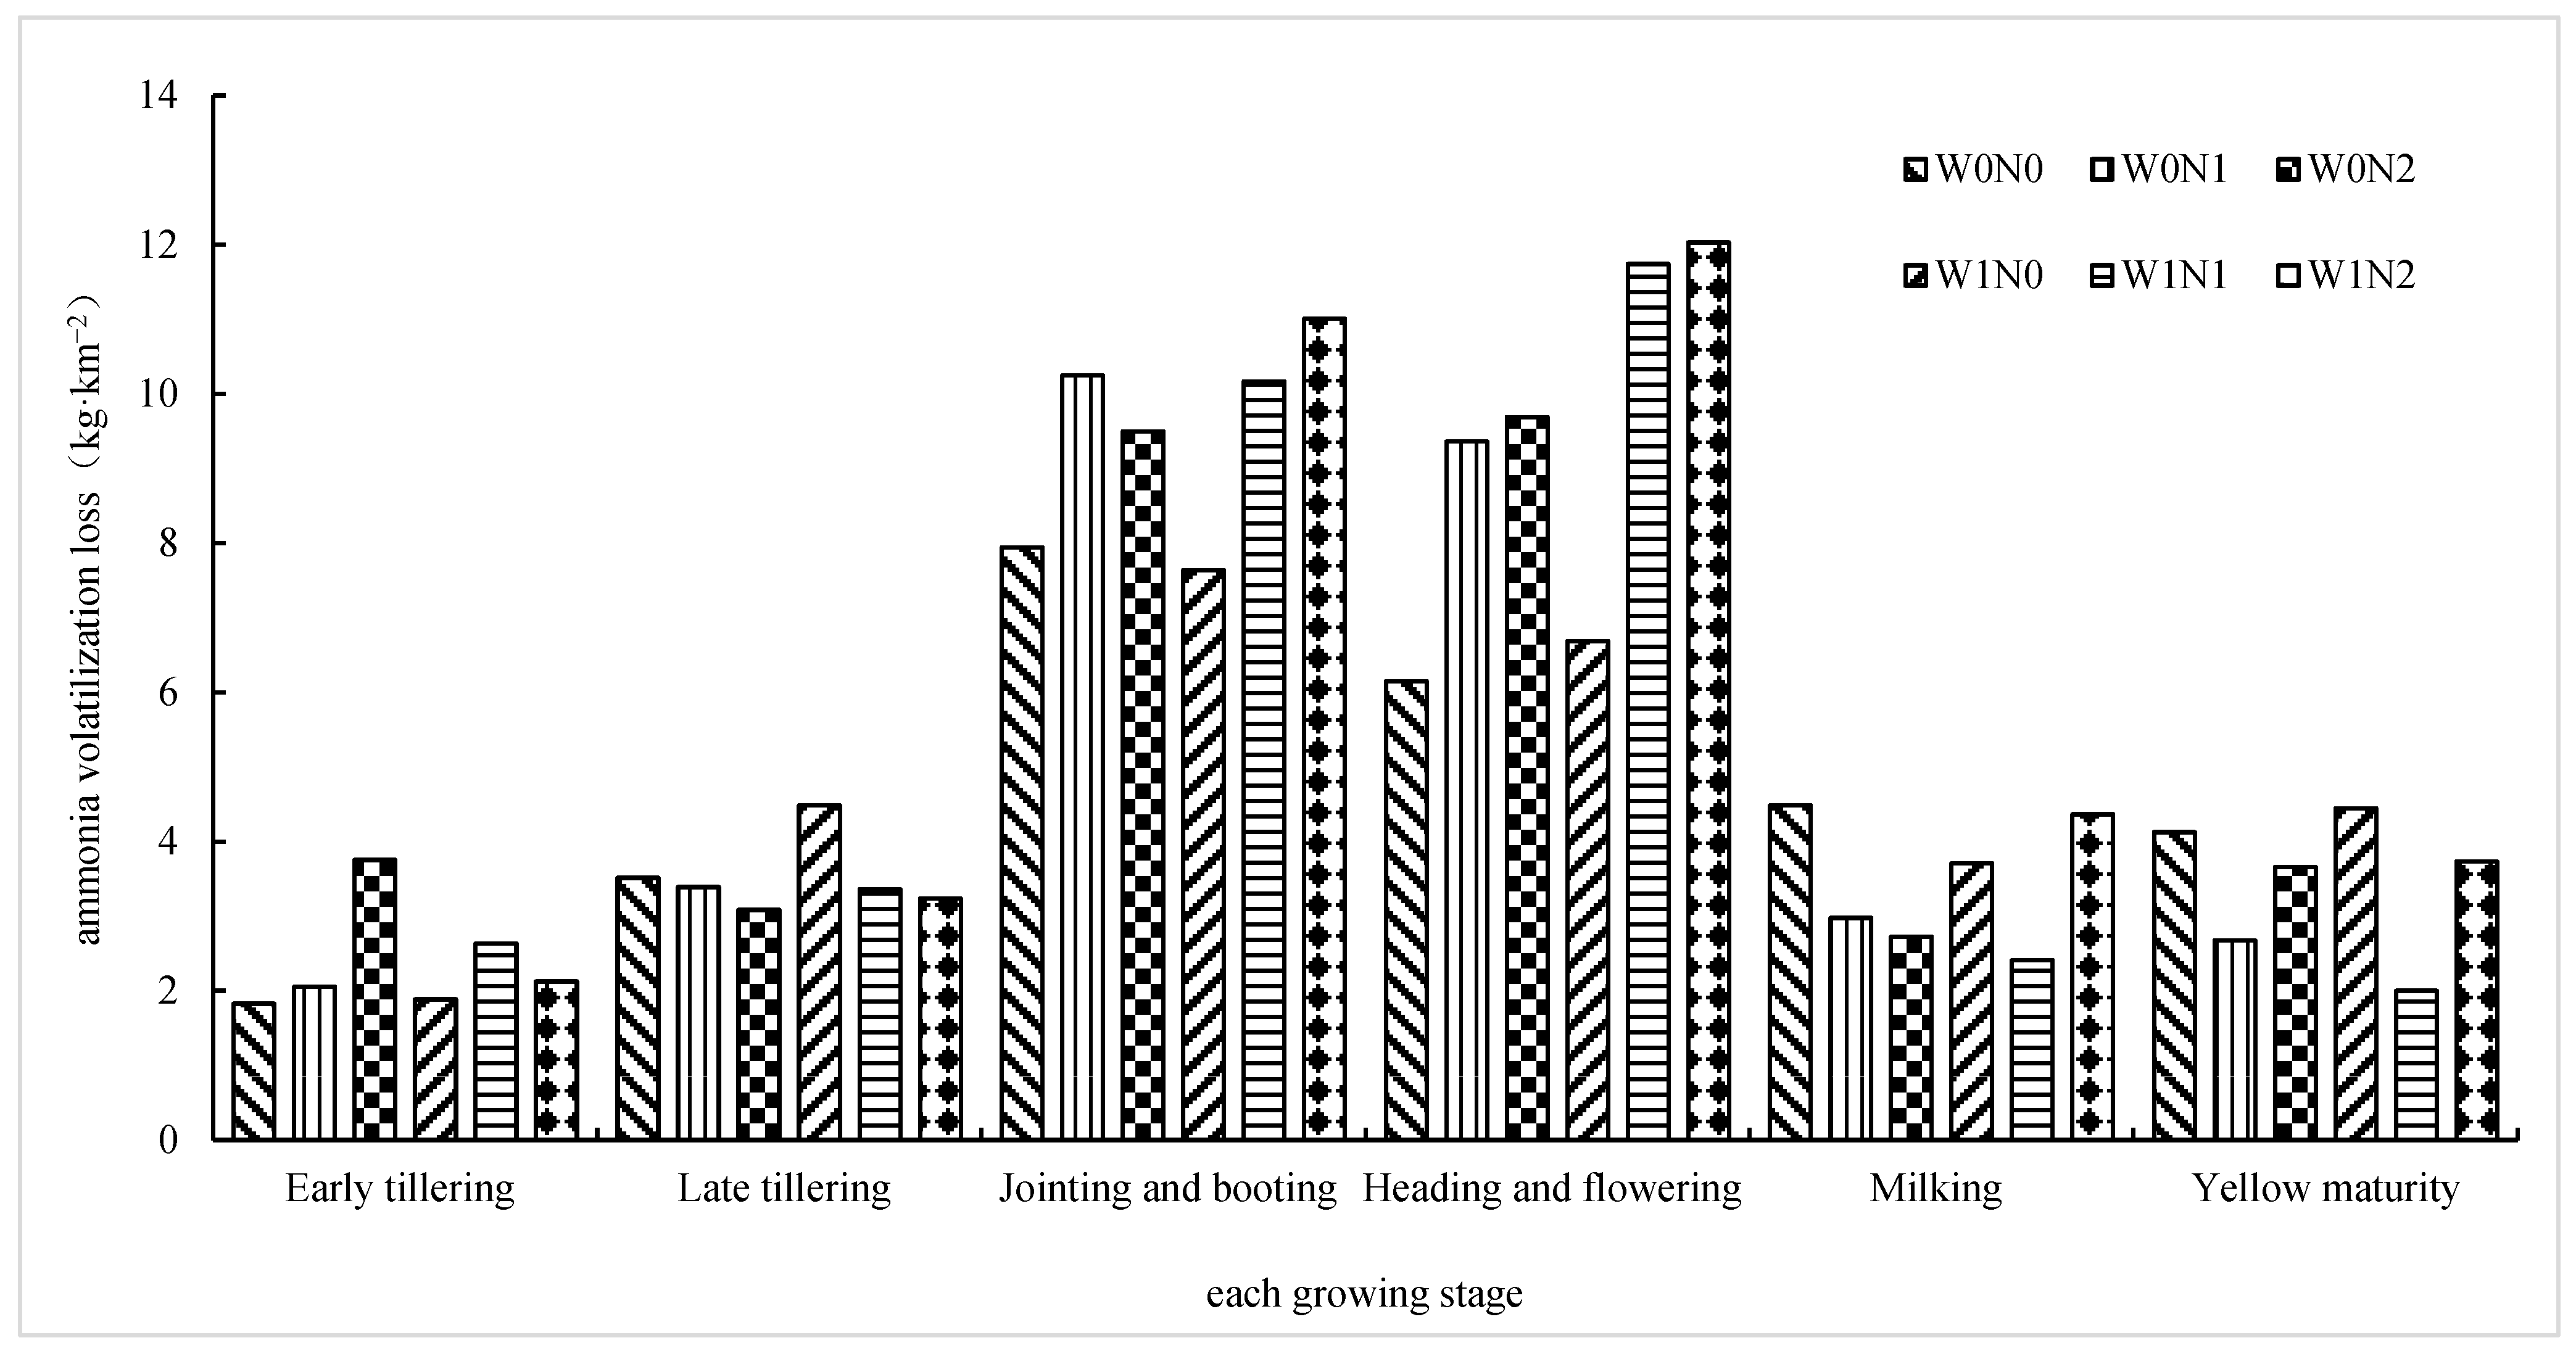
Changes in Ammonia Volatilization Rate at Different Growth Stages

The variation in the ammonia volatilization rate in three years is shown in Figure 4, Figure 5 and Figure 6. The variation in the ammonia volatilization rate in three years was slightly different at the tillering stage, and the variation at the other growth stages were broadly similar, which showed that the ammonia volatilization rate decreased at the jointing and booting stage and heading and flowering stage, increased at the milk ripening stage, then decreased at the yellow ripening stage. The ammonia volatility rate in paddy fields increased first and then decreased at the tillering stage in 2019 and 2020. However, the ammonia volatilization rate in 2021 showed a fluctuating trend of increasing–decreasing–increasing. Due to the application of base fertilizer and tillering fertilizer, the hydrolysis of urea accelerated and ammonia nitrogen concentration from the surface water rose rapidly, which led to the increase in the ammonia volatilization rate, then gradually decrease at the tillering stage [29]. Wang et al. [30] showed that the ammonia volatilization rate increased rapidly and reached the peak after applying base fertilizer, which was consistent with the change in the concentration of ammonium nitrogen from surface water. The ammonia volatilization rate continued to rise within 1–2 days after fertilization, which was consistent with the conclusion of that paper [30]. Ammonia volatilization continued at a high rate for some time and then gradually decreased. The reason was that most of the dissolved nitrogen in the water was absorbed and utilized by plants, which reduced the concentration of ammonia nitrogen from the surface water and slowed down the ammonia volatility. The ammonia volatilization rate showed a fluctuating trend of increasing–decreasing–increasing in 2021, which was mainly because the weather was overcast and cloudy for some time before the increase in the ammonia volatilization rate. The sunshine duration was only about 1 h/d, the light intensity was small, and the temperature was low, while the sunshine duration was about 7 h/d when the ammonia volatilization rate increased. It aggravated the evaporation of field water and promoted ammonia volatilization under the action of high temperature and intense light [31].
The ammonia volatilization rate continued to rise in 1~3 days after applying base fertilizer and tillering fertilizer, and was large about 5~7 days after applying panicle fertilizer in 2019 and 2020. However, the ammonia volatilization rate did not increase rapidly; instead, it showed a gradual downward trend within 5–7 days after applying panicle fertilizer in 2021. The ammonia volatilization rate slowly increased after felling to its lowest point on 10 August 2021. The reason was probably that rainfall occurred the day before and after applying joining fertilizer on 4 August, and there were three rainfalls in the seven days from 3 August to 10 August. The ammonia volatilization was inhibited by the concentrated rainfall, so the ammonia volatilization rate decreased continuously and reached the lowest point on 10 August. The fertilizer was brought into the soil with rainfall infiltration, which increased the chance of NH4+ being adsorbed by soil particles or plants and the resistance of ammonia rising to the surface of the soil, thereby inhibited ammonia volatilization [32].
The peak period of the ammonia volatilization rate in the three years was slightly different. The peak period for the ammonia volatilization rate was the joining and booting phase and the heading and flowering phase in 2019 and 2020, while it was the tillering stage in 2021. The nitrogen concentration in the field increased after the application of the panicle fertilizer, and in addition, the temperature was high and the light was intense during the jointing and booting stage as well as the heading and flowering stage in 2019 and 2020. The increase in temperature would significantly enhance the urease activity in the soil. Then, the urea applied to the paddy field would accelerate the hydrolysis to form ammonium nitrogen by the action of urease, thereby promoting the accelerated conversion of NH4+ ions to NH3 in surface water, which aggravated the ammonia volatilization in paddy fields [33]. The peak of ammonia volatilization rate appeared at the tillering stage in 2021; this was because the wind speed at the tillering stage was significantly different from those in 2019 and 2020. Average daily wind speeds were only about 1.5 m/s in 2019 and 2020, while they reached 4 m/s in 2021. When the wind speed was higher, the ammonia diffusion was faster. And the high wind speed could decrease the concentration of ammonia above the paddy field and promote the continuous volatilization of ammonia, which led to the increase in ammonia volatilization loss [34].

Changes in Ammonia Volatilization at Different Growth Stages

The ammonia volatilization loss at different growth stages of middle rice was obtained using statistical analysis, as shown in Figure 7. There were some differences in ammonia volatilization loss under the different water and fertilizer treatments shown in Figure 7. The maximum ammonia volatilization loss of middle rice was at the jointing and booting stage and heading and flowering stage in 2019 and 2020. The ammonia volatilization at two stages accounted for 48.72% to 91.19% of the ammonia volatilization at the whole growth period. In 2021, the ammonia volatilization loss of middle rice at the tillering, jointing and booting, heading and flowering stages accounted for an average proportion of 81.77% of the total ammonia volatilization loss at the whole growth period. Thus, it could be seen that the tillering stage, jointing and booting stage, and heading and flowering stage were the main periods of ammonia volatilization loss in middle rice. Li et al. [35] showed that the concentration of ammonium nitrogen in field soil at the tillering stage, jointing and booting stage, and heading and flowering stage was higher than that at the mature stage. The ammonia volatilization emission flux in the paddy field was significantly positively correlated with the concentration of ammonium nitrogen in surface soil [36], which indicated that the ammonia volatilization loss in the field mainly occurred at the tillering stage, jointing and booting stage, and heading and flowering stage, which was consistent with the conclusion of this paper. Ammonia volatilization losses during the tillering stage were also larger in 2021 compared to the previous two years. On the one hand, the accumulation of ammonia volatilization increased compared to the previous two years due to the higher ammonia volatilization rate influenced by the wind speed at the late tillering stage. On the other hand, the ammonia volatilization loss was increased by the elevated temperature and strong light due to the overlap between the late tillering stage and the elevated temperature stage.
Under the same irrigation mode, the total ammonia volatilization loss of N2 (180 kg/ha) was higher than that of N1 (135 kg/ha), about 4.49% to 37.16%, and was higher than that of N0 (0 kg/ha), about 22.10% to 32.97%. Furthermore the ammonia volatilization loss of N1 was higher than that of N0, about 14.25% to 15.49%. This indicated that increasing nitrogen fertilizer would increase the amount of ammonia volatilization loss. Wang et al. [30] showed that nitrogen application significantly affected ammonia volatilization loss, and ammonia volatilization loss increased with the increase in nitrogen application, which was consistent with the conclusions of this study.
Under the same nitrogen application level, the total ammonia volatilization loss of the paddy field of the W1 (intermittent irrigation) mode was higher than that of W0 (flooding irrigation), about 2.80% to 10.75%. This showed that the intermittent irrigation would increase the ammonia volatilization loss compared with the flooding irrigation, which is consistent with the research conclusion of Yu et al. [37]. On the one hand, the loss of ammonia volatilization under the intermittent irrigation was higher than that under flooding irrigation because of less water and a higher substrate concentration [6]. On the other hand, due to the alternation of dry and wet in the field under intermittent irrigation conditions, the field cracks developed steadily, the soil structure was better, and the soil porosity was improved, thereby improving the water permeability of the soil and promoting ammonia volatilization [38].
The combination of flooding irrigation and reduced nitrogen application (W0N1) was the optimal water and fertilizer regulation mode from the perspective of reducing nitrogen gas loss.

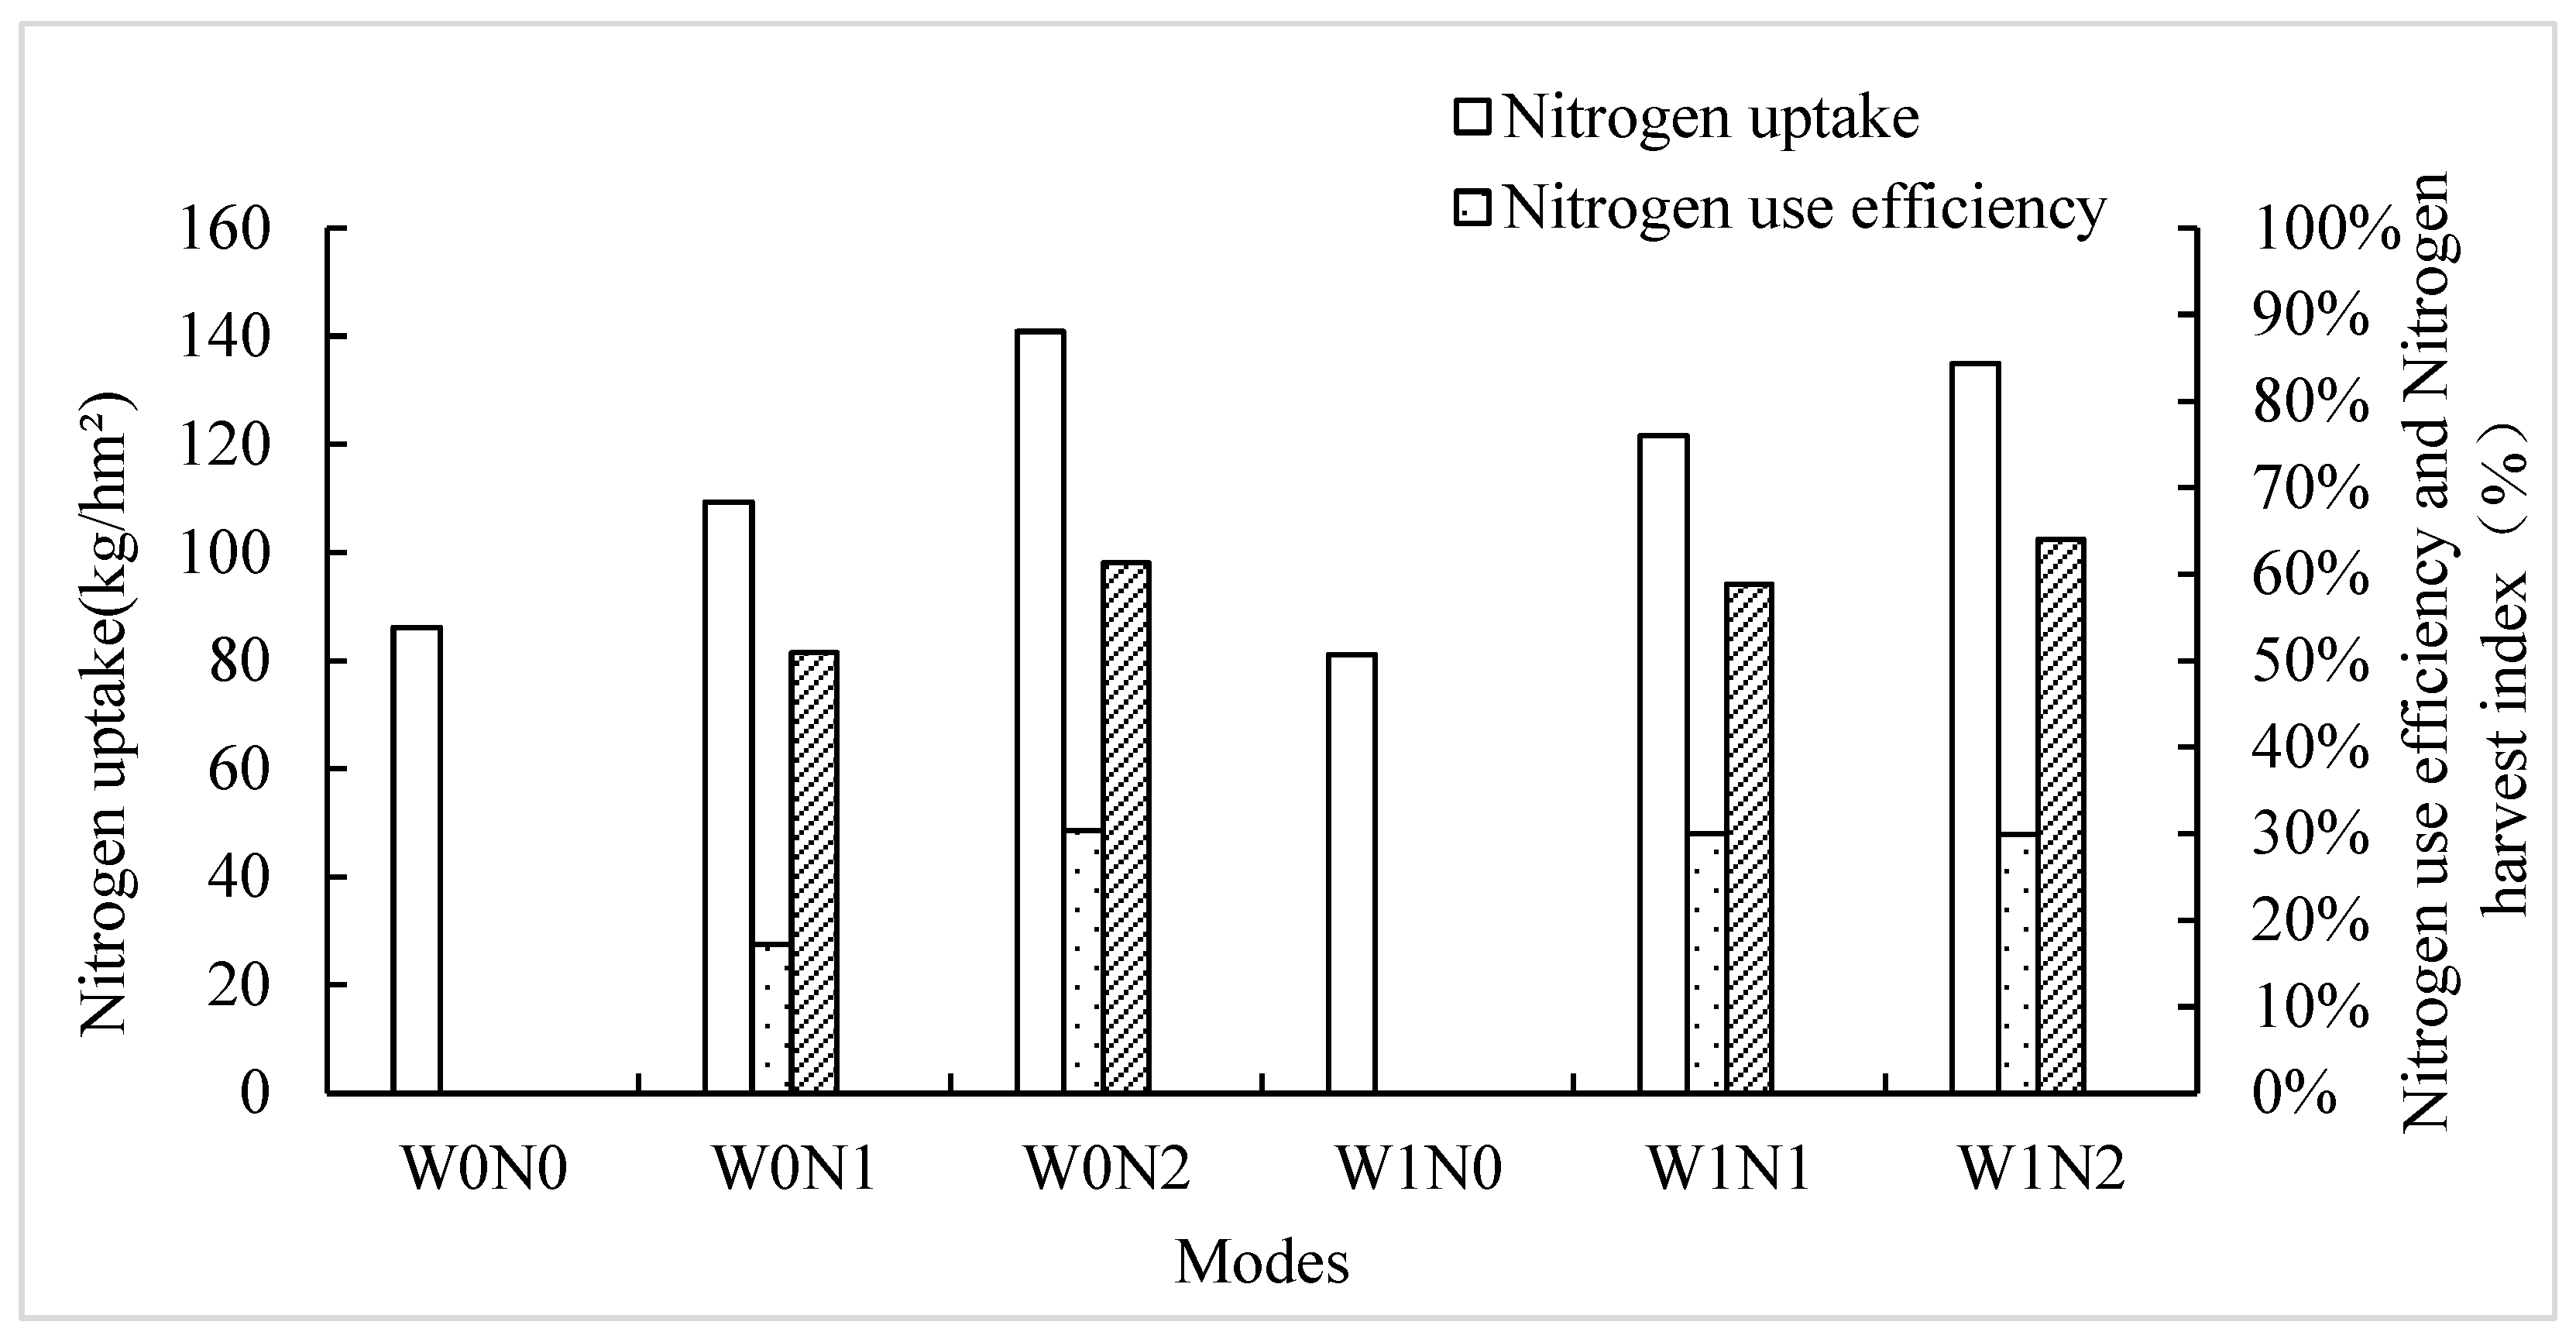
3.2.5. Nitrogen Uptake and Utilization of Rice

Changes in Nitrogen Uptake by Plant Samples at Different Growth Stages

The changes in TN concentration in stems, leaves and ears of rice plants under different water and fertilizer treatments are shown in Figure 8. By comparing the changes in TN concentration in the stems, leaves, and ears of rice plants, it was found that (i) the concentration of TN in the stem of rice plants increased from the late tillering to jointing and booting stage under the influence of the tiller fertilizer and ear fertilizer. Then, it decreased due to fertilizer consumption and showed a downward trend from the jointing to the heading and flowering stage. Next, it increased again from the heading and flowering to the milky stage and showed a downward trend at the maturity stage. (ii) The TN concentration in the leaves generally increased before the heading and flowering stage, but decreased at the maturity stage. (iii) The TN concentration in ears of rice increased gradually with time. And then it increased slowly at the milky stage and remained stable after the milky stage. (iv) The TN concentration in stems and leaves increased rapidly from the tillering stage to the jointing and booting stage, and decreased continuously after the heading and flowering stage. But the TN concentration in the ears of rice increased rapidly during the whole growth period. In conclusion, stems and leaves obtained a large amount of nitrogen from fertilization before the jointing and booting stage, while more nitrogen from plants was transferred to the ear after the heading and flowering stage. The conclusion was consistent with the study conducted by Cui et al. [39] in the Ganfu Plain Irrigation Area in China.
There was no significant difference in the nitrogen content of rice plants under different irrigation modes before the jointing and booting stage, heading and flowering stage and milky stage. This is because they were not subjected to water stress, which was consistent with the conclusion of Tian et al. [40]. The nitrogen content in leaves under the mode of W0 at the jointing and booting stage was higher than that under the mode of W1, which was consistent with the conclusion of Tian et al. [40], and the nitrogen content in ears under the mode of W1 at the maturity stage was higher than that under the mode of W0 [41].
There was no significant difference in the average concentration of TN in stems and leaves between the fertilization treatment and non-fertilization treatment at the tillering stage, but the TN concentration in stems and leaves under non-fertilization treatments was lower than that under fertilization treatments from jointing and booting stage to yellow maturity stage. The TN concentration in ears of rice under fertilization treatments was significantly higher than that under non-fertilization treatments after the heading and flowering stage [42].

Nitrogen Uptake by Rice

Nitrogen use efficiency under different water and fertilizer treatments was calculated according to Equation (1), as shown in Figure 9. Changes in the nitrogen use efficiency of rice under different irrigation modes were inconsistent, as shown in Figure 9. The average Nitrogen Harvest Index (NHI) and nitrogen use efficiency of W1 increased by 9.46% and 4%, respectively, compared with W0 at the same nitrogen application level, indicating that W1 was conducive to transfer more nitrogen to the grain and could improve nitrogen use efficiency compared with W0. The results showed that the water-saving model could increase nitrogen uptake and rice yield, which was consistent with the conclusion of Liu et al. [43].
The effect of nitrogen application on the efficiency of nitrogen use in rice under the same irrigation mode was significantly different. By increasing the nitrogen application under the W0 and W1 modes, the efficiency of nitrogen use increased by 7.77% and 9.18%, respectively, indicating that the efficiency of nitrogen use increased with the nitrogen application [44].
Therefore, the optimal water and fertilizer regulation model was W1N2 from the perspective of improving the nitrogen uptake and utilization efficiency of rice, which was higher than the traditional W0N2 mode by about 8.59%.

Relationship between Rice Yield and Nitrogen Utilization

The effects of different water and fertilizer treatments on rice yield from 2019 to 2021 are presented in Table 5. The impact of the nitrogen application level and the interaction between water and fertilizer on the rice yield was significant in three years, which indicates that the nitrogen application would significantly affect rice yield. Notably, significant differences were observed between the N1 and N2 treatment compared to the control treatment (N0). Furthermore, the irrigation method had an exceptionally significant effect on the rice yield in 2020.
Under the same irrigation mode, the rice yield under the N2 treatment was highest, followed by the N1 treatment and N0 treatment. And under the same nitrogen application level, the rice yield under the intermittent irrigation was higher than that under the flooding irrigation, with an average increase of 6.20%. So, the increased nitrogen fertilizer and intermittent irrigation could improve rice yield, which was consistent with the findings of Sun et al. [45]. Thus, to optimize rice yield, the optimal water and fertilizer regulation mode was W1N2 from the perspective of improving the rice yield, which could increase rice yield by 11.82% compared to the local traditional W0N2 mode.

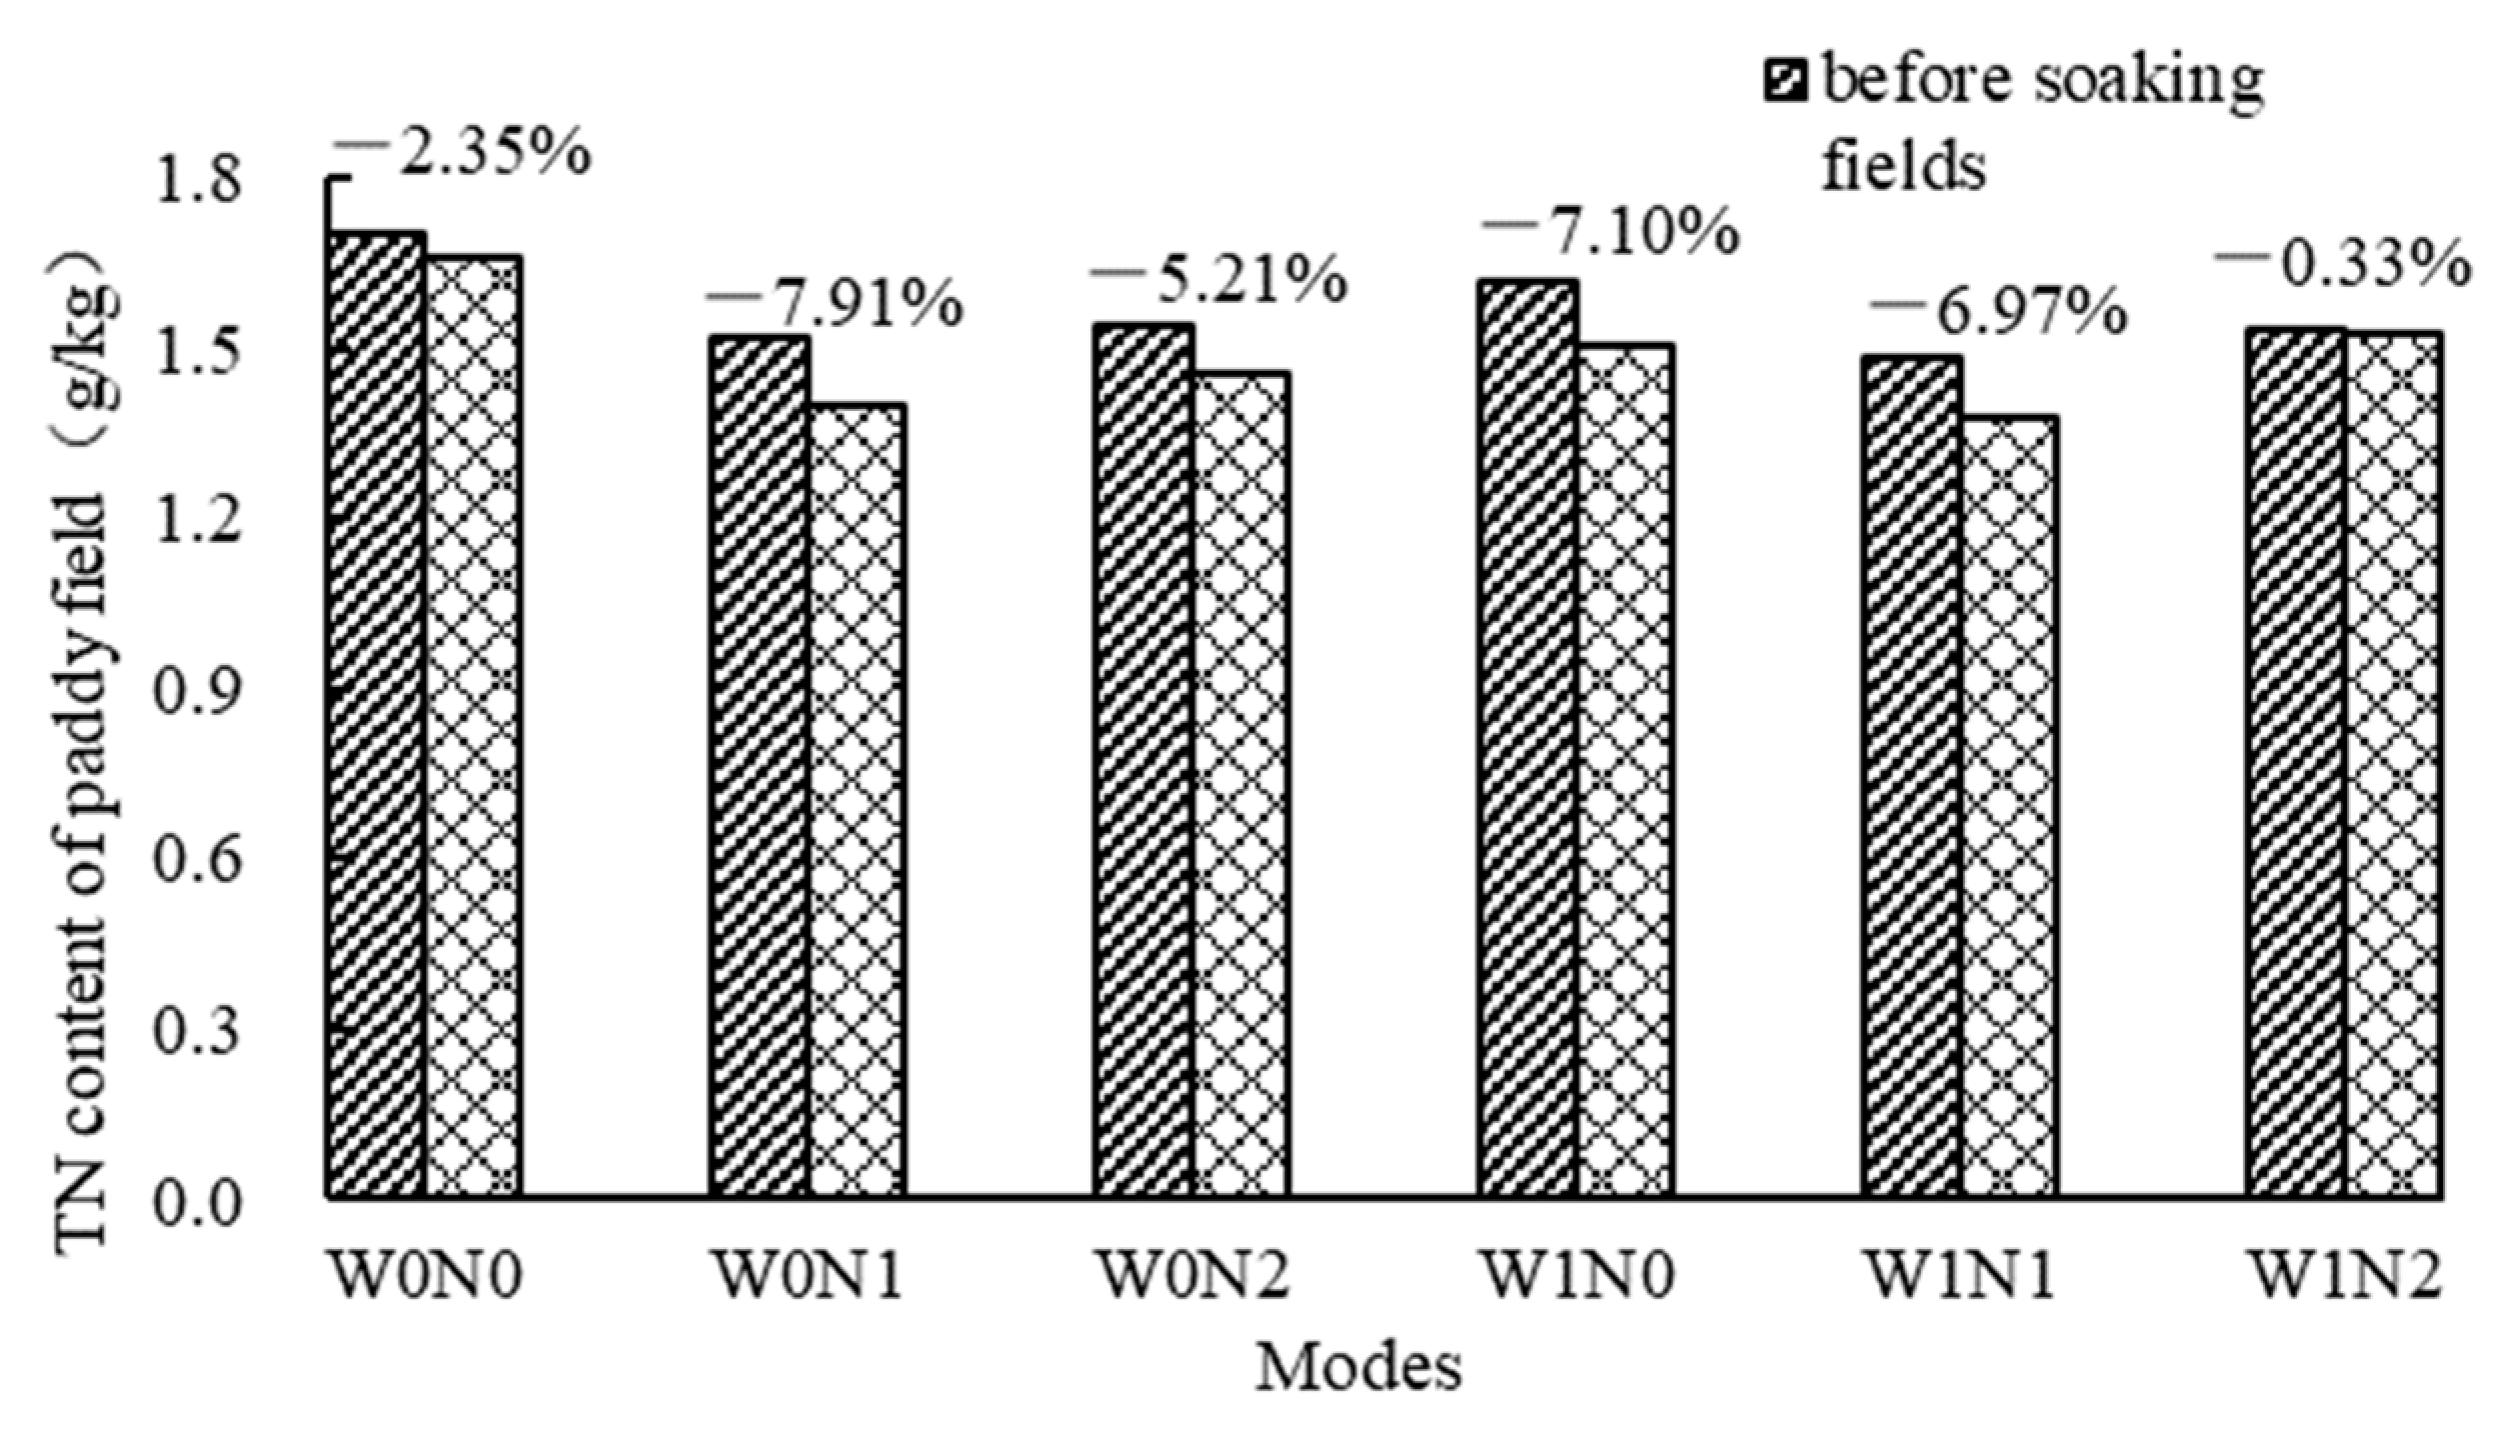
3.2.6. Nitrogen Fertility Change in Paddy Soil

The changes in soil residual nitrogen content under different interaction modes of water and fertilizer are shown in Figure 10. The results showed that the total nitrogen content at the 20 cm soil layer after harvesting under different patterns decreased by 10.34% and 19.97% in 2019 and 2020, respectively, compared with the pre-soaking soil. The total nitrogen content of the 20 cm soil layer under W1 and W0, excluding the treatment of W0N1, increased by 14.15% and 22.45%, respectively, after harvesting in 2021, compared to the pre-immersion period.
The total nitrogen content was reduced by 0.08 g/kg and 0.07 g/kg for the W0 and W1 treatments, respectively, compared to the pre-soaked soil at the same level of fertilization, and by 12.5% for W1 compared to W0. This was because the water-saving irrigation mode could reduce the leaching and volatilization loss of soil nitrogen and improve the natural fertility of the soil. Meanwhile, adding water through irrigation may decrease the soil oxygen content and increase the possibility of soil nutrient leaching, while water-saving irrigation modes could effectively improve soil aeration and soil fertility.
The total nitrogen content of the soil under the N1 and N2 treatments decreased by 0.11 g/kg and 0.04 g/kg, respectively, compared to the pre-soaked soil under the same irrigation mode, with N2 showing a lower reduction of approximately 63.6% compared to N1.

3.2.7. Nitrogen Balance in Paddy Field

The nitrogen balance of agro-ecosystems is the main factor in and important index to determine the crop yield, soil fertility and agricultural environment. Therefore, calculating the nutrient balance of the paddy system is an important means to analyze farm production and the agricultural environment. Nitrogen balance items under different water and fertilizer treatments in the field are shown in Table 6. Among them, the amount of mineralization was calculated according to the one-component first-order exponential model and its integral form proposed by Stanford et al. [46], and the amount of denitrification was calculated using the one-dimensional pusher reaction kinetic equation [46,47].
Table 6 shows that the amount of nitrogen applied in each input item was the highest, followed by the amount of mineralization, then the amount of wet deposition, and the lowest was the amount of field irrigation under different water and fertilizer modes. Meanwhile, the highest nitrogen output was crop uptake, followed by field drainage, then followed by ammonia volatilization and leakage loss, and the lowest was denitrification. The nitrogen loss from surface drainage and ammonia volatilization accounted for 23.7% of the total nitrogen loss, which was the main cause of nitrogen loss. The nitrogen loss from drainage accounted for 20.24% of the total nitrogen output, among which surface drainage and leaching loss accounted for 78.48% and 21.52%, respectively, indicating that the nitrogen loss from surface drainage was the main cause of nitrogen loss. The average amount of nitrogen loss through gas emission accounted for 14.21% of the total nitrogen output, among which ammonia volatilization and denitrification accounted for 99.71% and 0.29%, respectively, indicating that ammonia volatilization was the dominant nitrogen loss. In conclusion, the ratio of nitrogen absorption, drainage loss and gas loss to total nitrogen output was 7:2:1 in the paddy field.
Irrigation methods had an important effect on the migration and transformation of nitrogen from fertilizers. The nitrogen loss from surface water, nitrogen leaching, ammonia volatilization and denitrification under the intermittent irrigation mode of W1 were less than those under the flooding irrigation model of W0 under the same fertilization level, while the nitrogen uptake of rice was significantly higher than that under the intermittent irrigation mode of W0. All nitrogen output items under nitrogen application were larger than those under no nitrogen application under the same irrigation mode and showed an increasing trend with increasing nitrogen application.
According to the above analysis, the optimal mode was W1N1 from the perspective of reducing the amount of irrigation and drainage, field nitrogen and phosphorus emission load. And the optimal mode was W0N1 from the perspective of reducing nitrogen gas loss. Meanwhile, the optimal mode was W1N2 from the perspective of improving fertilizer use efficiency, but W1N1 could also improve nitrogen use efficiency. In this paper, the SPAC system was taken as a whole, and the benefits of water saving, emission reduction and nitrogen saving were comprehensively considered from three aspects of crop, water and atmosphere. The optimal mode of water and fertilizer regulation was W1N1, considering that high nitrogen application and flooding irrigation led to a higher risk of non-point source pollution in paddy fields. The amount of irrigation and drainage was reduced by 24.54% and 15.03%, respectively, the surface and leakage loads were reduced by 25.67% and 55.78%, respectively, and the nitrogen absorption efficiency of rice was increased by 8.59% compared to the local conventional W0N2 mode.

4. Conclusions

In this paper, we carried out field water and fertilizer regulation experiments on mid-season rice to systematically study the process of the water and nitrogen cycle and reveal the law of nitrogen migration and transformation in paddy fields under different water and fertilizer regulation modes. The effects of water-saving and emission reduction under the optimal water and fertilizer regulation model were shown in Table 7.
The main conclusions of the paper were as follows:
(1)
The irrigation pattern had significant effects on the amount of irrigation, drainage and seepage. Compared to the flooding irrigation mode, the intermittent irrigation mode could reduce the amount of irrigation, drainage and seepage.
(2)
The nitrogen loss from surface water mainly occurred in the return green stage, early tillering stage and jointing and booting stage. Compared with the flooding irrigation, the total nitrogen (TN) of surface and leakage loss decreased under the intermittent irrigation. Compared to the conventional fertilization, surface and leakage nitrogen emission loads were reduced under the treatment of N1.
(3)
The denitrification potential was greater than the nitrification potential during the rice growing season, indicating that soil denitrification was the dominant process in paddy fields. The rate of ammonia volatilization reached its peak 1–3 days after fertilization, and gradually decreased within 3–7 days. The peak value of the ammonia volatilization rate and the maximum loss mainly occurred in the early and middle stages of rice. Under the same irrigation mode, the higher the application of nitrogen, the greater the ammonia volatilization loss. Under the same nitrogen application level, the intermittent irrigation could increase ammonia volatilization compared with the flooding irrigation.
(4)
The ratio of stem nitrogen uptake to total nitrogen uptake in rice plants showed a downward trend as the growth period progressed. After the heading stage, the uptake of nitrogen from stems and leaves gradually shifted to the panicle. The nitrogen uptake of rice plants under the intermittent irrigation mode of W1 was higher than that under the flooding irrigation mode of W0. The nitrogen uptake of rice plants under the conventional treatment of N2 increased compared with the treatment of N1.
(5)
Intermittent irrigation and reduced fertilization could reduce nitrogen loss from the paddy field surface and plough layer. Among the nitrogen output items, the highest nitrogen output was crop absorption; crop absorption was greater than field drainage, field drainage was greater than ammonia volatilization and ammonia volatilization was greater than denitrification. The ratio of the crop absorption to drainage loss to gas loss was 7:2:1.
(6)
The optimal water and fertilizer regulation mode, considering water saving, pollution control, emission reduction and nitrogen conservation, was W1N1, which can save water by 27.54%, reduce emissions by 25.67%, improve the fertilizer utilization ratio by 8.59% and increase yield by 11.82% on average, compared with the traditional mode of W0N2.
The results can also be applied to the water and fertilizer management of crops other than rice in south China. The results of the study are important to improve the theoretical and technical systems for water conservation and emission reduction, further increase the utilization efficiency of water and fertilizer utilization in paddy fields, improve the agricultural water environment in southern China, and promote agricultural modernization.

Author Contributions

Conceptualization, W.L. and Y.C.; methodology, W.L. and Y.L.; software, Z.Y. and X.X.; validation, Y.C. and Y.W.; formal analysis, W.L. and J.C.; investigation, Z.Y. and X.X.; resources, W.L. and Y.L.; data curation, C.W. and Z.Z.; writing—original draft preparation, W.L.; writing—review and editing, Y.C.; visualization, J.C. and C.W.; supervision, W.L. and Y.C.; project administration, W.L. and Y.L.; funding acquisition, W.L. All authors have read and agreed to the published version of the manuscript.

Funding

The National Natural Science Foundation of China-the Ministry of Water Resources of the People’s Republic of China-China Yangtze River Three Gorges Group Co., Ltd. Yangtze River Water Science Research Joint Fund Project (No. U2040213), the basic scientific research business funding projects of central public welfare research institutes (CKSF2019251/NY, CKSF2021299/NY) and Knowledge Innovation Program of Wuhan-Shuguang Project (2023020201020362).

Data Availability Statement

The data presented in this study are available on request from the corresponding author. The data are not publicly available because it comes from relevant agencies and cannot be disclosed for security.

Conflicts of Interest

The authors declare no conflict of interest. The funders had no role in the design of the study; in the collection, analyses, or interpretation of data; in the writing of the manuscript, or in the decision to publish the results.

References

  1. Cui, J.; Ma, Y.H.; Zhao, Y.P.; Dong, J.J.; Shi, R.G.; Huang, W.X. Characteristics and prevention and control countermeasures of agricultural non-point source pollution. Chin. Agric. Sci. Bull. 2006, 1, 335–340. [Google Scholar]
  2. Li, T.T.; Feng, Y.F.; Zhu, A.; Huang, J.; Wang, H.; Li, S.Y.; Liu, K.; Peng, R.M.; Zhang, H.L.; Liu, L.J. Effects of main water-saving irrigation methods on root morphology and physiology of rice. Chin. J. Rice Sci. 2019, 33, 293–302. [Google Scholar]
  3. Yan, J.; Wu, Q.X.; Zhu, J.Q.; Zhang, L.P.; Li, J.F. Experimental study on nitrogen fertilizer operation research based on water control and emission reduction in paddy field. J. Soil Water Conserv. 2018, 32, 229–236+245. [Google Scholar]
  4. Geng, F.; Liu, L.H.; Ou, Y.W.; Zhu, J.Q. Characteristics of hydrological and nitrogen loss in typical single-crop rice fields in the Yangtze River Basin. J. Agro-Environ. Sci. 2023, 42, 132–141. [Google Scholar]
  5. Liu, X.H.; Lu, J.; Qi, Y.; He, Q.; Gao, W.D.; Chen, Y.F.; Hu, A.Y.; He, J.Q. Effects of water-nitrogen coupling on nitrogen uptake, utilization and migration transformation of crops. J. Irrig. Drain. 2022, 41, 1–12. [Google Scholar]
  6. Cui, Y.L.; Li, Y.H.; Lv, G.A.; Sha, Z.Y. Nitrogen transport and transformation law of rice under different water and fertilizer conditions. Adv. Water Sci. 2004, 280–285. [Google Scholar]
  7. Okubo, M.; Furukawa, Y.; Sakuratani, T. Growth, flowering and leaf properties of pear cultivars grafted on two Asian pear rootstock seedlings under NaCl irrigation. Sci. Hortic. 2000, 85, 91–101. [Google Scholar] [CrossRef]
  8. Wang, J.; Lv, G.A.; Guo, X.S.; Wang, Y.Q.; Ding, S.W.; Wang, D.Z. Conservation tillage and optimized fertilization reduce winter runoff losses of nitrogen and phosphorus from farmland in the Chaohu Lake region, China. Nutr. Cycl. Agroecosystems 2015, 101, 93–106. [Google Scholar] [CrossRef]
  9. Zhang, Z.G.; Wang, J.; Huang, W.B.; Chen, J.L.; Wu, F.Q.; Jia, Y.Y.; Han, Y.C.; Wang, G.P.; Feng, L.; Li, X.F.; et al. Cover crops and N fertilization affect soil ammonia volatilization and N2O emission by regulating the soil labile carbon and nitrogen fractions. Agric. Ecosyst. Environ. 2022, 340, 108188. [Google Scholar] [CrossRef]
  10. Liu, H.J.; Guo, Z.; Zheng, J.C.; C, L.G.; Zhang, Y.F.; Tong, H.Y. Effects of nitrogen fertilizer reduction on rice yield and nitrogen loss in Taihu Lake area. Chin. J. Ecol. 2017, 36, 713–718. [Google Scholar]
  11. Wang, Q.; Xu, J.M.; Jiang, L.N.; Lin, H.; Fu, J.R.; M, J.W. Effects of rotational rice on soil nitrification and nitrogen volatilization in greenhouse soil. J. Soil Water Conserv. 2017, 31, 186–190+196. [Google Scholar]
  12. Wang, Y.Y.; Xia, L.L.; Cai, S.Y.; Zhao, X.; Yan, X.Y.; Xing, G.X. After-effects and destination of residual chemical fertilizer nitrogen in rice-wheat rotation farmland under long-term non-application of nitrogen fertilizer. J. Soil Sci. 2022, 59, 1626–1639. [Google Scholar]
  13. Xiao, M.H.; Li, Y.Y.; Wang, J.W.; Hu, X.J.; Wang, L.; Miao, Z.M. Study on the Law of Nitrogen Transfer and Conversion and Use of Fertilizer Nitrogen in Paddy Fields under Water-Saving Irrigation Mode. Water 2019, 11, 218. [Google Scholar] [CrossRef]
  14. Mao, Z. Water-saving Irrigation of Rice. China Rural. Water Hydropower 1997, 45–47. [Google Scholar]
  15. Huang, M.Y.; Lv, X.J.; Dong, Q.B.; Li, H.; Gao, D.C. Characteristics of atmospheric nitrogen and phosphorus wet deposition and estimation of lake load in Erhai. Yangtze River 2022, 53, 68–73. [Google Scholar]
  16. Gao, R.; Han, H.H.; Cui, Y.L.; Wang, S.P.; Huang, Y.; Zhang, L. Effects of rainfall on nitrogen and phosphorus wet deposition flux and concentration in rice season in Erhai River Basin. Trans. Chin. Soc. Agric. Eng. 2018, 34, 6–7. [Google Scholar]
  17. Zhou, S.L.; Sun, Y.; Huang, T.L.; Zhan, J.; Wang, H.; Li, Z.X. Characteristics of atmospheric wet deposition nitrogen, phosphorus and dissolved organic matter in Zhoucun Reservoir. Water Resour. Prot. 2020, 36, 52–59. [Google Scholar]
  18. Chen, F.J.; Chen, C.Q.; Zhou, F.X.; Lao, Q.B.; Zhu, Q.M.; Zhang, S.W. Study on nutrient salts in atmospheric wet deposition in Zhanjiang Bay. China Environ. Sci. 2017, 37, 2055–2063. [Google Scholar]
  19. Li, X.L.; Xu, H.; Cai, Z.C. Research progress on the influence of water management on nitrous oxide emissions in paddy fields. Soil 2009, 41, 1–7. [Google Scholar]
  20. Shao, G.C.; Cui, J.T.; YU, S.E.; Lu, B.; Brian, B.J.; Ding, J.H.; She, D.L. Impacts of controlled irrigation and drainage on the yield and physiological attributes of rice. Agric. Water Manag. 2015, 149, 156–165. [Google Scholar] [CrossRef]
  21. Peng, S.Z.; He, Y.P.; Yang, S.H.; Xu, J.Z. Effect of controlled irrigation and drainage on nitrogen leaching losses from paddy fields. Paddy Water Environ. 2015, 13, 303–312. [Google Scholar] [CrossRef]
  22. Jiang, P.; Liu, M.; Qin, J.; Xiong, H.; Xu, F.X. Effect of nitrogen application rate on yield and rice quality of super hybrid rice. China Rice 2017, 23, 102–106. [Google Scholar]
  23. Cai, Y.J.; Ding, W.X.; Xiang, J. Influencing factors and mechanism of N2O and NO emission from farmland soil. Soil 2012, 44, 881–887. [Google Scholar]
  24. Erich, M.S.; Bekerie, A.; Duxbury, J.M. Activities of Denitrifying Enzymes in Freshly Sampled Soils1. Soil Sci. 1984, 138, 25–32. [Google Scholar] [CrossRef]
  25. Chen, Z.G.; Liu, L.M.; Chen, L.; Zhou, X.H. Effects of water regulation on denitrification in rhizosphere soil of rice. Res. Soil Water Conserv. 2015, 22, 133–137+145. [Google Scholar]
  26. Chen, Z.G.; Chen, L.; Chen, H.X.; Zhou, X.H.; Liu, L.M. Response of denitrase activity to water regulation in rice rhizosphere soil. Environ. Sci. Technol. 2014, 37, 21–25. [Google Scholar]
  27. Shi, M.; Zhang, W.G.; Li, J.Y.; Yan, S.H.; Gao, Y. Research progress on the effect of elevated CO2 concentration on nitrification and denitrification in water. Chin. J. Appl. Ecol. 2018, 29, 4239–4247. [Google Scholar]
  28. Wan, Z.W.; Li, N.; Huang, G.Q.; Xu, H.F. Effect of fertilization on denitrification potential of red soil in dryland. J. Huazhong Agric. Univ. 2022, 41, 137–142. [Google Scholar]
  29. Peng, S.Z.; Yang, S.H.; Xu, J.Z. Ammonia volatilization loss and influencing factors in water-saving irrigation paddy field. Trans. Chin. Soc. Agric. Eng. 2009, 25, 35–39. [Google Scholar]
  30. Wang, J.B.; Wu, G.; Yuan, Y.; Jing, Y.D.; Wang, W.J.; Zhang, X.M.; Sun, Y.X. Effects of different nitrogen application rates and nitrogen application methods on ammonia volatilization and nitrogen fertilizer utilization efficiency in paddy fields. Soil Fertil. Sci. China 2022, 5, 10–17. [Google Scholar]
  31. Sommer, S.G.; Olesen, J.E.; Christensen, B.T. Effects of temperature, wind speed and air humidity on ammonia volatilization from surface applied cattle slurry. J. Agric. Sci. 1991, 117, 91–100. [Google Scholar] [CrossRef]
  32. Nastri, A.; Toderi, G.; Bernati, E.; Govi, G. Ammonia volatilization and yield response from urea applied to wheat with urease (NBPT) and nitrification (DCD) inhibitors. Agrochimica 2000, 44, 231–239. [Google Scholar]
  33. Yang, G.Y.; Guo, Z.; Liu, H.J.; Wang, X.; Chen, L.G. Research progress on influencing factors of ammonia volatilization in paddy fields and its emission reduction measures. Ecol. Environ. Sci. 2020, 29, 1912–1919. [Google Scholar]
  34. Lu, L.L.; Wu, G.Y. Research progress on influencing factors of ammonia emission from farmland. J. China Agric. Univ. 2019, 24, 149–162. [Google Scholar]
  35. Li, R.; Cai, W.W.; Ai, T.C.; Shen, H.P.; Wu, H.L.; Wang, B.; LI, R.N. Variation of ammonia volatilization loss in paddy field and response of rice yield to different water and nitrogen treatment. Soil Fertil. Sci. China 2020, 3, 47–54. [Google Scholar]
  36. Wu, G.; Yuan, Y.; Cao, Z.W.; Zhang, Z.D.; Wang, L.L.; Wang, Y.L.; Sun, Y.X. Characteristics of ammonia volatilization loss in paddy fields under different water and nitrogen management conditions. J. Ecol. Rural. Environ. 2019, 35, 651–658. [Google Scholar]
  37. Yu, S.; Cui, Y.L.; Han, H.H.; Liu, F.P.; Xu, Y.Q. Changes of ammonia volatilization in paddy fields under different water and fertilizer systems. J. Irrig. Drain. 2015, 34, 1–5. [Google Scholar]
  38. Chen, Z.; Cui, Y.L.; Liu, F.P.; Wang, Y. Effects of different irrigation and fertilization modes on physical properties of paddy soil. J. Irrig. Drain. 2013, 32, 38–41. [Google Scholar]
  39. Cui, Y.L.; Xu, Y.Q.; Zhao, S.J.; Liu, F.P.; Dong, B. Water Saving and Emission Reduction Technology and Application in Southern Rice Irrigation Area; Science Press: Wuhan, China, 2015. [Google Scholar]
  40. Tian, Y.C.; Cao, W.X.; Wang, S.H.; Zhu, Y. Variation characteristics of water and nitrogen content and photosynthetic rate at different leaf positions of rice under different water and nitrogen conditions. Acta Crops Sin. 2004, 1129–1134. [Google Scholar]
  41. Liu, L.J.; Wei, X.; Wu, C.F.; Yang, J.C. Growth and nutrient absorption characteristics of rice under field nitrogen management. China Rice Sci. 2007, 2007, 167–173. [Google Scholar]
  42. Wang, J.; Cui, Y.F. Effects of different nitrogen application levels on nitrogen absorption and utilization of northern rice. Anhui Agric. Bull. 2013, 19, 2. [Google Scholar] [CrossRef]
  43. Liu, L.G.; Chen, Y.; Wu, X.; Yu, Q.A.; Pan, S.B.; Yang, X.W.; Wang, J.; Wang, L.H. Growth characteristics, water and fertilizer utilization rate and nitrogen and phosphorus loss law of rice under different comprehensive water and fertilizer control modes. China Rural. Water Hydropower 2020, 67–72+76. [Google Scholar]
  44. Lu, Y.H.; Liao, Y.L.; Tang, H.T.; Huang, T.P.; Xia, H.A.; Li, X.Y.; Zuo, G.H. Effects of different nitrogen application rates on rice yield, nitrogen absorption and utilization efficiency. Res. Agric. Mod. 2010, 31, 479–483. [Google Scholar]
  45. Sun, X.M.; Huang, Y.; Sun, Y.L. Study on growth characteristics of japonica rice under different water-saving irrigation methods and cultivation modes. J. Irrig. Drain. 2022, 41, 49–56. [Google Scholar]
  46. Wang, X.X.; Huang, P.; Wu, S.J.; Huang, Y.Y.; Liu, Z.M.; Jiang, Y. Research progress on soil nitrogen mineralization kinetic model. World Sci. Technol. Res. Dev. 2017, 39, 164–173. [Google Scholar]
  47. Liang, X.Q.; Chen, Y.X.; Li, H.; Tian, G.M.; Ni, W.Z.; He, M.M.; Zhang, Z.J. Modeling transport and fate of nitrogen from urea applied to a near-trench paddy field. Environ. Pollut. 2007, 150, 313–320. [Google Scholar] [CrossRef] [PubMed]
Figure 1. Nitrogen emission load of surface water and seepage water under different water and fertilizer treatments. The error bars are 95% confidence intervals for TN runoff and leaching loss based on a one-way analysis of variance (ANOVA); different lowercase letters in the figure represent differences between groups for significance analysis.
Agronomy 13 02870 g001
Figure 2. The nitrification potential under different treatments in 2021. The error bars are 95% confidence intervals for nitrification potential based on a one-way analysis of variance (ANOVA), a, b and c in the figure represent differences between groups for significance analysis.
Agronomy 13 02870 g002
Figure 3. The denitrification potential under different treatments in 2021. The error bars are 95% confidence intervals for nitrification potential based on a one-way analysis of variance (ANOVA); a and b in the figure represent differences between groups for significance analysis.
Agronomy 13 02870 g003
Figure 4. Variation law of ammonia volatilization rate of mid-season rice in 2019.
Agronomy 13 02870 g004
Figure 5. Variation law of ammonia volatilization rate of mid-season rice in 2020.
Agronomy 13 02870 g005
Figure 6. Variation law of ammonia volatilization rate of mid-season rice in 2021.
Agronomy 13 02870 g006
Figure 7. Ammonia volatilization loss at different growth stages of mid-season rice.
Agronomy 13 02870 g007
Figure 8. TN concentration changes in plant stems, leaves and ears under different water and fertilizer treatments in three years.
Agronomy 13 02870 g008
Figure 9. Average nitrogen absorption and utilization index under different water and fertilizer treatments in three years.
Agronomy 13 02870 g009
Figure 10. Average soil nitrogen content and change under different water and fertilizer treatments in three years.
Agronomy 13 02870 g010
Table 1. Field water-depth control standards for different irrigation modes.
Irrigation Mode Lower Limit before Irrigation—Upper Limit after Irrigation—The Upper Limit of Rain Storage
Return Green (mm)Early
Tillering (mm)
Late
Tillering (mm)
Jointing and Booting (mm)Heading and Flowering (mm)Milking (mm)Yellow
Maturity (mm)
Intermittent
irrigation (W1)
0-20-300-20-500-20-500-20-500-20-500-20-500-20-30
Dry 4 daysLater exposing
field
Exposing field 4 daysExposing field 4 daysExposing field 4 daysLater natural
drying
Flooding
irrigation (W0)
0-40-4020-50-5020-50-5020-50-5020-50-5020-50-500-30-30
Later exposing
field
Later natural
drying
Note: W1 treatment of 0-20-30 is the field water depth value, where 0 mm is the lower limit of depth of the field water layer before irrigation, 20 mm is the upper limit of depth of the field water layer after irrigation, and 30 mm is the upper limit of depth of water layer after rain, Exposing the field for 4 days means that the field will dry continuously for 4 days after no water layer in the field in the treatment of W1.
Table 2. The specific fertilization ratio of different plots.
Fertilization SystemTreatment46% Urea (kg)15% Calcium
Magnesium Phosphate Fertilizer (kg)
60% Potassium Chloride (kg)Number of
Repeats
Base fertilizerW0N001.2600.3151
W1N001.2600.3151
W0N10.4111.6710.6303
W1N10.4111.6710.6303
W0N20.5481.6710.6303
W1N20.5481.6710.6303
Tillering fertilizerW0N00001
W1N00001
W0N10.247003
W1N10.247003
W0N20.329003
W1N20.329003
Panicle fertilizerW0N0000.3851
W1N0000.3851
W0N10.16400.3853
W1N10.16400.3853
W0N20.21900.3853
W1N20.21900.3853
Table 3. Division of mid-season rice growth stages and field management measure.
Year201920202021
Growth stageReturn Green18 June–24 June16 June–23 June27 June–7 July
Early Tillering25 June–9 July24 June–7 July8 July–18 July
Late Tillering10 July–22 July8 July–23 July19 July–4 August
Jointing and Booting23 July–5 August24 July–12 August5 August–22 August
Heading and Flowering6 August–19 August13 August–23 August23 August–8 September
Milking20 August–27 August24 August–10 September9 September–18 September
Yellow Maturity27 August–17 September11 September–24 September19 September–9 October
Rice transplanting date18 June16 June27 June
Rice Harvest Dates17 September24 September9 October
Total days of the growth period92 d101 d105 d
FertilizationBase fertilizer17 June15 June27 June
Tillering fertilizer1 July27 June8 July
Panicle fertilizer23 July21 July4 August
Table 4. Water balance elements under different water and fertilizer treatments during the whole growth period of rice from 2019 to 2021.
YearsTreatmentPrecipitation (mm)Irrigation (mm)Recharge (Precipitation + Irrigation) (mm)Drainage (mm)Consumption (mm)Leakage (mm)Evapotranspiration (mm)Discharge (Drainage + Consumption) (mm)
2019W0N0225.9498.0 a674.0164.9 a554.6 a104.3 d450.3719.5
W0N1518.9 a669.8154.5 ab675.6 ab149.7 c525.9830.1
W0N2510.9 a683.1125.9 b717.2 a172.1 ab545.1843.1
W1N0345.2 c436.0150.8 ab539.0 ab158.8 bc380.2689.8
W1N1360.4 c480.4124.8 b607.7 b183.6 a424.1732.5
W1N2388.7 b562.093.2 c625.2 b165.3 abc459.9718.4
2020W0N1749419.5 b1168.5306.5 ab822.6 a205.1 ab617.51129.1
W0N2317.3 ab1066.3333.8 b731.6 a202.7 b528.91065.4
W1N1289.4 a1038.4278.8 ab743.9 a178.2 a565.71022.7
W1N2313.9 ab1062.9258.2 a744.2 a173.8 ab570.41002.4
2021W0N0451.4482.1 ab933.585.4 a794.9a234.1 a560.8880.3
W0N1386.2 ab837.665.3 a719.5 a238.5 a481.0784.8
W0N2502.0 a953.483.2 a650.2 a193.9 b456.3733.4
W1N0307.6 ab759.059.4 a649.8 a149.7 c500.1709.2
W1N1354.0 b805.457.7 a618.0 a176.1 b441.9675.7
W1N2331.0 ab782.485.1 a673.1 a188.4 b484.7758.2
Note: Different letters in the table indicate that the significance is less than 0.05 under Duncan’s test.
Table 5. Comparison of rice yield from 2019 to 2021.
TreatmentYield in 2019/(kg/ha)Yield in 2020/(kg/ha)Yield in 2021/(kg/ha)
W0N0394.37 b-473.75 bc
W0N1507.47 ± 91 a396.58 ± 32 bc572.79 ± 30 ab
W0N2538.89 ± 10 a383.67 ± 22 c561.96 ± 19 ab
W1N0382.72 b-439.41 ± c
W1N1535.38 ± 12 a462.30 ± 14 ab590.41 ± 125 a
W1N2541.35 ± 25 a498.53 ± 82 a620.07 ± 48 a
W0.834 ns<0.001 **0.119 ns
N<0.001 **<0.001 **<0.001 **
W × N<0.001 **<0.001 **<0.001 **
Note: a, b and c in the figure represent differences between groups for significance analysis. ** significant differences at p < 0.01; ns indicates non-significant difference.
Table 6. Statistics of nitrogen input and output items under different water and fertilizer treatments from 2019 to 2021.
InputOutput
ModesThe
Application Amount of Fertilizer (kg/ha)
Mineralization (kg/ha)Wet
Deposition (kg/ha)
Irrigation (kg/ha)Total (kg/ha)Nitrogen Uptake by Rice (kg/ha)Proportion (%)Drainage (kg/ha)Proportion (%)Leaching Loss (kg/ha)Proportion (%)NH3 Volatilization (kg/ha)Proportion (%)Denitrification (kg/ha)Proportion (%)Total (kg/ha)
W0N00/5.10.18 86.1476.41.681.491.351.223.5820.91/
W0N113524.87.22.02169.02109.360.8739.7922.155.803.2324.6113.700.070.04179.6
W0N218027.89.32.85219.93140.878.4230.1316.789.275.1625.1914.030.090.03205.49
W1N00/4.61.64 81.1173.162.762.493.112.8023.8821.54/
W1N113533.78.63.33180.61121.667.7128.6615.963.712.0725.4314.160.060.05179.49
W1N218034.77.82.04224.52134.975.1224.4713.6211.726.5326.5214.770.080.04197.71
Table 7. Comparison with the effects of water-saving and emission reduction between the optimal water and fertilizer mode (W1N1) and traditional irrigation mode (W0N2).
Different
Effects
Water SavingEmission
Reduction
Fertilizer Utilization RateYield
The
amplitude of variation
27.54%25.67%8.59%11.82%
Disclaimer/Publisher’s Note: The statements, opinions and data contained in all publications are solely those of the individual author(s) and contributor(s) and not of MDPI and/or the editor(s). MDPI and/or the editor(s) disclaim responsibility for any injury to people or property resulting from any ideas, methods, instructions or products referred to in the content.

