Article

Proteomics Analysis Reveals Hormone Metabolic Process Involved in the Regulation of Kernel Water Content Induced by Exogenous Abscisic Acid in Maize

1
Cereal Crops Institute, Henan Academy of Agricultural Sciences, Postgraduate T&R Base of Zhengzhou University, Zhengzhou 450002, China
2
School of Agricultural Sciences, Zhengzhou University, Zhengzhou 450002, China
3
Jiangsu Key Laboratory of Crop Genetics and Physiology, Agricultural College of Yangzhou University, Yangzhou 225009, China
4
Henan Engineering Research Center of Crop Chemical Control, College of Agronomy, Henan Agricultural University, Zhengzhou 450046, China
*
Author to whom correspondence should be addressed.
These authors contributed equally to this work.
Agronomy 2023, 13(12), 2897; https://doi.org/10.3390/agronomy13122897
Submission received: 8 October 2023 / Revised: 13 November 2023 / Accepted: 17 November 2023 / Published: 25 November 2023

Abstract

:
The water content of maize kernels during harvest is a critical factor influencing grain harvest practices globally. Abscisic acid (ABA) plays a pivotal role in grain development during the grain-filling process. Yet, there has been limited reporting on the regulatory mechanism of grain dehydration induced by exogenous ABA using proteomic techniques. In this study, two maize genotypes with distinct dehydration rates, DK517 (fast dehydration) and ZD1002 (slow dehydration), were treated with ABA after the heading stage. Results revealed a 20% lower yield in DK517 compared to ZD1002 following ABA application. Sixty days after pollination, the grain water content decreased to 23.55% in DK517 and 30.42% in ZD1002 due to ABA treatment. Through proteomic analysis, 861 and 118 differentially expressed proteins (DAPs) were identified in DK517 and ZD1002, respectively, as a result of ABA treatment. GO analysis indicated that the primary metabolic process, nitrogen compound metabolic process, and hormone metabolic process were significantly enriched among the DAPs in DK517 induced by ABA, while these pathways were absent in ZD1002. Twenty-four and fifteen overlapping DAPs showed contrasting responses in the two maize genotypes after ABA treatment. Notably, the expression levels of six known ABA signaling genes, including SnRK2 and DRE-like proteins, were downregulated in DK517 but remained unaltered in ZD1002 following ABA application. These findings underscore the distinct effects of exogenous ABA on the grain-filling characteristics of different maize genotypes, emphasizing the importance of the hormone metabolic process in regulating kernel water content induced by exogenous abscisic acid in maize.

1. Introduction

Maize (Zea mays L.) stands as one of the world’s most imperative cereal crops, serving as a major staple food and a primary component in animal and raw materials [1]. The advent of mechanical maize harvesting has led to reductions in labor, material costs, and financial expenditures [2], establishing itself as a common practice in contemporary corn production [3]. In China, the year 2021 witnessed a remarkable 79% rate of mechanical corn harvesting, predominantly centered on ear harvesting, with mechanical harvesting of corn kernels accounting for less than 10% [4]. This limitation has considerably impeded agricultural mechanization in China [5]. The critical link between the mechanical harvesting of corn kernels and kernel water content is pivotal because the latter significantly influences the optimal timing for mechanical harvesting. This timing typically falls to 25% within a specific timeframe after the kernels reach physiological maturity, as demonstrated by prior studies [6,7]. Inefficient timing for mechanical harvesting due to improper kernel water content poses a substantial obstacle to the adoption of mechanization in agriculture. The Huang-Huai-Hai Plain, China’s primary summer maize-growing region, witnesses two crop cycles each year, brimming with light and heat resources but lacking in utilization efficiency [8]. These geographic conditions, characterized by limited access to light and heat resources, hinder efficient grain-filling and dehydration post-physiological maturity, leading to water content levels in harvested grains exceeding 30% [9]. This fails to meet the requirements for grain harvesting, resulting in high grain crushing rates, subpar grain quality, and economic losses [10,11]. For the successful development of mechanical grain harvesting technology in this region, achieving an optimal kernel water content of 16.2–24.8% is paramount [12].
Studies have revealed a significantly positive correlation between grain-filling rates and grain dehydration. This occurs in three stages: hysteresis, dehydration during the grain-filling stage, and dehydration post-physiological maturity [13]. An increase in the grain-filling rate during the grain-filling period accelerates the dehydration rate, consequently reducing the water content of the grains at harvest [11]. Conversely, prolonged grain-filling periods slow down the dehydration rate, leading to increased water content in the grains [14]. Moreover, increasing daily average temperatures have been found to boost the grain-filling rate, thus shortening the effective filling period and accelerating grain dehydration [15]. A positive correlation has been established between grain-filling and dehydration rates [16].
Endogenous hormones, such as abscisic acid (ABA) play a pivotal role in grain development through the grain-filling process [17,18]. The application of low concentrations of exogenous ABA has been shown to expedite the timing of maximum filling, shorten the active filling period, encourage starch accumulation, and reduce the water content [19,20,21]. ABA content has been observed to have a positive correlation with grain weight during the early stages of grain-filling but a negative correlation in the middle and late stages [22,23]. ABA’s influence on grain-filling is intricately linked to sugar unloading, with ABA affecting the activities of key enzymes responsible for sucrose-to-starch conversion, facilitating the movement of photosynthetic products to the grains [24]. The application of exogenous ABA has been found to extend the duration of grain-filling [25,26]. However, scant evidence exists regarding the identification of key genes responsible for the extended grain-filling induced by ABA.
In this context, proteomic analysis emerges as an indispensable tool to identify key proteins and pathways influenced by ABA treatment, offering insights into the enhancement of grain quality and the optimization of mechanical harvesting. Proteomics, a large-scale, high-throughput analysis of a complete set of proteins within a cell, specific tissue, or species [27] offers a promising approach for identifying key proteins and genes in biological samples on a grand scale [28,29]. Existing research on grain kernel proteomics has predominantly focused on the expression characteristics of relevant proteins during kernel development [30], the impact of nitrogen fertilizer application on grain proteins [31], the location of quantitative trait loci related to kernel protein content [32] and the effect of storage temperature on corn proteins [33]. In contrast, limited research has explored the effect of exogenous ABA on grain dehydration using proteomic methods and the specific regulatory mechanism remains enigmatic.
This study delves into the influence of exogenous ABA application on the yield, grain-filling characteristics, and kernel water content of two maize varieties with distinct dehydration rates. Additionally, we conduct a comprehensive proteomic analysis to identify the underlying mechanisms. Bioinformatic analyses, including Gene Ontology (GO) and Kyoto Encyclopedia of Genes and Genomes (KEGG) analysis, are employed to elucidate the key biological and metabolic pathways associated with the observed phenotypic changes in these two maize genotypes following ABA. The outcomes not only hold the potential to advance agricultural mechanization in China but also provide a pivotal physiological foundation for future research on grain dehydration and the development of maize varieties featuring rapid natural dehydration rates.

2. Materials and Methods

2.1. Field Design and Plant Materials

The field experiments were conducted at the Modern Agricultural Science and Technology Experimental Demonstration Base, Henan Academy of Agricultural Sciences, Yuanyang Province, China (coordinates: 35°0′17″ N, 113°42′4″ E) during the summer of 2021. This region features a warm temperate continental monsoon climate, characterized by fluvo-aquic soil, flat topography, sufficient irrigation, and consistent fertility. The land had previously been used for wheat cultivation. Soil analysis was performed on the 0–30 cm soil layer, revealing the following properties: total organic content of 17.25 g kg−1, total nitrogen (N) content of 0.96 g kg−1, available N content of 79.35 mg kg−1, available phosphorus content of 10.22 mg kg−1 and available potassium content of 94.56 mg kg−1.
Our experimental design employed a two-factor split-plot design, with two summer maize hybrids, Dika517 (DK517) and Zhengdan1002 (ZD1002), known for their fast and slow rates of dehydration, respectively [34], as the primary factors. Subplots received one of two treatments: 80 ppm exogenous ABA with 90% purity (sourced from Shanghai Yuanye Bio-Technology Co., Ltd., Shanghai, China, hereafter referred to as ABA80) or a control treatment (CK) using water with 0.5% (v/v) Tween-20. We added 0.5% (v/v) Tween-20 to the ABA solution to enhance ABA’s availability as a surfactant [35]. Each treatment was replicated three times, resulting in a total of 12 experimental plots. For soil fertility management, we applied basal fertilizers at the following rates: 270 kg hm−2 of nitrogen (N), 180 kg hm−2 of phosphorus (P2O5), and 180 kg hm−2 of potassium (K2O).
Maize seeds were sown on 13 June 2021, in plots measuring 5 × 8 m (40 m2) with row spacing set at 0.6 m, resulting in a planting density of 67,500 plants ha−1. Throughout the study, standard irrigation and fertilization practices were consistently maintained. To ensure the accuracy of ABA treatment effects on specific maize hybrids, we bagged the maize ears before silk emergence under all treatments and performed manual pollination. The ABA treatment was initiated when the plants reached 54 days of age [36]. On specific sunny days, such as 6 August 2021 (the day after pollination), 14 August, and 16 August between 16:00 and 17:00, we sprayed the leaves and ears with 200 mL m−2 to optimize the plant and crop response to the treatment. Harvesting took place on 3 October 2021, following daily field management practices identical to those employed in high-yielding maize fields.

2.2. Grain Yield Determinations

Upon reaching maturity, we selected ten ears displaying uniform growth from each plot. These ears were air-dried by laying them on a well-ventilated surface with regular turning to ensure uniform drying. We calculated the yield using the following formula:
Yield = (number of ears per hectare) × (number of grains per ear) × (1000 − grain weight) × 10−6 × (1 − sample water content %)/(1–14%).

2.3. Grain-Filling Characteristics and Kernel Water Content

Starting 10 days after pollination, we selected three plants with uniform growth from each treatment every 7 days. From each ear (upper, middle, and lower parts), we randomly collected 100 kernels. Middle kernels were weighed for fresh weight (FW) and then dried at 105 °C for 30 min. Subsequently, they were dried at 80 °C until a constant weight was achieved and then reweighed for dry weight (DW). These values were used to analyze grain-filling characteristics and kernel water content (KWC).
We modeled the grain-filling process using Richards’s growth equation [37]:
W = A/(1 + Be−kt)1/N
In Equation (1), W represents the kernel weight during a specific filling period, A is the final dry grain weight, B is the initial value, K is the constant growth rate, N is a characteristic parameter and t is the time after flowering, with the flowering date marked as day 0.
The rate of grain filling (G) was calculated as a derivative of Equation (1):
G = (KW/N)[1 − (W/A)N]
In Equation (2), G represents the grain filling rate. We defined the period of active filling (D) as the time taken for W to change from 5% (t1) to 95% (t2) of A. We calculated the average rate of filling (Gmean) from t1 to t2 and Gmax represented the maximum filling rate.
Gmax = max(G), where G is the grain filling rate as calculated using Equation (2).
Tmax is the time at the maximum filling rate.
Tmax = t at max(G), where t is the time after flowering, and max(G) is the maximum value of G as calculated using Equation (2).
We represented the potential kernel weight at the initial filling as Ro, and the grain weight at the maximum filling rate as W1. The kernel water content was calculated as:
KWC (%) = (FW − DW)/FW × 100%.

2.4. Protein Extraction

At 14 days after pollination, we selected three ears from plants exhibiting uniform growth for each treatment. We extracted the middle grains and stored them at −80 °C for subsequent comparative proteomic analysis. The protein extraction process involved adding a lysis solution consisting of 1.5% SDS/100 mM Tris-Cl to the grain samples. After centrifugation at 15,000× g for tissue homogenization, the supernatant was collected. The protein concentration was determined using the bovine serum albumin (BSA) assay as a standard [38].

2.5. Proteomics Sample Pretreatment

To precipitate proteins from the solution, we used the acetone precipitation method [39]. A solution of 8M urea/100 mM Tris-Cl was added to the protein precipitate, followed by dithiothreitol (DTT). After redissolution, the samples were incubated at 37 °C for 1 h. Iodine acetamide (IAA) was added to alkylate at room temperature in the dark to seal the sulfhydryl groups. To dilute the urea concentration to less than 2M, we added a 100 mM Tris-HCl solution to the reduced and alkylated sample. Trypsin was added according to a mass ratio of enzyme to proteins (1:50), and the samples were incubated at 37 °C overnight with shaking for enzyme digestion [40]. The following day, we added trifluoroacetic acid (TFA) to terminate digestion and collected the supernatant for Sep-Pak C18 desalination. Sep-Pak C18 is a solid-phase extraction column that selectively separates and purifies hydrophobic organic compounds. We drained the samples and stored them at −20 °C until use. Upon collection, the samples were rapidly frozen in liquid nitrogen to preserve protein and RNA integrity for subsequent analyses.

2.6. LC-MS/MS-Based Proteomic Analysis

We obtained mass spectrum (MS) data using a Q-Exactive Plus mass spectrometer by Thermo Fisher Scientific, paired with the EASY-nLC 1200 liquid chromatography system. Peptide samples were dissolved in a loading buffer and introduced via automatic sampler. They were separated on a 50 µm × 15 cm C18 column with 2 µm particle size and 100 Å pore size. Two mobile phases, mobile phase A (0.1% formic acid) and mobile phase B (0.1% formic acid, 80% ACN), were used to establish a 90 min analytical gradient. The flow rate was set at 300 nL min−1, and MS data were collected in data-dependent acquisition (DDA) mode. Each scan cycle consisted of a full MS scan as follows: resolution (R) of 70,000, automatic gain control (AGC) = 3 × 10⁶, maximum injection time (max IT) = 20 ms, and scan range = 350–1800 m/z. This was followed by 15 subsequent MS/MS scans with a resolution (R) of 17,500, AGC = 2 × 10⁵, max IT = 50 ms, and higher-energy collision dissociation (HCD) collision energy set at 28. The filter window for the quadrupole was set at 1.6 Da and the dynamic exclusion time of ion repeated collection was set at 35 s. The data were processed using MaxQuant (V1.6.6) software with the Andromeda database retrieval algorithm [41,42].

2.7. Data Processing for Proteomics

Protein identification used the UniProt maize proteome reference database [43]. Label-free quantification (LFQ), oxidation (M), acetylation (protein N-terminus), Trypsin/P, and carbamidomethylation (C) were employed as fixed modifiers during enzyme digestion. First-order MS matching tolerances were set at 20 ppm for the first retrieval and 4.5 ppm for the main retrieval. The matching tolerance for the secondary MS was set at 20 ppm with a “match between runs” check. Identification results were screened based on a 1% false discovery rate (FDR) at both the protein and peptide levels. This process excluded anti-library proteins, contaminated proteins, and proteins with only one modified peptide. The remaining identification information was used for subsequent analysis. Functional annotation and enrichment analysis were conducted using the Diamond program of the eggNOG-mapper software based on the principle of sequence similarity, implying functional similarity [44,45].

2.8. Bioinformatic Analysis

Differentially expressed proteins (DAPs) were classified as upregulated (fold change > 1.2) or downregulated (fold change > 0.8) based on a t-test (p < 0.05) [38]. Annotation information was obtained for GO terms (second, third, and fourth layers of biological process, cellular component, and molecular function, respectively), KEGG pathways, and COG (cluster of orthologous groups) categories corresponding to the submitted protein sequences [46]. Functional enrichment analysis was performed using the hypergeometric test to identify significant functional categories. The mass spectrometry proteomics data have been deposited to the Integrated Proteome Resources (https://www.iprox.cn, accessed on 20 November 2023) with the dataset identifier IPX0007517000.

2.9. Quantitative Real-Time (q-RT) PCR Analysis

For transcript analysis, we designed gene-specific primers to ensure accurate and specific amplification of target genes. This process involved utilizing bioinformatics tools and taking into consideration cDNA sequences from the two maize genotypes, DK517 and ZD1002. We used software like Primer3 to select primer sequences with optimal melting temperatures, GC content, and the avoidance of secondary structures. A rigorous primer design process was essential to guarantee the reliability and relevance of the gene expression data acquired through quantitative real-time PCR (q-RT-PCR) [47]. We selected ten genes from the overlapped DAPs list between the two maize genotypes induced by ABA for q-RT-PCR analysis. The primer sequences for q-RT-PCR amplification are listed in Table S1. RNA was extracted and reverse-transcribed using the RevertAid First Strand cDNA Synthesis Kit (Thermo Fisher Scientific, Waltham, MA, USA). The q-RT-PCR experiments were performed using a fast-start essential DNA Green Master kit. Cq values were determined with a LightCycler 96 Real-Time PCR system (Roche, Basel, Switzerland). The primers were designed using Primer Premier 5.0 software (Premier Biosoft Ltd., Palo Alto, CA, USA) and obtained from Sangon Biotech Company (Shanghai, China). The q-RT-PCR running program consisted of a reverse transcription step at 48 °C for 30 min and a Taq polymerase activation step at 95 °C for 30 s. This is followed by 45 cycles at 95 °C for 15 s, 61 °C for 20 s, and 72 °C for 30 s, concluding with a melting cycle. We employed the 2−ΔΔCT method [48] to calculate the relative changes in target gene expression as assessed by q-RT-PCR analysis, using the maize actin gene as a reference gene. All q-RT-PCR experiments were conducted with three biological replicates.

2.10. Statistical Analysis

Data processing, mapping, and statistical analysis were performed using Microsoft Excel 2003 and SPSS 20.0 software. Variance and multiple comparisons were analyzed using the least significant difference (LSD) and Duncan’s method, with significance set at p < 0.05. Technical replicates and biological replicates were repeated three times.

3. Results

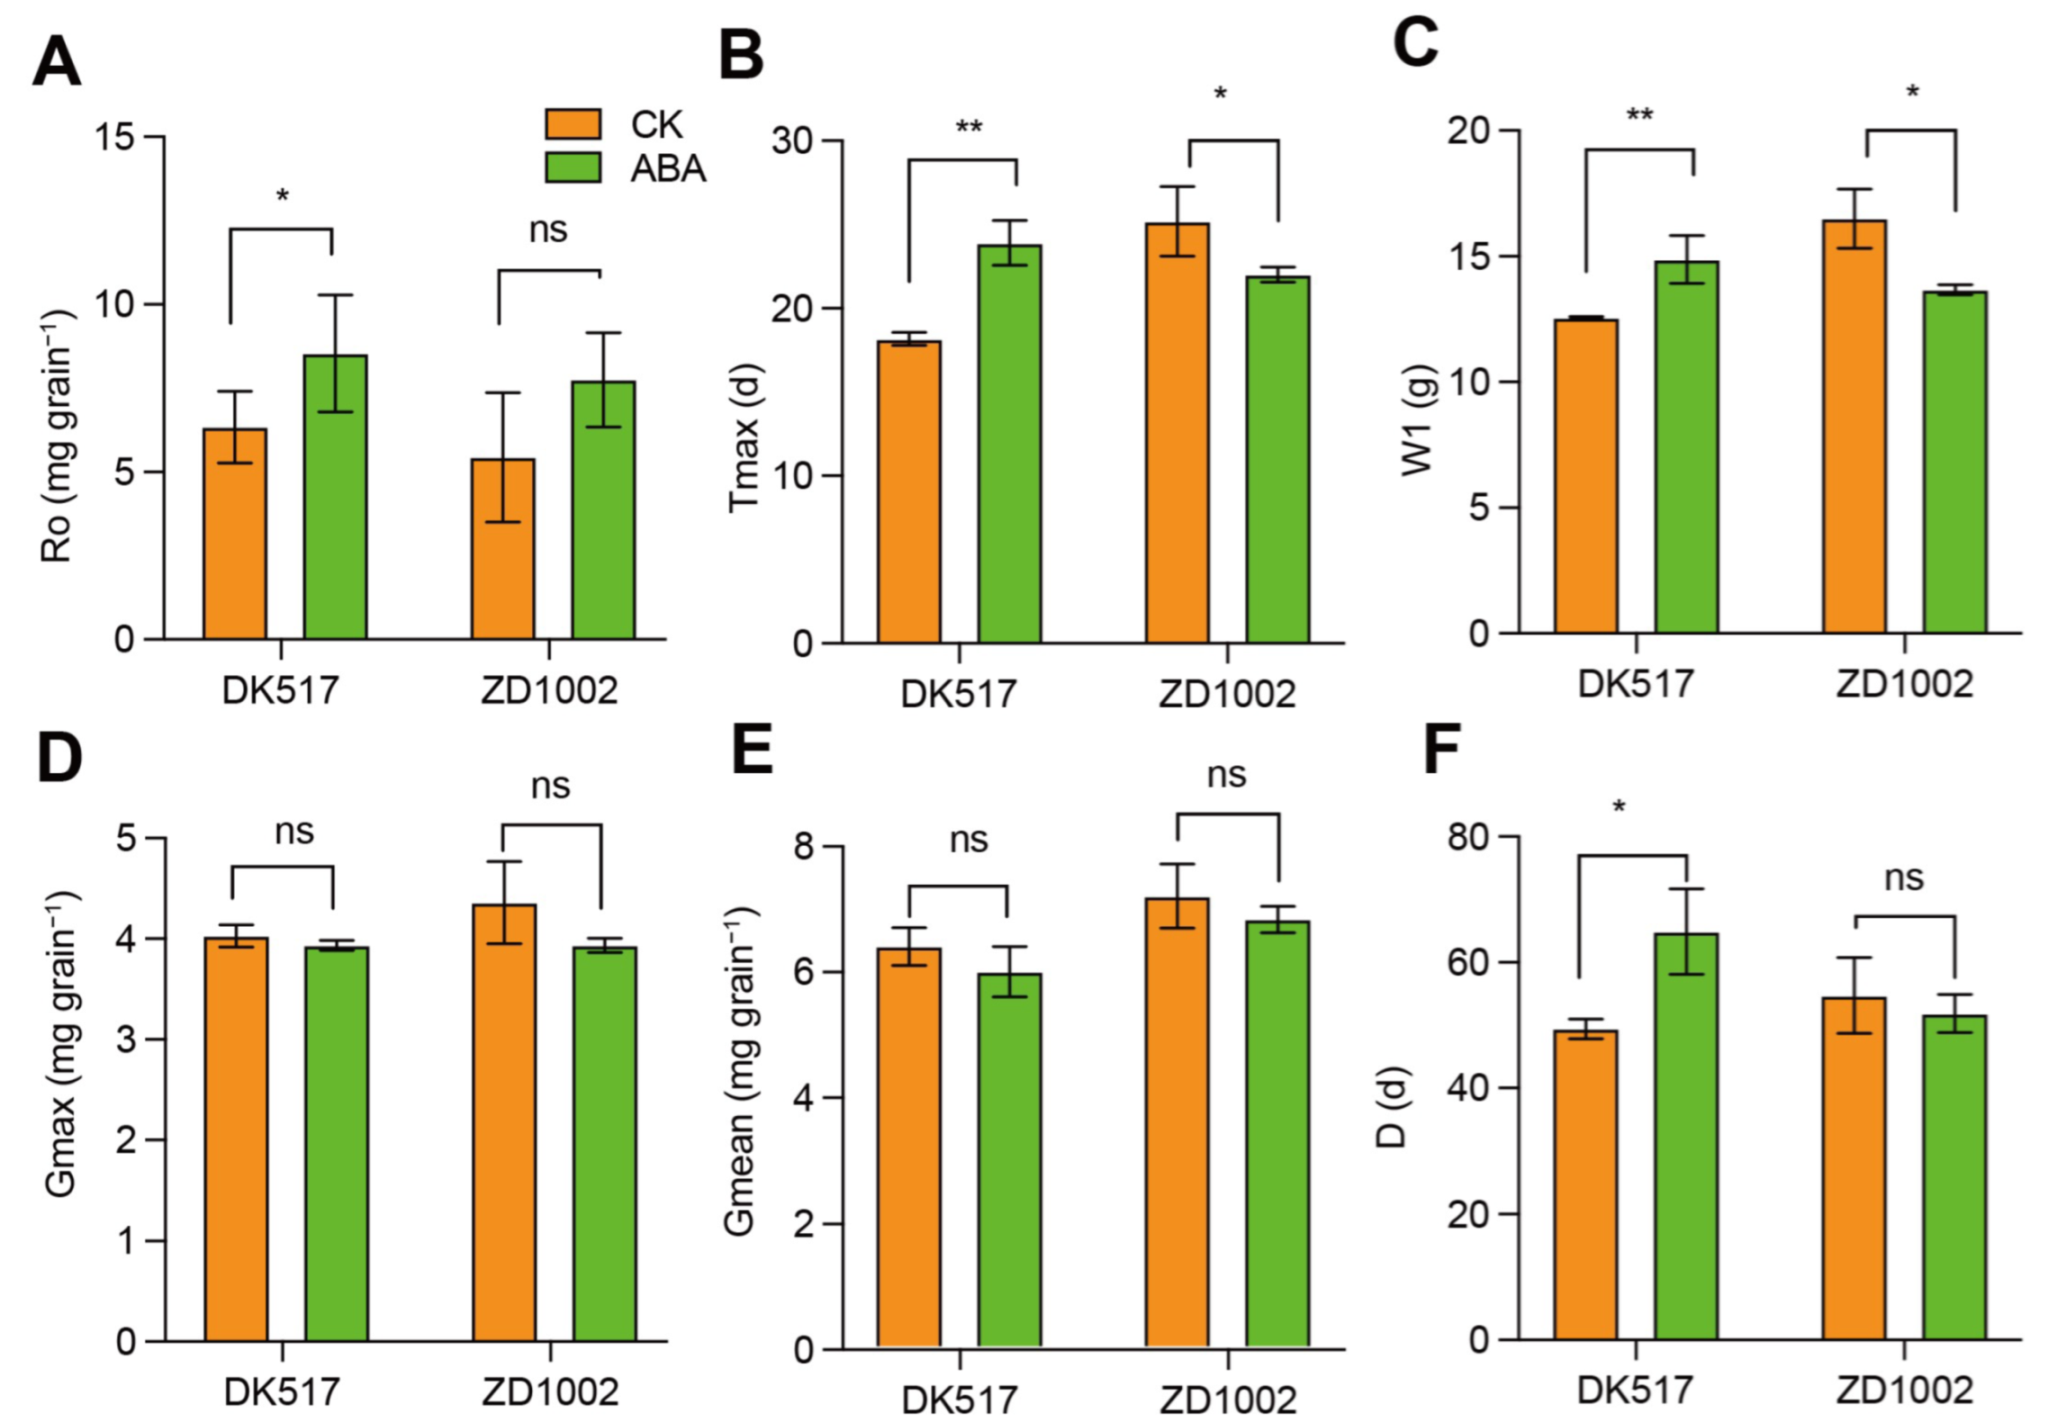
3.1. Effects of Exogenous ABA on Yield in Two Maize Genotypes

The application of exogenous ABA resulted in a significantly higher yield in ZD1002 compared to DK517, reaching a maximum value of 12,996 kg hm−2 (Figure 1A). Notably, exogenous ABA caused a substantial yield reduction of 27.69% in DK517 and 6.13% in ZD1002 (Figure 1A). This reduction was more pronounced in DK517 than in ZD1002, highlighting the differential impact of exogenous ABA on the yield of these two maize genotypes.

3.2. Effects of Exogenous ABA on Dynamic Changes in the Grain Water Content

Exogenous ABA significantly influenced kernel water content at different grain-filling stages compared to the control (CK) (Figure 1B). Specifically, at 53 days after pollination, ABA treatment led to a substantial 23.55% reduction in kernel water content in DK517 when compared to the CK, while ZD1002 exhibited a slight decrease of only 0.26% in kernel water content due to ABA effects (Figure 1B). ABA induced a significant reduction in kernel water content in DK517, while it had no significant effect on ZD1002 across various grain-filling stages.

3.3. Effect of Exogenous ABA on Grain-Filling Characteristics

The application of exogenous ABA extended the duration of grain-filling, with variations in its effects on maximum grain-filling and the timing of maximum grain-filling among different maize genotypes. ABA induced a substantial 30% increase in the initial filling potential (Ro) in DK517 and a 17% increase in ZD1002 (Figure 2A). Regarding the timing of maximum grain-filling, ABA led to a 28% increase in DK517 but a 15% decrease in ZD1002 (Figure 2B). Similarly, ABA induced a 13% increase in grain weight at maximum filling (W1) in DK517 but a 15% decrease in ZD1002 (Figure 2C). There was no significant difference in grain weight at maximum filling (W1), maximum grain-filling (Gmax), or average grain-filling (Gmean) between the ABA-treated samples and the CK for both maize genotypes (Figure S1A–C). These results underscore the pronounced impact of ABA treatment on grain-filling characteristics in maize genotypes characterized by rapid dehydration [49].

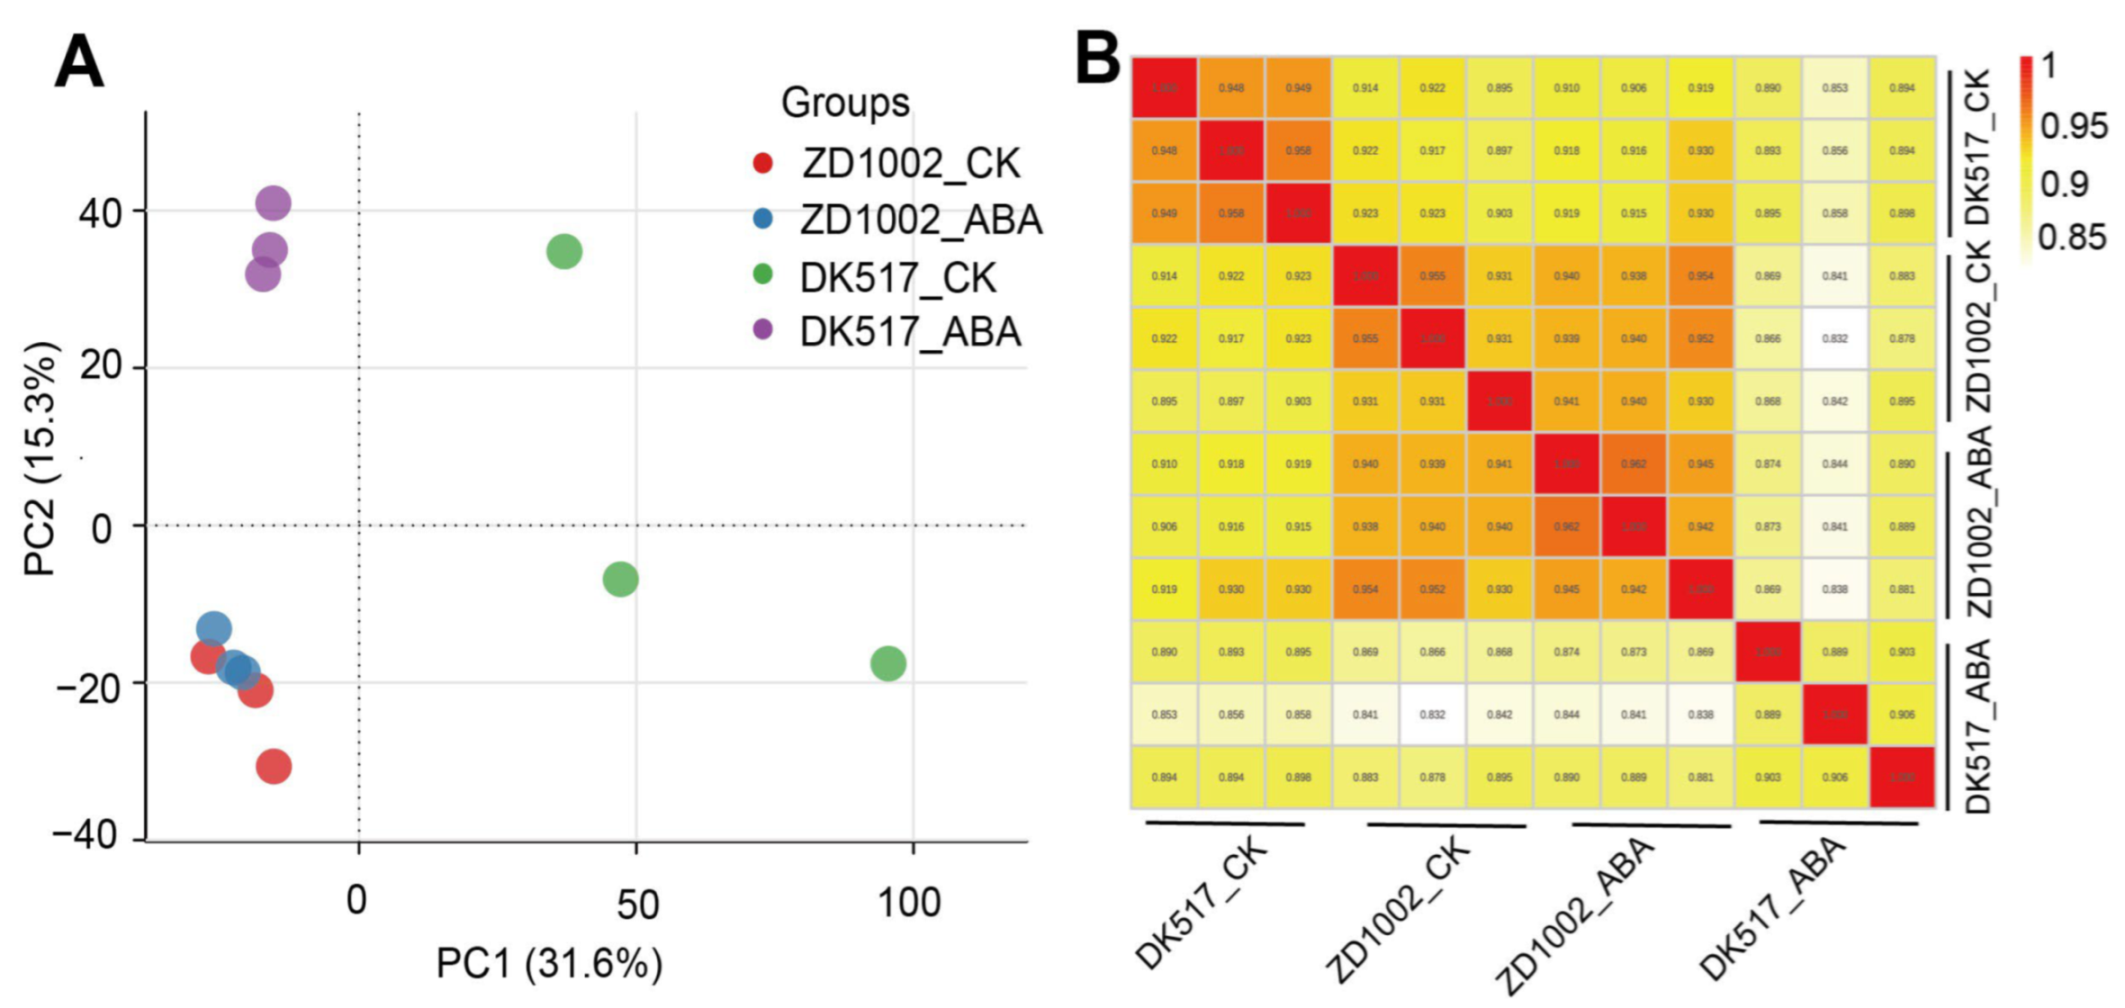
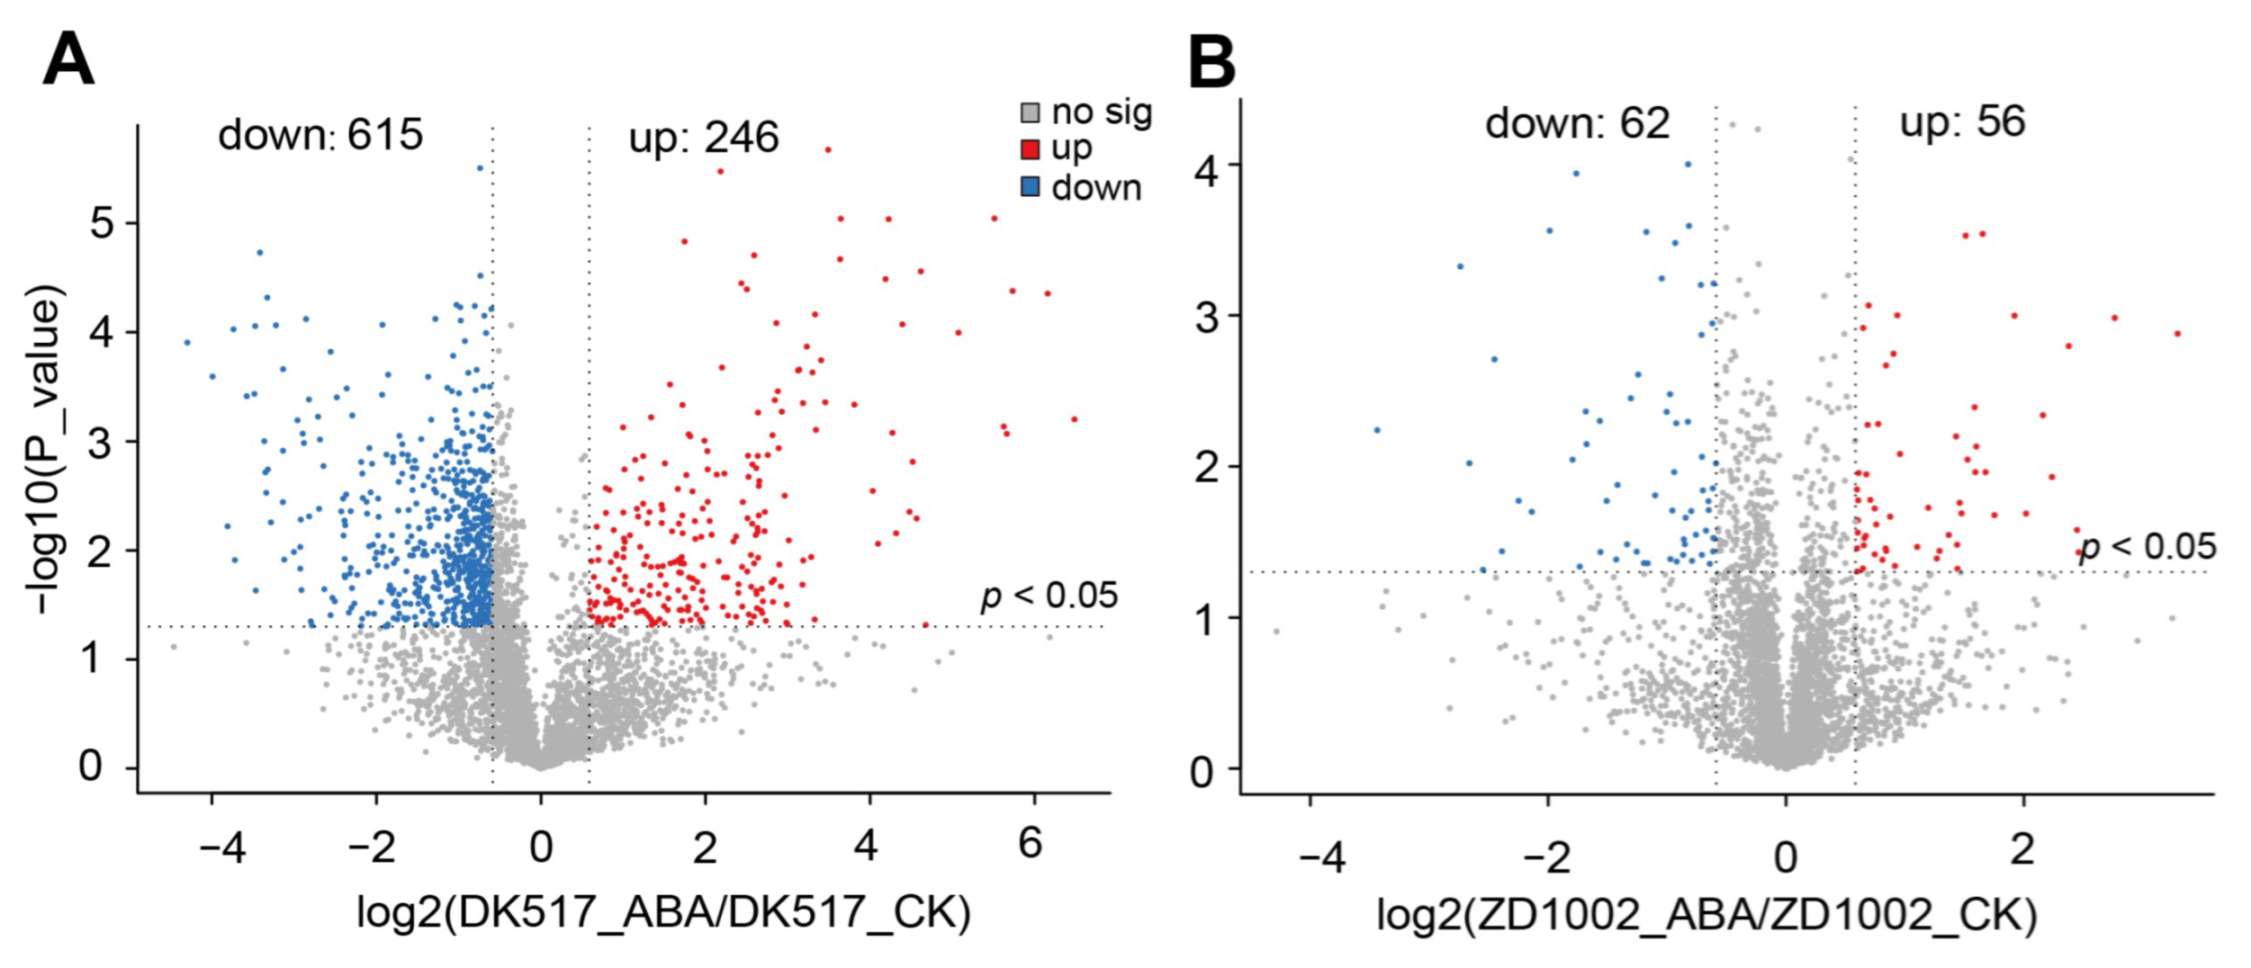
3.4. Screening of Differential Proteins in Each Maize Variety

To gain deeper insights into the alterations in global proteins induced by ABA, we conducted a proteomic analysis on two maize genotypes. The analysis involved protein extraction, separation using mass spectrometry, and subsequent identification through database matching. We identified 36,855 peptides corresponding to 4998 proteins from the 12 samples, encompassing two maize genotypes and two treatments (Table S2). Most identified proteins, 4742, were successfully quantified (Table S2). The identified proteins were associated with four peptides (Figure S2A), and the average peptide length was approximately 16 bp (Figure S2B). Approximately 12% of the proteins were quantified, constituting a significant portion of the identified proteins (Figure S3).

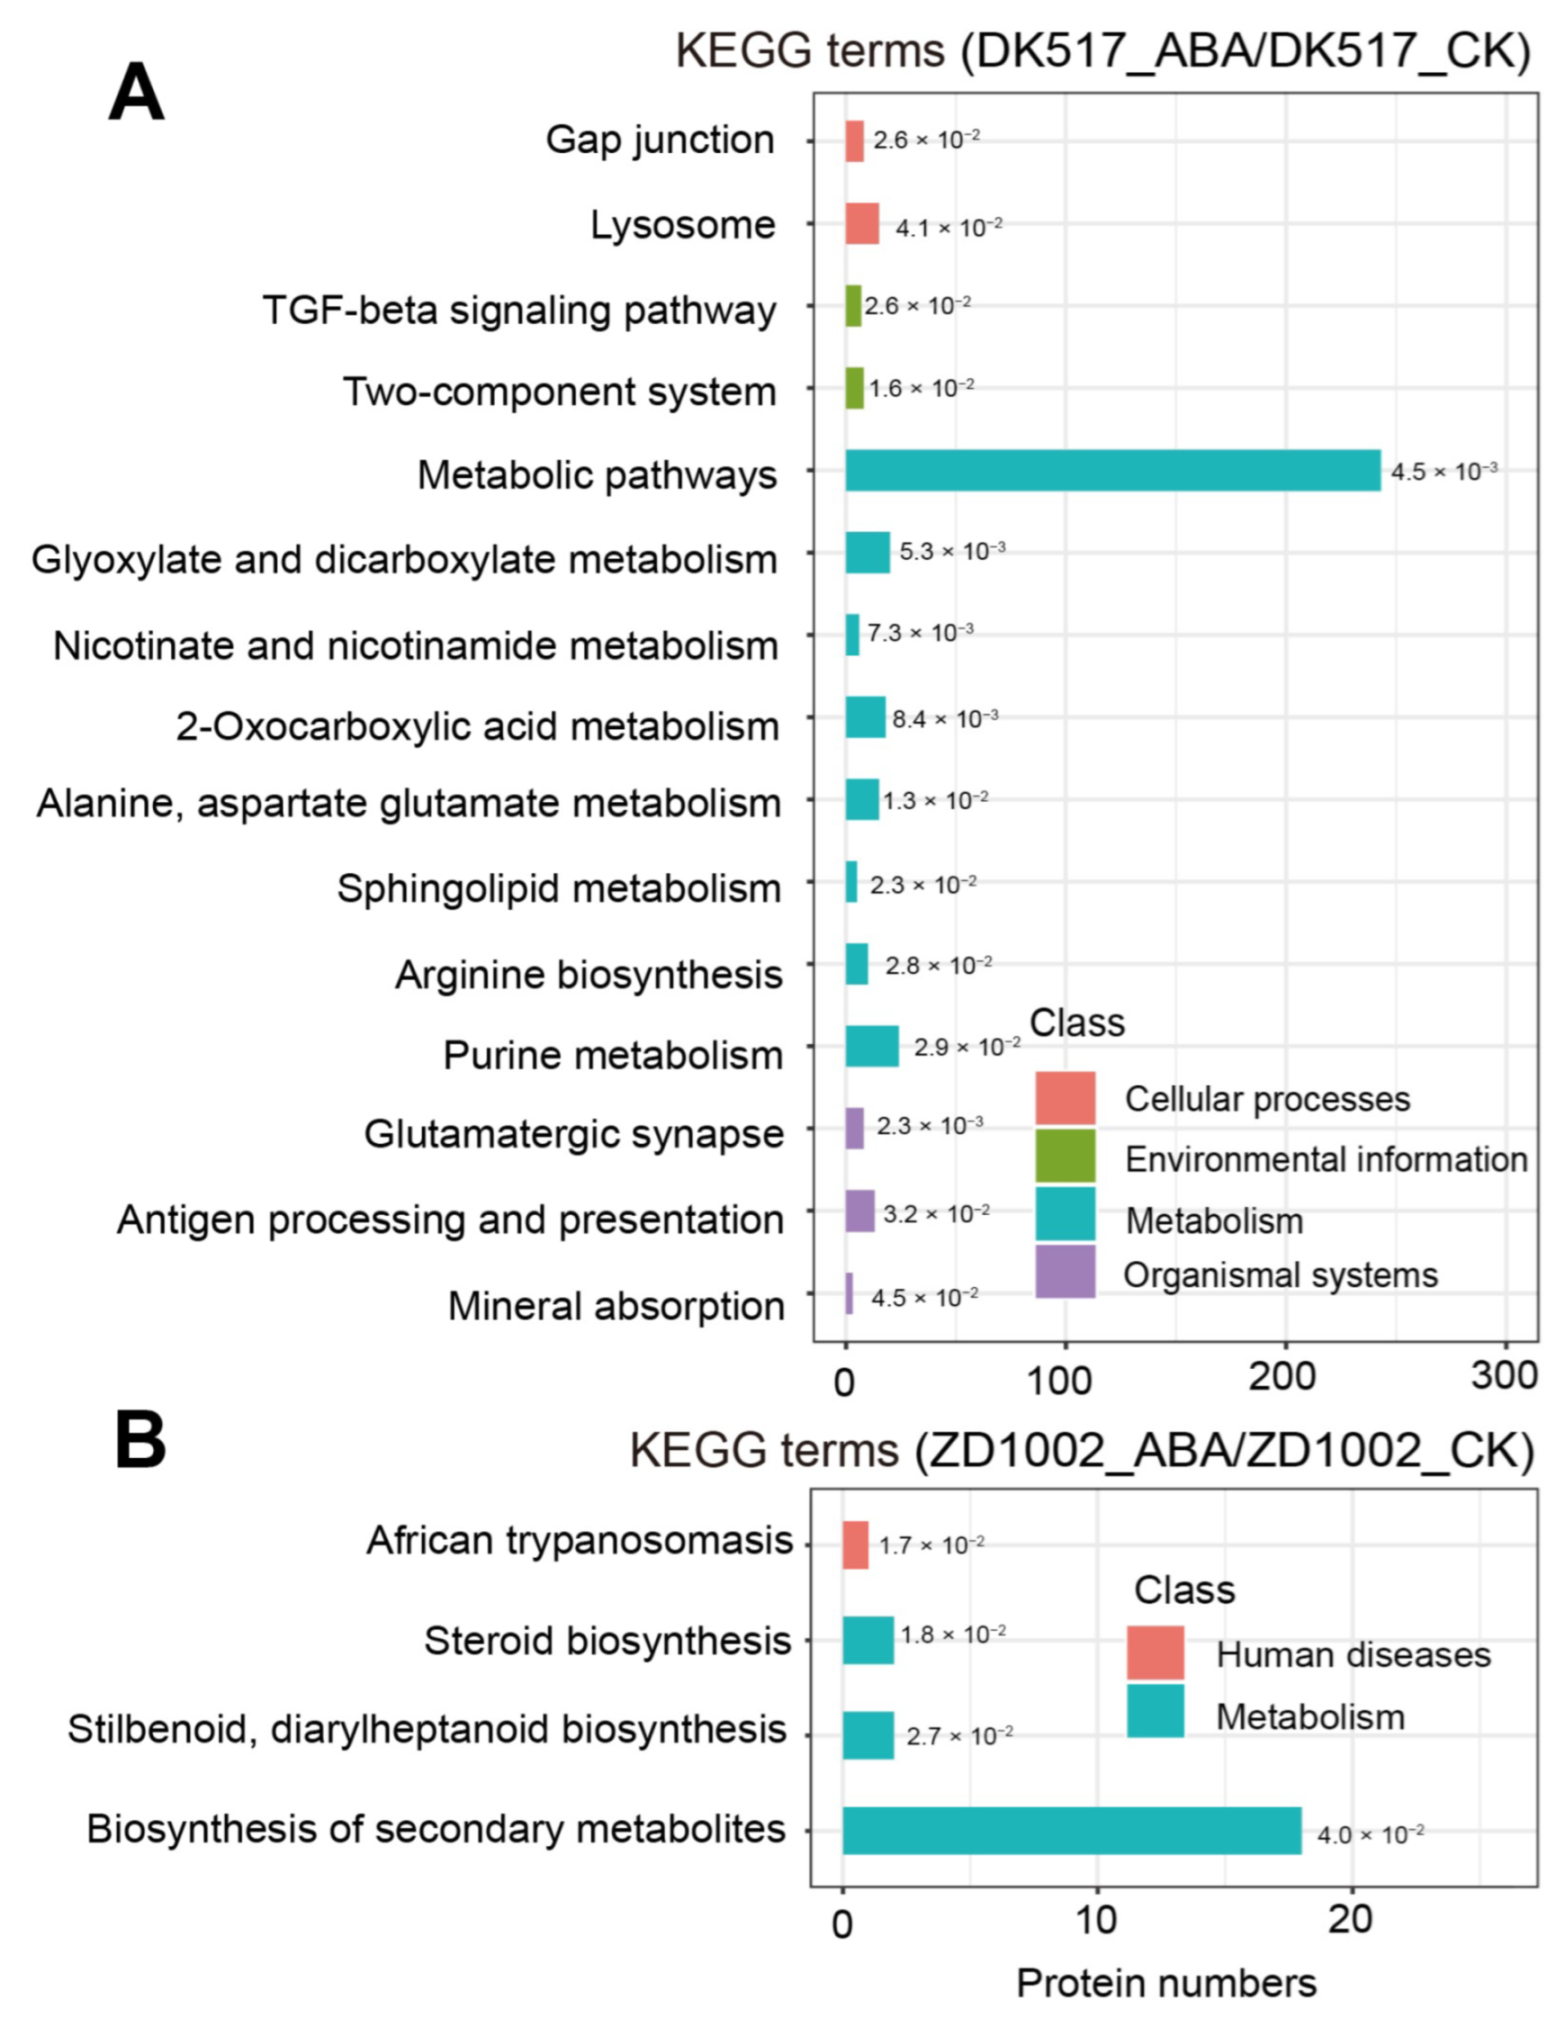
3.5. Proteomic Analysis of DK517 Treated with Exogenous ABA

Principal component analysis (PCA) derived PC1 and PC2 scores of 31.6% and 15.3%, respectively (Figure 3A). The analysis of biological sample relatedness revealed a high level of repeatability within each group (Figure 3B), affirming the reliability of the proteomics analysis conducted in this study. We identified 615 downregulated differentially abundant proteins (DAPs) and 246 upregulated DAPs in response to ABA treatment in DK517 (Figure 4A). In ZD1002, we observed 62 downregulated DAPs and 56 upregulated DAPs upon ABA treatment (Figure 4B).
The GO analysis revealed that the 861 DAPS identified in DK517 in response to ABA treatment were associated with various biological processes. Processes related to primary metabolic processes, nitrogen compound metabolic processes, ammonia assimilation cycle, and hormone metabolic processes were significantly enriched (Figure 5A). In ZD1002, the DAPs were more closely linked to biological pathways involving pigment metabolic process, vacuolar transport, and detoxification of nitrogen component (Figure 5B).
In the KEGG analysis of DAPs in DK517 induced by ABA, we identified significant enrichment in metabolic pathways, including glutamatergic synapse, glyoxylate and dicarboxylate metabolism, nicotinate and nicotinamide metabolism, 2-oxocarboxylic acid metabolism, alanine, aspartate and glutamate metabolism, the TGF-beta signaling pathway, arginine biosynthesis, purine metabolism, and mineral absorption (Figure 6A). In contrast, the DAPs in ZD1002 induced by ABA demonstrated significant enrichment in metabolic pathways associated with steroid biosynthesis, biosynthesis of secondary metabolites, and stilbenoid and diarylheptanoid biosynthesis (Figure 6B).

3.6. Key DAPs Associated with Kernel Water Contents Induced by ABA

ABA is a well-known pathway encompassing numerous genes. The pathways related to the hormone metabolic process were significantly enriched in the list of DAPs in DK517 but not in ZD1002 in response to ABA treatments (Figure 5A,B). Particularly, six DAPs linked to hormone metabolic processes exhibited a reduction in DK517 but not in ZD1002 in the presence of ABA (Figure S4A–F; Table S3). These six DAPs include A0A1D6KV60 (Anther ear1, EAR1), B4G058 (4-coumarate-CoA ligase-like 5, 4CCoA5), Q6VWG3 (flavone 3′-O-methyltransferase 1, F3O1), C0P676 (SNF1-related protein kinase, SnRK2), A0A1D6PF37 (senescence/dehydration-associated protein-related, DRE1) and B6TL27 (ABA-induced protein, ABI1). In our quest to identify the key DAPs associated with kernel water content changes induced by ABA in two maize genotypes, we compared the overlapping DAPs. Our results reveal that 24 DAPs were upregulated in DK517 while being downregulated in ZD1002 due to ABA, such as trehalose- 6-phosphate synthase (K7V516), vacuolar sorting protein 28 (B6TVZ1), WD repeat-containing protein (B8A1L6), DNA binding protein isoform (K7UBM6), cytochrome c (P00056), pyruvate kinase (K7TPR9), and calcium ion binding protein (B6SSY1) (Figure 7A; Figure S5; Table S4). Conversely, 15 DAPs exhibited upregulation in ZD1002 while downregulated in DK517 include 5′-nucleotidase (A0A1D6GLD), vacuolar sorting protein 28 (B6TVZ1), trehalose-6-phosphate synthase (K7V516), and cyclic phosphodiesterase (C0P8F5) (Figure 7B; Figure S5; Table S5).
To validate our findings, we examined the relative expression levels of genes in the overlapped DAPs list via qPCR. Consistent with the transcript abundance in the transcriptome (Table S4), we observed significantly higher expression of ferredoxin (B6STH7), Cytc (P00056), and PK (K7TPR9) when induced by ABA in DK517. However, the pattern was reversed in ZD1002 (Figure 8A–C). Additionally, the expression levels of DRE1 (A0A1D6PF37), ABI1 (B6TL27), and SnRK2 (C0P676) were inhibited by ABA in DK517, whereas there was no significant difference in ZD1002 (Figure 8D–F; Table S3). ABA-induced expression of genes related to the hormone metabolic process, including DRE1, SnRK2, and ABI1 in DK517 but not in ZD1002, consistent with the patterns observed in yield and kernel water content (Figure 8G). Furthermore, ABA-induced reduced expression of genes related to both the photosystem ETC and pyruvate metabolism pathways in ZD1002 but not in DK517, following the pattern of Ro, Tmax, and W1 (Figure 8H).

4. Discussion

Our study delves into the effects of exogenous ABA on two maize genotypes, DK517 and ZD1002, focusing on key agronomic parameters such as yield, grain water content, grain-filling characteristics, and proteomic changes. The results reveal noteworthy differences in how these genotypes respond to ABA treatment, shedding light on the intricate relationship between ABA and maize development. To contextualize our findings, it’s essential to draw parallels with existing research. ABA’s influence on plant growth and development has been extensively explored, forming the foundation for our study. Spraying ABA has significant implications for the grain-filling process in various maize varieties. Our findings align with prior research indicating that ABA content in grains correlates positively with grain weight in the early stages of development and turns negative in the middle and late stages [50]. Our study highlights that the ABA content in grains is directly proportional to the concentration of exogenous ABA application [20]. We observed a consistent trend across maize varieties with maize yields declining after ABA application post-pollination, likely due to the higher ABA concentration [51]. ABA application extended the grain-filling period, reduced the grain-filling rate, and influenced kernel water content through the grain-filling process (Figure 1B and Figure 2A–C). The impact of high ABA concentrations differed among maize varieties with a more pronounced impact on DK517, characterized by a faster kernel dehydration rate. This is consistent with the results of proteomic analysis showing more DAPs in DK517 compared to ZD1002 induced by ABA (Figure 4A,B). The distinct responses of DK517 and ZD1002 to ABA treatment echo documented variations in the effects of exogenous ABA application on different maize genotypes [19,52].
Our research underscores the practical significance of understanding genotype-specific responses to ABA treatment. These findings have profound implications for agriculture, emphasizing the need for tailored ABA management strategies to optimize crop productivity while efficiently managing water resources. Recognizing the differential responses of maize genotypes to ABA paves the way for more efficient and sustainable agricultural practices aligning with the broader goal of food security and resource conservation. Given the distinct responses to ABA application in these two maize genotypes, investigating whether biological pathways were altered due to ABA treatment is warranted. As expected, our analysis revealed significant enrichment of various biological processes, such as primary metabolic processes, nitrogen compound metabolic processes, hormone metabolic processes, and oxidoreductase activities in DAPs from DK517 induced by ABA. However, these pathways were not prominent in ZD1002. Similarly, KEGG analysis indicated significant enrichment in pathways like glyoxylate and dicarboxylate metabolism and alanine, aspartate, and glutamate metabolism in DK517 but not in ZD102. These findings collectively suggest that DK517 is more sensitive to exogenous ABA application, a sensitivity correlated with yield and kernel water content differences between the two maize genotypes.
Our study also explored key genes involved in ABA signaling pathways that help plants sense changing environments [53]. For example, SnRK2, a critical phosphoregulator of ABA signaling showed downregulation in DK517 but remained unaltered in ZD1002 after ABA treatments. The abundance of SnRK2 protein and its gene expression levels in maize (C0P676) were downregulated in DK517 but remained unaltered in ZD1002 (Figure 8F; Figure S4D). Additionally, the dehydration-responsive element (DRE1) is an important cis-acting element in ABA-independent transcription [54]. Additionally, we observed a reduction in the abundance of a DRE-like protein (A0A1D6PF37) in DK517 but not in ZD1002 following ABA treatments (Figure 8D; Table S3). Furthermore, the EAR1 protein, which negatively regulates ABA signaling by enhancing 2C protein phosphatase activity in Arabidopsis [55], was also affected by ABA treatment. These changes in DAPs collectively support the observation of DK517’s greater sensitivity to ABA compared to ZD1002 in this study.
The proteomic analysis conducted in our study enriched our understanding of the molecular processes underlying ABA’s impact on maize. Using proteomics data, we compared the overlap of DAPs resulting from treatment to elucidate further the changes in yield and kernel water content in both maize genotypes. Our analysis identified 24 DAPs that were downregulated in ZD1002 but upregulated in DK517 due to ABA (Figure 7A; Table S4). Additionally, 15 DAPs were upregulated in ZD1002 but downregulated in DK517 (Figure 7B; Table S5). Notably, among the 24 DAPs were proteins such as trehalose-6-phosphate synthase (K7V516), vacuolar sorting protein 28 (B6TVZ1), WD repeat-containing protein (B8A1L6), DNA binding protein isoform (K7UBM6), cytochrome c (P00056), pyruvate kinase (K7TPR9), and calcium ion binding protein (B6SSY1) (Figure 7A). The 15 DAPs include 5′-nucleotidase (A0A1D6GLD), vacuolar sorting protein 28 (B6TVZ1), trehalose-6-phosphate synthase (K7V516), and cyclic phosphodiesterase (C0P8F5) (Figure 7B). We further confirmed that changes in the expression levels of genes, including ferredoxin (B6STH7), Cytc (P00056), and PK (K7TPR9) were strongly associated with yield and kernel water content in both maize genotypes induced by ABA (Figure 8A–C,G). These findings lay the groundwork for future investigations and emphasize the importance of genotype-specific approaches to ABA management in agriculture. Comparative proteomic studies involving different plant species and ABA analogs may offer insights into commonalities and variations in ABA responses across diverse plant systems. In future research, combining metabolomics data could unveil molecular mechanisms behind hormone-related water content changes in maize due to exogenous abscisic acid, providing a comprehensive view of biological processes alongside genomics data.

5. Conclusions

In this study, the application of exogenous ABA post-pollination exerted distinct effects on genotypes, revealing a complex interplay between ABA and maize development. We observed a reduction in yields across different maize genotypes, an increase in the timing of maximum grain-filling, and a decrease in the mean filling rate due to exogenous ABA treatment. Importantly, the impact of exogenous ABA on kernel water contents varied among genotypes, with a more significant positive effect observed in DK517 compared to ZD1002. Furthermore, our proteomic analysis revealed significant differences in the responses of these genotypes to ABA treatment. A total of 861 and 118 DAPs were identified in DK517 and ZD1002, respectively, in response to ABA treatment. These DAPs were associated with various biological processes, including primary metabolic process, nitrogen compound metabolism, hormone metabolism, and oxidoreductase activity. These pathways were significantly enriched in DK517 while being notably absent in ZD1002. Notably, the downregulation of key ABA signaling proteins such as SnRK2 and DRE-like protein, specifically in DK517 without corresponding alterations in ZD1002 induced by ABA, provides insights into the disparate responses of kernel water content in these genotypes to ABA. This observation underscores the intricate and genotype-dependent nature of ABA-mediated effects on maize development.

Supplementary Materials

The following supporting information can be downloaded at: https://www.mdpi.com/article/10.3390/agronomy13122897/s1, Figure S1. Effects of exogenous ABA on grain filling characteristics. A, Gmax (mg/grain): the maximum grain filling rate. B, Gmean (mg/grain): the average grain filling rate. C, D(d): the grain active grain filling period. DK517-A80 and ZD1002: treatment of each variety with exogenous ABA, DK517-CK, and ZD1002-CK: control treatment. Symbols “*” and “**” represents the significant differences at p < 0.05 and 0.01, respectively, while “ns” represents no significant differences due to ABA treatments. n = 3 for panels A–C. Figure S2. Distribution of peptide properties identified by proteomics analysis across ABA and control in two maize genotypes. A, peptides count. B, peptide length. Figure S3. Summary of protein numbers identified by proteomics analysis on ABA effects in two maize genotypes. Figure S4. Abundance of proteins involved in hormone metabolic process based on proteomics analysis. A, A0A1D6KV60 (Anther ear1). B, B4G058 (4-coumarate-CoA ligase-like 5). C, Q6VWG3 (flavone 3′-O-methyltransferase 1). D, C0P676 (SNF1-related protein kinase). E, A0A1D6PF37 (senescence/dehydration-associated protein-related). F, B6TL27(ABA-induced protein). For panels A–F, n = 3. Figure S5. Venn diagram of DAPs in two maize genotypes induced by ABA treatments. Table S1. Primer list in this study. Table S2. Summary of proteins and peptides identified based on proteomics analysis. Table S3. Fifteen DAPs related to hormone metabolic process with downregulation in DK517, but no significance in ZD1002 induced by ABA. Table S4. Twenty-four overlapped DAPs with upregulation in DK517, and downregulation in ZD1002 induced by ABA. Table S5. Fifteen overlapped DAPs with downregulation in DK517, and upregulation in ZD1002 induced by ABA.

Author Contributions

J.H. and C.L. equally contributed to this work. Z.I. review, editing, validation, and formal analysis. J.Q. and C.L. conceived and designed the experiments. J.H., H.G. and W.M. performed the experiments. J.N., M.Z. and P.Z. participated in the data analysis. J.H. and C.L. drafted the manuscript. J.Q. and R.S. provided guidance for preparing the manuscript. All authors have read and agreed to the published version of the manuscript.

Funding

This work was supported by Henan Academy of Agricultural Sciences Outstanding Youth Science and Technology Fund (2022YQ21), Henan Academy of Agricultural Sciences Independent Innovation Project Fund (2023ZC006), and Henan Academy of Agricultural Sciences Independent Innovation Project Fund (2023ZC013).

Data Availability Statement

Data are contained within the article and Supplementary Materials.

Conflicts of Interest

The authors have no relevant financial or non-financial interests to disclose.

References

  1. Revilla, P.; Alves, M.L.; Andelković, V.; Balconi, C.; Dinis, I.; Mendes-Moreira, P.; Redaelli, R.; Ruiz de Galarreta, J.I.; Vaz Patto, M.C.; Žilić, S. Traditional foods from maize (Zea mays L.) in Europe. Front. Nutr. 2022, 8, 683399. [Google Scholar] [CrossRef] [PubMed]
  2. Hasan, K.; Tanaka, T.S.; Alam, M.; Ali, R.; Saha, C.K. Impact of modern rice harvesting practices over traditional ones. Rev. Agric. Sci. 2020, 8, 89–108. [Google Scholar] [CrossRef] [PubMed]
  3. Isaak, M.; Yahya, A.; Razif, M.; Mat, N. Mechanization status based on machinery utilization and workers’ workload in sweet corn cultivation in Malaysia. Comput. Electron. Agric. 2020, 169, 105208. [Google Scholar] [CrossRef]
  4. Jetté-Nantel, S.; Hu, W.; Liu, Y. Economies of scale and mechanization in Chinese corn and wheat production. Appl. Econ. 2020, 52, 2751–2765. [Google Scholar] [CrossRef]
  5. Bamboriya, S.; Jat, S.; Shreelatha, D.; Mahala, D.; Rakshit, S. Mechanized maize production for enhanced productivity and profitability. IIMR Tech. Bull. 2020, 1, 4–46. [Google Scholar]
  6. Chazarreta, Y.D.; Carcedo, A.J.; Prado, S.A.; Massigoge, I.; Amas, J.I.; Fernandez, J.A.; Ciampitti, I.A.; Otegui, M.E. Enhancing maize grain dry-down predictive models. Agric. For. Meteorol. 2023, 334, 109427. [Google Scholar] [CrossRef]
  7. Shahini, E.; Shehu, D.; Kovalenko, O.; Nikonchuk, N. Comparative analysis of the main economic and biological parameters of maize hybrids that determine their productivity. Sci. Horiz. 2023, 26, 86–96. [Google Scholar] [CrossRef]
  8. Shuqi, S.; Jiasheng, W.; Dongwei, W. Development of Agricultural Mechanization in China and Its Current Strategic Focus. Agric. Mach. Technol. 2019, 13, 4–7. [Google Scholar] [CrossRef]
  9. Alam, M.R.; Nakasathien, S.; Molla, M.S.H.; Islam, M.A.; Maniruzzaman, M.; Ali, M.A.; Sarobol, E.; Vichukit, V.; Hassan, M.M.; Dessoky, E.S. Kernel water relations and kernel filling traits in maize (Zea mays L.) are influenced by water-deficit condition in a tropical environment. Front. Plant Sci. 2021, 12, 717178. [Google Scholar] [CrossRef]
  10. Becerra-Sanchez, F.; Taylor, G. Reducing post-harvest losses and improving quality in sweet corn (Zea mays L.): Challenges and solutions for less food waste and improved food security. Food Energy Secur. 2021, 10, e277. [Google Scholar] [CrossRef]
  11. Gambin, B.L.; Di Salvo, J.I.; Sciarresi, C.; Trifunovic, S.; Narvel, J.; Zhou, X.; Lamkey, K.; Archontoulis, S.V. Maize kernel weight genetic gain is achieved through different mechanisms depending on the hybrid maturity. Field Crops Res. 2023, 303, 109123. [Google Scholar] [CrossRef]
  12. Li, W.; Yu, Y.; Wang, L.; Luo, Y.; Peng, Y.; Xu, Y.; Liu, X.; Wu, S.; Jian, L.; Xu, J. The genetic architecture of the dynamic changes in grain moisture in maize. Plant Biotechnol. J. 2021, 19, 1195–1205. [Google Scholar] [CrossRef]
  13. Maiorano, A.; Fanchini, D.; Donatelli, M. MIMYCS.Moisture, a process-based model of moisture content in developing maize kernels. Eur. J. Agron. 2014, 59, 86–95. [Google Scholar] [CrossRef]
  14. Suganya, A.; Saravanan, A.; Manivannan, N. Role of zinc nutrition for increasing zinc availability, uptake, yield, and quality of maize (Zea mays L.) grains: An overview. Commun. Soil Sci. Plant Anal. 2020, 51, 2001–2021. [Google Scholar]
  15. Ordóñez, R.A.; Savin, R.; Cossani, C.M.; Slafer, G.A. Maize grain weight sensitivity to source–sink manipulations under a wide range of field conditions. Crop Sci. 2018, 58, 2542–2557. [Google Scholar] [CrossRef]
  16. Ramos-Fuentes, I.A.; Elamri, Y.; Cheviron, B.; Dejean, C.; Belaud, G.; Fumey, D. Effects of shade and deficit irrigation on maize growth and development in fixed and dynamic agrivoltaic systems. Agric. Water Manag. 2023, 280, 108187. [Google Scholar] [CrossRef]
  17. Paul, S.; Roychoudhury, A. Comparative analysis of the expression of candidate genes governing salt tolerance and yield attributes in two contrasting rice genotypes, encountering salt stress during grain development. J. Plant Growth Regul. 2019, 38, 539–556. [Google Scholar] [CrossRef]
  18. Wang, Z.; Xu, Y.; Chen, T.; Zhang, H.; Yang, J.; Zhang, J. Abscisic acid and the key enzymes and genes in sucrose-to-starch conversion in rice spikelets in response to soil drying during grain filling. Planta 2015, 241, 1091–1107. [Google Scholar] [CrossRef]
  19. Li, Y.; Yu, G.; Lv, Y.; Long, T.; Li, P.; Hu, Y.; Liu, H.; Zhang, J.; Liu, Y.; Li, W.-C. Combinatorial interaction of two adjacent cis-active promoter regions mediates the synergistic induction of Bt2 gene by sucrose and ABA in maize endosperm. Plant Sci. 2018, 274, 332–340. [Google Scholar] [CrossRef]
  20. Zhang, L.; Liang, X.-G.; Shen, S.; Yin, H.; Zhou, L.-L.; Gao, Z.; Lv, X.-Y.; Zhou, S.-L. Increasing the abscisic acid level in maize grains induces precocious maturation by accelerating grain filling and dehydration. Plant Growth Regul. 2018, 86, 65–79. [Google Scholar] [CrossRef]
  21. Zhang, D.; Zhang, M.; Wang, Y.; Liang, J. RGB1 regulates rice panicle architecture and grain filling through monitoring cytokinin level in inflorescence meristem and grain abscisic acid level during filling stage. Rice Sci. 2021, 28, 317. [Google Scholar]
  22. Ahmad, S.; Kamran, M.; Zhou, X.; Ahmad, I.; Meng, X.; Javed, T.; Iqbal, A.; Wang, G.; Su, W.; Wu, X. Melatonin improves the seed filling rate and endogenous hormonal mechanism in grains of summer maize. Physiol. Plant. 2021, 172, 1059–1072. [Google Scholar] [CrossRef]
  23. Tsukaguchi, T.; Tanaka, R.; Inoue, H.; Nakagawa, H. Effects of high temperature and shading on grain abscisic acid content and grain filling pattern in rice (Oryza sativa L.). Plant Prod. Sci. 2018, 21, 407–412. [Google Scholar] [CrossRef]
  24. Perveen, S.; Qu, M.; Chen, F.; Essemine, J.; Khan, N.; Lyu, M.-J.A.; Chang, T.; Song, Q.; Chen, G.-Y.; Zhu, X.-G. Overexpression of maize transcription factor mEmBP-1 increases photosynthesis, biomass, and yield in rice. J. Exp. Bot. 2020, 71, 4944–4957. [Google Scholar] [CrossRef] [PubMed]
  25. Tian, L.-x.; Li, J. The effects of exogenous ABA applied to maize (Zea mays L.) roots on plant responses to chilling stress. Acta Physiol. Plant. 2018, 40, 1–13. [Google Scholar] [CrossRef]
  26. Zhang, L.; Li, X.-H.; Gao, Z.; Shen, S.; Liang, X.-G.; Zhao, X.; Lin, S.; Zhou, S.-L. Regulation of maize kernel weight and carbohydrate metabolism by abscisic acid applied at the early and middle post-pollination stages in vitro. J. Plant Physiol. 2017, 216, 1–10. [Google Scholar] [CrossRef]
  27. Hu, J.; Ren, B.; Dong, S.; Liu, P.; Zhao, B.; Zhang, J. Comparative proteomic analysis reveals that exogenous 6-benzyladenine (6-BA) improves the defense system activity of waterlogged summer maize. BMC Plant Biol. 2020, 20, 1–19. [Google Scholar] [CrossRef] [PubMed]
  28. Gao, Z.-F.; Shen, Z.; Chao, Q.; Yan, Z.; Ge, X.-L.; Lu, T.; Zheng, H.; Qian, C.-R.; Wang, B.-C. Large-scale proteomic and phosphoproteomic analyses of maize seedling leaves during de-etiolation. Genom. Proteom. Bioinform. 2020, 18, 397–414. [Google Scholar] [CrossRef]
  29. Labuschagne, M. A review of cereal grain proteomics and its potential for sorghum improvement. J. Cereal Sci. 2018, 84, 151–158. [Google Scholar] [CrossRef]
  30. Kim, J.-T.; Yi, G.; Kim, M.-J.; Son, B.-Y.; Bae, H.-H.; Go, Y.S.; Kim, S.-L.; Baek, S.-B.; Kim, S.-H.; Chung, I.-M. Glycolysis stimulation and storage protein accumulation are hallmarks of maize (Zea mays L.) grain filling. Appl. Biol. Chem. 2020, 63, 1–10. [Google Scholar] [CrossRef]
  31. Landolfi, V.; D’Auria, G.; Nicolai, M.A.; Nitride, C.; Blandino, M.; Ferranti, P. The effect of nitrogen fertilization on the expression of protein in wheat and tritordeum varieties using a proteomic approach. Food Res. Int. 2021, 148, 110617. [Google Scholar] [CrossRef]
  32. Yang, G.; Dong, Y.; Li, Y.; Wang, Q.; Shi, Q.; Zhou, Q. QTL verification of grain protein content and its correlation with oil content by using connected RIL populations of high-oil maize. Genet. Mol. Res. 2014, 13, 881–894. [Google Scholar] [CrossRef]
  33. Zhao, Q.; Lin, J.; Yousaf, L.; Xue, Y.; Shen, Q. Protein structural properties and proteomic analysis of rice during storage at different temperatures. Food Chem. 2021, 361, 130028. [Google Scholar] [CrossRef]
  34. Li, H.; Wang, Y.; Xue, J.; Xie, R.; Wang, K.; Zhao, R.; Liu, W.; Ming, B.; Hou, P.; Zhang, Z. Allocation of maize varieties according to temperature for use in mechanical kernel harvesting in Ningxia, China. Int. J. Agric. Biol. Eng. 2021, 14, 20–28. [Google Scholar] [CrossRef]
  35. Yang, D.; Luo, Y.; Ni, Y.; Yin, Y.; Yang, W.; Peng, D.; Cui, Z.; Wang, Z. Effects of exogenous ABA application on post-anthesis dry matter redistribution and grain starch accumulation of winter wheat with different staygreen characteristics. Crop J. 2014, 2, 144–153. [Google Scholar] [CrossRef]
  36. Bakry, M.; Abdel-Baky, N.F. Impact of the fall armyworm, Spodoptera frugiperda (Lepidoptera: Noctuidae) infestation on maize growth characteristics and yield loss. Braz. J. Biol. 2023, 84, e274602. [Google Scholar] [CrossRef]
  37. Liang, C.; Song, Y.; Guo, X.; Kong, D.; Wang, Y.; Zhao, Q.; Huang, K. Characteristics of the grain-filling process and starch accumulation of high-yield common buckwheat ‘cv. Fengtian 1’and tartary buckwheat ‘cv. Jingqiao 2’. Cereal Res. Commun. 2016, 44, 393–403. [Google Scholar] [CrossRef]
  38. Li, J.; Essemine, J.; Shang, C.; Zhang, H.; Zhu, X.; Yu, J.; Chen, G.; Qu, M.; Sun, D. Combined proteomics and metabolism analysis unravels prominent roles of antioxidant system in the prevention of alfalfa (Medicago sativa L.) against salt stress. Int. J. Mol. Sci. 2020, 21, 909. [Google Scholar] [CrossRef]
  39. Jiang, C.; Bi, Y.; Mo, J.; Zhang, R.; Qu, M.; Feng, S.; Essemine, J. Proteome and transcriptome reveal the involvement of heat shock proteins and antioxidant system in thermotolerance of Clematis florida. Sci. Rep. 2020, 10, 8883. [Google Scholar] [CrossRef]
  40. Karimi, F.; Hamidian, Y.; Behrouzifar, F.; Mostafazadeh, R.; Ghorbani-HasanSaraei, A.; Alizadeh, M.; Mortazavi, S.-M.; Janbazi, M.; Asrami, P.N. An applicable method for extraction of whole seeds protein and its determination through Bradford’s method. Food Chem. Toxicol. 2022, 164, 113053. [Google Scholar] [CrossRef] [PubMed]
  41. Välikangas, T.; Suomi, T.; Elo, L.L. A comprehensive evaluation of popular proteomics software workflows for label-free proteome quantification and imputation. Brief. Bioinform. 2018, 19, 1344–1355. [Google Scholar] [CrossRef]
  42. Yan, S.; Bhawal, R.; Yin, Z.; Thannhauser, T.W.; Zhang, S. Recent advances in proteomics and metabolomics in plants. Mol. Hortic. 2022, 2, 17. [Google Scholar] [CrossRef] [PubMed]
  43. Coudert, E.; Gehant, S.; de Castro, E.; Pozzato, M.; Baratin, D.; Neto, T.; Sigrist, C.J.; Redaschi, N.; Bridge, A. Annotation of biologically relevant ligands in UniProtKB using ChEBI. Bioinformatics 2023, 39, btac793. [Google Scholar] [CrossRef]
  44. Huerta-Cepas, J.; Forslund, K.; Coelho, L.P.; Szklarczyk, D.; Jensen, L.J.; Von Mering, C.; Bork, P. Fast genome-wide functional annotation through orthology assignment by eggNOG-mapper. Mol. Biol. Evol. 2017, 34, 2115–2122. [Google Scholar] [CrossRef]
  45. Sajulga, R.; Easterly, C.; Riffle, M.; Mesuere, B.; Muth, T.; Mehta, S.; Kumar, P.; Johnson, J.; Gruening, B.A.; Schiebenhoefer, H. Survey of metaproteomics software tools for functional microbiome analysis. PLoS ONE 2020, 15, e0241503. [Google Scholar] [CrossRef]
  46. Song, J.; Lu, D.; Niu, Y.; Sun, H.; Zhang, P.; Dong, W.; Li, Y.; Zhang, Y.; Lu, L.; Men, Q. Label-free quantitative proteomics of maize roots from different root zones provides insight into proteins associated with enhance water uptake. BMC Genom. 2022, 23, 1–22. [Google Scholar] [CrossRef] [PubMed]
  47. Hamdani, S.; Wang, H.; Zheng, G.; Perveen, S.; Qu, M.; Khan, N.; Khan, W.; Jiang, J.; Li, M.; Liu, X. Genome-wide association study identifies variation of glucosidase being linked to natural variation of the maximal quantum yield of photosystem II. Physiol. Plant. 2019, 166, 105–119. [Google Scholar] [CrossRef] [PubMed]
  48. Livak, K.J.; Schmittgen, T.D. Analysis of relative gene expression data using real-time quantitative PCR and the 2−ΔΔCT method. Methods 2001, 25, 402–408. [Google Scholar] [CrossRef]
  49. Li, L.-L.; Bo, M.; Jun, X.; Shang, G.; Wang, K.-R.; Xie, R.-Z.; Peng, H.; Li, S.-K. Difference in corn kernel moisture content between pre-and post-harvest. J. Integr. Agric. 2021, 20, 1775–1782. [Google Scholar] [CrossRef]
  50. Minghui, D.; Junrong, G.; Peifeng, C. Difference of abscisic acid content in grains at different spikelet positions of rice and its relationship with grain filling. Plant Physiol. J. 2013, 49, 729–737. [Google Scholar]
  51. Zhu, G.; Ye, N.; Yang, J.; Peng, X.; Zhang, J. Regulation of expression of starch synthesis genes by ethylene and ABA in relation to the development of rice inferior and superior spikelets. J. Exp. Bot. 2011, 62, 3907–3916. [Google Scholar] [CrossRef] [PubMed]
  52. Jin, X.; Zhai, H.; Wang, P.; Zhang, X.; Wu, X.; Zhang, H.; Chen, S.; Huang, Z. Physiological and omics analysis of maize inbred lines during late grain development. Genes Genom. 2022, 44, 993–1006. [Google Scholar] [CrossRef]
  53. Soma, F.; Takahashi, F.; Yamaguchi-Shinozaki, K.; Shinozaki, K. Cellular phosphorylation signaling and gene expression in drought stress responses: ABA-dependent and ABA-independent regulatory systems. Plants 2021, 10, 756. [Google Scholar] [CrossRef] [PubMed]
  54. Yoshida, T.; Mogami, J.; Yamaguchi-Shinozaki, K. ABA-dependent and ABA-independent signaling in response to osmotic stress in plants. Curr. Opin. Plant Biol. 2014, 21, 133–139. [Google Scholar] [CrossRef] [PubMed]
  55. Wang, K.; He, J.; Zhao, Y.; Wu, T.; Zhou, X.; Ding, Y.; Kong, L.; Wang, X.; Wang, Y.; Li, J. EAR1 negatively regulates ABA signaling by enhancing 2C protein phosphatase activity. Plant Cell 2018, 30, 815–834. [Google Scholar] [CrossRef]
Figure 1. Effect of exogenous ABA on maize yield and kernel water contents in two maize genotypes. (A) Effect of exogenous ABA on maize yield; (B) Effects of exogenous ABA on dynamic changes in the kernel water content. DK517: Dika517 (fast dehydration variety), ZD1002: Zhengdan1002 (slow dehydration variety), CK: control. Symbols “*” and “**” represent the significant differences at p < 0.05 and 0.01, respectively, while “ns” represents no significant differences due to ABA treatments. n = 3 for panels. (A,B) The kernel water content at 53 days after ABA treatment was inserted in panel (B), Which was indicated by an arrow in the panel.
Agronomy 13 02897 g001
Figure 2. Effects of exogenous ABA on grain filling characteristics. (A) Ro (mg/grain): the initial filling potential; (B) Tmax(d): timing of the maximum grain filling; (C) W1(g): the grain weight at maximum filling; (D) Gmax (mg grain−1): Gmax represented the maximum filling rate; (E) Gmean (mg grain−1): average rate of filling; (F) D (d) period of active filling; DK517-A80 and ZD1002: treatment of each variety with exogenous ABA, DK517-CK, and ZD1002-CK: control treatment. Symbols “*” and “**” represent the significant differences at p < 0.05 and 0.01, respectively, while “ns” represents no significant differences due to ABA treatments. n = 3 for panels (A,B).
Agronomy 13 02897 g002
Figure 3. Principal component analysis and correlation of biological samples based on proteomics analysis. (A) PCA. (B) Correlation of biological samples in two maize genotypes with ABA treatments. Pearson correlation coefficient (r) was indicated in the correlation matrix.
Agronomy 13 02897 g003
Figure 4. Volcano plots on the differential abundance proteins (DAPs) based on proteomics in two maize genotypes induced by ABA treatments. (A) DAPs in DK517 induced by ABA. (B) DAPs in ZD1002 induced by ABA. Cut-off values for the threshold of DAPs were log2 < −0.587 and log2 > 0.587 regarding downregulated DAPs and upregulated DAPs, respectively.
Agronomy 13 02897 g004
Figure 5. Gene Ontology analysis on DAPs in two maize genotypes induced by ABA. (A) GO terms for DK517. (B) GO terms for ZD1002.
Agronomy 13 02897 g005
Figure 6. Kyoto Encyclopedia of Genes and Genomes analysis on DAPs in two maize genotypes induced by ABA. (A) GO terms for DK517. (B) GO terms for ZD1002.
Agronomy 13 02897 g006
Figure 7. Heatmap of DAPs with contrasting patterns between DK517 and ZD1002 due to ABA effects: (A) 24 overlapped DAPs being upregulated in DK517 and downregulated in ZD1002 induced by ABA; (B) 15 overlapped DAPs being downregulated in DK517 and upregulated in ZD1002 induced by ABA.
Agronomy 13 02897 g007
Figure 8. Expression of genes related to hormone metabolic process explains correlates with kernel water content in two maize genotypes induced by ABA. (AF) Expression levels of B6STH7, P00056, K7TPR9, A0A1D6PF37, B6TL27 and C0P676. The vertical bar represents the mean values (n = 3) ± standard error. Symbols “*”, “**” and “***” represent the significant differences at p < 0.05, 0.01 and 0.10, respectively, while “ns” display no significant differences between CK and ABA groups for each maize genotype. (G,H) Schematic diagram of ABA-induced changes in yield, Ro, Tmax, and W1 through biological pathways identified in this study in two maize genotypes induced by ABA. PC stands for percentage differences in either gene expression levels or measured values of yield traits in the condition of ABA against that of CK. The first cell and second cell under each gene represent DK517 and ZD1002. The detailed names of genes were referred to in Tables S3 and S4.
Agronomy 13 02897 g008
Disclaimer/Publisher’s Note: The statements, opinions and data contained in all publications are solely those of the individual author(s) and contributor(s) and not of MDPI and/or the editor(s). MDPI and/or the editor(s) disclaim responsibility for any injury to people or property resulting from any ideas, methods, instructions or products referred to in the content.

