Abstract
Polyaspartic acid (PASP) is widely used in agriculture owing to its role in promoting crop growth and nutrient absorption, and its effects are correlated with its molecular weight. In this study, a field soil column experiment using a 15N tracer was conducted to compare the effects of urea enhanced by PASPs with different molecular weights on wheat yield, nitrogen uptake by wheat, and nitrogen residue in the soil. The results showed that urea enhanced with PASPs (PASPUs) increased the wheat yield by 2.02–9.77% than conventional urea (CU) through enhancing the wheat spike number. PASPUs promoted wheat nitrogen uptake, and urea enhanced with PASPs of high molecular weight (>10 kDa) significantly promoted total nitrogen uptake, fertilizer–N uptake, and soil–N uptake by 9.92%, 4.65%, and 19.62%, respectively, compared with CU. PASPUs reduced fertilizer–N leaching by increasing its residue in the 30–60 cm soil layer and decreasing its amount in the 60–90 cm soil layer. A comprehensive evaluation based on radar charts showed that PASPs of high molecular weight showed a significant improvement in wheat yield and nitrogen–use efficiency, compared with CU and urea enhanced with other molecular weights, and is the most recommended PASP fraction for enhancing nitrogen utilization.
1. Introduction
Urea is the most commonly used nitrogen–based fertilizer, as it promotes high crop yields and food security worldwide [1]. However, urea exhibits a low use efficiency, largely due to ammonia (NH3) volatilization, nitrous oxide (N2O) emission, and nitrate ion (NO3−) leaching [2]. Therefore, many effective methods to improve urea utilization have been attempted, such as the rational application of urea, controlled–release fertilizers, urease inhibitors, and nitrification inhibitors [3,4]. In recent years, a new type of fertilizer called “Value–Added Fertilizer” emerged. This new fertilizer was produced through incorporating small amounts of bioactive organic synergists into conventional urea during urea production and was characterized by high yield and low cost [5].
Polyaspartic acid (PASP) has a strong absorption capacity for nutrient ions because of the numerous free carboxyl and amide groups in its molecular chains [6]. Thus, PASP can reduce nutrient loss and increase the soil nutrient content [7,8]. PASP has shown a high capacity to stimulate crop growth and nutrient uptake and strengthen crop stress resistance [9,10]. Moreover, PASP is non–toxic, biodegradable, and environmentally friendly. Therefore, PASP can be used as a controlled–release agent and absorption promoter in fertilizers [7,11] and has become a widely used bioactive organic synergist for high–efficiency urea in practice.
Urea enhanced with PASP (PASPU), manufactured through incorporating a small amount of PASP into conventional urea without significantly changing the urea production flowchart, has been gradually industrialized with “Duotai Niaosu” as the trade name for many Chinese fertilizer enterprises [12]. Compared with conventional urea, PASPU application in the production of maize, rice, and other upland plants usually contributes to a higher level of available nutrients in the root–feeding zone and more efficient nutrient utilization [13,14], resulting in a significant increase in nutrient absorption, growth rate, biomass, grain yield and quality, and nutrient use efficiency [7,11,14].
The molecular weight of PASPs varies from thousands to hundreds of thousands of daltons, and it has been verified that PASPs with different molecular weights perform disparately when used as a drug carrier and a biocompatible material [15]. Usually, PASPs with low molecular weight show a higher diffusion coefficient than those with higher molecular weight, which makes PASPs with low molecular weight more suitable for use as a solvent in complex environments [16]. In our previous study, the results showed that PASPs of middle molecular weight had a better effect on wheat root growth and nutrient uptake than PASPs of low or high molecular weight [17]. However, other studies have shown that only PASPs with a specific molecular weight have been selected to investigate the effects of PASPUs on field crop production, and information on the efficacy of PASPUs prepared with different molecular weights is limited, hindering the high–efficiency utilization of PASPs in urea applications.
We hypothesized that PASPs with different molecular weights would have different effects on grain yield and fertilizer–N utilization. Therefore, we conducted a field–soil–column culture experiment in Dezhou City, Shandong Province, North China Plain, and addressed the effects of PASPUs produced through adding PASPs of different molecular weights into melted urea on the biomass and grain yields and on the fate of applied fertilizer–N using the 15N tracer technique. The conclusions of this investigation provide a useful approach for enhancing wheat yield and improving nitrogen–use efficiency, thereby optimizing the utilization of phosphorus and urea resources in northern China.
2. Materials and Methods
2.1. Preparation of Conventional Urea and Urea Enhanced with PASP Fractions of Different Molecular Weights
We conducted this research with PASP fractions with different molecular weights obtained in our previous study [17]. Polyaspartic acids of low, moderate, and high molecular weights were abbreviated as PAL, PAM, and PAH, respectively. Table 1 lists the molecular weights, elemental compositions, and the atomic ratios. The results showed that the PASP fractions varied significantly in weight–average molecular weight (determined by GPC [18]) and were representative of PASP fractions with different molecular weights.

Table 1.
Molecular weight, elemental composition, and atomic ratios of the tested PASP fractions.
Fertilizers with urea enhanced with PASP fractions of different molecular weights (PASPUs) were prepared by adding 0.10 g of a PASP fraction into 19.90 g molten 15N labeled urea (15N abundance 10.19%, produced by the Institute of Chemical Industry in Shanghai, China) at 130 °C. Molten urea without PASP addition was also prepared. After thorough mixing and cooling to ambient temperature, the fertilizer samples were ground and passed through a 0.149 mm screen to ensure uniformity in size. Samples containing PAL, PAM, and PAH were labeled as PAL–U, PAM–U, and PAH–U, respectively, and those without PASP were labeled as CU. The nitrogen content and 15N abundance of the PASPUs and CU were determined using an elemental analyzer (Vario MAX CN Carlo Erba NA1500, Elementar Analysensysteme GmbH, Langenselbold, Germany) coupled with a stable isotope ratio mass spectrometer (Isoprime 100, Elementar Analysensysteme GmbH, Okehampton, UK). Table 2 presents the results of the study.
Table 2.
Nitrogen content and 15N abundance of the PASPUs and CU.
2.2. Field–Soil–Column Culture Trails
A field–soil–column culture experiment was carried out to investigate the effects of PASPUs on the wheat yield and N utilization in a greenhouse with a glass roof at the Yucheng base of Saline–Alkaline Soil Improvement Experiment Station of the Chinese Academy of Agricultural Sciences in Dezhou, Shandong, China (36°50′ N, 116°34′ E, altitude 21.2 m) during the 2020–2021 winter wheat growing season. A warm temperate zone and continental monsoon climate prevailed in this area, with the mean annual temperature and precipitation of 13.4 °C and 569.6 mm, respectively.
Fluvo–aquic soil without fertilizer input for three years was collected from a field near the Dezhou Station of the Chinese Academy of Agricultural Sciences, Shandong, China (36°50′ N, 116°34′ E, altitude 21.2 m), and used as test soil in this study. During sampling, soil from the 0–30 and 30–90 cm layers was collected separately, air–dried, ground, and passed through a 1 cm sieve. Table 3 summarizes the basic physicochemical properties of the experimental soils. Soil pH was measured using a 1:2.5 soil–distilled water suspension method. Organic matter was measured using potassium dichromate oxidation. Total nitrogen was tested with sulfuric acid oxidation. Olsen P was extracted with 0.5 M sodium bicarbonate and determined using a spectrophotometer. Exchangeable K was extracted with 1 M ammonium acetate and determined using a flame photometer [19].
Table 3.
Basic physicochemical properties of the experimental soil.
The soil columns were installed, arranged, and packed according to the method described by Zhang et al. [20], and the 0–30 and 30–90 cm soil layers in the columns were packed with the collected soil from 0–30 cm and 30–90 cm, respectively. After packing, the soil was compacted to maintain a similar bulk density as that of the field.
In this study, we arranged five treatments in a completely randomized design with six replicates. Briefly, four CU or PASPU formulations, listed in Table 2, and a non–nitrogen fertilizer input as a control (CK) were applied. The fertilizer application rate in all fertilizer–N treatments was set at 0.15 g N kg−1 soil, 0.2 g P2O5 kg−1 soil, and 0.2 g K2O kg−1 soil. We used monopotassium phosphate as the phosphorus (P) source and potassium chloride as the potassium (K) source. N was set at the local optimal application rate, whereas P and K were applied at higher rates than conventional rates to ensure their abundant supply. The amount of application to each soil column was calculated based on the soil weight in the 0–30 cm soil layer. All fertilizers were applied once as a basal dressing and mixed thoroughly with the soil in the 0–30 cm soil layers before packing. CK received the same rates of P and K fertilizers as the fertilizer–N treatments but without the N input. The soil columns were then left to equilibrate at field capacity for three days before the seeds were sown.
A total of 24 wheat seeds (Cv. Jimai 22) were evenly sown in each soil column 2 mm below the soil surface on 26 October 2020, and the seedlings were thinned to 12 in each soil column at the three–leaf stage. Field management was carried out as per the practices of local farmers.
2.3. Sample Preparation and Analysis
Wheat plants were harvested at maturity through removing their above–ground parts. Straw and grain were oven–dried at 65 °C to a constant weight, weighed, and ground using a stainless–steel grinder. The soil in the columns was sampled using a soil auger (2.5 cm in diameter) and partitioned into three sections: 0–30, 30–60, and 60–90 cm. The soil of each section was mixed thoroughly, air–dried, ground, and sieved through a 0.149 mm mesh for subsequent analysis. The total N and 15N abundance of all samples were analyzed using an elemental analyzer (Vario MAX CN Carlo Erba NA1500, Elementar Analysensysteme GmbH, Langenselbold, Germany) coupled with a stable isotope ratio mass spectrometer (Isoprime 100, Elementar Analysensysteme GmbH, Okehampton, UK).
2.4. Calculations
Fertilizer–N fate was calculated according to the formula described by Zhang et al. [21]:
15N atom % excess of fertilizer = 15N abundance of fertilizer − 0.365%
Fertilizer–N uptake by wheat (g pot−1) = [(15N abundance of plant − 15N abundance of plant of CK)/15N atom % excess of fertilizer] × nitrogen content of plant × dry biomass of plant
Fertilizer–N residual amount in soil (g pot−1) = [(15N abundance of soil − 15N abundance of soil of CK)/15N atom % excess of fertilizer] × nitrogen content of soil × soil weight
Fertilizer–N loss amount (g pot−1) = Fertilizer–N application amount − Fertilizer–N uptake amount by wheat − Fertilizer–N residual amount in the soil
Fertilizer–N use efficiency (%) = Fertilizer–N uptake by wheat/Fertilizer–N application amount × 100
Fertilizer–N residual rate (%) = Fertilizer–N residual amount in the soil/Fertilizer–N application amount × 100
Fertilizer–N loss rate (%) = Fertilizer–N loss amount/Fertilizer–N application amount × 100
2.5. Statistical Analysis
Data were expressed on an oven–dried basis and presented as the mean of replicates. One–way ANOVA, statistical analysis of variance, and path analysis were performed using SPSS 22.0 (SPSS Inc., Chicago, IL, USA). Comparisons between different treatments were based on Duncan’s test at a level of 0.05. Graphics were prepared using Origin 9.0 (Origin Lab, Northampton, MA, USA) software.
3. Results
3.1. Winter Wheat Yield and Yield Components
The results indicated that nitrogen input significantly (p < 0.05) increased the wheat dry biomass by 2.91–3.20 times, whereas PASPUs exhibited a different effect from CU (Table 4). The PAH–U significantly enhanced the grain yield and above–ground dry biomass by 9.77% and 7.23%, respectively, whereas there was no significant difference in the total above–ground dry biomass among CU, PAL–U, and PAM–U. Moreover, wheat treated with PAH–U showed a significantly higher above–ground dry biomass than wheat treated with PAL–U and PAM–U by 6.30% and 5.86%, respectively. We further explored the yield components to clarify the effect of the PASPUs on yield enhancement. The spike number of the PAH–U treatments was significantly higher than that of conventional urea, whereas there was no significant difference in grain per spike and thousand kernel weight among the nitrogen input treatments. Next, we conducted path analysis with the nitrogen input treatments to explore which yield component played a more important role in the wheat grain yield enhancement. The results demonstrated that the decision coefficient of the spike number per column to grain was 0.628 (Table 5), obviously higher than other yield components, verifying that the PASPUs enhanced the wheat yield mainly through increasing the spike number of wheat.
Table 4.
Wheat yields and yield components under different treatments.
Table 5.
Simple correlation coefficient decomposition between yield and yield components.
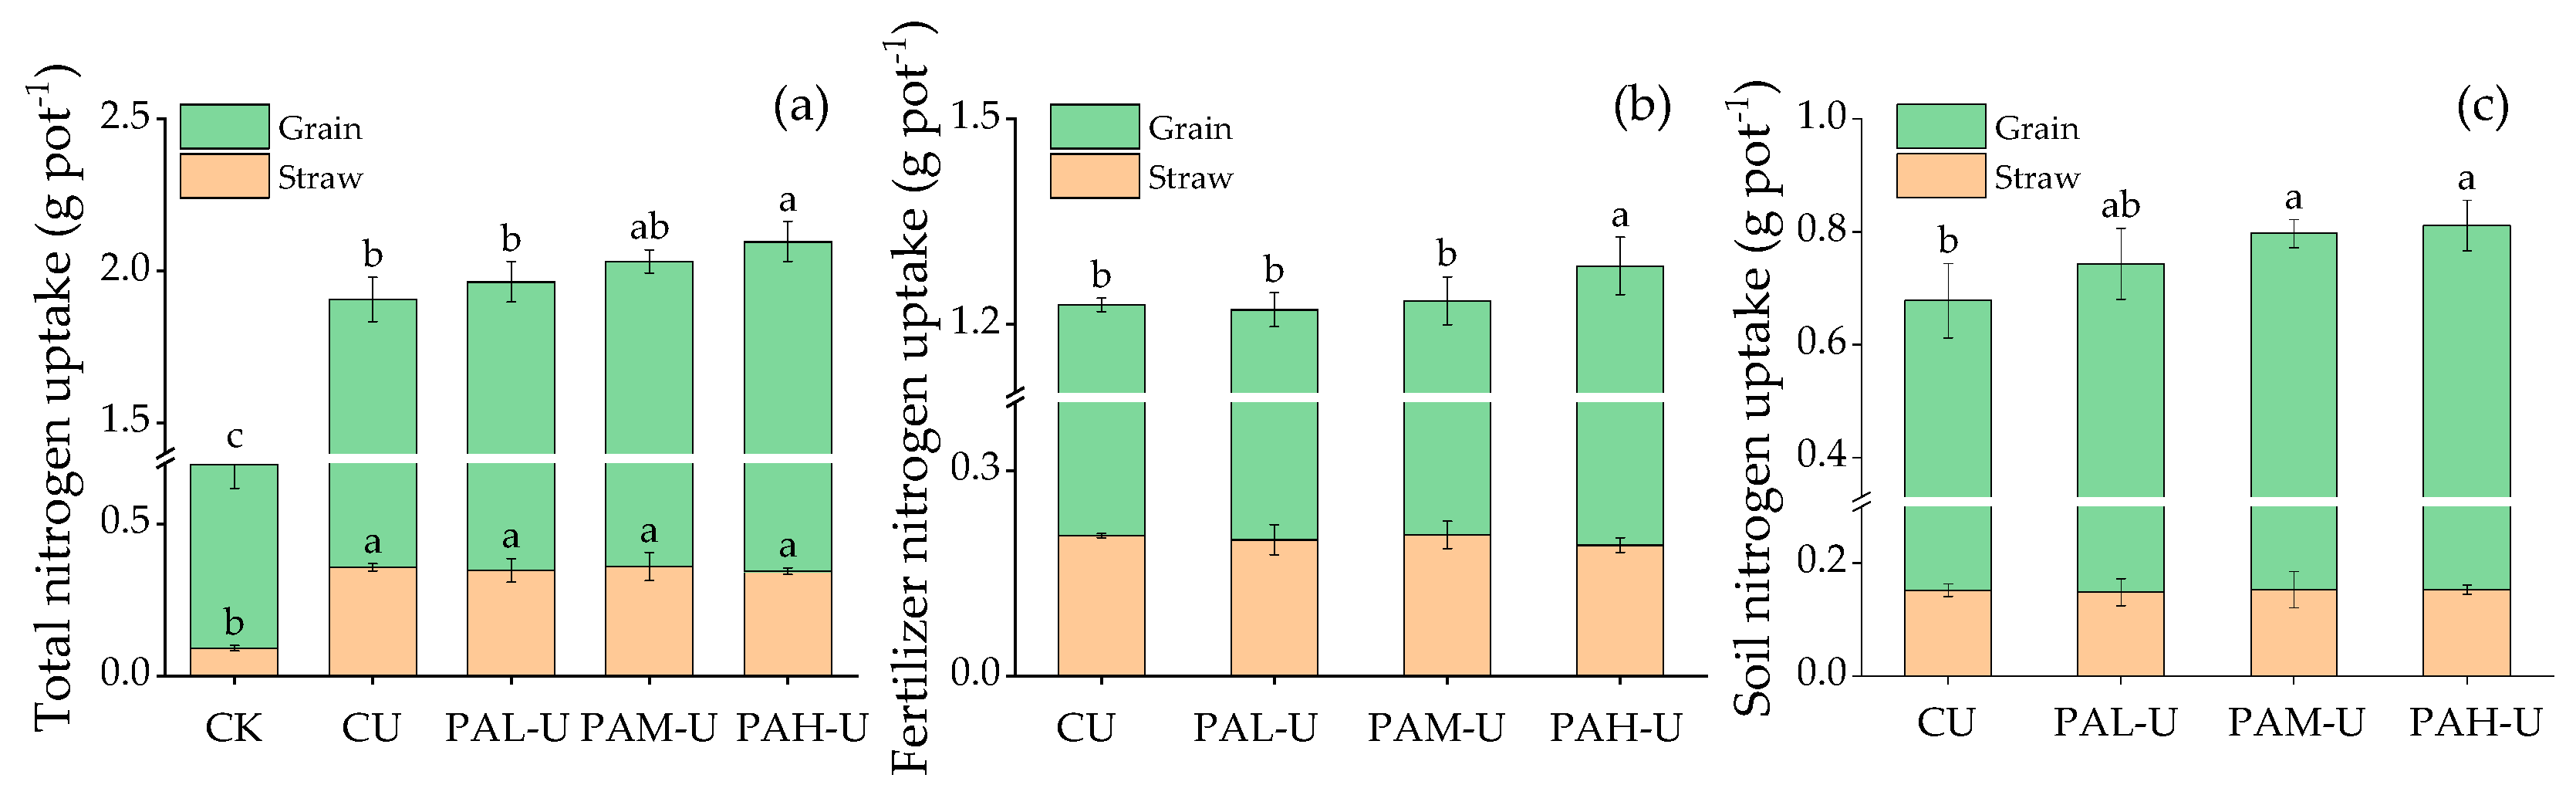
3.2. Nitrogen Uptake by Winter Wheat
To assess the effects of PASPUs on nitrogen utilization, we determined the total N content and 15N abundance, identified the N uptake from the fertilizer and soil, and calculated the total N uptake (a), fertilizer–N uptake (b), and soil–N uptake (c) of wheat. The results are shown in Figure 1 and demonstrate that the wheat N uptake amount was in accordance with that of the wheat dry biomass (Table 4). Among all treatments, the PAH–U demonstrated a higher total N uptake, fertilizer–N uptake, and soil–N uptake in wheat grains and above–ground parts than the other treatments. This indicated that the enhancement of N uptake by PAH–U was achieved through an increase in the wheat biomass. Among the PASPU treatments, the PAL–U demonstrated a significantly lower value in wheat grains than PAH–U in terms of total N uptake and fertilizer–N uptake at 0.189 g pot−1 and 0.057 g pot−1, respectively. However, there was no significant difference in the amount of N uptake by the straw among the fertilizer treatments (Figure 1).

Figure 1.
Nitrogen uptake amount in wheat under different treatments. (a) Total nitrogen uptake; (b) Fertilizer nitrogen uptake; (c) Soil nitrogen uptake. CK: no nitrogen fertilizer; CU: conventional urea; PAL–U: urea enhanced with polyaspartic acid of low molecular weight; PAM–U: urea enhanced with polyaspartic acid of moderate molecular weight; PAH–U: urea enhanced with polyaspartic acid of high molecular weight. Error bars represent standard deviations (n = 6). Different letters in the figure indicate significant differences between treatments at the 5% significance level.
3.3. Nitrogen Residue in Soil
Exploring the amount of N residue in different soil layers after crop harvest is beneficial for predicting N movement during crop growth and N after–effects. In this study, we analyzed the residual amount of fertilizer–N in the 0–90 cm soil layers, and the results (Table 6) indicated that the fertilizer–N from PAH–U retained in the soil was 9.55% higher than that from PAM–U, which was mainly attributed to its higher residue in the 0–30 cm soil layer. In this soil layer, the residual amount of fertilizer–N in the PAH–U treatment was 0.229 g pot−1, which was significantly higher than that in the other treatments. PASPUs demonstrated a higher fertilizer–N residual amount than CU in the 30–60 cm soil layer, whereas a lower value was observed in the 60–90 cm soil layer, indicating that there was less fertilizer–N leaching for PASPUs.
Table 6.
Residual amounts of fertilizer–N in different soil layers under different treatments.
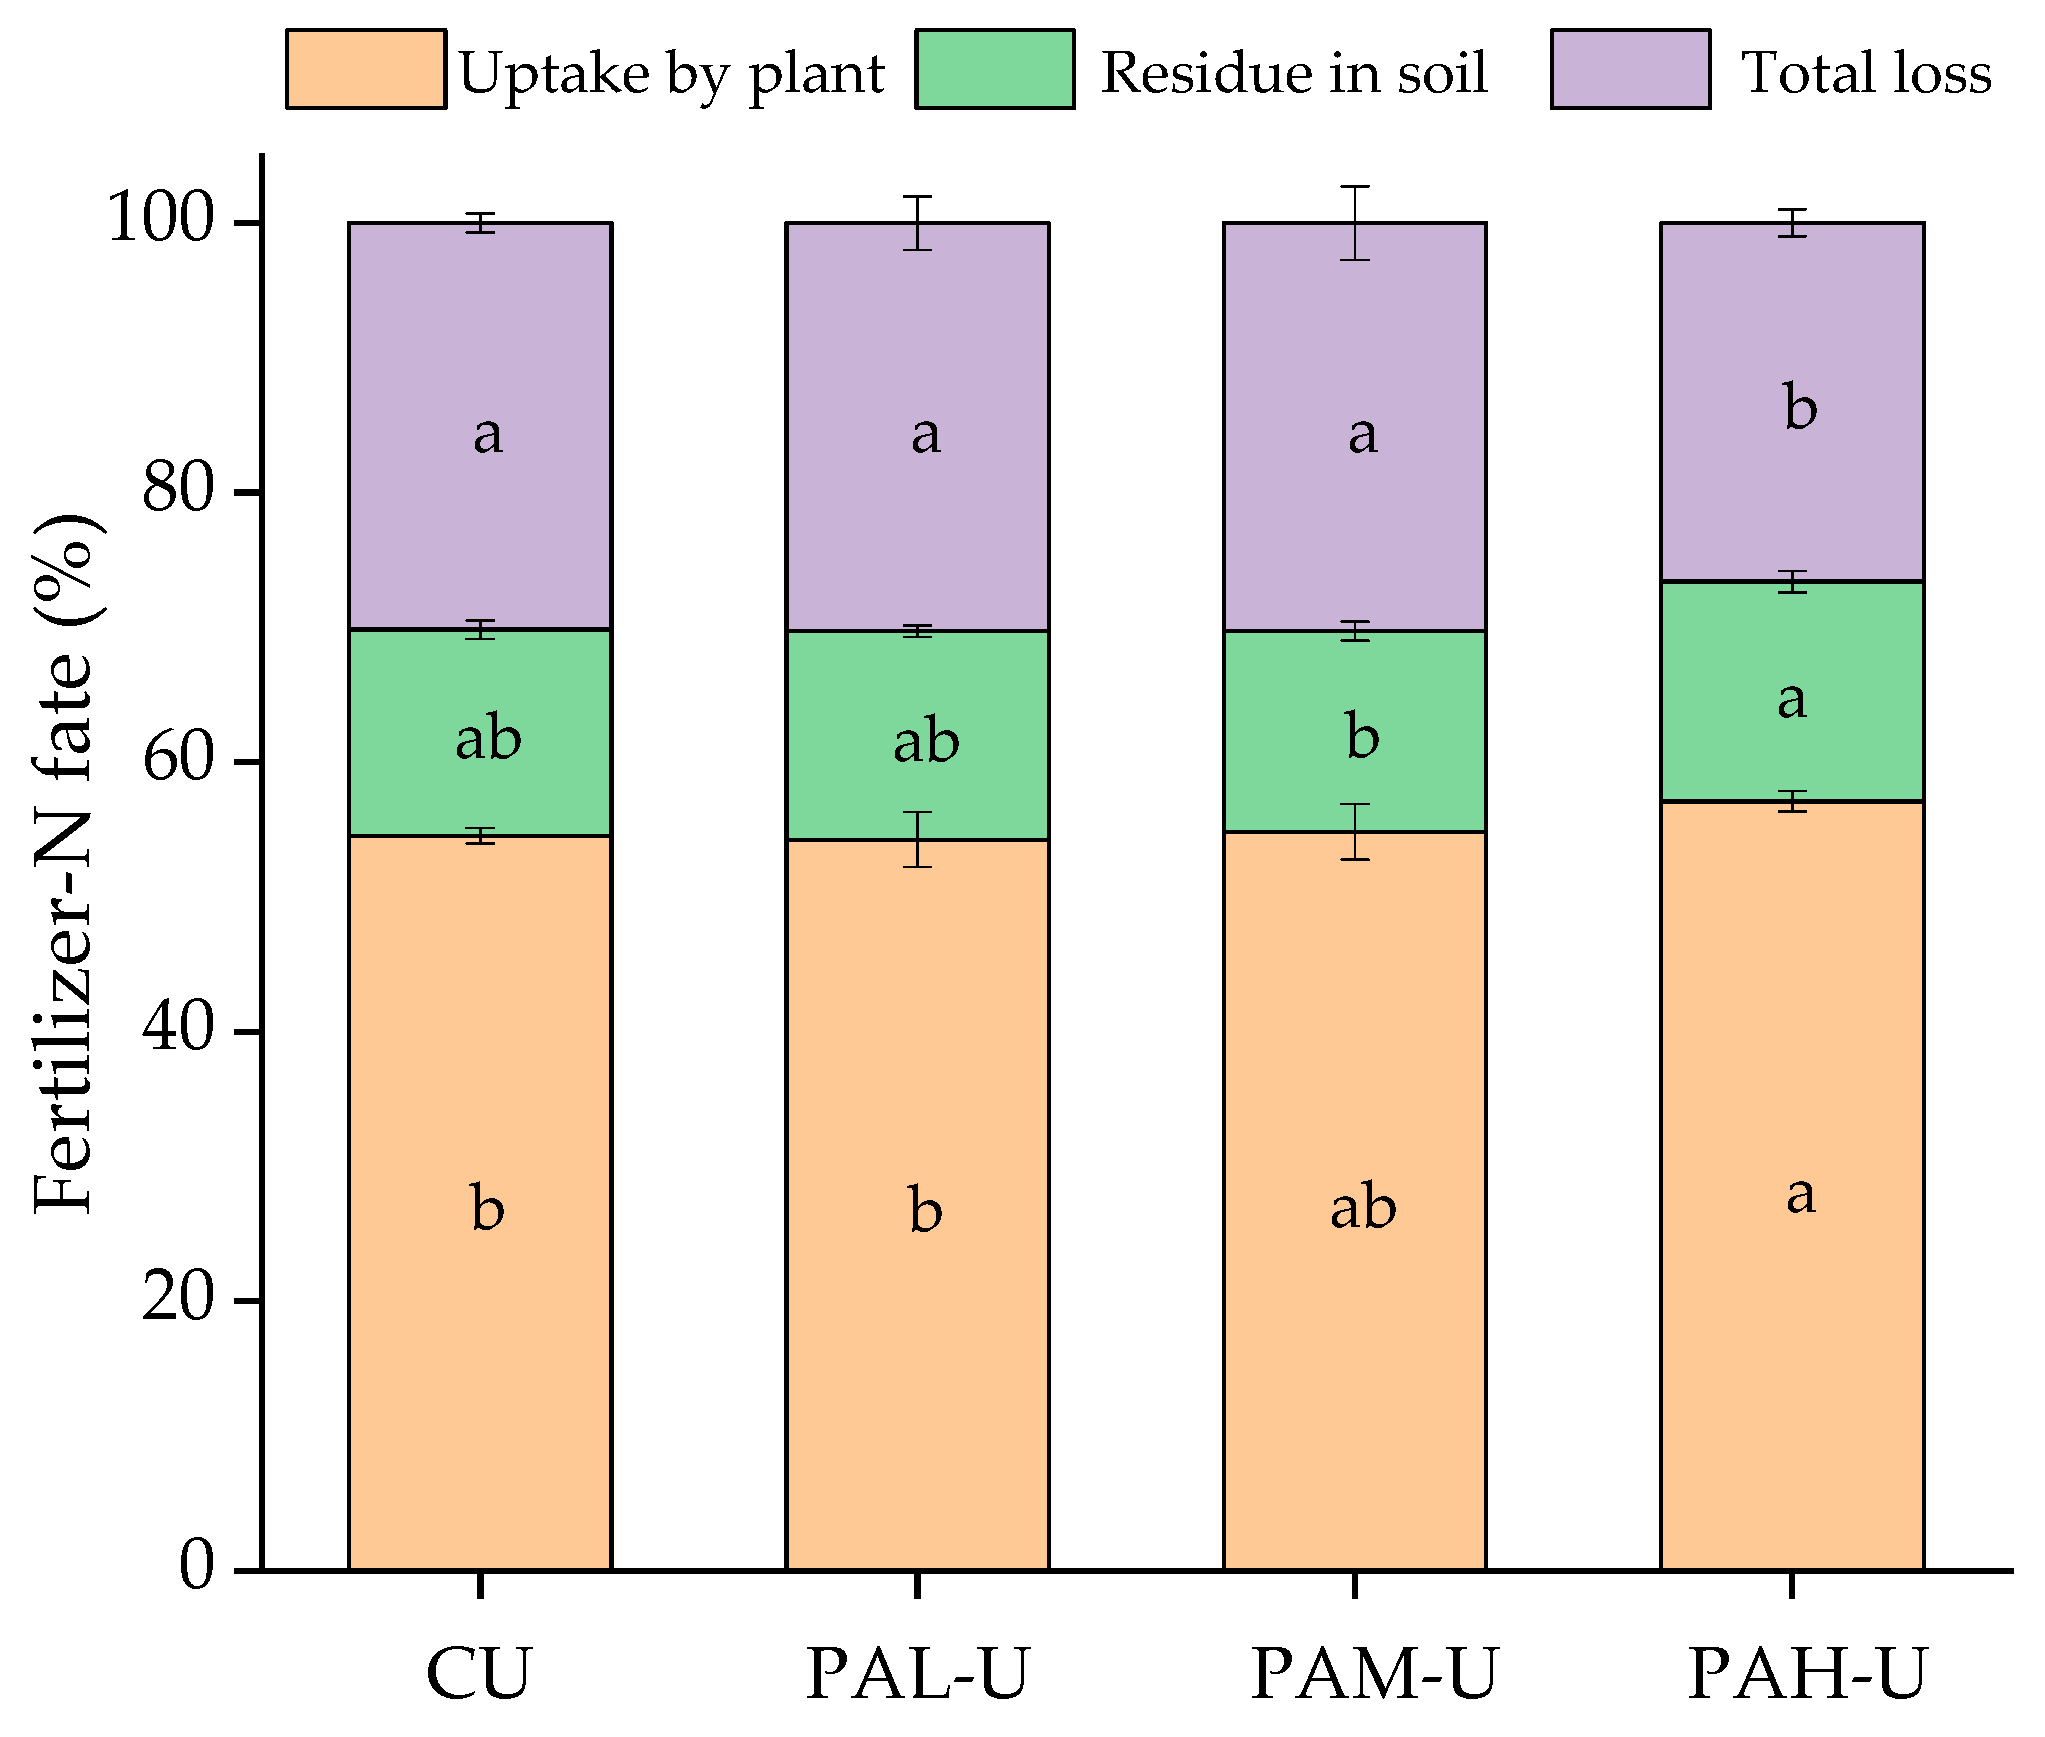
3.4. Nitrogen Fate Analysis
To clarify the fate of fertilizer–N, we calculated the 15N–use efficiency, residual rate, and loss rate, and the results are shown in Figure 2. Uptake by plant was the main fate of fertilizer–N, which accounted for 54.27–57.09% of the applied N, the loss followed, and only 14.90–16.32% of the fertilizer–N residue was in the soil. Among all treatments, the PAH–U exhibited a significantly higher use efficiency and a lower loss rate than CU by 2.54 and 3.57 percentage points, respectively. However, there was no significant difference in the 15N residue rate between the CU and PASPUs treatments, indicating that PASP incorporation had a limited effect on the total fertilizer–N residue in the soil. The PAH–U treatment showed a lower 15N loss rate than the other PASPU treatments, a significantly higher 15N–use efficiency than PAL–U, and a significantly higher 15N residue rate than PAM–U.
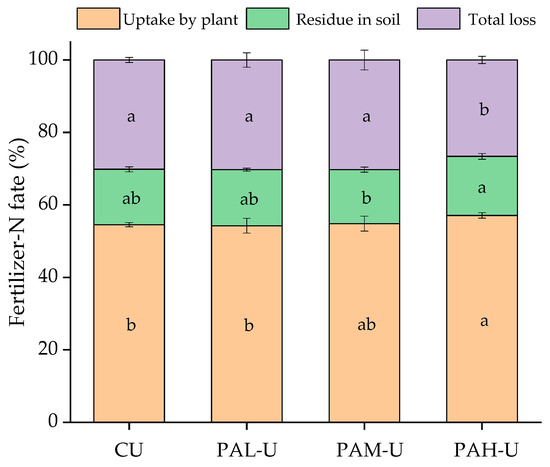
Figure 2.
The fate of fertilizer–N under different treatments. CU: conventional urea; PAL–U: urea enhanced with polyaspartic acid of low molecular weight; PAM–U: urea enhanced with polyaspartic acid of moderate molecular weight; PAH–U: urea enhanced with polyaspartic acid of high molecular weight. Error bars represent standard deviations (n = 6). Values followed by different letters in the bars indicate significant differences in the same N fate among treatments.
3.5. Comprehensive Evaluation of PASPUs Based on Radar Chart
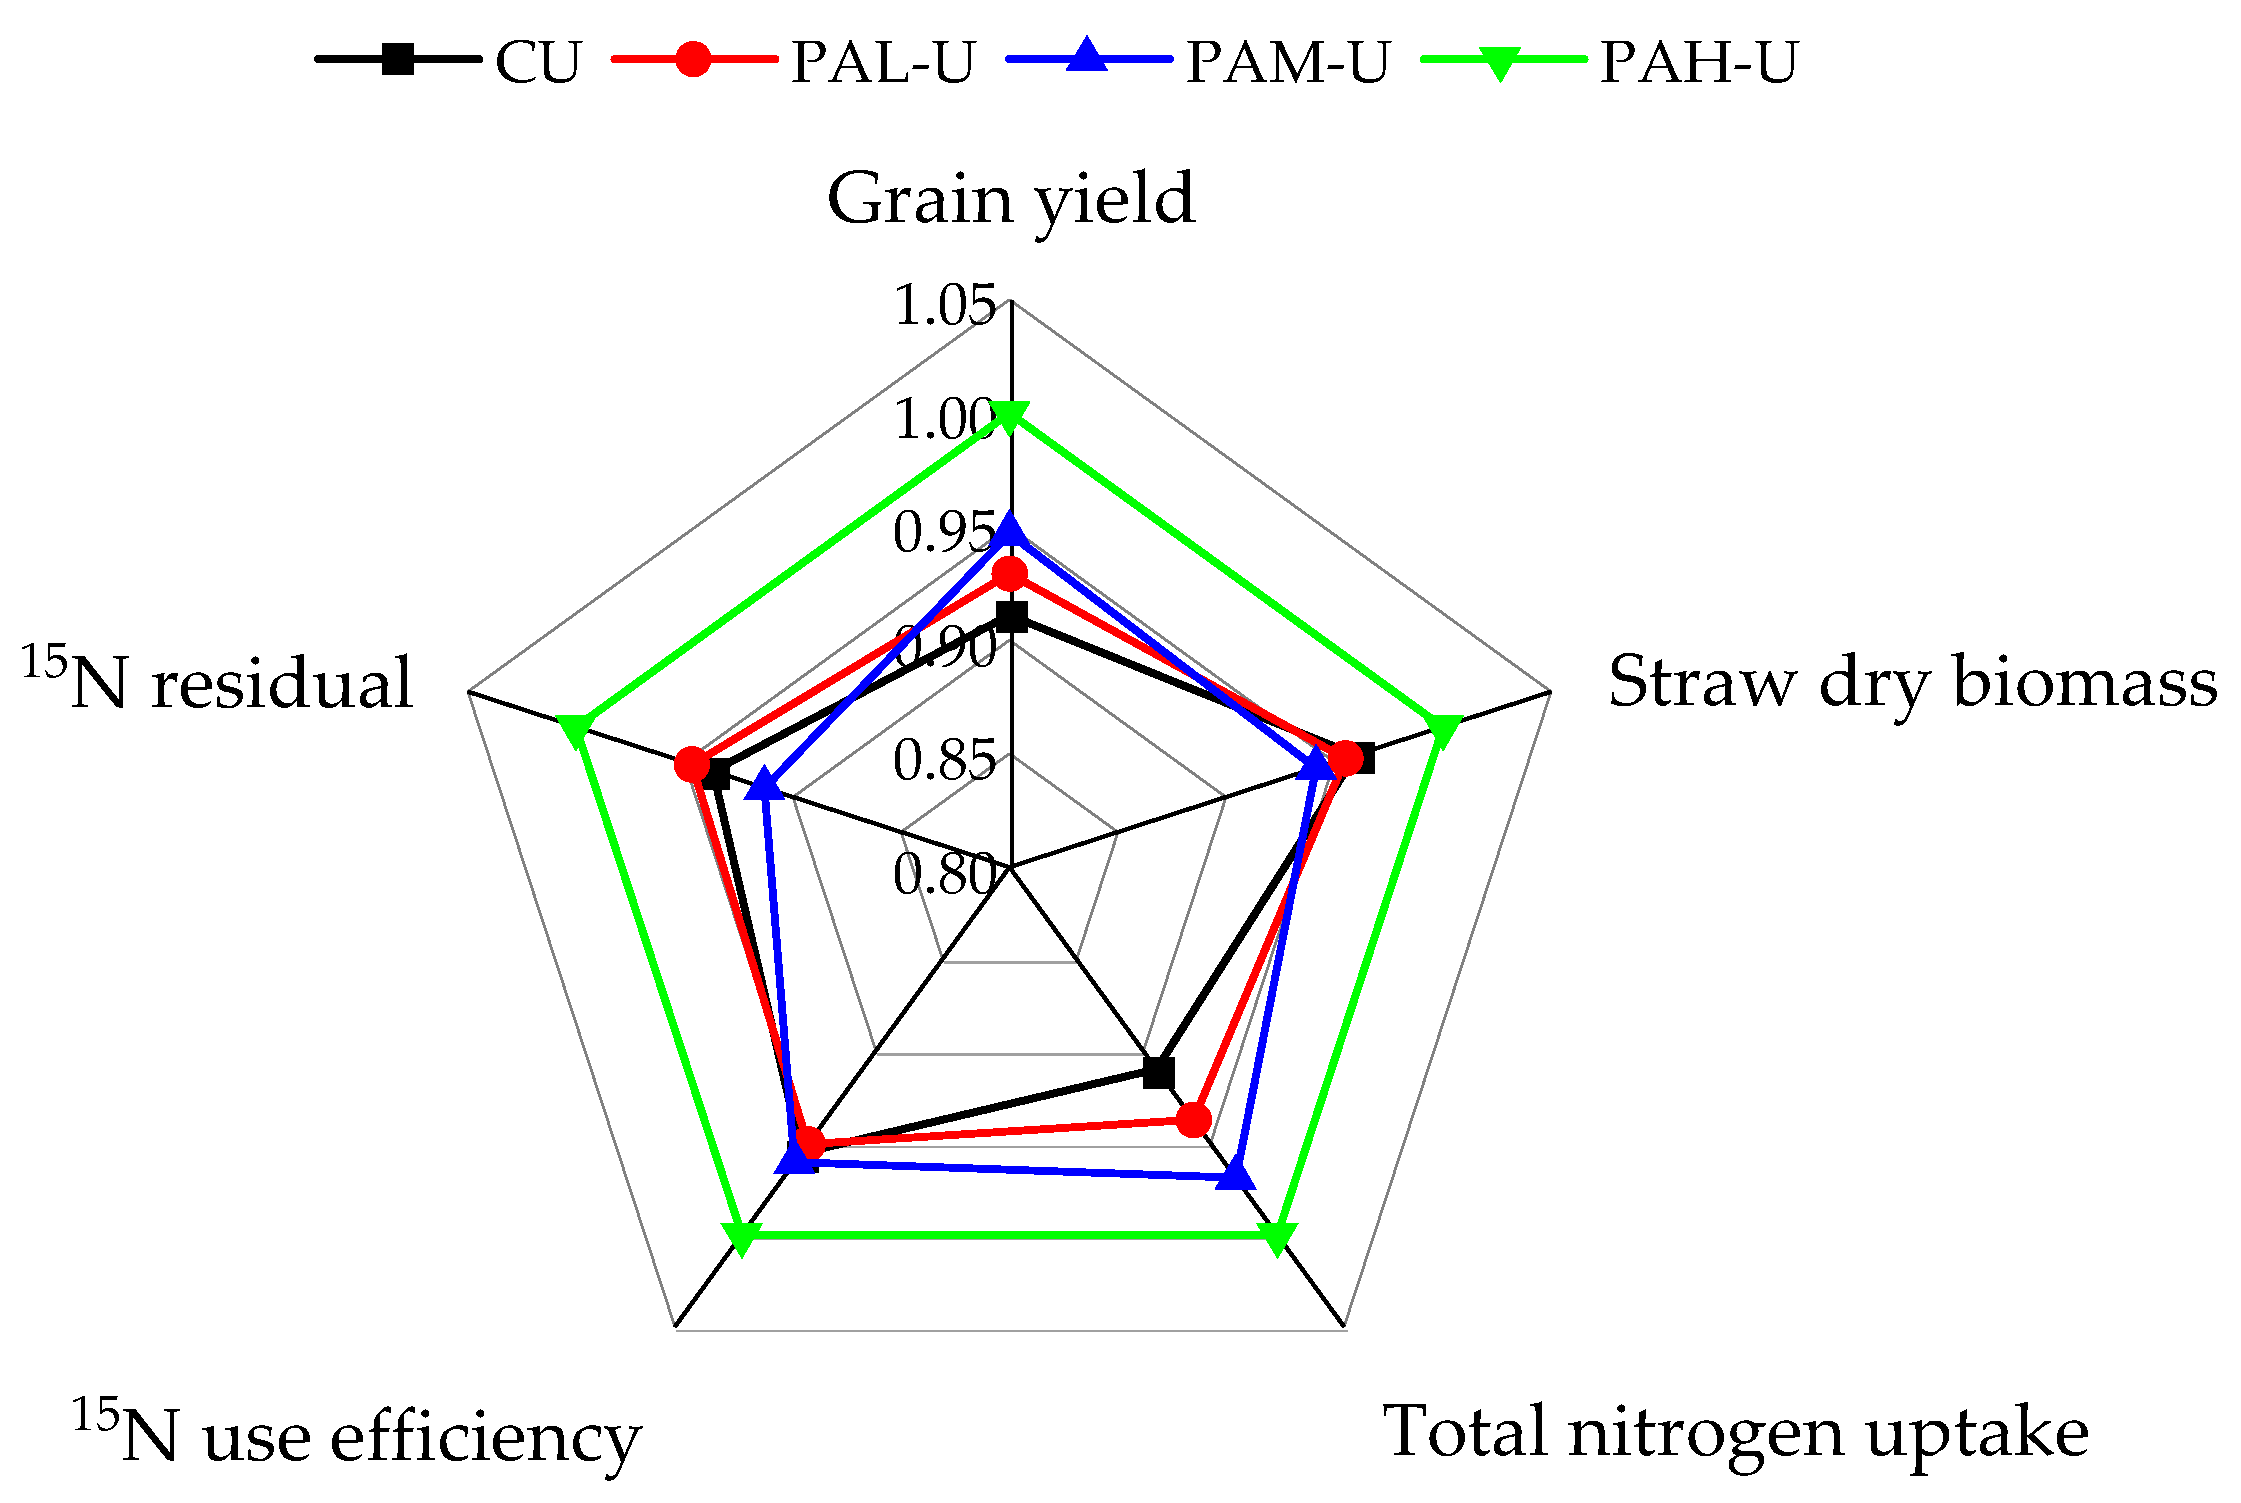
A comprehensive evaluation of PASPUs was conducted based on radar chart analysis through studying five indices: grain yield, straw dry biomass, total N uptake, 15N residue, and 15N–use efficiency. The results are shown in Figure 3. The PAH–U exhibited higher values for the selected indices, and its area was distinct from that of the other treatments. Subsequently, we calculated the interior area of each treatment as the comprehensive evaluation value and found that the comprehensive evaluation values of CU, PAL–U, PAM–U, and PAH–U were 0.554, 0.565, 0.568, and 0.635, respectively, and thus the comprehensive effect of treatments showed the following descending order of PAH–U > PAM–U ≈ PAL–U > CU.
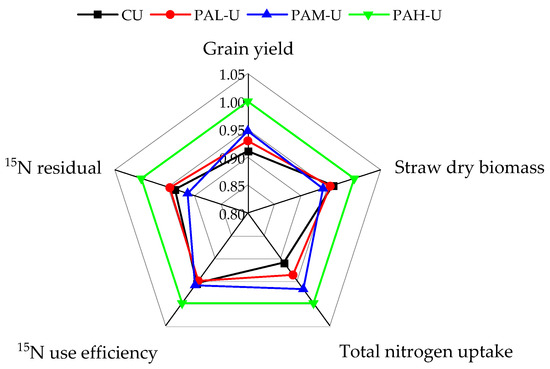
Figure 3.
Radar chart for the comprehensive evaluation of PASPUs. CU: conventional urea; PAL–U: urea enhanced with polyaspartic acid of low molecular weight; PAM–U: urea enhanced with polyaspartic acid of moderate molecular weight; PAH–U: urea enhanced with polyaspartic acid of high molecular weight.
4. Discussion
4.1. PASPUs Increased the Winter Wheat Yield, and PAH–U Showed the Highest Yield
In this study, PASPUs were shown to increase the wheat yield by 2.02–9.77% than CU (Table 4), which verified the results demonstrated by numerous studies that PASPUs have a significant effect on increasing crop yield [22,23]. The dry biomass of plants is derived from carbohydrates produced through photosynthesis. Previous studies have revealed that PASP can enhance the photosynthetic capacity of leaves and promote the accumulation of above–ground dry biomass [24,25]. Our previous study found that PASP optimized wheat root morphology and promoted wheat root growth [17], which contributed to the increase in yield observed in this study. With plenty of active functional groups, PASP had great chelation and adsorption properties for nutrient ions [26], and it could be combined with two dominant available N forms (NO3−–N and NH4+–N) to promote their mass flow to the crop root [27].
Our results demonstrated that the wheat yield increased with increasing molecular weight of PASPs, and PAH–U application resulted in the highest wheat yield (Table 4), which may be attributed to an increase in PASP functional groups [28]. The peptide chain structure of PASP forms a porous ring polymer group that can absorb nutrient ions [8]. The PAH–U possesses a more complex polymer group and stronger absorption and storage capacity because of its high molecular weight [29], which is conducive to slowing fertilizer–N release and ensuring continuous nitrogen supply during the entire wheat–growing period. Moreover, a previous study showed that PASP with a high molecular weight can inhibit hydroxyl radical formation [15], thus enhancing the antioxidant capacity of plants and delaying leaf senescence [30]. These two factors may explain why PAH–U exhibited the highest yield.
Spike number, grains per spike, and thousand kernel weight interact during grain yield formation [31]. In this study, the path analysis results showed that the decision coefficient of spike number per column to grain was 0.628, which was higher than that of the grain per spike and the thousand kernel weight (Table 5), indicating that PASPUs enhanced wheat yield mainly through increasing the number of wheat spikes. Spike number and grains per spike are greatly influenced by environmental factors such as nitrogen supply, whereas the thousand kernel weight is mainly influenced by heredity [32]. Among the fertilizer–N treatments, the PAH–U significantly increased the number of spikes by three compared with CU, indicating that PAH–U promoted wheat tillering, increased the spike number at the early wheat growth stage, and improved wheat yield.
4.2. PASPUs Altered the Fertilizer–N Fate, and PAH–U Showed a Higher Use Efficiency with a Lower Loss Rate
There are three destinations for the applied N fertilizer: crop absorption, soil residue, and losses [21]. In the current study, the PAH–U significantly increased the fertilizer–N use rate by 2.54 percentage points and decreased the fertilizer–N loss rate by 3.57 percentage points compared with CU (Figure 2), which is in accordance with previous results showing that PASPU can optimize the fate of fertilizer–N [8,33]. PASPUs increased the winter wheat yield owing to this optimization, and the effects of PASPUs on transformation are another important reason. Shen et al. [27] suggested that PASPU can decrease urease activity, implying that the transformation speed of N derived from PASPU is probably slower than that of CU. This was verified through our other results from the soil incubation experiments, which revealed that the soil treated with PASPUs had a higher amide–nitrogen content during the first 2 d of incubation (Figure S1).
In this study, the amount of fertilizer–N lost was significantly decreased through PASPU application, which is consistent with previous reports [8,27] and explains why PASPU application increased the NH4+–N and NO3−–N contents in our soil incubation experiment (Figures S2 and S3). Shen et al. [27] and Yang et al. [8] attributed the decrease in fertilizer–N loss to lower the ammonia volatilization and N2O emissions with the PASPU application. A deeper exploration demonstrated that the vibration peak of the Fourier transforms the infrared spectra shifted from 1461 cm−1 in CU to 1467 cm−1 in the PASPUs (Figure S4), indicating that PASP incorporation changed the structure of urea. Shen et al. [27] suggested that the changed structure resulted in higher nitrogen stability, which slowed nitrogen release, and attributed PASPUs to their longer efficacy than CU [34]. Among PASPUs, the PAH–U showed the lowest nitrogen loss, which might have arisen from the fact that its raw PASP has a longer residual and actional time in the soil because the biodegradation time of PASP is prolonged along with the elevation of its higher molecular weight [35].
The determination of residue–N in different soil layers is an important method for predicting nitrate leaching in the soil [36]. In our study, PASPUs increased the residual amount of fertilizer–N in the 30–60 cm soil layer and decreased the residual amount of fertilizer–N in the 60–90 cm soil layer (Table 6), indicating that PASPUs reduced the mobility of fertilizer–N in the soil. The peptide linkages of PASP can reduce nitrate leaching through associating with nitrates via hydrogen bonds [37]. Among all treatments, the PAH–U demonstrated the highest fertilizer–N in the 0–30 cm soil layer, which may have been caused by a PAH with more peptide linkages [17], which are beneficial for nitrate absorption.
We examined the relationship between the molecular weight of PASP and fertilizer–N fate and found that fertilizer–N uptake amount was significantly positively associated with the molecular weight of the PASP, whereas fertilizer–N loss amount was significantly negatively associated (Table S1). This was consistent with the comprehensive evaluation based on the radar chart, which showed that PAH–U had greater potential to increase wheat yield, promote nitrogen absorption, improve urea utilization, and reduce fertilizer loss (Figure 3).
5. Conclusions
Compared with CU, PASPUs increased wheat yield through increasing the spike number. PASPUs increased the residual fertilizer–N in the 30–60 cm soil layer but decreased the residual fertilizer–N in the 60–90 cm soil layer. PASPs with high molecular weight (>10 kDa) showed the best performance in enhancing wheat yield, promoting nitrogen uptake, increasing fertilizer–N use rate, and reducing fertilizer–N loss, whereas PASPs with molecular weights lower than 10 kDa were only slightly better than CU. Therefore, PASP with a molecular weight greater than 10 kDa is more suitable for the development of high–efficiency N fertilizers. However, this cannot be completely ensured unless large–scale experiments in discrepant climate–soil–crop application scenarios are completed. The effects of PASPs with different molecular weights on soil microorganisms and plant physiology can be carried out to clarify the mechanisms of PASPs with high molecular weight on increasing yield and reducing nitrogen loss.
Supplementary Materials
The following supporting information can be downloaded at https://www.mdpi.com/article/10.3390/agronomy13122933/s1, Figure S1: Soil amide–nitrogen content under different treatments; Figure S2: Soil ammonium nitrogen content under different treatments; Figure S3: Soil nitrate nitrogen content under different treatments; Figure S4: FTIR spectra (A) and second derivative diagrams (B) of CU and PASPUs; Table S1: Correlation between the molecular weight of PASP in PASPUs and fertilizer–N fate.
Author Contributions
Y.L. (Yuan Liu): Investigation; Data curation; Visualization; Writing—original draft; Formal analysis. S.Z.: Investigation; Data curation; Visualization; Writing—original draft; Funding acquisition. B.Z.: Supervision. M.X.: Data curation; Visualization. L.Y.: Conceptualization; Methodology; Resources; Funding acquisition; Writing—review & editing. Y.L. (Yanting Li): Conceptualization; Resources; Writing—review & editing. All authors have read and agreed to the published version of the manuscript.
Funding
This work was funded by National Key Technologies R&D Program of China during the 14th Five–Year Plan period (2023YFD1700201), National Natural Science Foundation of China (NSFC, Grant No. 32202611) and China Agriculture Research System (Grant No. CARS–03).
Data Availability Statement
Data are contained within the article and Supplementary Materials.
Acknowledgments
We acknowledged Yan’ge Yan and Ying’qiang Zhang for their assistance during sample treatments and FTIR analysis.
Conflicts of Interest
The authors declare no conflict of interest.
References
- Sutton, M.A.; Bleeker, A. The shape of nitrogen to come. Nature 2013, 494, 435–437. [Google Scholar] [CrossRef]
- Timilsena, Y.P.; Adhikari, R.; Casey, P.; Muster, T.; Gill, H.; Adhikari, B. Enhanced efficiency fertilisers: A review of formulation and nutrient release patterns. J. Sci. Food Agric. 2015, 95, 1131–1142. [Google Scholar] [CrossRef]
- He, S.; Sun, Y.; Shen, Z.; Wang, K. Advances in coupling big data technique with nutrient site–specific management: Scheme, methods and outlook. J. Plant Nutr. Fertil. 2017, 23, 1514–1524. [Google Scholar]
- Yan, X.; Jin, J.; He, P.; Liang, M. Recent advances in technology of increasing fertilizer use efficiency. Sci. Agric. Sin. 2008, 41, 450–459. [Google Scholar]
- Zhao, B.; Yuan, L.; Li, Y.; Zhang, S. Overview of Value–Added Fertilizer; China Agricultural Sciences and Technology Press: Beijing, China, 2020. [Google Scholar]
- Tomida, M.; Nakato, T.; Matsunami, S.; Kakuchi, T. Convenient synthesis of high molecular weight poly (succinimide) by acid–catalysed polycondensation of L–aspartic acid. Polymer 1997, 38, 4733–4736. [Google Scholar] [CrossRef]
- Yan, P.; Fang, M.; Lu, L.; Ren, L.; Dong, X.; Dong, Z. Effect of urea coated with polyaspartic acid on the yield and nitrogen use efficiency of sorghum (Sorghum Bicolor, (L.) Moench.). Plants 2022, 11, 1724. [Google Scholar] [CrossRef]
- Yang, J.; Liu, T.; Liu, H.; Zhang, D.; Zhai, L.; Liu, J.; Wang, M.; Chen, Y.; Chen, B.; Wang, H. Biodegradable PASP can effectively inhibit nitrification, moderate NH3 emission, and promote crop yield. Arch. Agron. Soil Sci. 2019, 65, 1273–1286. [Google Scholar] [CrossRef]
- Liu, T.; Yang, J.; Wang, H.; Chen, Y.; Ren, J.; Lin, X.; Zhao, J.; Chen, B.; Liu, H. Effects of molecular weight of polyaspartic acid on nitrogen use efficiency and crop yield. J. Sci. Food Agric. 2022, 102, 7343–7352. [Google Scholar] [CrossRef]
- Wang, Q.; Tang, H.; Li, G.; Dong, H.; Dong, X.; Xu, Y.; Dong, Z. Polyaspartic acid improves maize (Zea mays L.) seedling nitrogen assimilation mainly by enhancing nitrate reductase activity. Agronomy 2018, 8, 188. [Google Scholar] [CrossRef]
- Deng, F.; Wang, L.; Ren, W.; Mei, X. Enhancing nitrogen utilization and soil nitrogen balance in paddy fields by optimizing nitrogen management and using polyaspartic acid urea. Field Crop. Res. 2014, 169, 30–38. [Google Scholar] [CrossRef]
- Miao, F. Production technology and development prospect of polypeptide urea. Chem. Fert. Ind. 2013, 40, 17–19. [Google Scholar]
- Deng, F.; Wang, L.; Mei, X.; Li, S.; Pu, S.; Ren, W. Polyaspartate urea and nitrogen management affect nonstructural carbohydrates and yield of rice. Crop Sci. 2016, 56, 3272–3285. [Google Scholar] [CrossRef]
- Deng, F.; Wang, L.; Ren, W.; Mei, X.; Li, S. Optimized nitrogen managements and polyaspartic acid urea improved dry matter production and yield of indica hybrid rice. Soil. Tillage Res. 2015, 145, 1–9. [Google Scholar] [CrossRef]
- Salakhieva, D.V.; Gumerova, D.R.; Akhmadishina, R.A.; Kamalov, M.I.; Nizamov, I.S.; Nemeth, C.; Szilágyi, A.; Abdullin, T.I. Anti–radical and cytotoxic activity of polysuccinimide and polyaspartic acid of different molecular weight. BioNanoScience 2016, 6, 348–351. [Google Scholar] [CrossRef]
- Burns, K.; Wu, Y.-T.; Grant, C.S. Mechanisms of calcite dissolution using environmentally benign polyaspartic acid: A rotating disk study. Langmuir 2003, 19, 5669–5679. [Google Scholar] [CrossRef]
- Liu, Y.; Yuan, L.; Zhang, S.; Zhao, B.; Li, Y. Effects of polyaspartic acid with different molecular weights on root growth and nutrient uptake of wheat. Sci. Agric. Sin. 2022, 55, 2526–2537. [Google Scholar]
- Liu, R.; Ma, B.; Gou, X.; Zhou, M. Establishment of determination method for the molecular weight of polyaspartic acid by gel permeation chromatography–multi–angle light scattering. J. Food Saf. Food Qual. 2016, 7, 4318–4322. [Google Scholar]
- Bao, S. Soil and Agricultural Chemistry Analysis; China Agriculture Press: Beijing, China, 2000. [Google Scholar]
- Zhang, S.; Yuan, L.; Li, W.; Lin, Z.; Li, Y.; Hu, S.; Zhao, B. Effects of urea enhanced with different weathered coal–derived humic acid components on maize yield and fate of fertilizer nitrogen. J. Integr. Agric. 2019, 18, 656–666. [Google Scholar] [CrossRef]
- Zhang, S.; Yuan, L.; Li, W.; Lin, Z.; Li, Y.; Hu, S.; Zhao, B.; Li, J. Effects of humic acid urea on maize yield and the fate of fertilizer nitrogen. J. Plant Nutr. Fertil. 2017, 23, 1207–1214. [Google Scholar]
- Deng, F.; Wang, L.; Li, Q.-P.; Ren, W.-J. Relationship between nitrogen accumulation and nitrogen use efficiency of rice under different urea types and management methods. Arch. Agron. Soil Sci. 2018, 64, 1278–1289. [Google Scholar] [CrossRef]
- Yan, P.; Dong, X.; Lu, L.; Fang, M.; Ma, Z.; Du, J.; Dong, Z. Wheat yield and nitrogen use efficiency enhancement through poly (aspartic acid)–coated urea in clay loam soil based on a 5–year field trial. Front. Plant Sci. 2022, 13, 953728. [Google Scholar] [CrossRef]
- Cao, B.; Gui, Y.; Zu, Q.; Li, B.; Mu, S.; Lu, Y. Effects of polyaspartic acid on growth, yield and nutrient absorption of flue–cured tobacco with reduced fertilization. Chin. Tob. Sci. 2018, 39, 57–63. [Google Scholar]
- Deng, F.; Wang, L.; Mei, X.; Li, S.; Pu, S.; Ren, W. Morphological and physiological characteristics of rice leaves in response to pasp–urea and optimized nitrogen management. Arch. Agron. Soil Sci. 2017, 63, 1582–1596. [Google Scholar] [CrossRef]
- Wang, G.; Zhang, S.; Zhong, Q.; Peijnenburg, W.; Vijver, M. Feasibility of chinese cabbage (Brassica bara) and lettuce (Lactuca sativa) cultivation in heavily metals–contaminated soil after washing with biodegradable chelators. J. Clean. Prod. 2018, 197, 479–490. [Google Scholar] [CrossRef]
- Shen, Y.; Lin, H.; Gao, W.; Li, M. The effects of humic acid urea and polyaspartic acid urea on reducing nitrogen loss compared with urea. J. Sci. Food Agric. 2020, 100, 4425–4432. [Google Scholar] [CrossRef]
- Chen, X.; Chen, G.; Tao, Y.; Wang, Y.; Lu, X.; Zhang, L.; Zhu, J.; Zhang, J.; Wang, X. Research progress in eco–polymers. Acta Polym. Sin. 2019, 50, 1068–1082. [Google Scholar]
- Xu, J.; Niu, S.; Sui, S.; Zhang, X.; Ye, X.; Cai, G.; Wang, N. Effects of polyaspartic–acid/salt on nitrogen loss from paddy surface water and nutrients utilization. J. Agro–Environ. Sci. 2019, 38, 1696–1703. [Google Scholar]
- Wu, X.; Tian, H.; Li, L.; Wang, X. Polyaspartic acid alleviates cadmium toxicity in rapeseed leaves by affecting cadmium translocation and cell wall fixation of cadmium. Ecotoxicol. Environ. Saf. 2021, 224, 112685. [Google Scholar] [CrossRef]
- Lenoir, A.; Slafer, G.A.; Siah, A.; Dumont, B. Plasticity of wheat yield components in response to n fertilization. Eur. J. Agron. 2023, 150, 126933. [Google Scholar] [CrossRef]
- Liu, H.; Si, X.; Wang, Z.; Cao, L.; Gao, L.; Zhou, X.; Wang, W.; Wang, K.; Jiao, C.; Zhuang, L.; et al. TaTPP-7A positively feedback regulates grain filling and wheat grain yield through T6P-SnRK1 signalling pathway and sugar–ABA interaction. Plant Biotechnol. J. 2023, 21, 1159–1175. [Google Scholar] [CrossRef]
- Ji, P.; Li, X.; Peng, Y.; Zhang, Y.; Tao, P. Effect of polyaspartic acid and different dosages of controlled–release fertilizers on nitrogen uptake, utilization, and yield of maize cultivars. Bioengineered 2021, 12, 527–539. [Google Scholar] [CrossRef] [PubMed]
- Xie, F.; Li, D.; Li, J.; Cai, D. Effects of polyaspartic urea (PASP–urea) on soil microbial biomass carbon and nitrogen under incubation and pot experiment. Soils Fert. Sci. China 2011, 4, 8–12. [Google Scholar]
- Adelnia, H.; Tran, H.D.N.; Little, P.J.; Blakey, I.; Ta, H.T. Poly (aspartic acid) in biomedical applications: From polymerization, modification, properties, degradation, and biocompatibility to applications. ACS Biomater. Sci. Eng. 2021, 7, 2083–2105. [Google Scholar] [CrossRef] [PubMed]
- Kou, C.; Luo, X.; Ju, X. Effects of optimal nitrogen fertilization on N balance and nitrate–N accumulation in greenhouse tomato fields. J. Plant Nutr. Fertil. 2021, 27, 837–848. [Google Scholar]
- Yang, J.; Liu, T.; Chen, Y.; Wang, M.; Wang, H.; Liu, H. Synthesis, modification and application of polyaspartic acid/salt: The state–of–art technological advances. Mater. Rev. 2018, 32, 1852–1862. [Google Scholar]
Disclaimer/Publisher’s Note: The statements, opinions and data contained in all publications are solely those of the individual author(s) and contributor(s) and not of MDPI and/or the editor(s). MDPI and/or the editor(s) disclaim responsibility for any injury to people or property resulting from any ideas, methods, instructions or products referred to in the content. |
© 2023 by the authors. Licensee MDPI, Basel, Switzerland. This article is an open access article distributed under the terms and conditions of the Creative Commons Attribution (CC BY) license (https://creativecommons.org/licenses/by/4.0/).