Abstract
In order to estimate bayberry yield, a lightweight bayberry target detection count model, YOLOv7-CS, based on YOLOv7, was proposed to address the issues of slow detection and recognition speed, as well as low recognition rate, of high-density bayberry targets under complex backgrounds. In this study, 8990 bayberry images were used for experiments. The training set, validation set, and test set were randomly recreated in a ratio of 8:1:1. The new network was developed with SPD-Conv detection head modules to extract features at various scales, to better capture small and indistinct bayberry targets. To improve accuracy and achieve a lightweight design, a CNxP module that replaces the backbone’s ELAN structure is proposed. We propose a global attention mechanism (GAM) in the intermediate layers of the network, to enhance cross-dimensional interactions, and a new pyramid pooling module called SPPFCSPC, to extend the field of perception and improve boundary detection accuracy. Finally, we combine the Wise-IoU function to enhance the network’s ability to identify overlapping and occluded objects. Compared with the SSD, Faster-RCNN, DSSD, and YOLOv7X target detection algorithms, YOLOv7-CS increases mAP 0.5 by 35.52%, 56.74%, 12.36%, and 7.05%. Compared with basic YOLOv7, mAP 0.5 increased from 5.43% to 90.21%, while mAP 0.95 increased from 13.2% to 54.67%. This parameter is reduced by 17.3 m. Ablation experiments further show that the designed module improves the accuracy of bayberry detection, reduces parameter counts, and makes bayberry image detection more accurate and effective.
1. Introduction
The bayberry is regarded as a precious fruit for both medicine and food [1], and has a broad application prospects in both traditional Chinese medicine and modern medicine in China [2]. Image recognition technology, in the deep learning method, is used to efficiently monitor the growth state of bayberry plants, predict their yield, improve their quality, and ensure the medical and economic value of bayberry plants. Convolutional neural network technology has achieved remarkable results in automated agriculture, pest detection, farmland management, etc. [3]. Gulzar Yonis used Mobilenetv2 and deep transfer learning technology to conduct research on fruit image classification models, using 40 different types of fruit. Experiments were conducted on a dataset of 26,149 images of fruit, and a precision rate of 99%, a recall rate of 99%, and an f1 score of 99% were obtained [4]. In addition, Gulzar Yonis compared the results of different deep learning models for sunflower disease classification. Five widely used deep learning models were trained and evaluated using a dataset of sunflower disease images. It was concluded that the deep learning model is effective in classifying sunflower diseases, and can help farmers and agronomists implement disease management strategies in a timely manner [5]. Wang et al. proposed an improved convolutional neural network based on Mask Scoring R-CNN [6], which can segment apples under different conditions to achieve the purpose of predicting apple yield and automatically obtaining apple growth information [7]. Poonam Dhiman et al. evaluated and analyzed different techniques of various classification models for citrus fruit disease detection through previous papers that used machine learning, deep learning, and statistical techniques to predict, detect, and classify citrus fruit diseases [8]. Zhou et al. proposed a rice classification and identification method based on the improved ShuffleNet V2 model [9], which can effectively improve the classification accuracy of rice diseases, control diseases, and improve rice yield [10]. Liu et al. proposed a PILLO underwater detection technology for underwater plant target detection, using the improved Swin Transformer [11] and SIOU loss function to improve the accuracy of underwater target detection, which is of great significance in the development of ocean exploration [12].
Bayberry images are characterized by high target density, blurred hierarchies, complex backgrounds, significant interference, and indistinct features, making them susceptible to both missed detections and false detections [13]. Consequently, improving the accuracy of bayberry target detection is an urgent challenge to address. The YOLO model has the characteristics of high efficiency, high precision, accessible training, and a wide application range. Researchers have adapted it for use in crop testing [14]. For instance, Li et al. improved the YOLOv5-based object detection model and trained it for real-time maize plant detection [15]. This model excels in detecting and counting maize plants, even in complex backgrounds, enabling timely and accurate estimations of maize population density. Ahmad et al. proposed an olive fruit detection model based on the YOLOv5s algorithm [16]. This model can detect olive fruits on trees in real-time from video, facilitating the deployment and research of harvesting robots. Zhang et al. introduced a wheat scab detection model based on the YOLO and Simple Spatial Attention (SSA) networks [17]. It combines spatial attention modules and spatial continuity loss to extract spatially distributed wheat features, improving wheat scab detection accuracy [18].
The above study provides a theoretical basis for the detection of crops. However, being affected by the growth environment, light, weather, and other factors, the size, shape, and color of bayberries in different growth stages and environments are significantly different, and the detection of bayberries is still difficult. In order to improve the applicability of bayberry detection in actual production, this study designed a new YOLO detection and counting model to optimize the detection speed and accuracy of the bayberry detection method. The model can provide a method for the subsequent detection of bayberries, deployed on the detection equipment or picking robot. This study can effectively solve the challenges and difficulties of the detection of bayberries, provides an important theoretical basis, and has practical significance. The contributions provided in this paper are as follows:
- (1)
- We propose a CXnP module to reduce redundant calculation and model parameters, in combination with the RepGFPN multi-scale feature fusion module, to extract spatial features more effectively, reduce model parameters without reducing accuracy, and achieve a lightweight design.
- (2)
- We combine the YOLOv7 network structure with the SPD module, and introduce the GAM attention mechanism module to extract different scale features, to improve the identification of fuzzy bayberries and smaller bayberries.
- (3)
- We use the Wise-IoU algorithm to add a focus mechanism, to improve the ability of the network to identify overlapping and blocked objects, and add the counting function, to more accurately calculate the number of bayberries in the picture. Various experiments have demonstrated the superiority of our work.
2. Related Work
Low accuracy of multiple detection is a common problem in target detection [19]. Tian et al. proposed a v-space-based apple leaf disease detection method, using multi-scale feature representation to establish multi-scale feature extraction, enhance texture feature information, and further improve disease detection performance [20]. Zhang et al. proposed a multi-scale feature fusion infrared small-target detection method based on a global attention network, which can achieve high detection accuracy and a low false alarm rate [21]. Huang et al. proposed a pedestrian detection algorithm based on SSD [22], using MobileNetV2 [23] as the backbone network and adding deconvolution multi-scale feature fusion to the backbone network, which ensures that the design of the model is lightweight and improves the detection effect of the model [24]. Tian proposed a multi-scale YOLO model for small-target pest detection, the DenseNet [25] module, and included an adaptive attention module (AAM) [26] into the feature extraction part, improving the effective use of the feature model, so as to improve the detection accuracy. Early warnings in precision agriculture of diseases and insect pests plays a vital role in intelligent warning systems [27]. The above research indicates that detection accuracy can be effectively improved by improving the ability of multi-scale feature extraction.
At the same time, the deployment of lightweight detection equipment has never stopped. Chen et al. proposed a lightweight water surface litter detection algorithm based on improved YOLOv5s to effectively detect daily surface garbage in real-time and provide core technical support for the real-time detection of surface garbage cleaning ships [28]. Li et al. proposed an image lightweight detection network based on subpixel convolutional and UAV. The computational cost was 92.78% lower than CenterNet [29] with ResNet18 [30] backbone and a good detection effect was achieved in UAV images with complex ground scenes, small target size, and high target density [31]. Liu et al. proposed a lightweight detection algorithm for the surface defects of fine crystals, which solved the problems of low detection efficiency, strong specificity, large fine-grained classification error, and unstable detection results in aerospace applications [32]. Li et al. proposed a lightweight detection model for SAR aircraft in complex environments and proposed an ICB module combining the characteristics of scattering mechanisms, which can effectively extract gray features and enhance spatial information, inhibit interference and redundancy information in complex environments, and reduce the detection time [33]. Models that can simultaneously satisfy multiple and lightweight are more use in deployment in real-time detection devices. Zhang et al. proposed a lightweight detection algorithm with multi-scale feature fusion for the detection of unmanned boats, which meets the standard of real-time, reduces parameters, and improves the accuracy [34]. Zhou et al. proposed a lightweight detection algorithm to design a new multi-scale structure, solve the problems of the small number of available features of the image target and the small-scale aggregation, greatly reduce the parameters of the model, and provide technical support for the automatic picking of kiwi fruit [35]. The above research indicates that lightweight research can reduce parameters and improve accuracy.
3. Network Structure
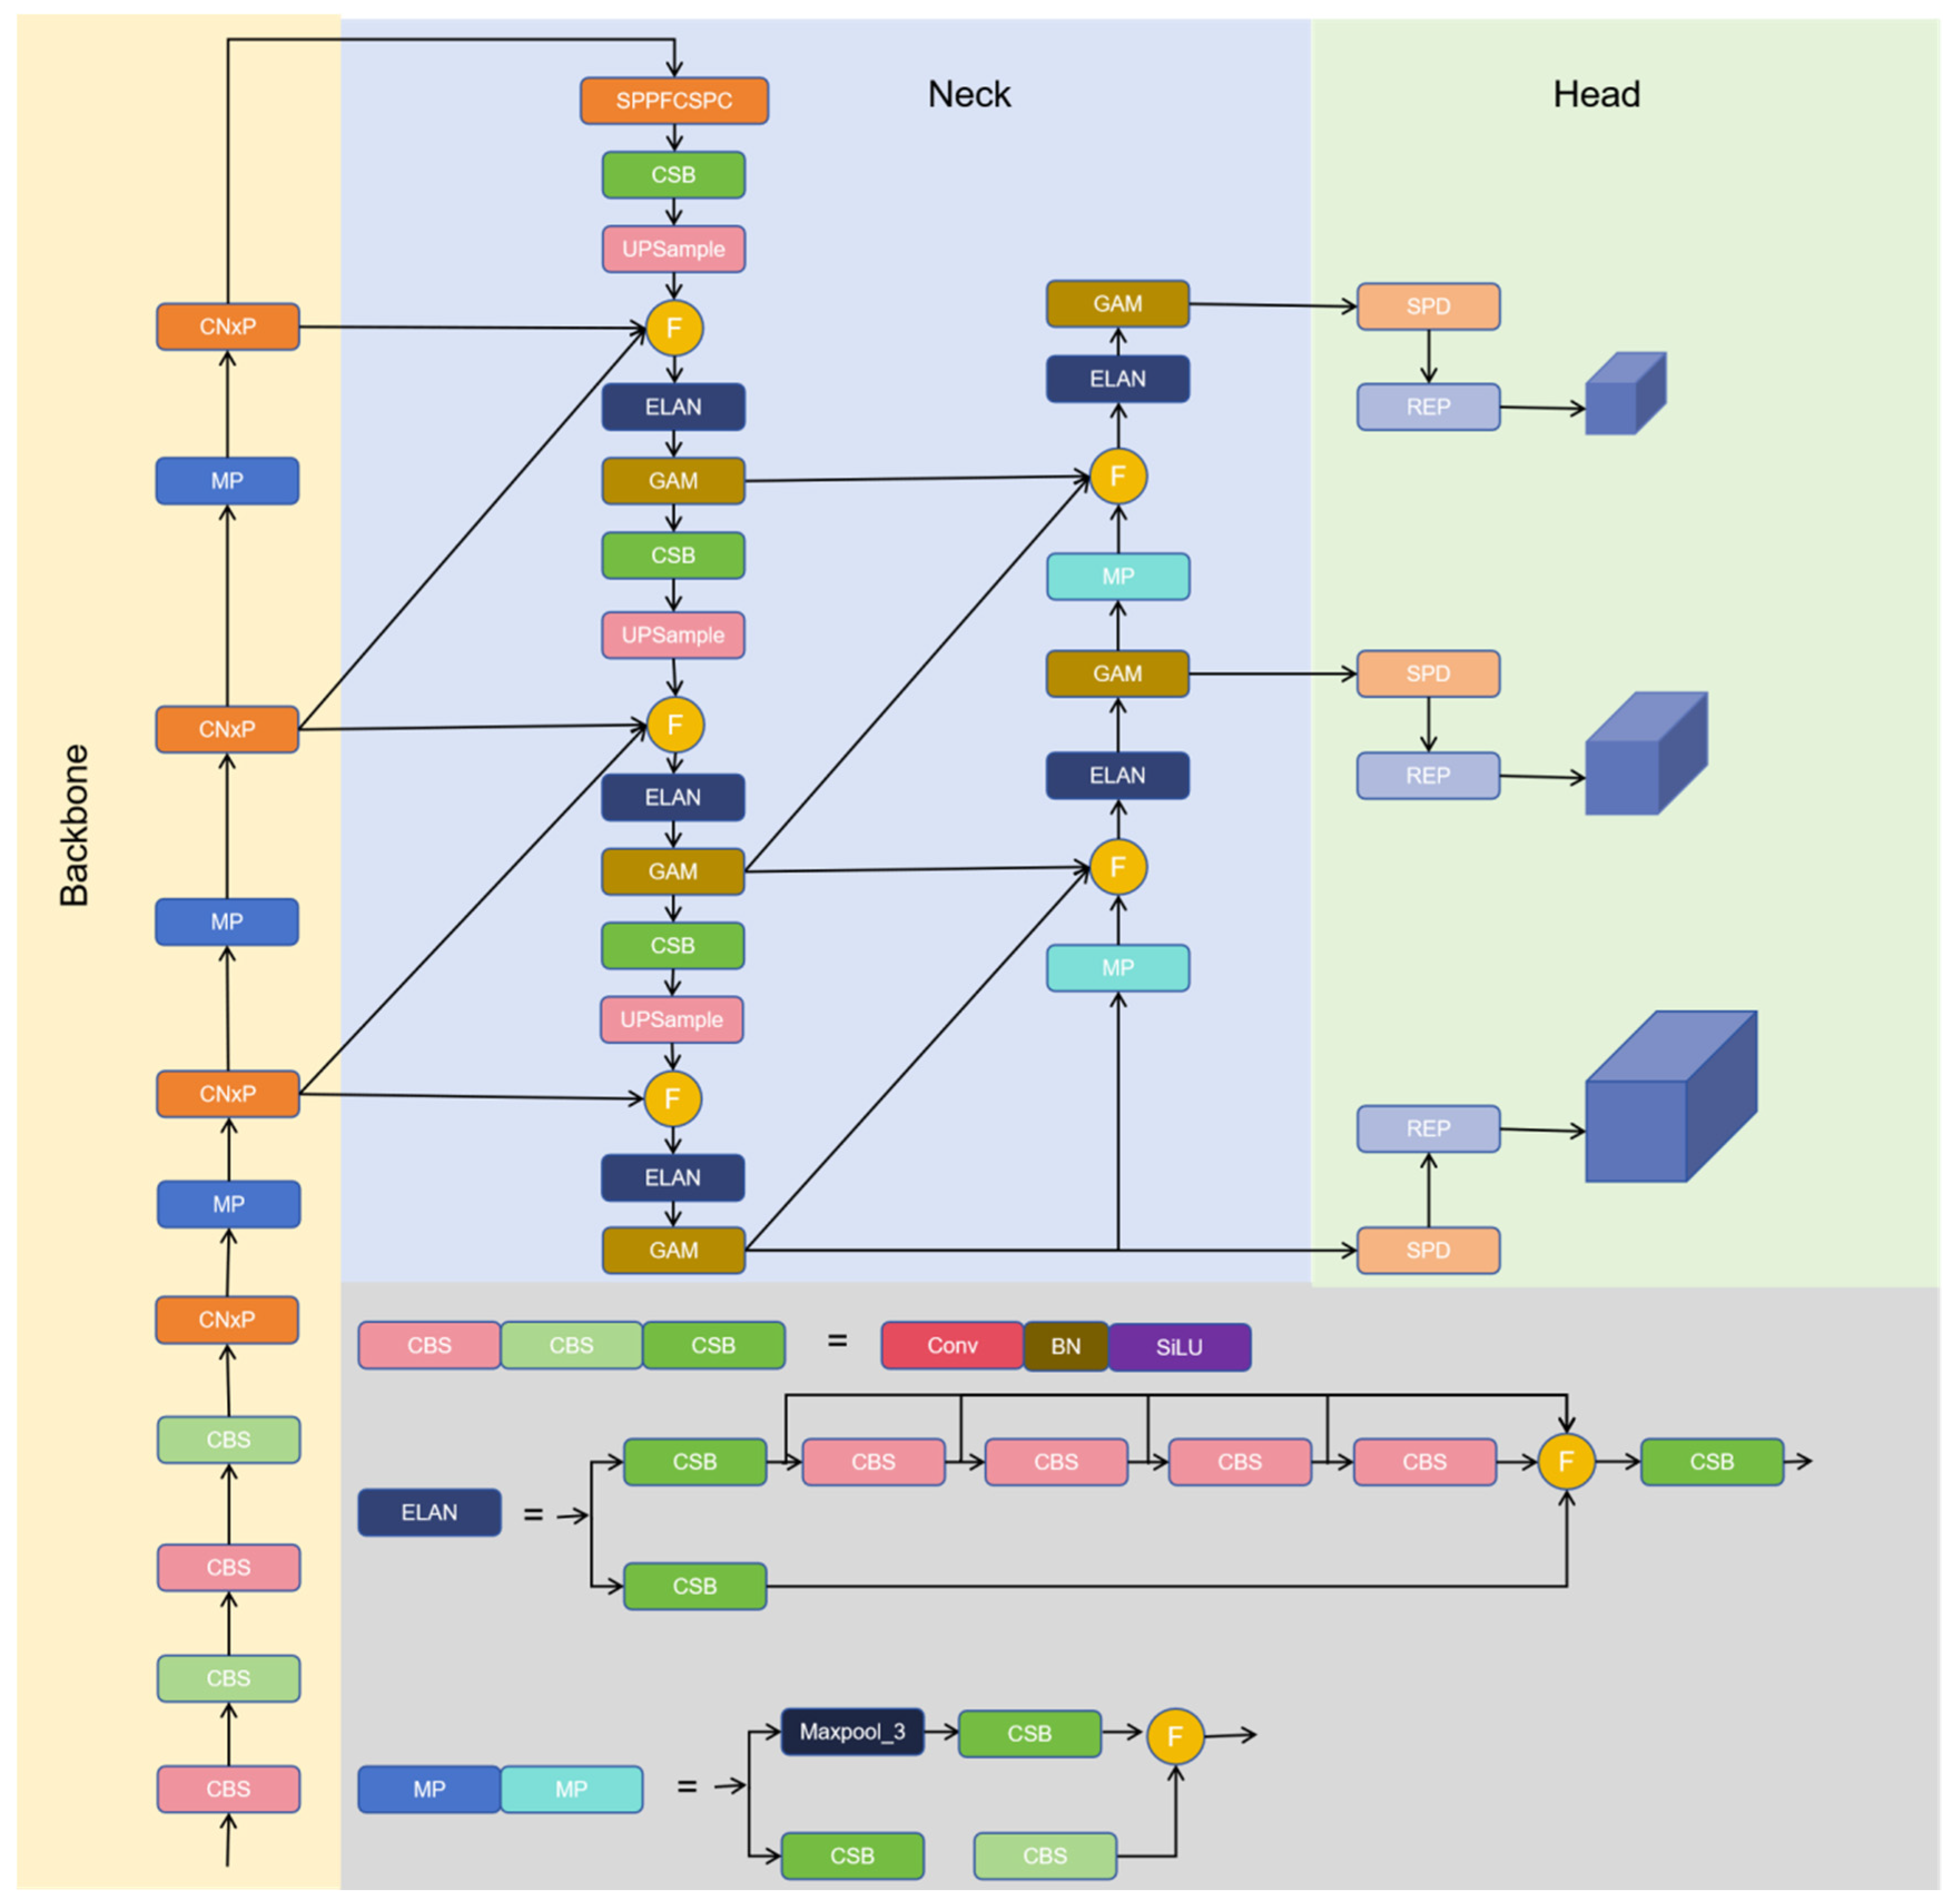
The original YOLOv7 network may not be as accurate as some other target detection algorithms in terms of target positioning. Although YOLOv7 supports multi-scale detection, its performance may be degraded when processing very small or very large targets, and it is easy to miss or misdetect targets [36]. In addition, YOLOv7’s model is relatively large and requires more computing resources. The network structure in this paper is depicted in Figure 1, primarily composed of the backbone, head, and neck components, inheriting the network structures from YOLOv7, CBS network, and ELAN modules for feature extraction to ensure the completeness of bayberry feature extraction. Replace the ELEN structure in the original backbone network with CXnP modules, which reduce model parameters, excess computation, and memory footprint. Achieve lightweight and more efficient extraction of spatial features without compromising accuracy. The neck adopts the RepGFPN multi-scale feature fusion mode to fully exchange high-level semantic information and low-level spatial information, provide more effective information transmission, expand to a deeper level of the network, and retain more details of the bayberry image. The GAM [37] attention mechanism is added to the neck, which improves the detail richness of the output features and improves the accuracy of network detection. The backbone network uses SPPFCSPC feature pyramid module instead of SPPCSPC module to improve the speed and detection accuracy of dense objects without changing the receptive field. The SPD [38] module implanted in the front of the head can fully mine the information in the input features, achieve the purpose of extracting features of different scales, and improve the recognition ability of fuzzy images and small objects. The Wise-IoU [39] algorithm’s additional focusing mechanism is used to improve the detection accuracy of overlapping parts, and the counting module is added to obtain the final model structure.

Figure 1.
YOLOv7-CS. First, the image data is enhanced and preprocessed, the preprocessed images are introduced into the backbone network to extract image features. The extracted features are introduced into the GAM module of the Neck part and then RepGFPN feature fusion is performed to generate large, medium and small features suitable for different sizes. Finally, these fused features are sent to the detection head with the SPD module added, the target detection results are output after detection.
3.1. Characteristic Extraction of the Backbone Network Based on CNxP
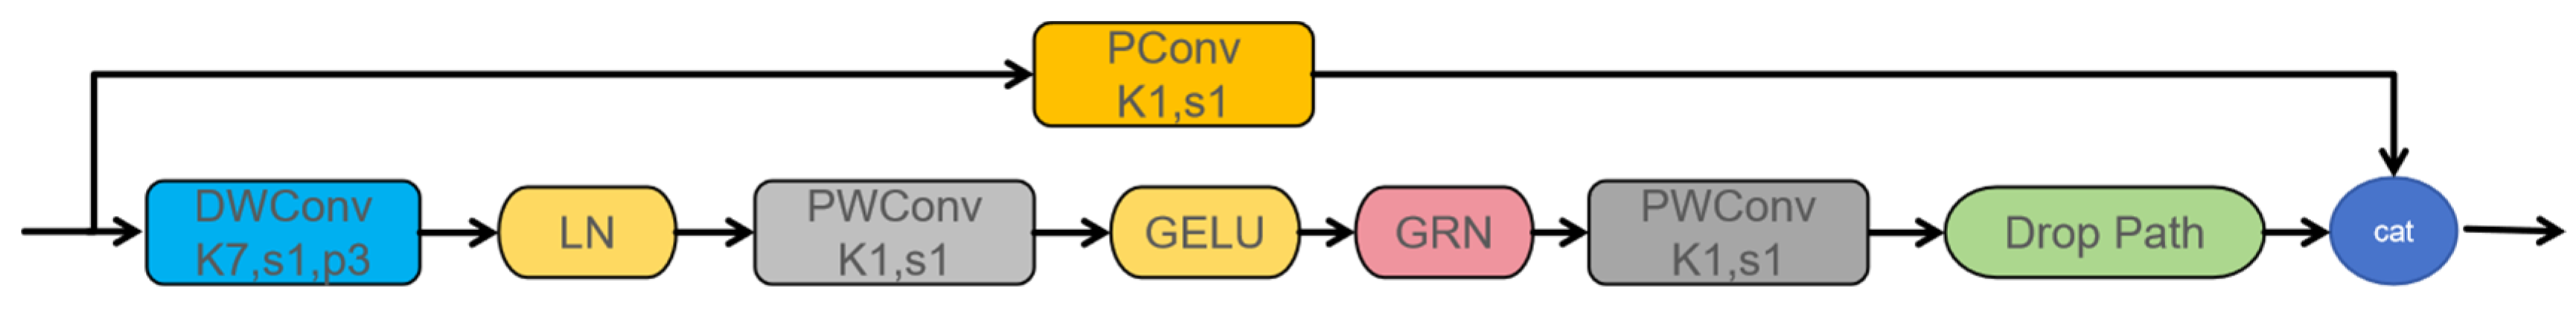
This study proposes the CNxP module and uses the CNxP module instead of the ELAN module in BackBone. The CNxP module can upgrade the low resolution image to high resolution, improve the clarity and detail of the image, help the model better understand the context information of the bayberry image, and improve the accuracy of the repair results. The CNxP module can enhance the feature competition between channels and reduce the number of parameters and computational complexity of the model by normalizing the feature graphs on each channel. The CNxP module structure is shown in Figure 2. This module divides the input feature graph into two branches. The first branch first performs the deep separable volume operation (Dws Conv) on the input feature graph with convolution kernel size 7. The point convolution operation with convolution kernel size 1 (Pw Conv) is then performed to better capture the abstract features in the input bayberry image. Then, the number of channels is increased to four times the input, the GELU activation function is used, and a GRN layer is added to capture important information in different channels. The diversity of features and the representation ability are increased, and the robustness of the model is improved. Finally, point-to-point convolution operation with the convolution kernel size of 1 is used to restore the number of channel sizes, and the results are regularized. The second branch uses the input feature map for PConv operation [40], applying regular Conv on a part of the input channels for spatial feature extraction, leaving the remaining channels unchanged. Using either the first or the last continuous CP channel represents the calculation of the whole feature graph, reduces computational redundancy and memory access, and outputs the final feature map after concatenating the two branches. The PConv module structure is shown in Figure 3.
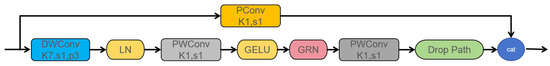
Figure 2.
The ConvNext v2 Block module.
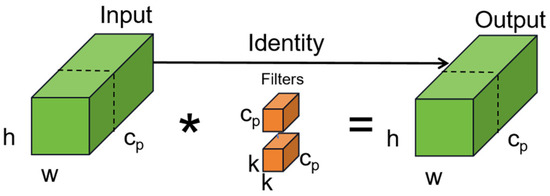
Figure 3.
The PConv module. The * represents convolution.
3.2. SPPFCSPC
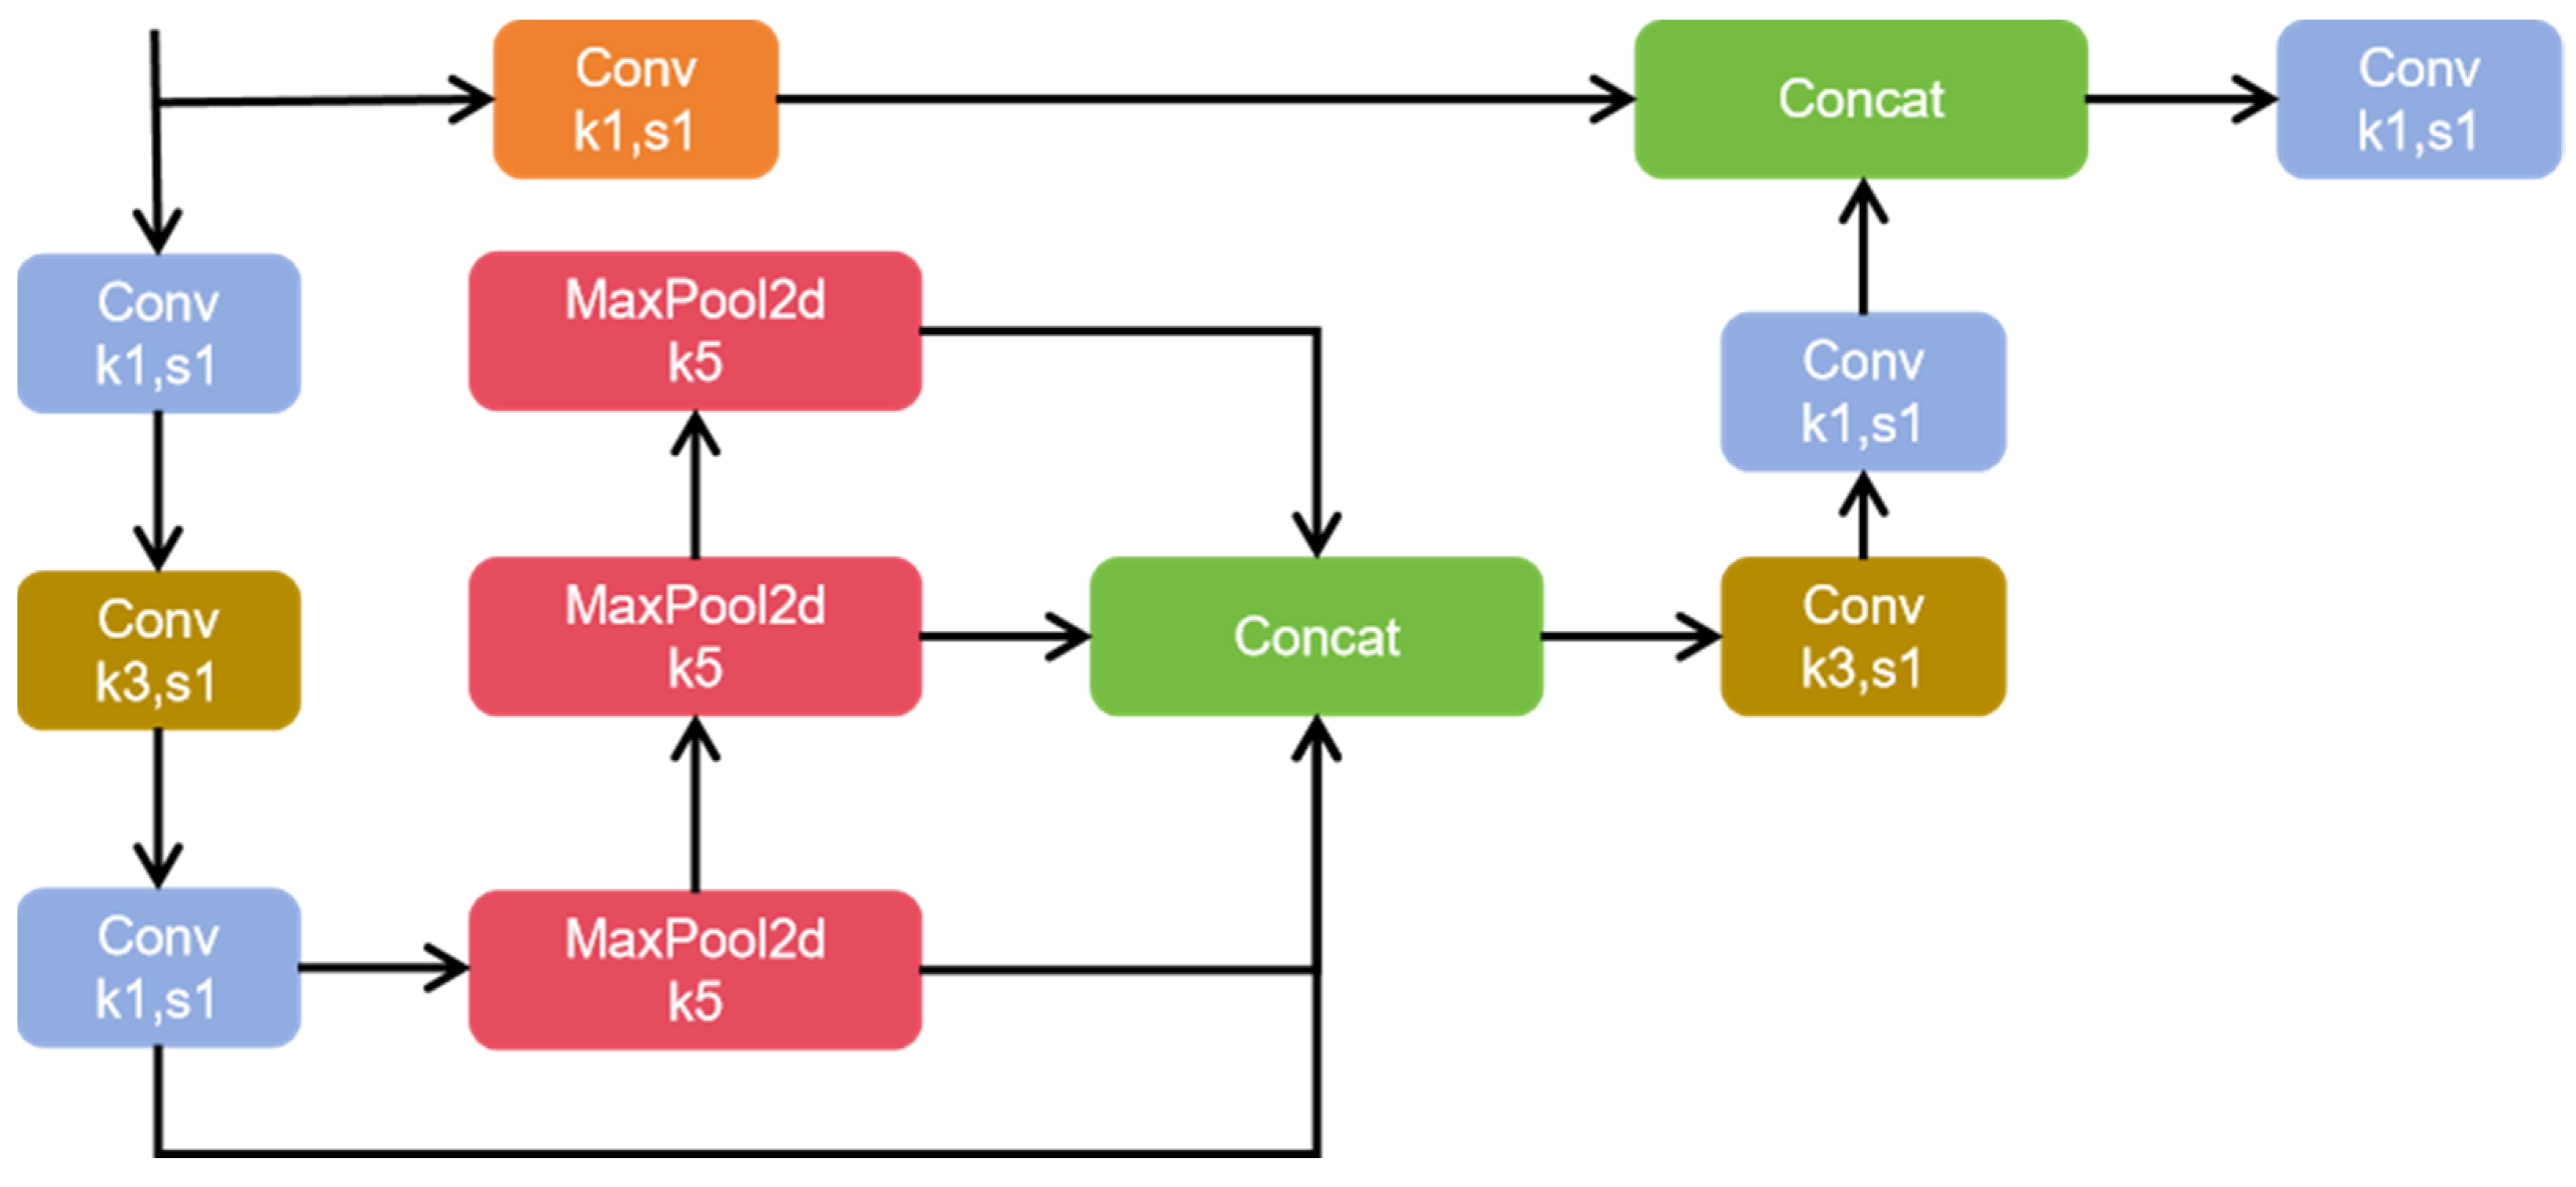
SPPFCSPC contains two submodules: the SPP module [41] (spatial pyramid pooling) and the FCSPC module [42] (fully connected spatial pyramid convolution). SPP is a pooling layer that can pool input feature maps at different scales and can detect both small and large targets. FCSPC is a modified convolution layer that is used to improve the representation of feature graphs and thus improve detection performance. The SPP module carries out multi-scale spatial pyramid pooling for input feature maps to obtain feature maps of different scales and capture target and scene information of different sizes. FCSPC module carries out convolution operations on feature maps of different scales corresponding to multiple convolution kerbs of different scales output by the SPP module, and divides the input feature maps into blocks. The results obtained by pooling each part according to different sizes are spliced according to the original position and then the convolution operation is carried out. While retaining the characteristic information of bayberries, the acceptance field was increased and the accuracy of the model was improved. The SPPFCSPC module is shown in Figure 4.

Figure 4.
The SPPCFSPC module.
3.3. GAM Attention Mechanism
The GAM attention mechanism shares global information between different parts of the model, introducing cross-channel global attention into the model. Firstly, it can dynamically adjust each channel according to the input global information to better capture global information. Secondly, it can use the attention weight, space width, and space height between each pair of three-dimensional channels to improve efficiency, enlarge cross-dimensional interaction, reduce information dissipation, and enlarge global interaction characteristics. The GAM module is shown in Figure 5.
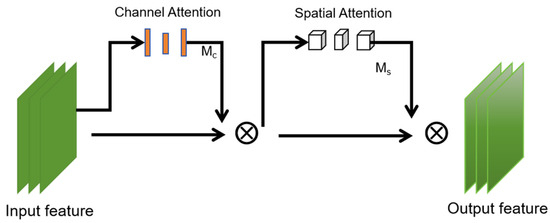
Figure 5.
The overview of GAM.
where the intermediate state F2 and the output F3 are defined as
where and represent channel attention and spatial attention, respectively; represents multiplication by element.
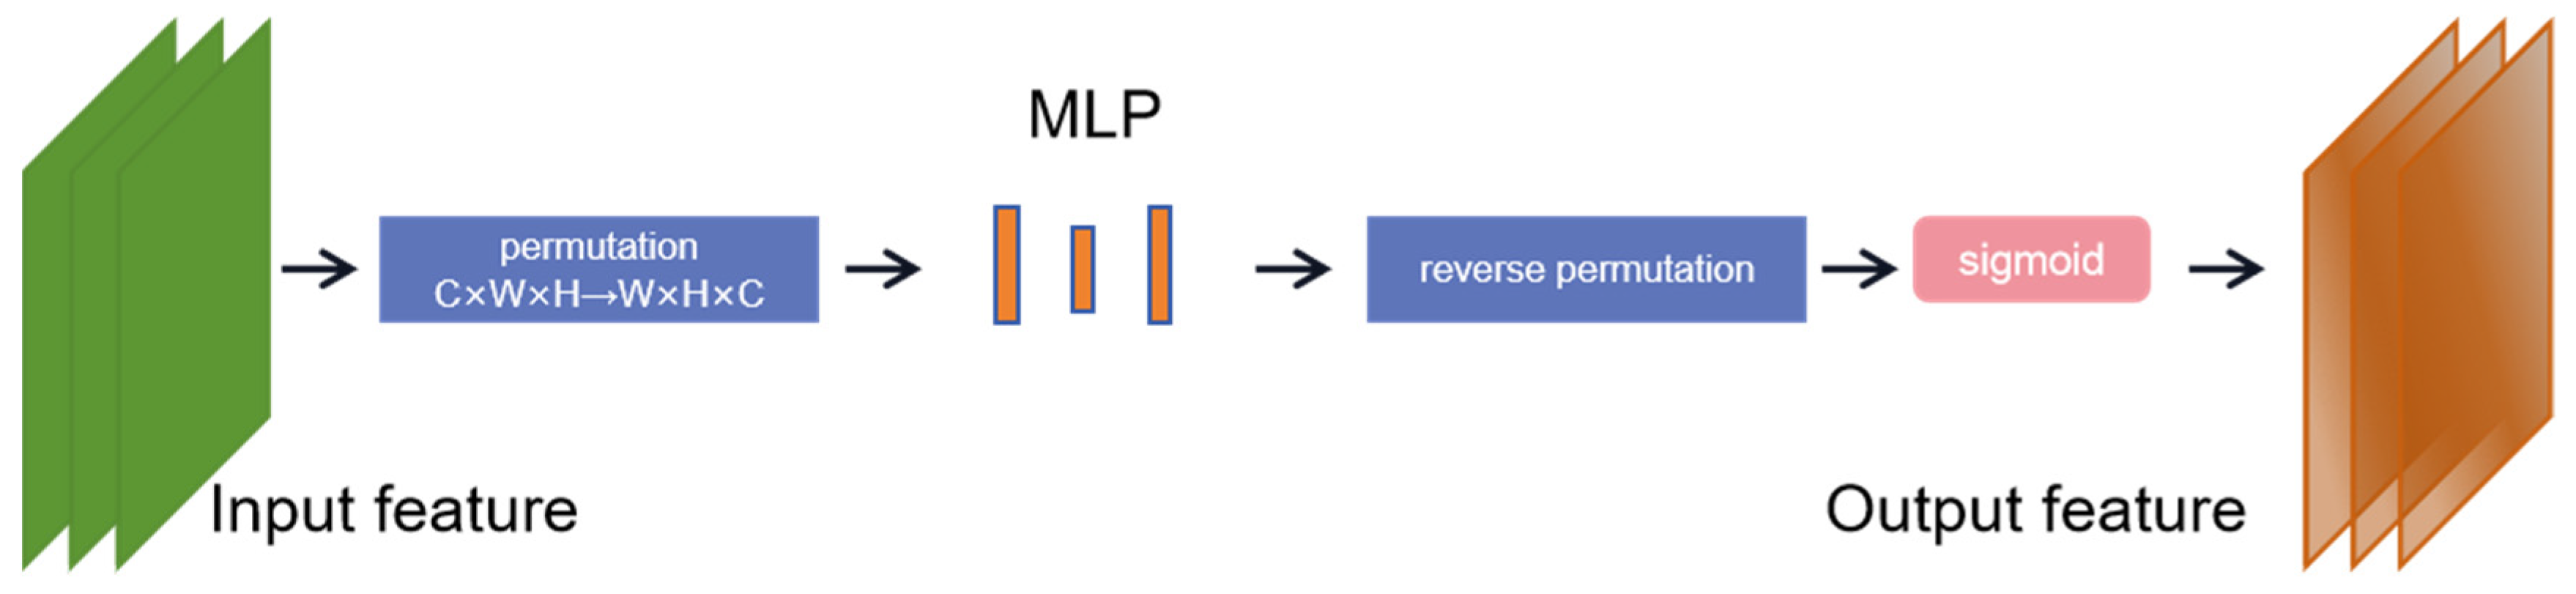
First, the channel attention submodule uses a three-dimensional arrangement to retain information in the three dimensions. It converts the dimension of the input feature map from C × W × H to W × H × C. The feature map after dimension conversion is input into the MLP amplification cross-dimensional channel, and then the feature map is converted into the original dimension for sigmoid processing and output.
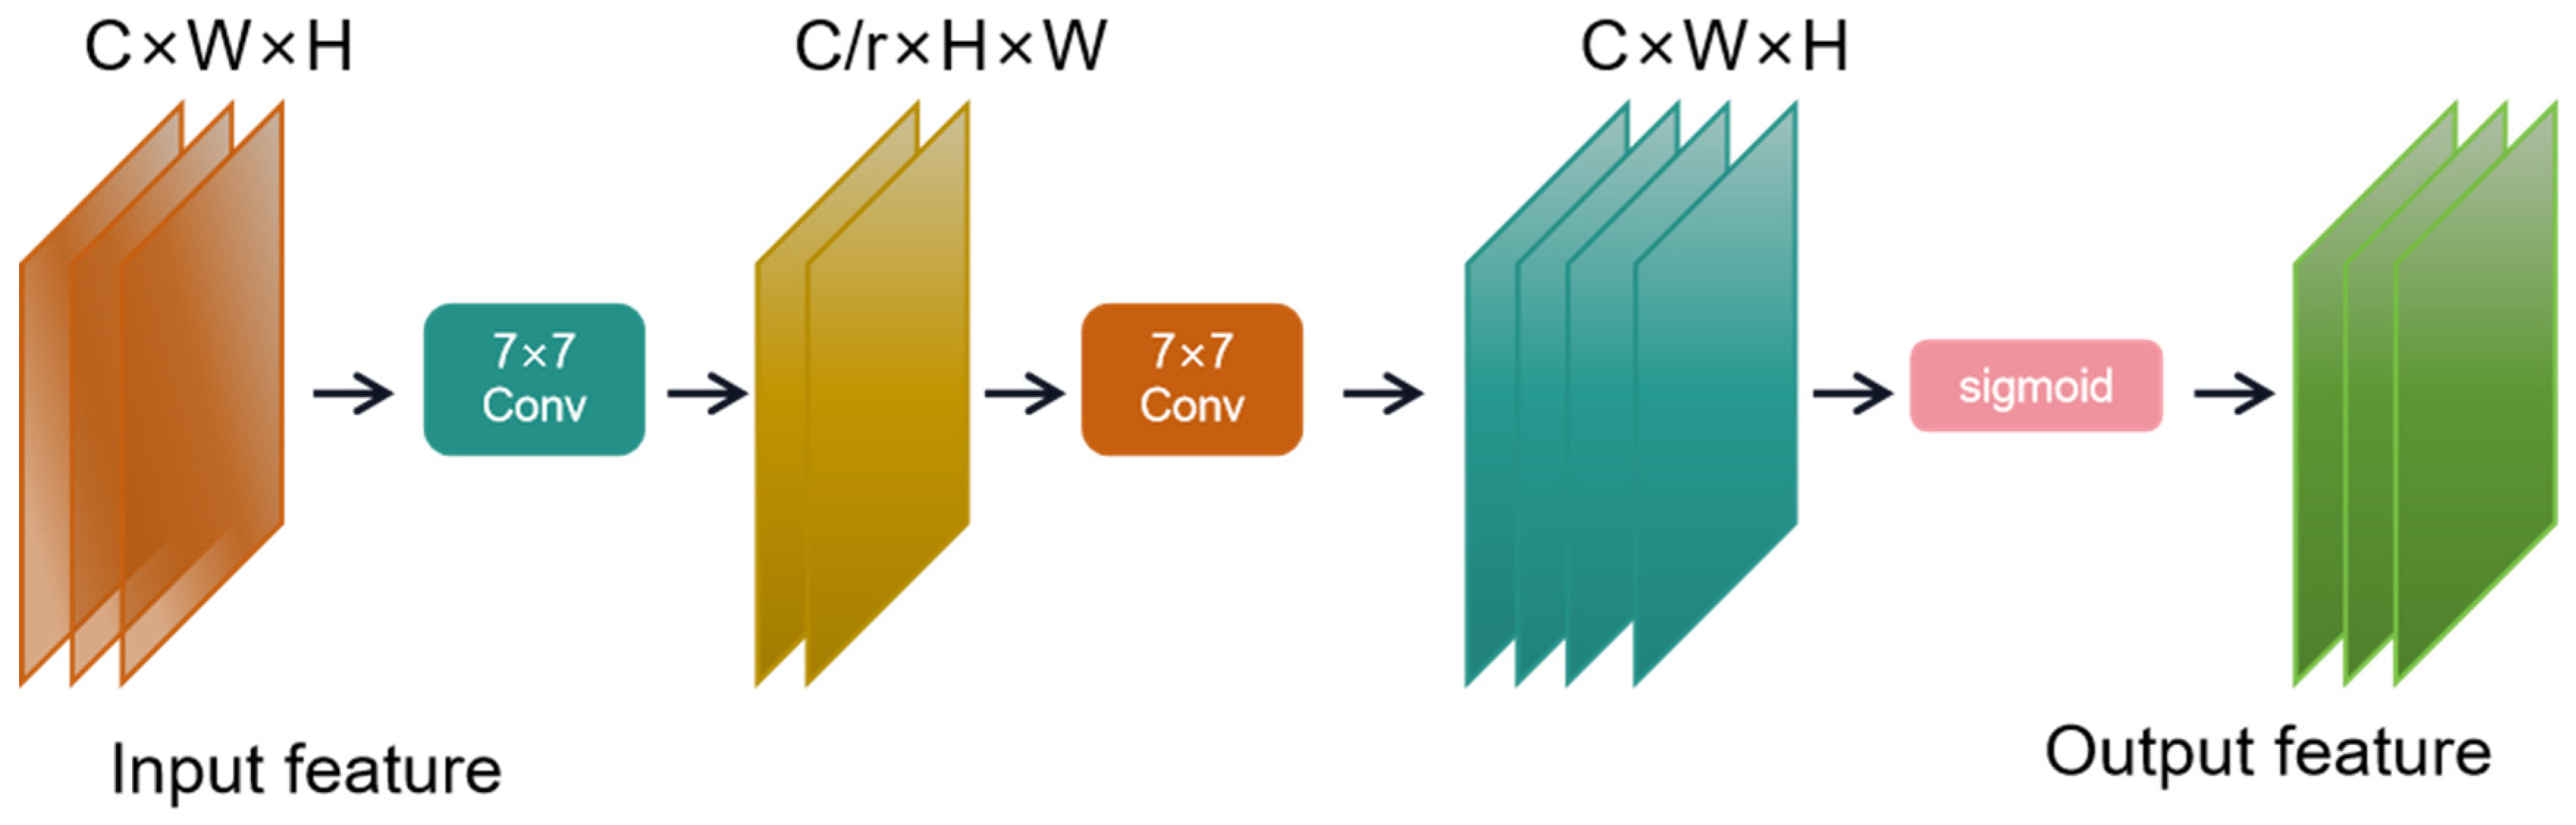
The spatial attention submodule was used to perform convolution processing with convolution kernel of 7 for input features, and the dimension was converted from C × W × H to C/r × W × H to reduce the number of channels and reduce the calculation amount. Convolution with convolution kernel of 7 was used to increase the number of channels and keep the number of channels consistent. Finally, the feature map is output through sigmoid. The channel attention submodule is shown in Figure 6, and the spatial attention submodule is shown in Figure 7.

Figure 6.
Channel attention submodule.
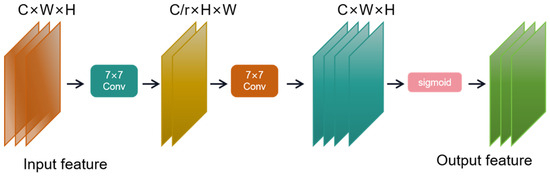
Figure 7.
Spatial attention submodule.
3.4. SPD-Conv
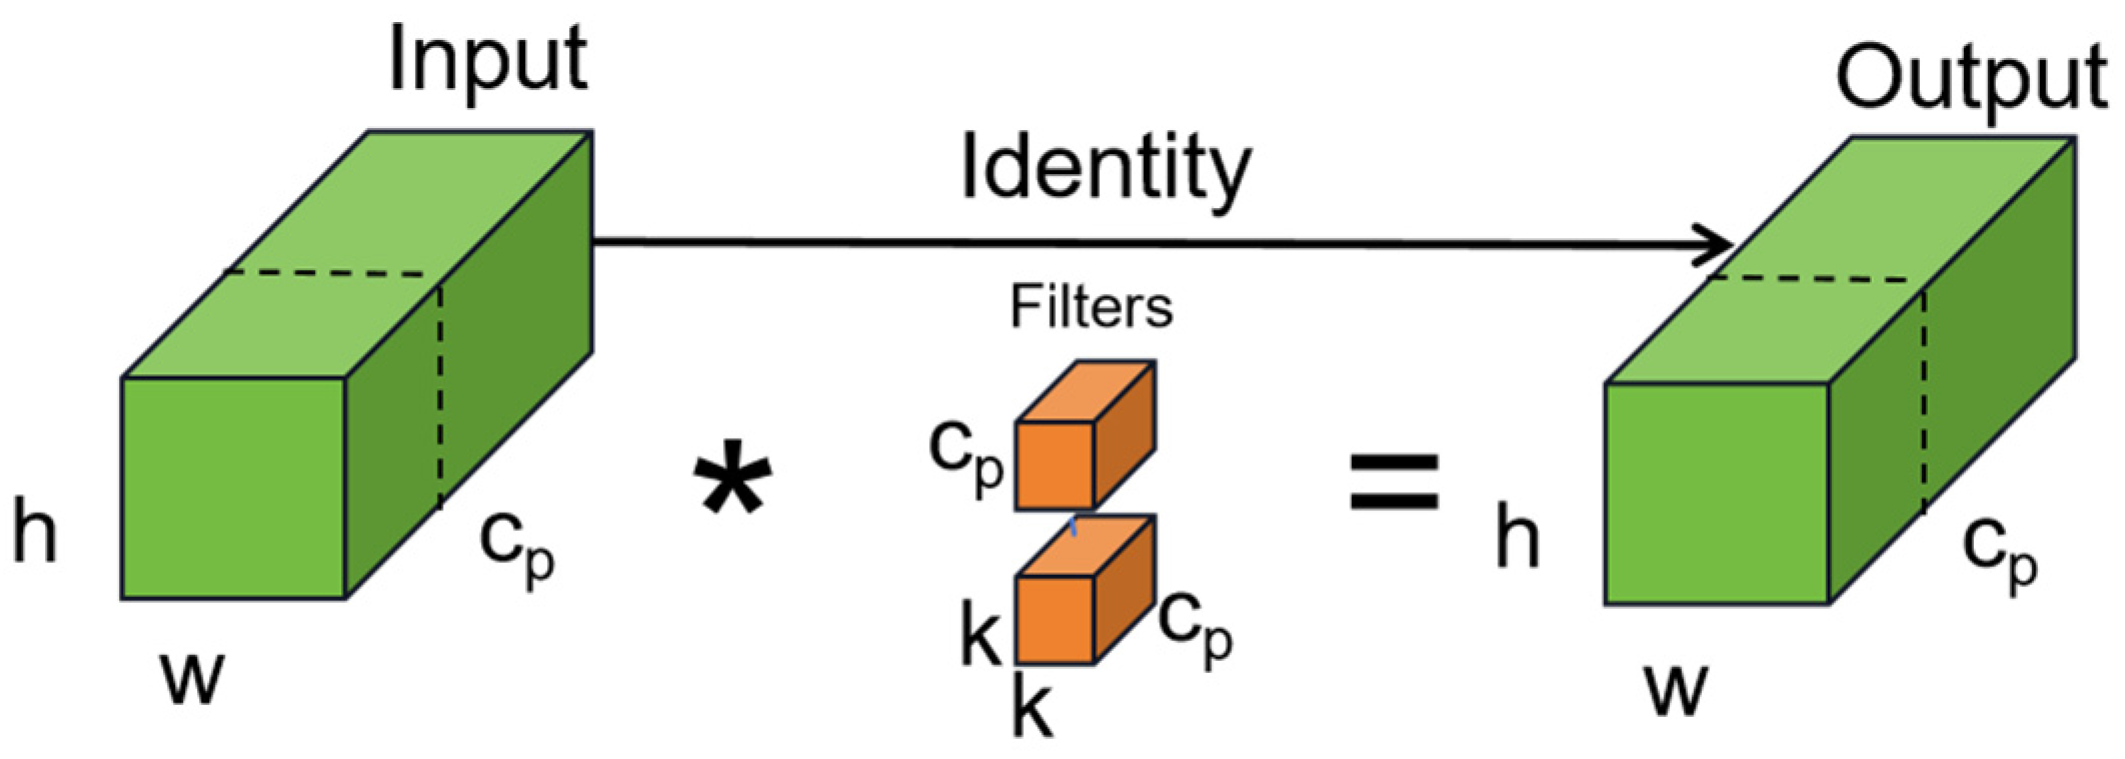
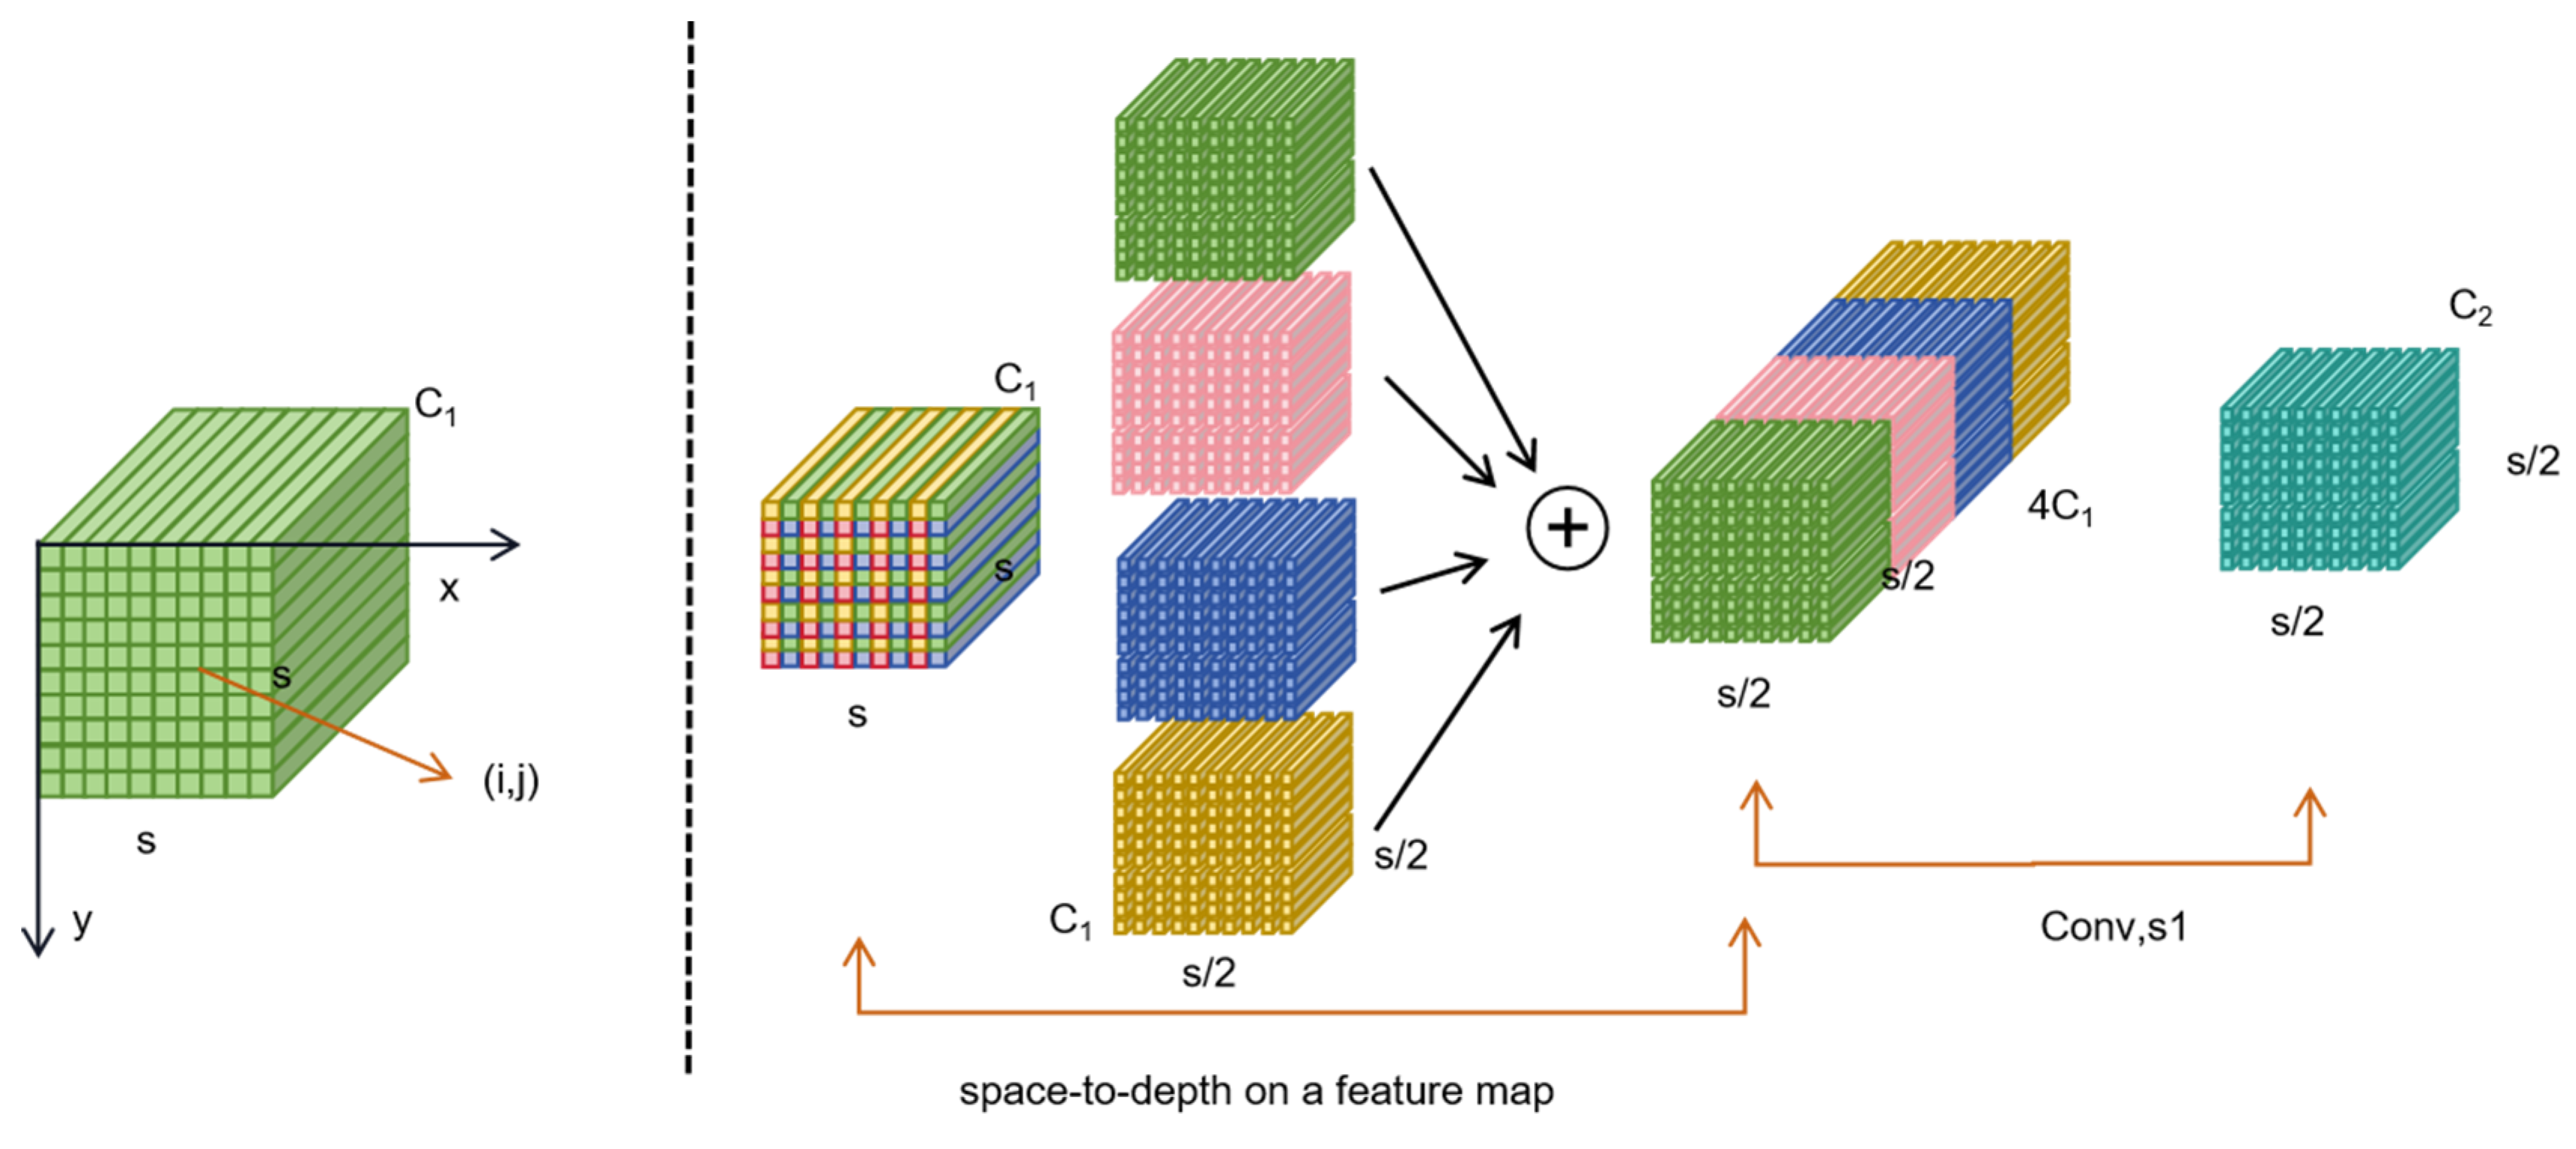
SPD-Conv consists of an SPD (space to depth) layer and a non-step convolution layer. The image conversion technology is extended to downsampling the feature graph in the entire CNN. The original feature map is cropped to a series of sub-feature maps. Each sub-map is downsampling according to a certain scale factor. By connecting these sub-feature graphs along the channel dimension, the feature graphs with reduced scale factors are obtained, which improves the computational efficiency and the performance and generalization ability of the model.
SPD-Conv downsampling does not lose learnable information, while completely eliminating the currently widely used step-size roll-up and pooling operations, showing better results for more difficult tasks such as low-resolution images and small objects. An example when the scale = 2 is shown in Figure 8.
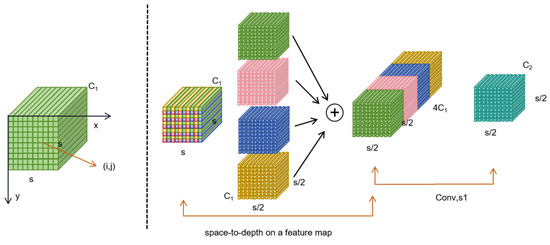
Figure 8.
Spatial attention submodule.
SPD-Conv performs convolution operations with different expansion rates, which increases the expansion rate of the convolution kernel. It can obtain a wider range of receptive fields at different scales and improve the clarity and recognition of fuzzy images. After the SPD feature transformation layer, a non-step (i.e., stride = 1) convolution layer is added to retain all the discriminant feature information. To increase the receptive field without introducing additional parameters, the information of the larger receptive field and surrounding area is used, improving the understanding and judgment ability of the target.
3.5. Wise-IoU
In order to solve the problem that the original IoU in the NMS algorithm does not consider the important difference between bayberry images, we use a dynamic non-monotonic focusing mechanism (WIoU) to replace the original IoU algorithm to solve the problem of NMS algorithm. Wise-IoU uses “outliers” instead of IoU to evaluate the quality of the anchor frame and provides an intelligent gradient gain allocation strategy.
This strategy reduces the competitiveness of high-quality anchor frames and reduces the harmful gradient produced by low-quality examples. This enables WIoU to focus on the normal quality anchor box and improving the performance of poorly labeled datasets.
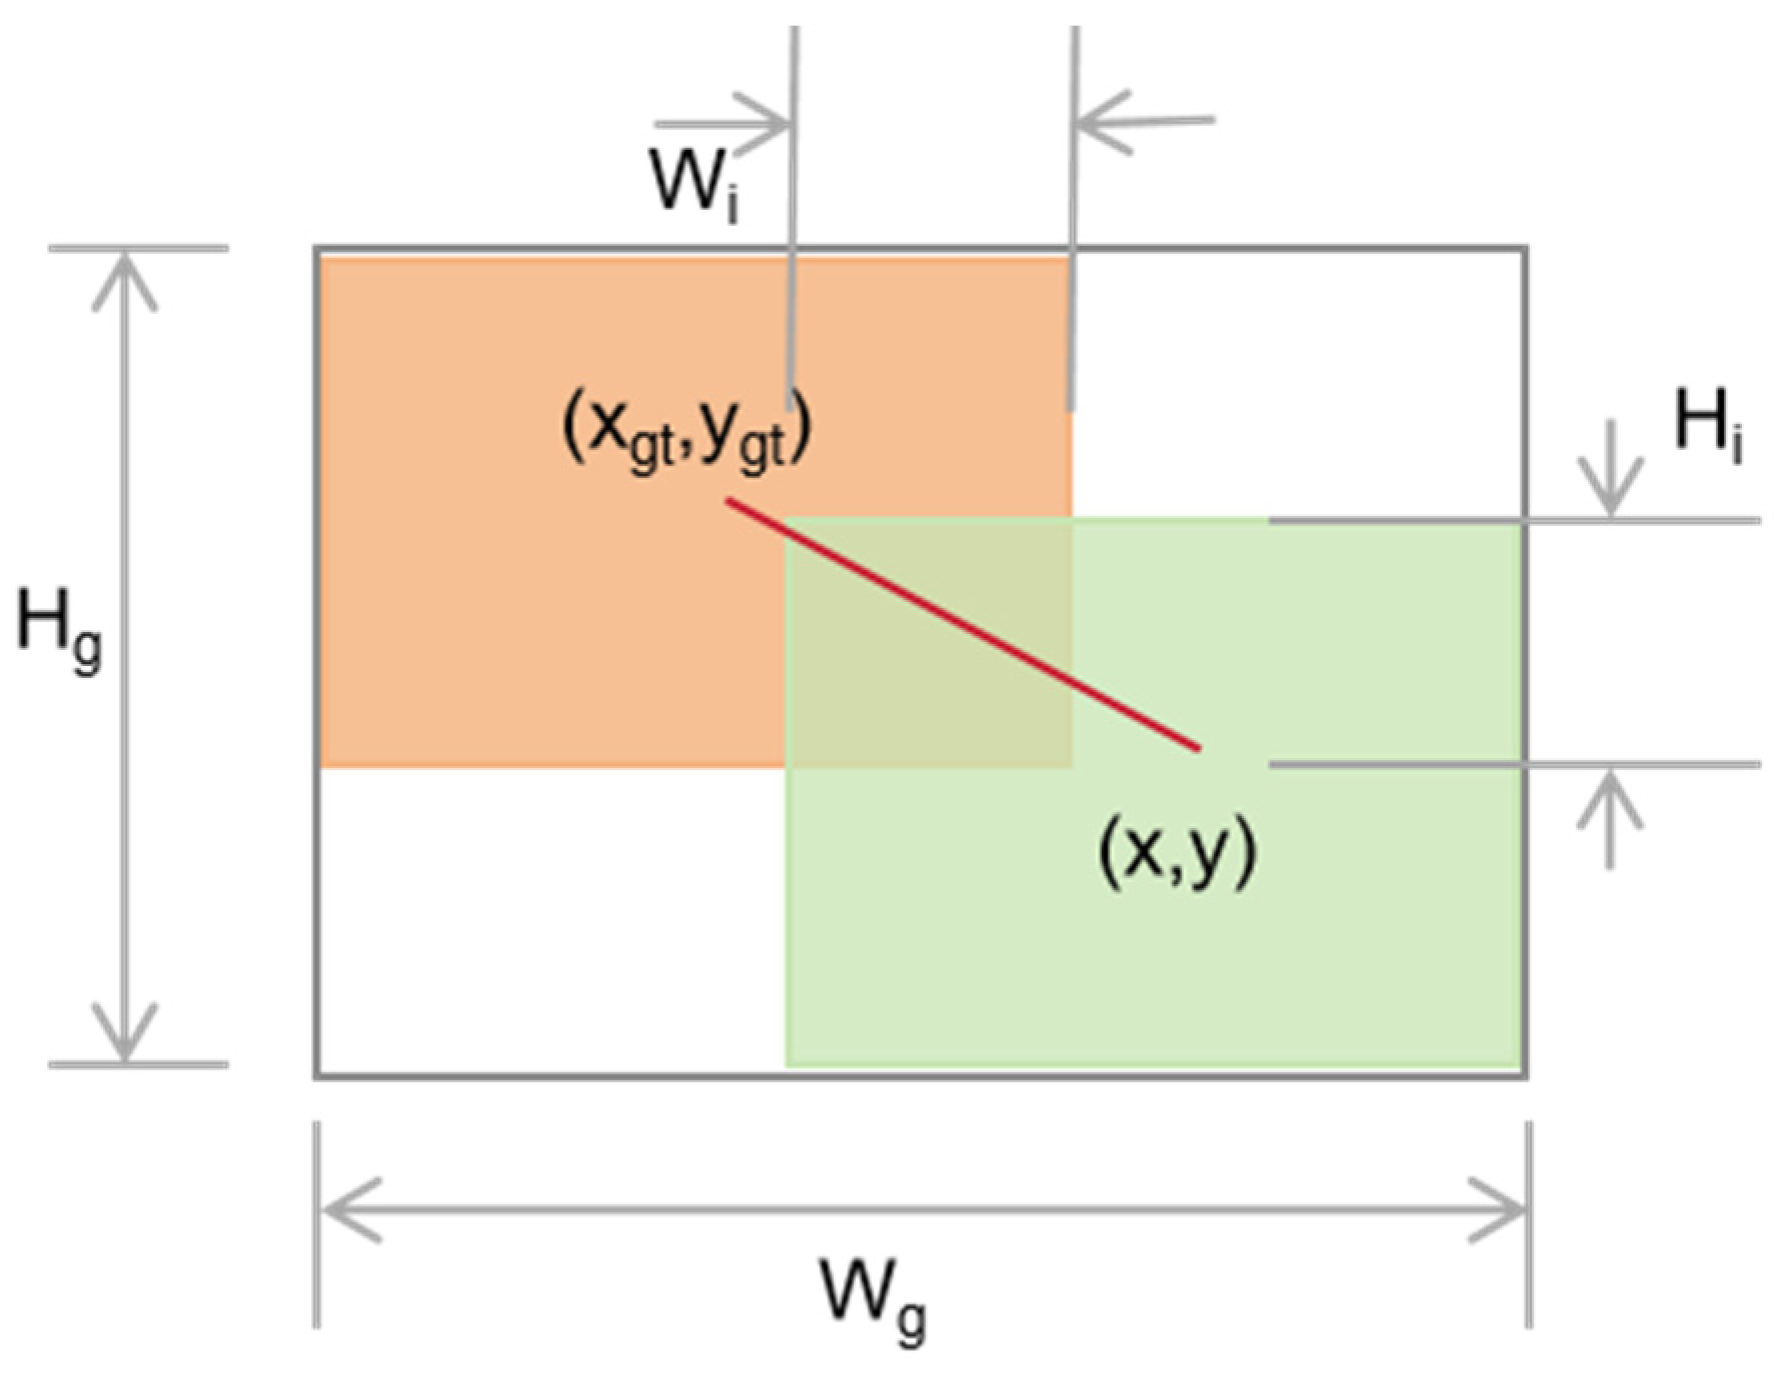
The original IoU is shown in Figure 9.

Figure 9.
Original IOU. The red line represents the connection between the predicted bounding box and the center point of the ground truth bounding box, which is used to calculate the loss of the target detection model.
is the IOU loss and is used to measure the overlap between the predicted bounding box, the predicted box, and the ground truth bounding box. It is defined as a combination of Formula (3) representing loss, and classification loss, defined as Formula (4).
where is the IOU loss, which measures the degree of overlap between the predicted bounding box and ground truth bounding box. is the classified loss. is the width of the overlapping part. is the length of the overlapping part. When the bounding box does not overlap, the backpropagation gradient of disappears, resulting in failure to update during training. Since the training data inevitably contain low-quality examples, WIoU v1 significantly magnifies the A of an ordinary quality anchor box. It focuses on the distance between the center points when the anchor box overlaps with the target box. The formula for is (5) and the formula for is (6).
is the loss of WIoU v1. is the classification loss of WIoU v1. (,) is the center of the prediction box; (, ) is the center of the predicted bounding box; Wg, Hg is the size of the smallest closed box. The means to separate Wg and Hg from the computational graph. WIoU v2 effectively reduces the contribution of simple examples to lost values. WIoU v2 can focus on difficult samples and obtain classification performance improvements. The WIoU v2 loss formula is Formula (7).
where is the gradient gain and is the running average of the momentum m. The dynamic updating of the normalization factor keeps the gradient gain at a high level, which solves the problem of slow convergence in the late training period. The outlier degree of the anchor frame is expressed by Formula (8):
A smaller anomaly means that the anchor box has a higher quality. β is used to construct the non-monotony Focusing coefficient and apply it to WIoU v1. The loss formula for WIoU v3 is Formula (9):
When , r = 1. Because it is dynamic, the quality division standard of the anchor box is also dynamic, which allows WIoU V3 to formulate the gradient gain distribution strategy that is most in line with the current situation at each moment. In the middle and late stages of training, WIoU V3 allocates a smaller gradient gain for a low-quality anchor box to reduce the harmful gradient. At the same time, WIoU V3 focuses on the ordinary quality anchor box to improve the localization performance of the model.
4. Experiments
4.1. Experimental Environment and Model Parameters
The model training and testing in this study were carried out in NVIDIA GTX 1080Ti 12G (NVIDIA Co., Santa Clara, CA, USA). The CPU was 6vCPU Intel(R)Xeon(R)CPU E5-2680 v4@2.4 GHz (Intel Co., Santa Clara, CA, USA), and the operating system was Ubuntu18.04. The deep learning framework used was PyTorch 1.10.0.
In this study, the ratio of positive and negative samples was adjusted by adjusting threshold and anchors. The threshold was set to 0.5 and the batch size was set to 8. A total of 300 epochs were trained. The image size of each input was 640 pixels × 640 pixels of 3-channel RGB image; using the Adam optimizer, the initial learning rate was set to 0.01, the epoch of specific training amount was reduced by 10 times, and the momentum was 0.9. The IoU threshold of the non-maximum inhibition algorithm was set to 0.5, and the top 200 of the error was selected as the training negative sample to ensure that the proportion of positive and negative samples was close to 1:3.
4.2. Data Set
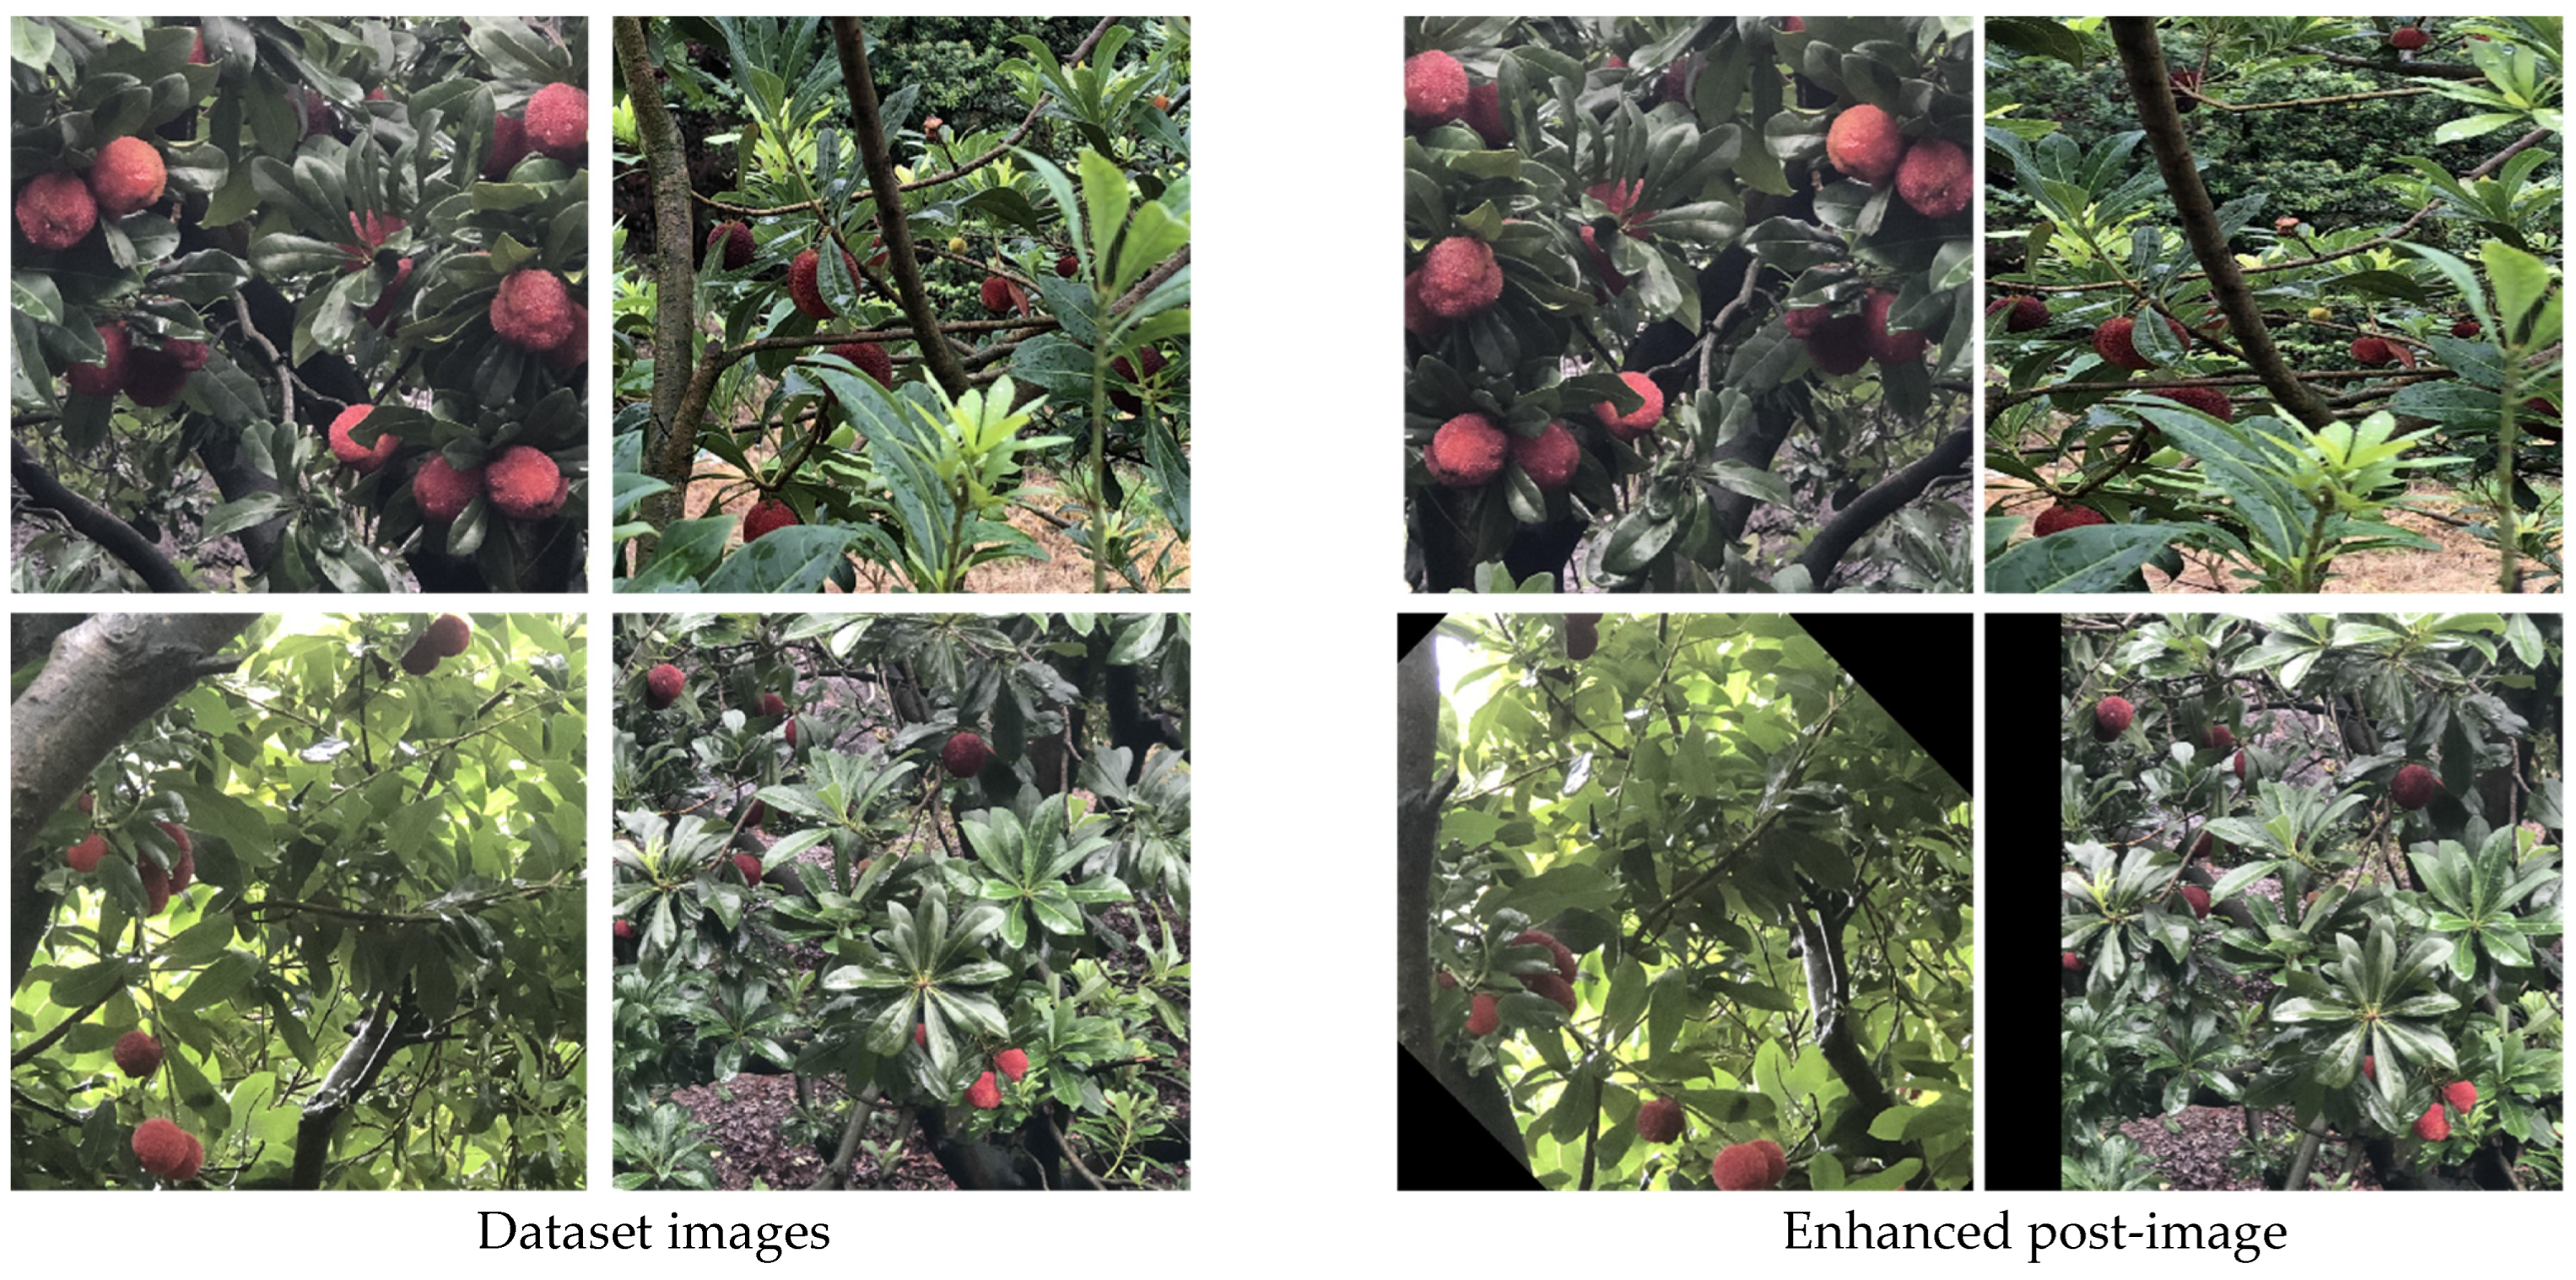
The dataset used in this study was shot in Xianju County, Taizhou City, Zhejiang Province in the summer of 2022. It used vivo X27 (vivo Co. Ltd, Shanghai, China), Samsung-G9550 (Samsung Co. Ltd, Seoul, South Korea), iPhone X (Apple Co., Cupertino, CA, USA), and Sony A6400 cameras (Sony Co., Tokyo, Japan). The images were randomly flipped, rotated 90°, 180°, 270°, reduced by 20%, cropped by 30%, translated to the right by 300 pixels, and to the left by 300 pixels to expand the dataset to 8990 images. Use LabelImg to mark bayberry and divide it into a category. The training set, validation set, and test set were randomly recreated in a ratio of 8:1:1. It was divided into a training set (6707 pictures), a verification set (746 pictures), and a test set (829 pictures). There were 2 to 20 goals in each image. The image and data enhancement of the dataset are shown in Figure 10.
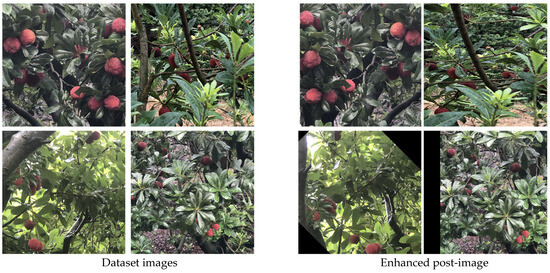
Figure 10.
Dataset image and data enhancement image.
4.3. Comparison Experiment
In order to test the different influences of different backbone modules, feature fusion modules, and attention mechanism modules on the results of the detection of Bayberry primitive YOLOv7 models, this study adopted the method of comparative experiments to obtain the final result through three comparison tests. First, replace the backbone layer of the original YOLov7. We replaced the ELAN module with CNXP proposed by this study and compared MobileNet [43] and Ghostnet [44] networks. The results of the replacement of different backbones are shown in Table 1.

Table 1.
Replacement of different backbones.
Replacing the ELAN modules of YOLOv7 backbone to MobileNet, Ghostnet, and CNxP, mAP0.5 was increased by 0.53, 1.46, and 2.54, respectively, while parameters were reduced by 17.1 M, 7.9 M, and 29.2 M, respectively. It can be seen that by changing the ELAN module in the backbone of YOLOv7 to CNxP, parameters can be reduced while accuracy can be increased, and it is confirmed that the CNxP module has improved the model.
In this study, after replacing the ELAN module as CNxP in the backbone, three attention mechanisms, GAM, SimAM [45], and HAT [46], were added to the neck. The results of adding different attention mechanisms are shown in Table 2.
Table 2.
The results of adding different attention mechanisms.
It can be seen that the GAM module increases the number of parameters, and the accuracy increases by 0.41. Adding the SimAM module parameters did not increase, mAP increased by 0.14. Adding the HAT module, mAP reduced by 0.18, the parameter increased. The addition of the GAM module increased the number of parameters in a reasonable range and will not have a negative impact on the training speed and related performance of the network. On the basis of selecting GAM attention mechanism and adding SPD-Conv module to the table head, this study tested the influence of different feature fusion modules on model accuracy and parameters. The experimental results are shown in Table 3.
Table 3.
Use of different feature fusion methods.
It can be seen that using the IPAnet and ASFF [47] feature fusion methods, the accuracy is decreased and the parameters are increased. Only using RepGFPN improves the accuracy without adding additional parameters. Finally, a complete YOLOv7-CS model was formed by adding activation functions. The accuracy reached 90.21%. Compared with the original YOLOv7, the parameters were reduced by 17.3 M and the accuracy was improved by 5.43%.
4.4. Ablation Experiments
In order to verify the functions of the CNxP module (CNxP), REPGFPN module (RGF), SPD conversion module (SPD), GAM module (GAM), SPPPFCSPC module (SPPFC), and Wise-IoU function (WiOU), use the YOLOv7 model to detect the ablation experiment. The experimental results are shown in Table 4.
Table 4.
Ablation experiments.
Under the same conditions, the baseline network of YOLOv7 had mAP 0.5 of 84.78%. MAP 0.5 and MAP0.95 were improved after joining the CNxP module, of which MAP0.5 increased by 1.77% and parameters decreased by 29.2 m. It shows that replacing the ELAN module in the backbone as CNxP can improve the accuracy while reducing the parameters. Adding RepGFPN module mAP 0.5 was slightly improved, and adding SPD-Conv module before the prediction head meant that although the number of parameters increased by 8.7 M, mAP 0.5 was increased by 0.95%, effectively capturing the features of small and blurred objects and improving the ability to detect them. Using the new functional pyramid SPPFCSPC module, mAP 0.5 was enhanced by 0.48%, indicating that an increased receptive field is beneficial for target detection. By adding the GAM module to the neck layer, mAP 0.5 increased by 0.41%. It shows that GAM can effectively extract the channel and spatial information of the input features, and can use the information effectively in multiple dimensions to improve the performance of the detection network. With the addition of the WiOU function, mAP 0.5 was improved by 0.36% to avoid the problems of undetected objects resulting from high object density. The above method increased the number of parameters by adding some modules, but the overall parameter number was less than the YOLOv7 original network, the overall mAP 0.5 increased by 5.43%, and the parameter number decreased by 17.3 M. For the detection of multiscale dense bayberry datasets, using ConVNext v2 instead of the ELEN structure in the backbone layer and simultaneously adding Pconv is used to extract spatial features more efficiently. Adding the SPD module and introducing GAM attention mechanism module can extract features on different scales and improve the recognition of fuzzy and smaller bayberries. An additional focusing mechanism was applied to the Wise-IoU algorithm to improve the ability to identify overlapping and blocked bayberries.
4.5. Count Function
The gap between the predicted value and the true value can be visualized by adding the count indicators, and the count indexes after adding different modules are shown in Figure 11.
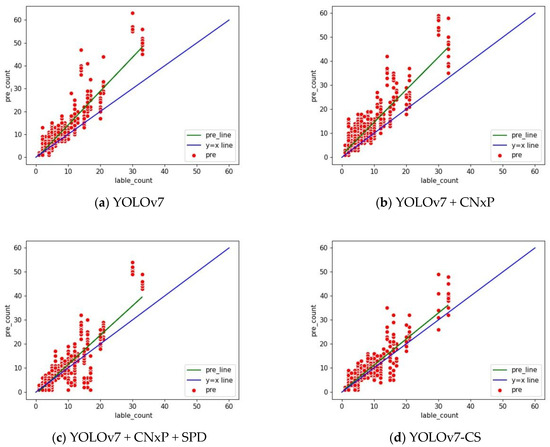
Figure 11.
Count indicator. The horizontal coordinate represents the actual quantity of arbutus in the picture, the vertical coordinate represents the predicted quantity of arbutus in the model, and the green line represents the deviation between the predicted value and the actual value. The closer it is to the blue line, the more accurate the predicted value is. (a) is the counting index model of the predicted quantity and accurate quantity of the original YOLOv7. (d) is the improved counting index model. (b,c) are the count index models after gradually increasing modules. Through our continuous improvement, the gap between the predicted value and the true value gradually decreases, and the count is more accurate.
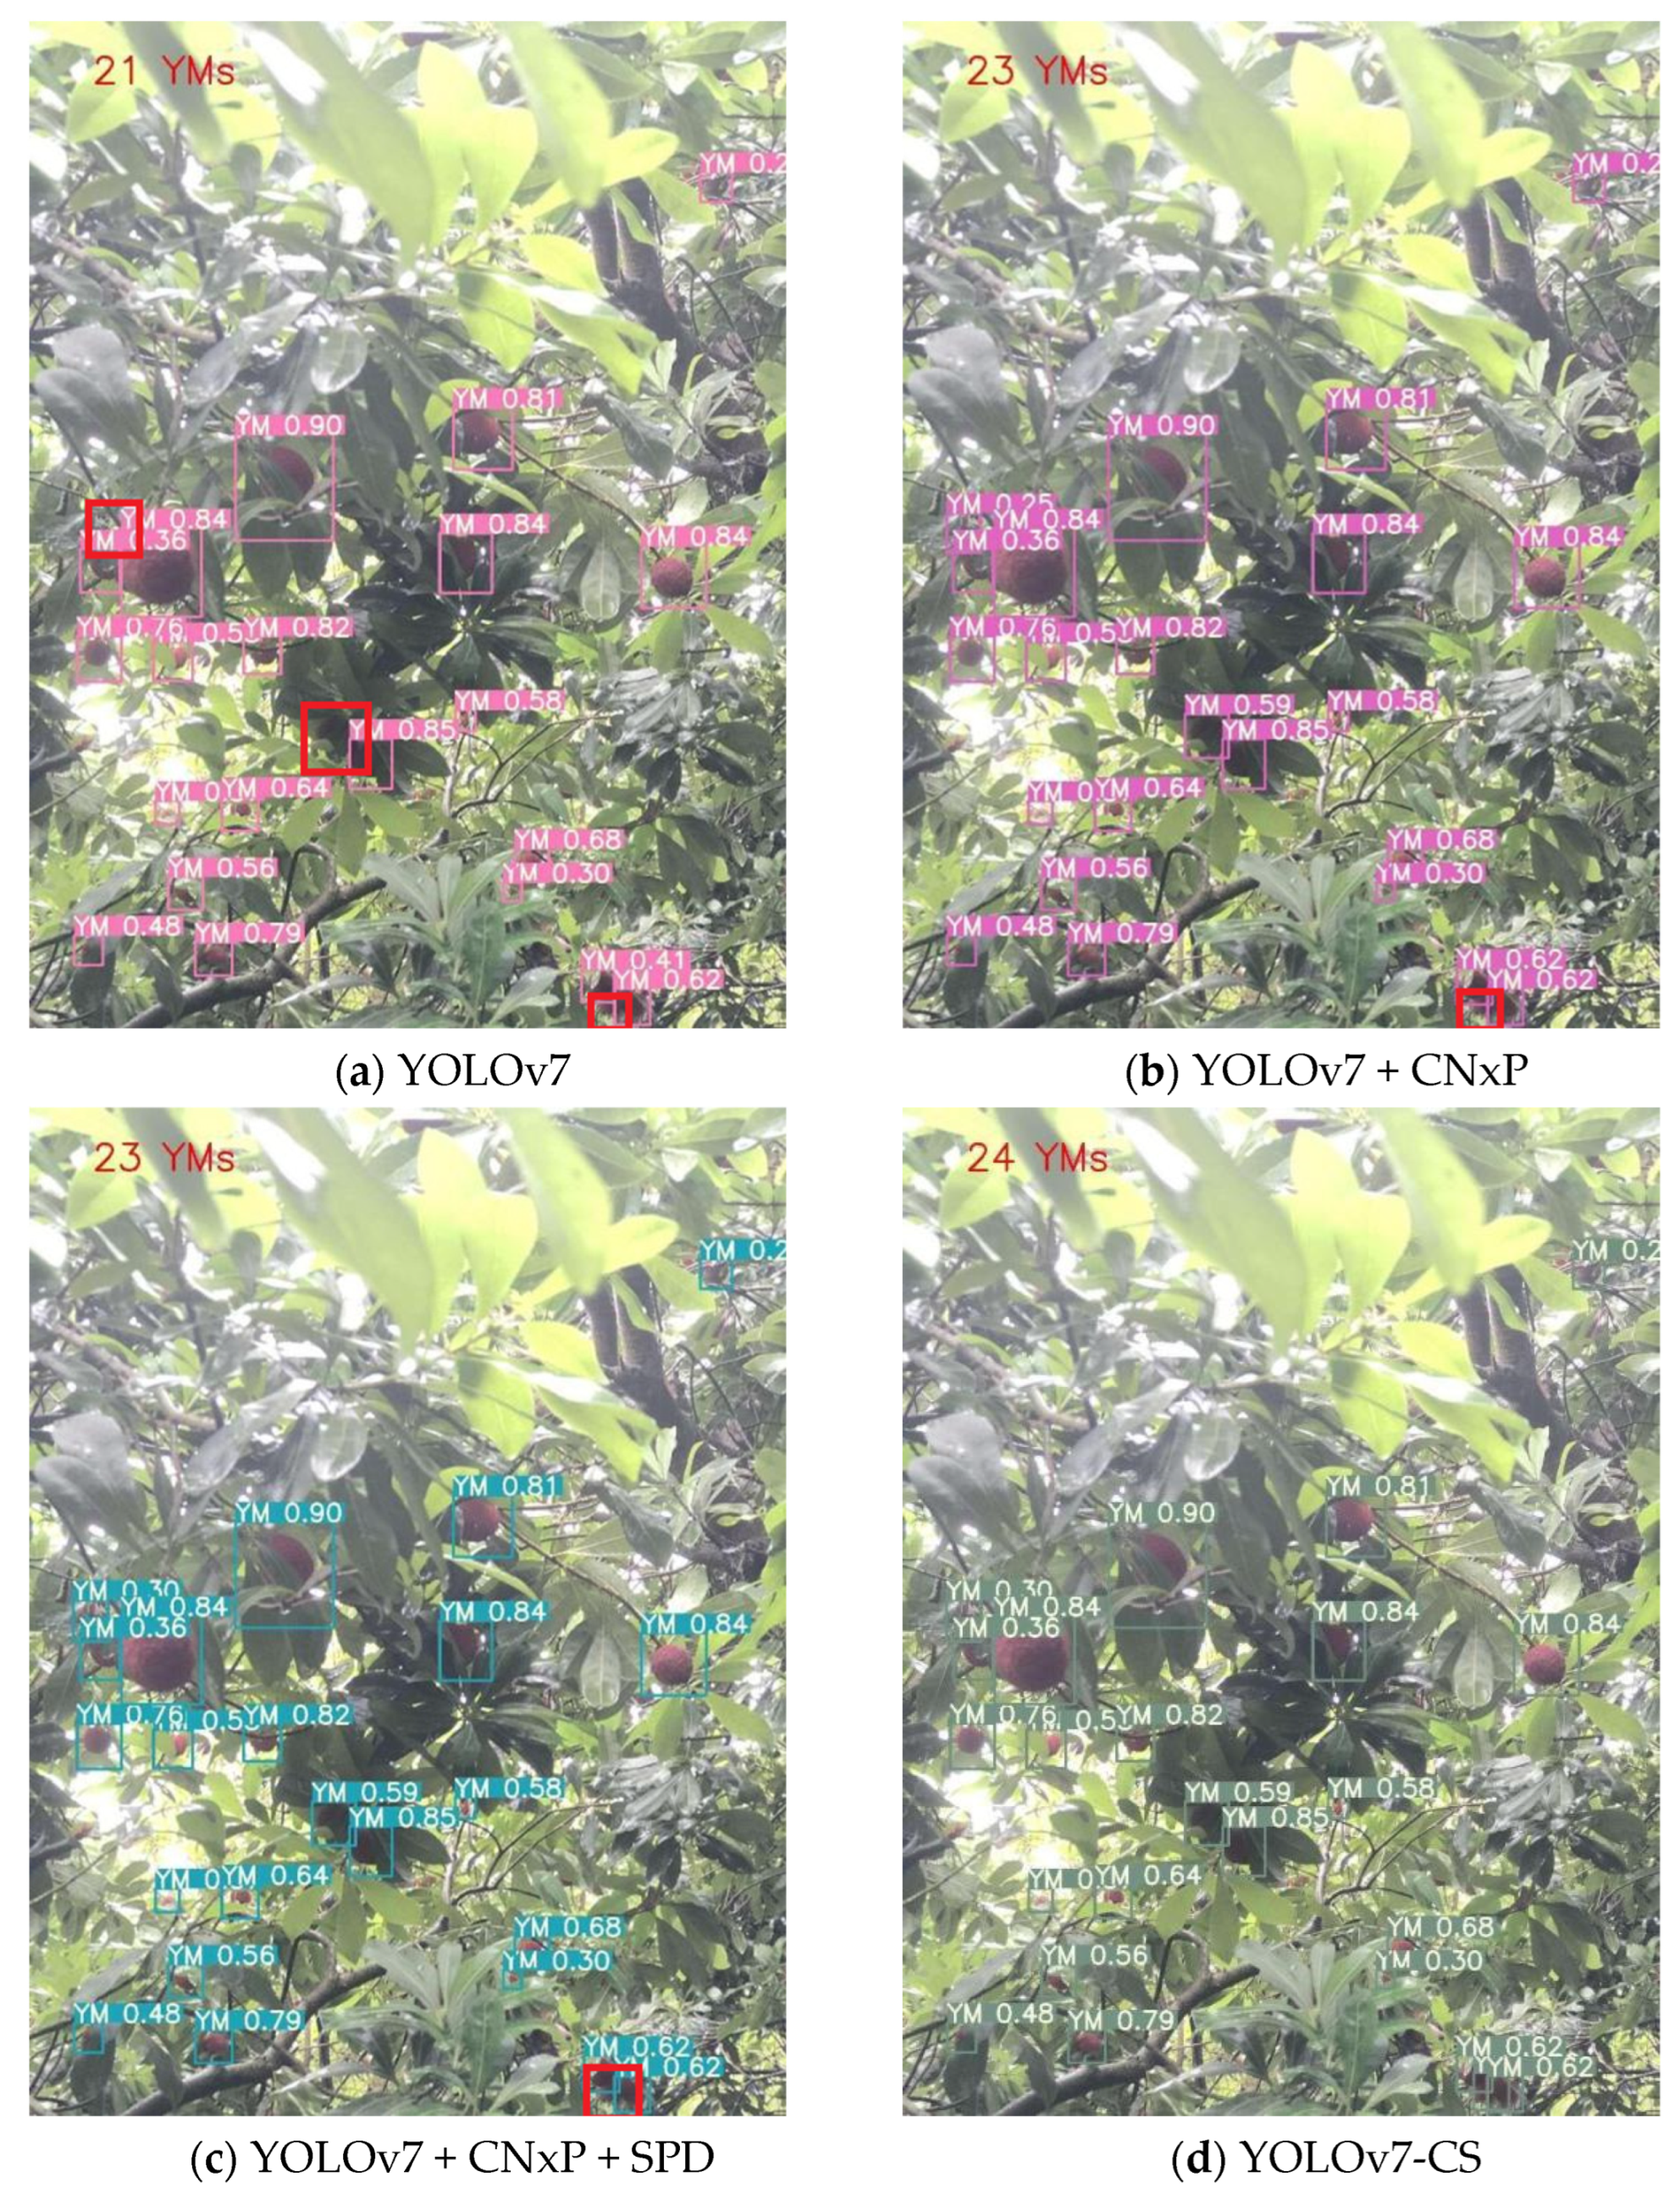
When counting function is added to the model, the amount of bayberry parameters can be better estimated, and the parameter changes in each part can be observed visually. The detection results after counting are shown in Figure 12.
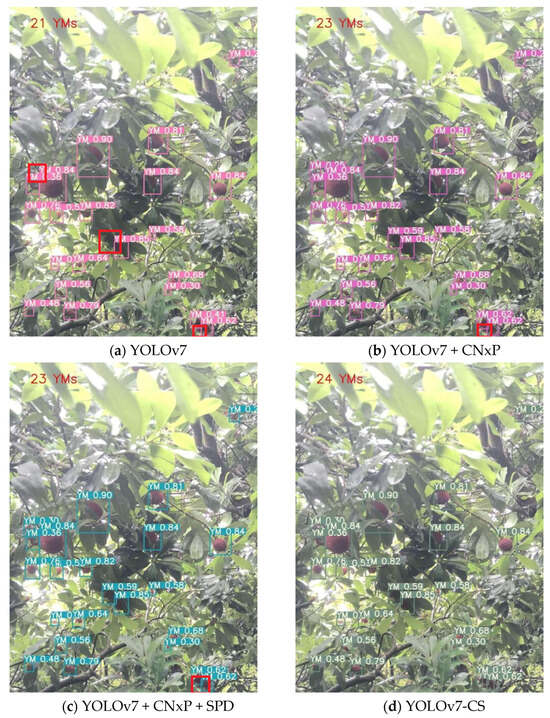
Figure 12.
Counting of the test results. The red box is the missed bayberry targets. The different colored bounding boxes in each image are the detected bayberry targets.
4.6. Choose Different Models
The experiment and the mAP index values were calculated separately, the results are shown in Table 5. The detection effect is shown in Figure 13.
Table 5.
Results of arbutus detection for the different models.
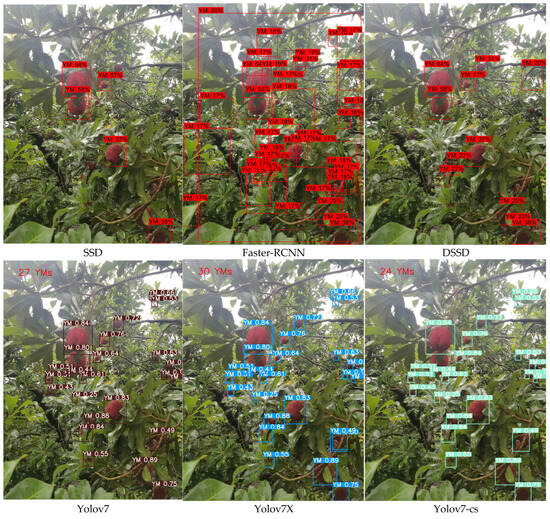
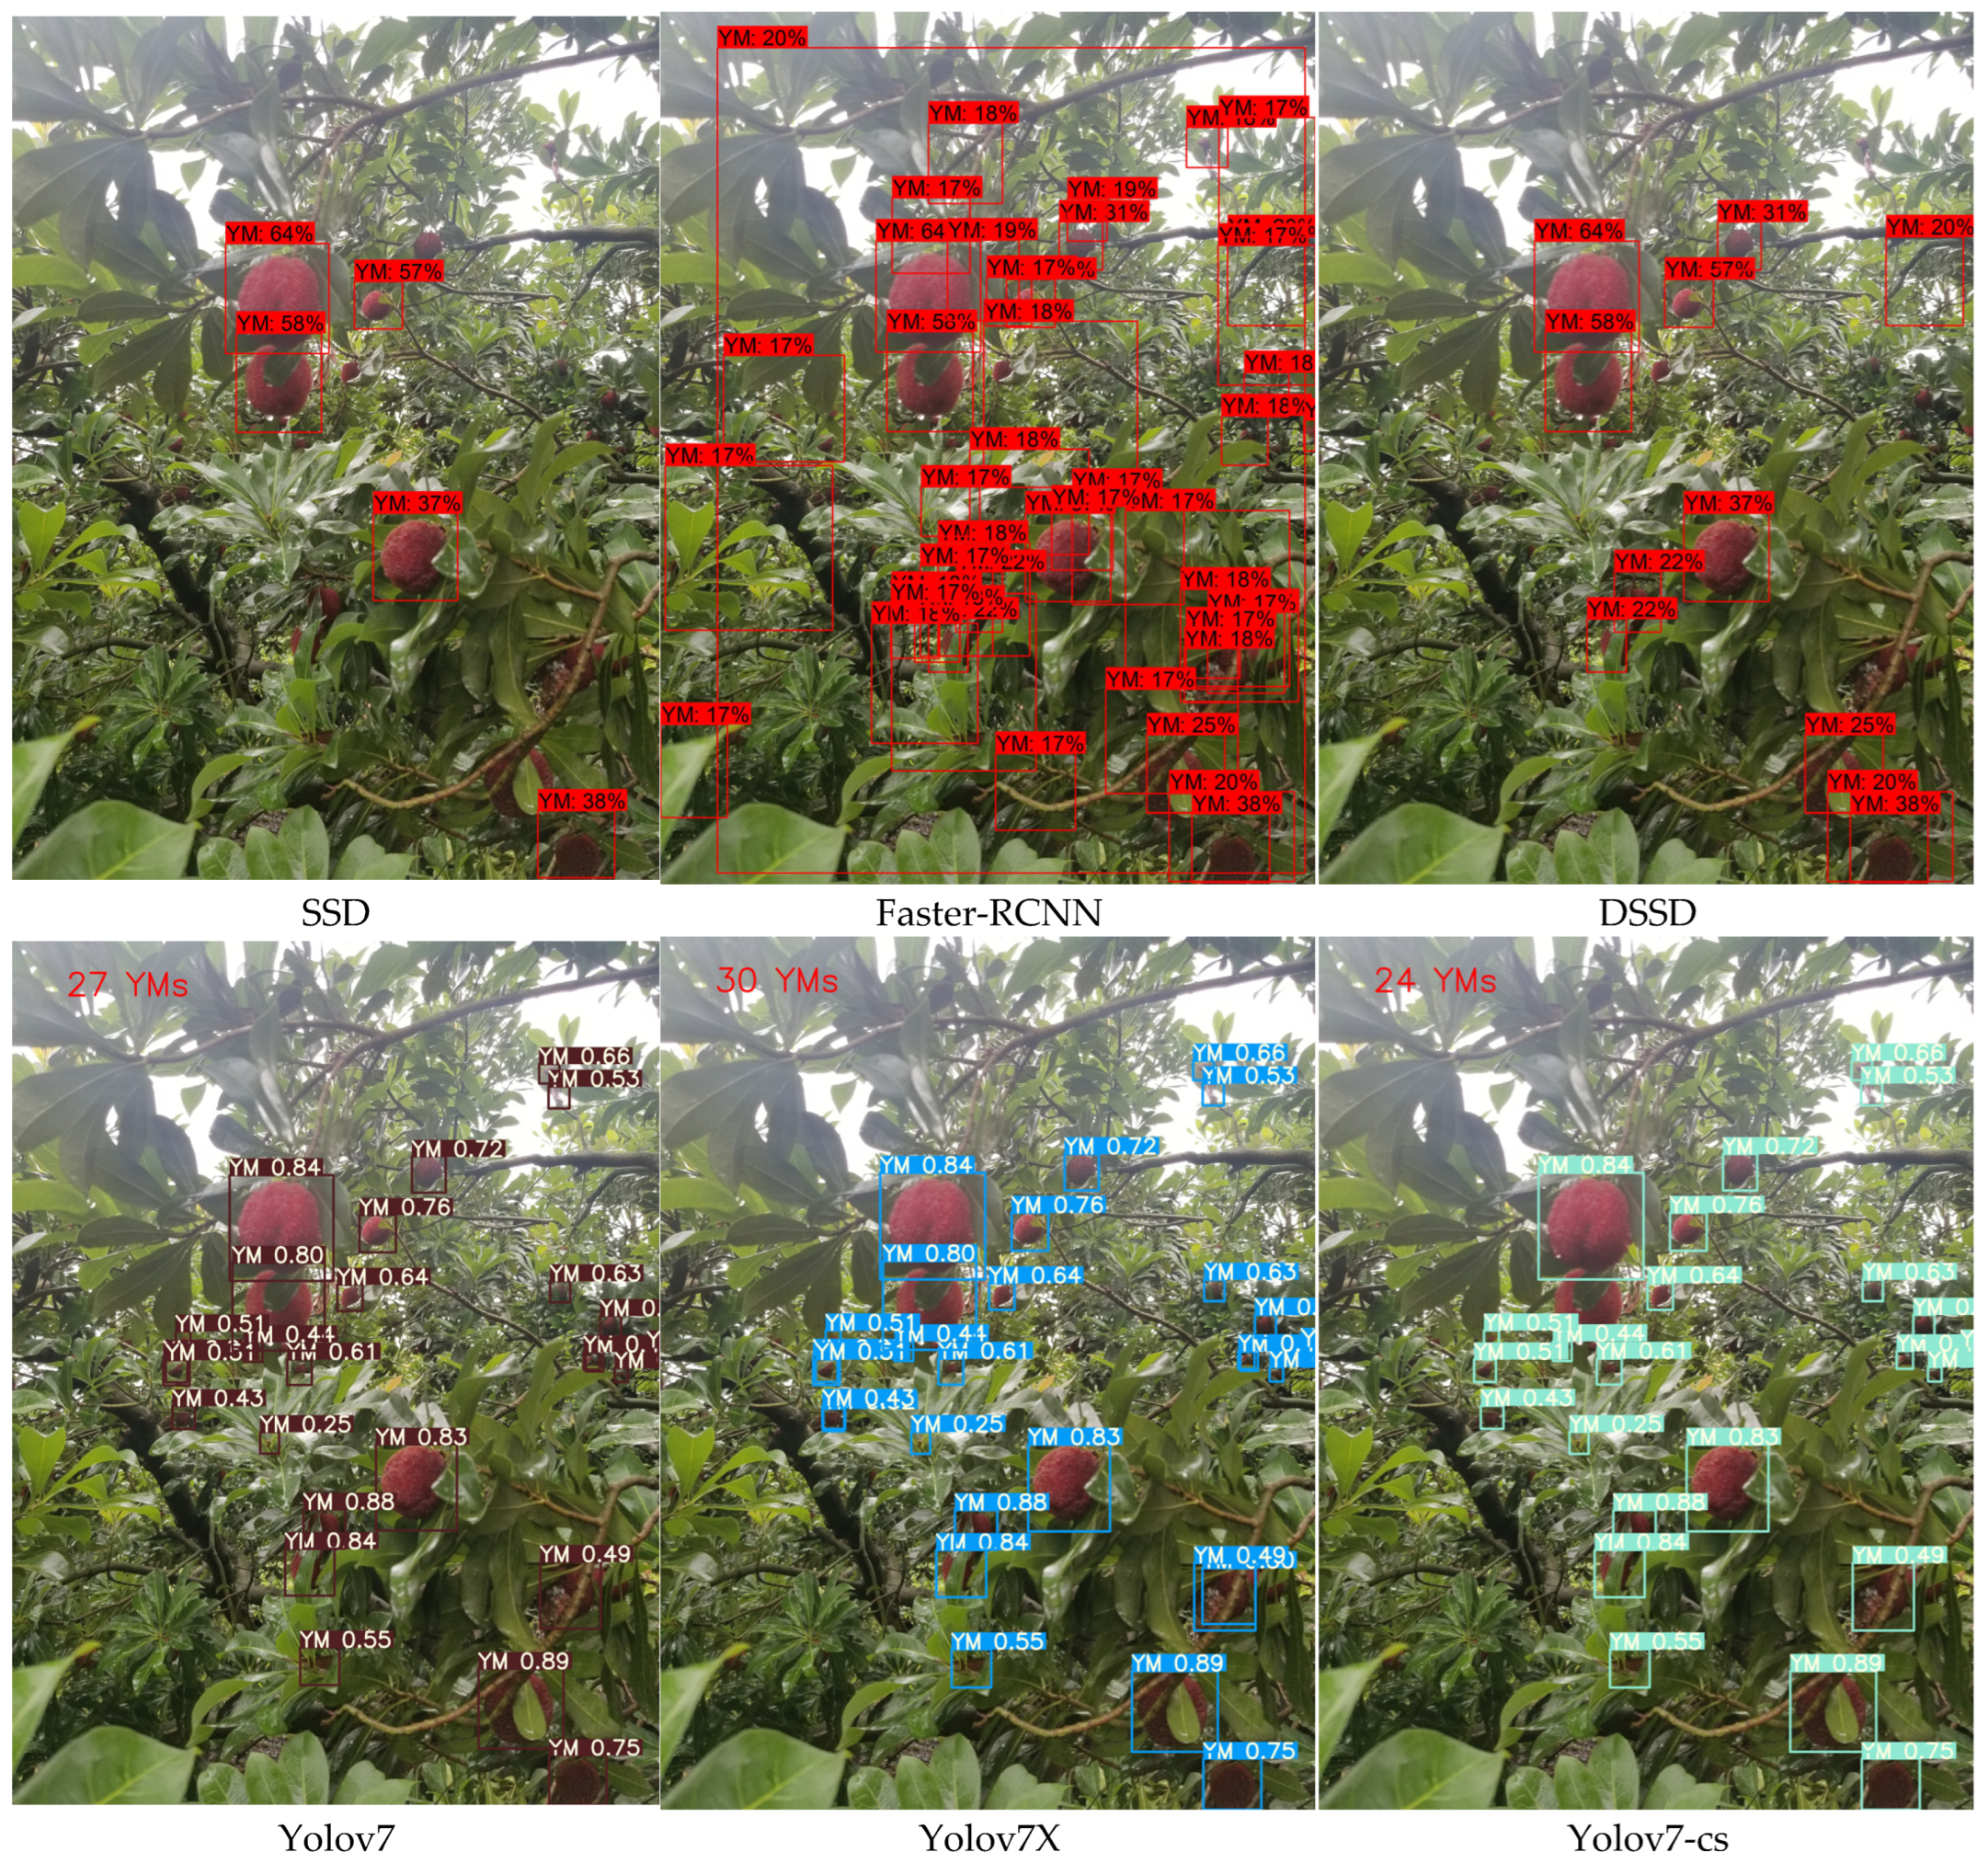
Figure 13.
Detection effects of bayberries based on different models. The different colored bounding boxes in each image are the detected bayberry targets.
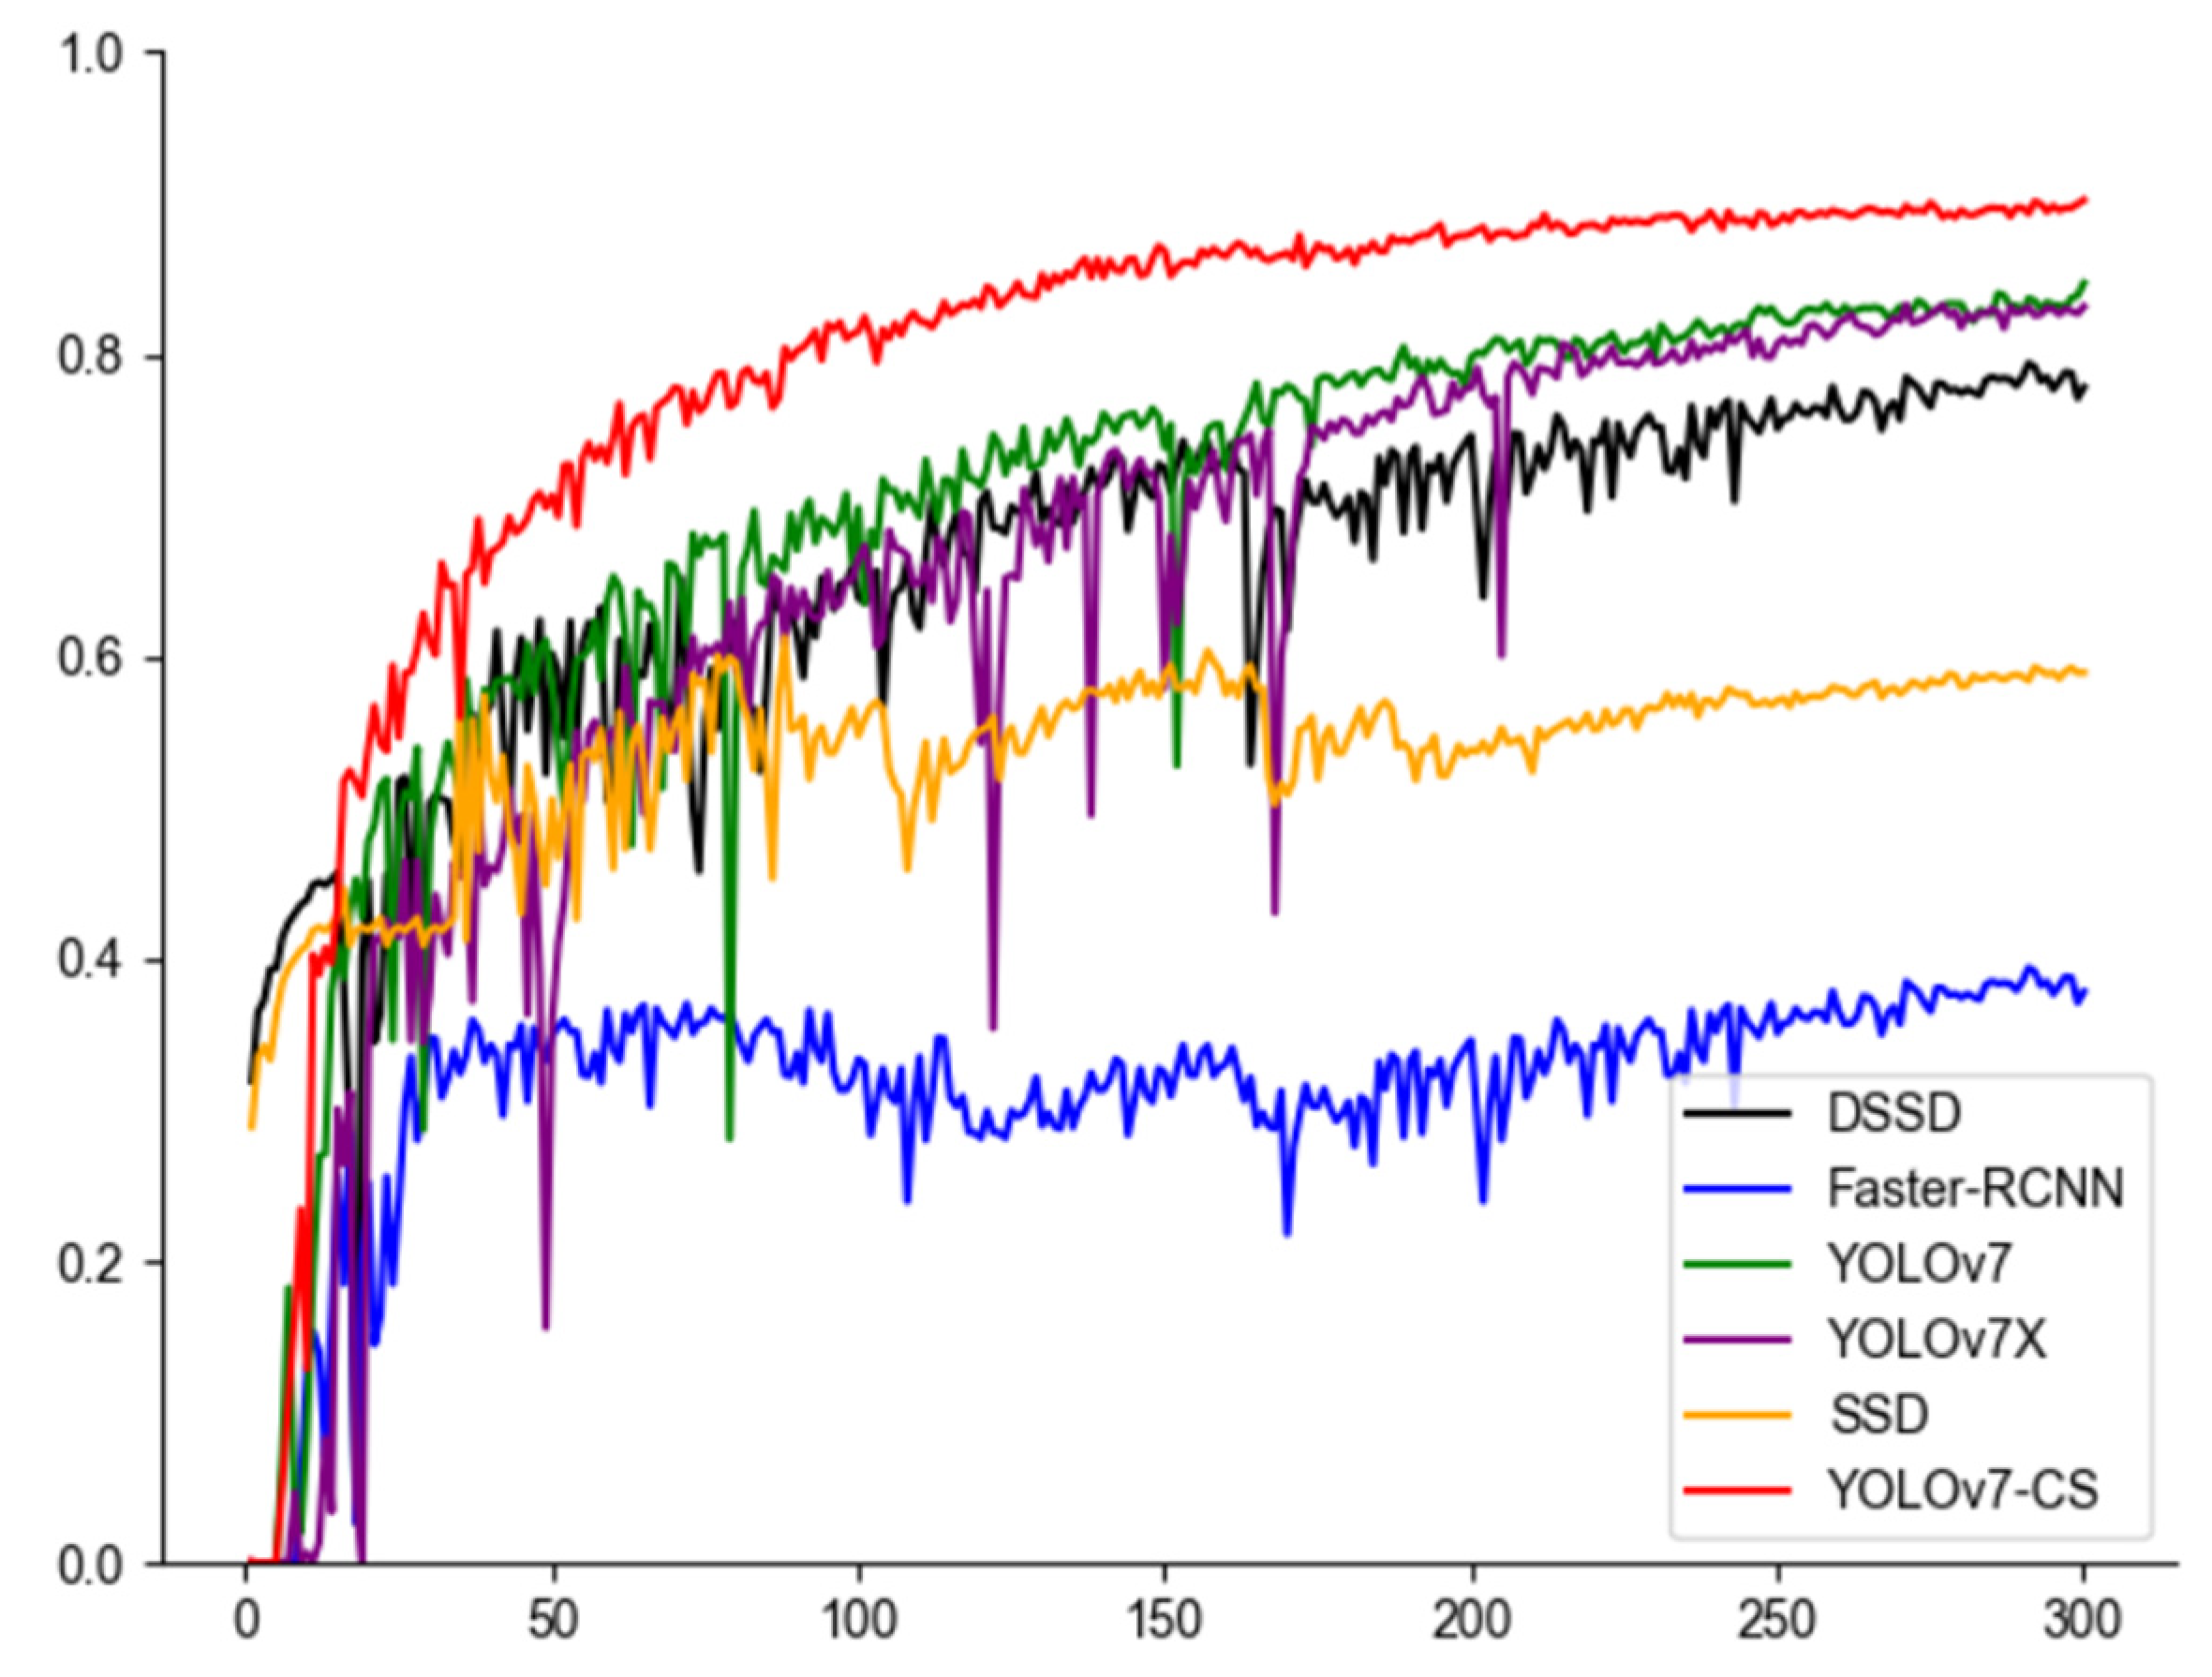
According to the test results, it can be seen from Figure 13 and Figure 14 that the mAP fluctuation in the original YOLOv7 is obvious, while the curve of the YOLOv7-CS proposed in this study is smooth, indicating that the improved model is more robust and has a stronger generalization ability for data distribution, noise, environmental changes, etc., and can detect and locate targets more accurately. The performance improvement and stability improvement of YOLOv7-CS model are proven.
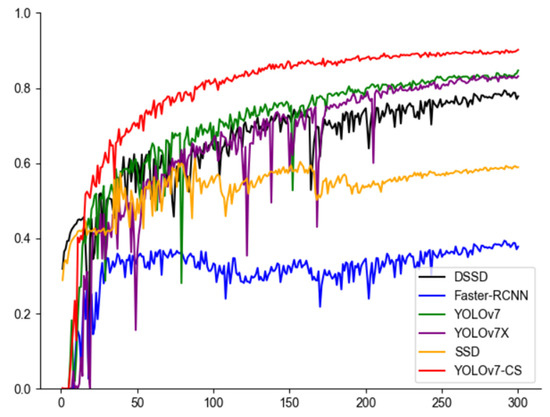
Figure 14.
Detection results of bayberry based on different models.
The SSD model has a high missed inspection rate during the detection of the bayberry image, and the edge positioning of some bayberry has inaccurate positioning. The mAP is 35.52 percentage points lower than the YOLOv7-CS model, indicating that the model cannot completely capture the shape and size of the bayberry. It shows that in bayberry characteristics extraction, its characteristics are not enough to distinguish between the characteristics of the model. Using the Faster-RCNN [48] model, only a small number of bayberries were detected in the image, and inaccurate positioning, large anchor frame size, and mAP were 56.74 percentage points lower than the YOLOv7-cs model. This indicates that Faster-RCNN can only detect objects smaller than the network input images. If the target object is larger than the input image, the input image must be resized, resulting in the loss of bayberry information and the increase in misdetection rate. Using the DSSD [49] model, with many omissions in the image and inaccurate localization, its mAP was 12.36 percentage points lower than the YOLOv7-cs model. This shows that the DSSD model has some difficulties in handling small targets and is inefficient in processing large-size images. Using the YOLOv7X model, there is a large number of repeated detections, where the bayberry image is of lower confidence than the YOLOv7-cs, and its mAP is 7.05 percentage points lower than that of the YOLOv7-cs model. The detection accuracy of YOLOv7X is relatively low, especially when treating occluded targets. Using the YOLOv7 model, with repeated detection in the image, the mAP was 5.43 percentage points lower than that of the YOLOv7-cs model. This indicates that the YOLO v7 model is poor in detecting dense targets and decreases the detection effect against occluded targets. The YOLOv7-cs model proposed in this study can accurately detect the position and number of bayberries in the image, with less misdetection, and the detection accuracy reaches 90.21%.
5. Conclusions
This study presents a significant advancement in the domain of fruit tree detection, specifically in the context of identifying bayberry targets against complex backgrounds. This study introduces a novel approach by leveraging the YOLOv7 architecture, enhancing its capabilities through specialized modules like the SPD-Conv detection head modules, CNxP module, global attention mechanism (GAM), pyramid pooling module (SPPFCSPC), and the integration of the Wise-IoU function. These innovations collectively address the challenges of slow detection and recognition speed while significantly improving the accuracy of identifying high-density bayberry targets. This article’s pioneering aspect lies in its ability to not only boost performance metrics, notably increasing mean average precision (mAP) by up to 13.2% at higher IoU thresholds but also reducing parameters by 17.3 M, achieving a more lightweight and efficient design for bayberry target detection.
When comparing these studies with other algorithms like random forest [50], debiased sparse partial correlation (DSPC) algorithm, and OPLS-DA, in the context of fruit trees, the YOLOv7-CS model stands out for its object detection capabilities. While methods like random forest and OPLS-DA excel in classification and regression tasks, they often lack the precision and efficiency in object detection that YOLO-based architectures provide [51]. YOLOv7-CS, with its specialized modules and improvements, demonstrates a significant leap in accurately identifying and counting bayberry targets against challenging backgrounds, outperforming traditional machine learning and statistical approaches in this specific task. The model’s focus on lightweight design, improved accuracy, and speed in detecting high-density fruit targets sets it apart from these other methodologies, showing promise for more effective and efficient fruit tree monitoring and management.
The YOLOv7-CS model proposed in this study may also be applied to the detection and analysis of different crops. Combined with drones or other drone-borne equipment, it can realize the identification and counting of fruits, efficiently monitor the growth status and harvest of orchards and provide more intelligent support for agricultural production. In the future, we hope to optimize the model and improve its robustness to factors such as lighting changes and background interference to ensure reliability and stability in actual agricultural environments. In addition, we may explore the integration of models with other technologies, combining machine learning with agricultural expertise, and build an intelligent agricultural decision-making system to provide farmers with more accurate planting suggestions and management plans to improve agricultural production efficiency and quality.
Author Contributions
Study conception and design: S.L.; data collection: H.Q.; analysis and interpretation of results: T.T., Y.Z. and M.L.; draft manuscript preparation: S.L. and H.Q. All authors reviewed the results and approved the final version of the manuscript.
Funding
This research was funded by the Jilin Province Science and Technology Development Plan Project (No. YDZJ202303CGZH023, No. 20230508033RC).
Data Availability Statement
The data presented in this study are available in article.
Acknowledgments
The authors gratefully acknowledge the Institute of Smart Agriculture and the Jilin Province Science and Technology Development for their assistance and facilities in carrying out this research.
Conflicts of Interest
The authors declare no conflict of interest.
References
- Wu, B.-P.; Zhang, C.; Gao, Y.-B.; Zheng, W.-W.; Xu, K. Changes in sugar accumulation and related enzyme activities of red bayberry (myrica rubra) in greenhouse cultivation. Horticulturae 2021, 7, 429. [Google Scholar] [CrossRef]
- Roussos, P.A.; Triantafillidis, A.; Kepolas, E.; Peppas, P.; Piou, A.; Zoti, M.; Gasparatos, D. Effects of integrated and organic management on strawberry (cv. Camarosa) plant growth, nutrition, fruit yield, quality, nutraceutical characteristics, and soil fertility status. Horticulturae 2022, 8, 184. [Google Scholar] [CrossRef]
- Saleem, M.H.; Potgieter, J.; Arif, K.M. Automation in agriculture by machine and deep learning techniques: A review of recent developments. Precis. Agric. 2021, 22, 2053–2091. [Google Scholar] [CrossRef]
- Gulzar, Y. Fruit image classification model based on MobileNetV2 with deep transfer learning technique. Sustainability 2023, 15, 1906. [Google Scholar] [CrossRef]
- Gulzar, Y.; Ünal, Z.; Aktaş, H.; Mir, M.S. Harnessing the power of transfer learning in sunflower disease detection: A comparative study. Agriculture 2023, 13, 1479. [Google Scholar] [CrossRef]
- Huang, Z.; Huang, L.; Gong, Y.; Huang, C.; Wang, X. Mask scoring r-cnn. In Proceedings of the IEEE/CVF Conference on Computer Vision and Pattern Recognition, Long Beach, CA, USA, 15–20 June 2019; pp. 6409–6418. [Google Scholar]
- Wang, D.; He, D. Apple detection and instance segmentation in natural environments using an improved Mask Scoring R-CNN Model. Front. Plant Sci. 2022, 13, 1016470. [Google Scholar] [CrossRef] [PubMed]
- Dhiman, P.; Kaur, A.; Balasaraswathi, V.; Gulzar, Y.; Alwan, A.A.; Hamid, Y. Image Acquisition, Preprocessing and Classification of Citrus Fruit Diseases: A Systematic Literature Review. Sustainability 2023, 15, 9643. [Google Scholar] [CrossRef]
- Ma, N.; Zhang, X.; Zheng, H.-T.; Sun, J. Shufflenet v2: Practical guidelines for efficient cnn architecture design. In Proceedings of the European Conference on Computer Vision (ECCV), Munich, Germany, 8–14 September 2018; pp. 116–131. [Google Scholar]
- Zhou, Y.; Fu, C.; Zhai, Y.; Li, J.; Jin, Z.; Xu, Y. Identification of Rice Leaf Disease Using Improved ShuffleNet V2. Comput. Mater. Contin. 2023, 75, 4501–4517. [Google Scholar] [CrossRef]
- Liu, Z.; Lin, Y.; Cao, Y.; Hu, H.; Wei, Y.; Zhang, Z.; Lin, S.; Guo, B. Swin transformer: Hierarchical vision transformer using shifted windows. In Proceedings of the IEEE/CVF International Conference on Computer Vision, Montreal, BC, Canada, 11–17 October 2021; pp. 10012–10022. [Google Scholar]
- Liu, L.; Li, P. Plant intelligence-based PILLO underwater target detection algorithm. Eng. Appl. Artif. Intell. 2023, 126, 106818. [Google Scholar] [CrossRef]
- Wang, Y.; Lv, J.; Xu, L.; Gu, Y.; Zou, L.; Ma, Z. A segmentation method for waxberry image under orchard environment. Sci. Hortic. 2020, 266, 109309. [Google Scholar] [CrossRef]
- Zhang, W.; Huang, H.; Sun, Y.; Wu, X. AgriPest-YOLO: A rapid light-trap agricultural pest detection method based on deep learning. Front. Plant Sci. 2022, 13, 1079384. [Google Scholar] [CrossRef] [PubMed]
- Li, Y.; Bao, Z.; Qi, J. Seedling maize counting method in complex backgrounds based on YOLOV5 and Kalman filter tracking algorithm. Front. Plant Sci. 2022, 13, 1030962. [Google Scholar] [CrossRef] [PubMed]
- Aljaafreh, A.; Elzagzoug, E.Y.; Abukhait, J.; Soliman, A.-H.; Alja’Afreh, S.S.; Sivanathan, A.; Hughes, J. A Real-Time Olive Fruit Detection for Harvesting Robot Based on YOLO Algorithms. Acta Technol. Agric. 2023, 26, 121–132. [Google Scholar] [CrossRef]
- Jaderberg, M.; Simonyan, K.; Zisserman, A. Spatial transformer networks. In NIPS’15: Proceedings of the 28th International Conference on Neural Information Processing Systems; MIT Press: Cambridge, MA, USA, 2015; Volume 28, p. 28. [Google Scholar]
- Zhang, D.-Y.; Luo, H.-S.; Cheng, T.; Li, W.-F.; Zhou, X.-G.; Gu, C.-Y.; Diao, Z. Enhancing wheat Fusarium head blight detection using rotation Yolo wheat detection network and simple spatial attention network. Comput. Electron. Agric. 2023, 211, 107968. [Google Scholar] [CrossRef]
- Qi, L.; Kuen, J.; Gu, J.; Lin, Z.; Wang, Y.; Chen, Y.; Li, Y.; Jia, J. Multi-scale aligned distillation for low-resolution detection. In Proceedings of the IEEE/CVF Conference on Computer Vision and Pattern Recognition, Nashville, TN, USA, 20–25 June 2021; pp. 14443–14453. [Google Scholar]
- Tian, L.; Zhang, H.; Liu, B.; Zhang, J.; Duan, N.; Yuan, A.; Huo, Y. VMF-SSD: A Novel v-space based multi-scale feature fusion SSD for apple leaf disease detection. IEEE/ACM Trans. Comput. Biol. Bioinform. 2022, 20, 2016–2028. [Google Scholar] [CrossRef]
- Zhang, F.; Lin, S.; Xiao, X.; Wang, Y.; Zhao, Y. Global attention network with multiscale feature fusion for infrared small target detection. Opt. Laser Technol. 2024, 168, 110012. [Google Scholar] [CrossRef]
- Liu, W.; Anguelov, D.; Erhan, D.; Szegedy, C.; Reed, S.; Fu, C.-Y.; Berg, A.C. Ssd: Single shot multibox detector. In Proceedings of the Computer Vision–ECCV 2016: 14th European Conference, Amsterdam, The Netherlands, 11–14 October 2016; Part I 14. pp. 21–37. [Google Scholar]
- Sandler, M.; Howard, A.; Zhu, M.; Zhmoginov, A.; Chen, L.-C. Mobilenetv2: Inverted residuals and linear bottlenecks. In Proceedings of the IEEE Conference on Computer Vision and Pattern Recognition, Salt Lake City, UT, USA, 18–23 June 2018; pp. 4510–4520. [Google Scholar]
- Huang, J.; Cai, Q.; Chen, Y.; Huang, Q.; Li, F. Traffic pedestrian detection algorithm based on lightweight SSD. In Proceedings of the Third International Conference on Electronics and Communication, Network and Computer Technology (ECNCT 2021), Xiamen, China, 3–5 December 2022; pp. 582–587. [Google Scholar]
- Huang, G.; Liu, Z.; Van Der Maaten, L.; Weinberger, K.Q. Densely connected convolutional networks. In Proceedings of the IEEE Conference on Computer Vision and Pattern Recognition, Honolulu, HI, USA, 21–26 July 2017; pp. 4700–4708. [Google Scholar]
- Zhang, X.; Sun, X.; Luo, Y.; Ji, J.; Zhou, Y.; Wu, Y.; Huang, F.; Ji, R. Rstnet: Captioning with adaptive attention on visual and non-visual words. In Proceedings of the IEEE/CVF Conference on Computer Vision and Pattern Recognition, Nashville, TN, USA, 20–25 June 2021; pp. 15465–15474. [Google Scholar]
- Tian, Y.; Wang, S.; Li, E.; Yang, G.; Liang, Z.; Tan, M. MD-YOLO: Multi-scale Dense YOLO for small target pest detection. Comput. Electron. Agric. 2023, 213, 108233. [Google Scholar] [CrossRef]
- Chen, Z.; Huang, C.; Duan, L.; Tan, B. Lightweight Surface Litter Detection Algorithm Based on Improved YOLOv5s. Comput. Mater. Contin. 2023, 76, 1085–1102. [Google Scholar] [CrossRef]
- Duan, K.; Bai, S.; Xie, L.; Qi, H.; Huang, Q.; Tian, Q. Centernet: Keypoint triplets for object detection. In Proceedings of the IEEE/CVF International Conference on Computer Vision, Seoul, Republic of Korea, 27 October–2 November 2019; pp. 6569–6578. [Google Scholar]
- He, K.; Zhang, X.; Ren, S.; Sun, J. Deep residual learning for image recognition. In Proceedings of the IEEE conference on Computer Vision and Pattern Recognition, Las Vegas, NV, USA, 26 June–1 July 2016; pp. 770–778. [Google Scholar]
- Li, X.; Li, H.; Jiang, Y.; Wang, M. Lightweight detection network based on Sub-pixel convolution and objectness-aware structure for UAV images. Sensors 2021, 21, 5656. [Google Scholar] [CrossRef]
- Liu, H.; He, B.; He, Y.; Tao, X. Lightweight detection algorithm for fine-grained surface defects of aerospace seal rings. J. Intell. Fuzzy Syst. 2021, 40, 11423–11440. [Google Scholar] [CrossRef]
- Li, M.; Wen, G.; Huang, X.; Li, K.; Lin, S. A lightweight detection model for Sar aircraft in a complex environment. Remote Sens. 2021, 13, 5020. [Google Scholar] [CrossRef]
- Zhang, L.; Du, X.; Zhang, R.; Zhang, J. A Lightweight Detection Algorithm for Unmanned Surface Vehicles Based on Multi-Scale Feature Fusion. J. Mar. Sci. Eng. 2023, 11, 1392. [Google Scholar] [CrossRef]
- Zhou, J.; Hu, W.; Zou, A.; Zhai, S.; Liu, T.; Yang, W.; Jiang, P. Lightweight detection algorithm of kiwifruit based on improved YOLOX-s. Agriculture 2022, 12, 993. [Google Scholar] [CrossRef]
- Terven, J.; Cordova-Esparza, D. A comprehensive review of YOLO: From YOLOv1 and beyond. arXiv 2023, arXiv:2304.00501. [Google Scholar]
- Liu, Y.; Shao, Z.; Hoffmann, N. Global attention mechanism: Retain information to enhance channel-spatial interactions. arXiv 2021, arXiv:2112.05561. [Google Scholar]
- Sunkara, R.; Luo, T. No more strided convolutions or pooling: A new CNN building block for low-resolution images and small objects. In Proceedings of the Joint European Conference on Machine Learning and Knowledge Discovery in Databases, Grenoble, France, 19–23 September 2022; Springer: Cham, Switzerland, 2022; pp. 443–459. [Google Scholar]
- Tong, Z.; Chen, Y.; Xu, Z.; Yu, R. Wise-IoU: Bounding Box Regression Loss with Dynamic Focusing Mechanism. arXiv 2023, arXiv:2301.10051. [Google Scholar]
- Chen, J.; Kao, S.-H.; He, H.; Zhuo, W.; Wen, S.; Lee, C.-H.; Chan, S.-H.G. Run, don’t walk: Chasing higher FLOPS for faster neural networks. In Proceedings of the IEEE/CVF Conference on Computer Vision and Pattern Recognition, Vancouver, BC, Canada, 17–24 June 2023; pp. 12021–12031. [Google Scholar]
- He, K.; Zhang, X.; Ren, S.; Sun, J. Spatial pyramid pooling in deep convolutional networks for visual recognition. IEEE Trans. Pattern Anal. Mach. Intell. 2015, 37, 1904–1916. [Google Scholar] [CrossRef]
- Yang, H.; Min, Z.; Zhang, Y.; Wang, Z.; Jiang, D. An improved model-free finite control set predictive power control for PWM rectifiers. In Proceedings of the 2021 IEEE Energy Conversion Congress and Exposition (ECCE), Vancouver, BC, Canada, 10–14 October 2021; pp. 3425–3429. [Google Scholar]
- Howard, A.G.; Zhu, M.; Chen, B.; Kalenichenko, D.; Wang, W.; Weyand, T.; Andreetto, M.; Adam, H. Mobilenets: Efficient convolutional neural networks for mobile vision applications. arXiv 2017, arXiv:1704.04861. [Google Scholar]
- Han, K.; Wang, Y.; Tian, Q.; Guo, J.; Xu, C.; Xu, C. Ghostnet: More features from cheap operations. In Proceedings of the IEEE/CVF Conference on Computer Vision and Pattern Recognition, Seattle, WA, USA, 13–19 June 2020; pp. 1580–1589. [Google Scholar]
- Yang, L.; Zhang, R.-Y.; Li, L.; Xie, X. Simam: A simple, parameter-free attention module for convolutional neural networks. In Proceedings of the International Conference on Machine Learning, Virtual, 18–24 July 2021; pp. 11863–11874. [Google Scholar]
- Chen, X.; Wang, X.; Zhou, J.; Qiao, Y.; Dong, C. Activating more pixels in image super-resolution transformer. In Proceedings of the IEEE/CVF Conference on Computer Vision and Pattern Recognition, Vancouver, BC, Canada, 17–24 June 2023; pp. 22367–22377. [Google Scholar]
- Liu, S.; Huang, D.; Wang, Y. Learning spatial fusion for single-shot object detection. arXiv 2019, arXiv:1911.09516. [Google Scholar]
- Ren, S.; He, K.; Girshick, R.; Sun, J. Faster r-cnn: Towards real-time object detection with region proposal networks. In Advances in Neural Information Processing Systems; MIT Press: Cambridge, MA, USA, 2015; Volume 28. [Google Scholar]
- Fu, C.-Y.; Liu, W.; Ranga, A.; Tyagi, A.; Berg, A.C. Dssd: Deconvolutional single shot detector. arXiv 2017, arXiv:1701.06659. [Google Scholar]
- Olivares, B.O.; Vega, A.; Rueda Calderón, M.A.; Montenegro-Gracia, E.; Araya-Almán, M.; Marys, E. Prediction of banana production using epidemiological parameters of black sigatoka: An application with random forest. Sustainability 2022, 14, 14123. [Google Scholar] [CrossRef]
- Li, D.; Ahmed, F.; Wu, N.; Sethi, A.I. Yolo-JD: A Deep Learning Network for jute diseases and pests detection from images. Plants 2022, 11, 937. [Google Scholar] [CrossRef]


Disclaimer/Publisher’s Note: The statements, opinions and data contained in all publications are solely those of the individual author(s) and contributor(s) and not of MDPI and/or the editor(s). MDPI and/or the editor(s) disclaim responsibility for any injury to people or property resulting from any ideas, methods, instructions or products referred to in the content. |
© 2023 by the authors. Licensee MDPI, Basel, Switzerland. This article is an open access article distributed under the terms and conditions of the Creative Commons Attribution (CC BY) license (https://creativecommons.org/licenses/by/4.0/).