Article

Structure of Endophytes in the Root, Stem, and Leaf Tissues of Sweetpotato and Their Response to Sweetpotato Scab Disease Caused by Elsinoë batatas

1
Crops Research Institute, Guangdong Academy of Agricultural Sciences/Key Laboratory of Crop Genetic Improvement of Guangdong Province, Guangzhou 510640, China
2
College of Resources and Environment, Zhongkai University of Agriculture and Engineering, Guangzhou 510220, China
*
Author to whom correspondence should be addressed.
Agronomy 2023, 13(12), 2965; https://doi.org/10.3390/agronomy13122965
Submission received: 2 November 2023 / Revised: 25 November 2023 / Accepted: 28 November 2023 / Published: 30 November 2023

Abstract

:
Endophytes are symbiotic microbes that are mutually beneficial to the plant host and whose number and diversity affect the strength of plant resistance to stresses. The infection of sweetpotato with the scab pathogen can lead to yield losses. However, little is known about how the endophytic flora in sweetpotato respond to scab pathogen infection. This study used high-throughput amplicon sequencing with Illumina’s MiSeq PE300 platform ITS and the 16SrRNA gene to analyze the composition and distribution of endophytic flora in the roots, stems, and leaves of sweetpotato plants infected with scab disease and those of healthy plants. The dominant endophytic fungi in sweetpotato were Ascomycota, while the dominant endophytic bacteria were Proteobacteria. The diversity of endophytic fungi in the healthy plants followed a root > stem > leaf trend, while an opposite trend was observed in the infected plants. The diversity pattern of endophytic bacterial flora showed a root > stem > leaf trend in both healthy and infected plants. The scab pathogen Elsinoë was classified under OTU87 and was enriched in the leaves and stems of the infected plants. OTU87 was negatively correlated with Acaulospora and positively correlated with eight other fungal taxa, including Cladosporium.Future research should focus on exploring potential biocontrol fungal resources for sweetpotato scab.

1. Introduction

Sweetpotato (Ipomoea batatas (L.) Lam) is one of the most nutritious tropical and subtropical crops and is considered the seventh major crop worldwide [1,2]. Due to its wide ecological adaptability, strong drought tolerance, and low requirements for fertilizer, sweetpotato has been rapidly popularized and is the second-largest food crop after rice in China [3,4]. Sweetpotato plays an important role in food, animal feed, medicine, and health [5,6]. Currently, various functional foods and beverages, such as sour starch, soy sauce, acidophilus milk, curd and yogurt, and alcoholic beverages, have been developed through the processing of sweetpotato [7]. Its leaves can also be preserved as hay or silage [8]. In addition, sweetpotato contains several phytochemicals that can be used to treat diabetes [1].
According to the Food and Agriculture Organization of the United Nations (FAO), China is the world’s largest sweetpotato producer [9]. However, the yield and quality of sweetpotato are affected by several diseases, which are particularly severe in southern China [10]. Sweetpotato scab disease is prevalent during rainy and humid weather, which results in low yields and reduced quality of the shoot tips, thus causing serious economic losses [11,12]. It is caused by the pathogenic fungus Sphaceloma batatas Sawada (teleomorph Elsinoë batatas Viegas & Jenkins), whose asexual form is the common pathogen in the field [13,14]. Fan et al. [15] proposed that Sphaceloma batatas be classified as Elsinoë batatas, and to avoid confusion, Sphaceloma was uniformly replaced with Elsinoë in subsequent papers. Sweetpotato is rich in nutrients and is high valuable for medicine and health, which makes it popular worldwide. The sweetpotato variety ‘Guangcaishu No. 5’, which was selected and bred by the Guangdong Academy of Agricultural Sciences in China, is highly preferred by growers and consumers and is the main sweetpotato variety promoted in Guangdong Province, China [16]. However, this variety is particularly susceptible to scab disease, and the leaves, petioles, and stems of the infected plants exhibit rough red spots on the surface, inward curling, shrinkage and deformation of leaves, deformed young shoots, and stagnant growth. Infection during the early stage of growth can lead to a 60–70% reduction in sweetpotato yields, and when the disease is severe, the plant produces fewer potatoes that are smaller, have a reduced starch content, and are of lower quality [11,12].
Rhizosphere microorganisms are considered the first line of defense against plant diseases, while plant endophytes are considered the second [17]. Plant endophytes include endophytic fungi and bacteria, which constitute harmless microorganisms that are in various plant tissues and organs or in intercellular spaces at a certain stage or all stages of the plant life cycle [18,19]. When plants are infected by pathogenic fungi, some antagonistic endophytes are recruited to defend against the disease [20]. Plant endophytes can promote plant growth and enhance the host plant’s resistance to stresses, such as pests and diseases, and thus play an important role in plant health and stress responses [21].
Endophytes play an important role in the prevention and treatment of scab. Padder et al. [22] modulated the apple plant’s biochemical response in mitigating the stress mediated by advanced infections of apple scab (Venturia inaequalis) in the host and provided scientific guidance to treat apple scab using biological means mediated by endophytes. Shuang et al. [23] found that the endophyte Bacillus sp. K-9 inhibited potato scab disease by 70.39% and the yield of inoculated plants was 12.44% higher than that of the control. Moreover, Cui et al. [24] found that the endophyte B. amyloliquefaciens 3–5 had a potato scab control efficiency of 38.90 ± 3.2% and it could produce indole-3-acetic acid (IAA) and promote nitrogen fixation. Ebrahimi et al. [25] found that the endophytes Coniochaeta endophytica 55S2 and Chaetomium globosum 2S1 isolated from healthy apple fruits, leaves, and branches could control apple scab on apples under greenhouse conditions. In a study on sweetpotato endophytes, Wang et al. [26] found that the endophyte B. amyloliquefaciens YTB1407 could promote the growth of sweetpotato, induce plant salicylic acid (SA)-dependent systemic resistance, and also produce some antifungal metabolites. Thus, it is hypothesized that endophytic flora could play a major role in the growth of sweetpotato and in the resistance of sweetpotato to scab disease. However, there are no studies on the composition of the endophytic flora in sweetpotato and the pathogenicity of different endophytes on scab. Therefore, this study was conducted to address this gap.
High-throughput sequencing technology allows for the rapid identification of microbial communities in environmental samples, which enables the isolation of microorganisms without culturing limitations, thus expanding the use of microbial resources [19,27,28]. Based on this, this study used high-throughput sequencing technology to explore the changes in the diversity of endophytic flora (endophytic fungi and bacteria) in healthy and diseased (sweetpotato scab) sweetpotato. The study aimed to obtain an in-depth understanding of the relationship between changes in the diversity of sweetpotato endophytic flora and scab disease and discover the potential impact of endophytes on the prevention and control of sweetpotato scab to provide a reference to establish feasible sweetpotato scab prevention and control strategies.

2. Materials and Methods

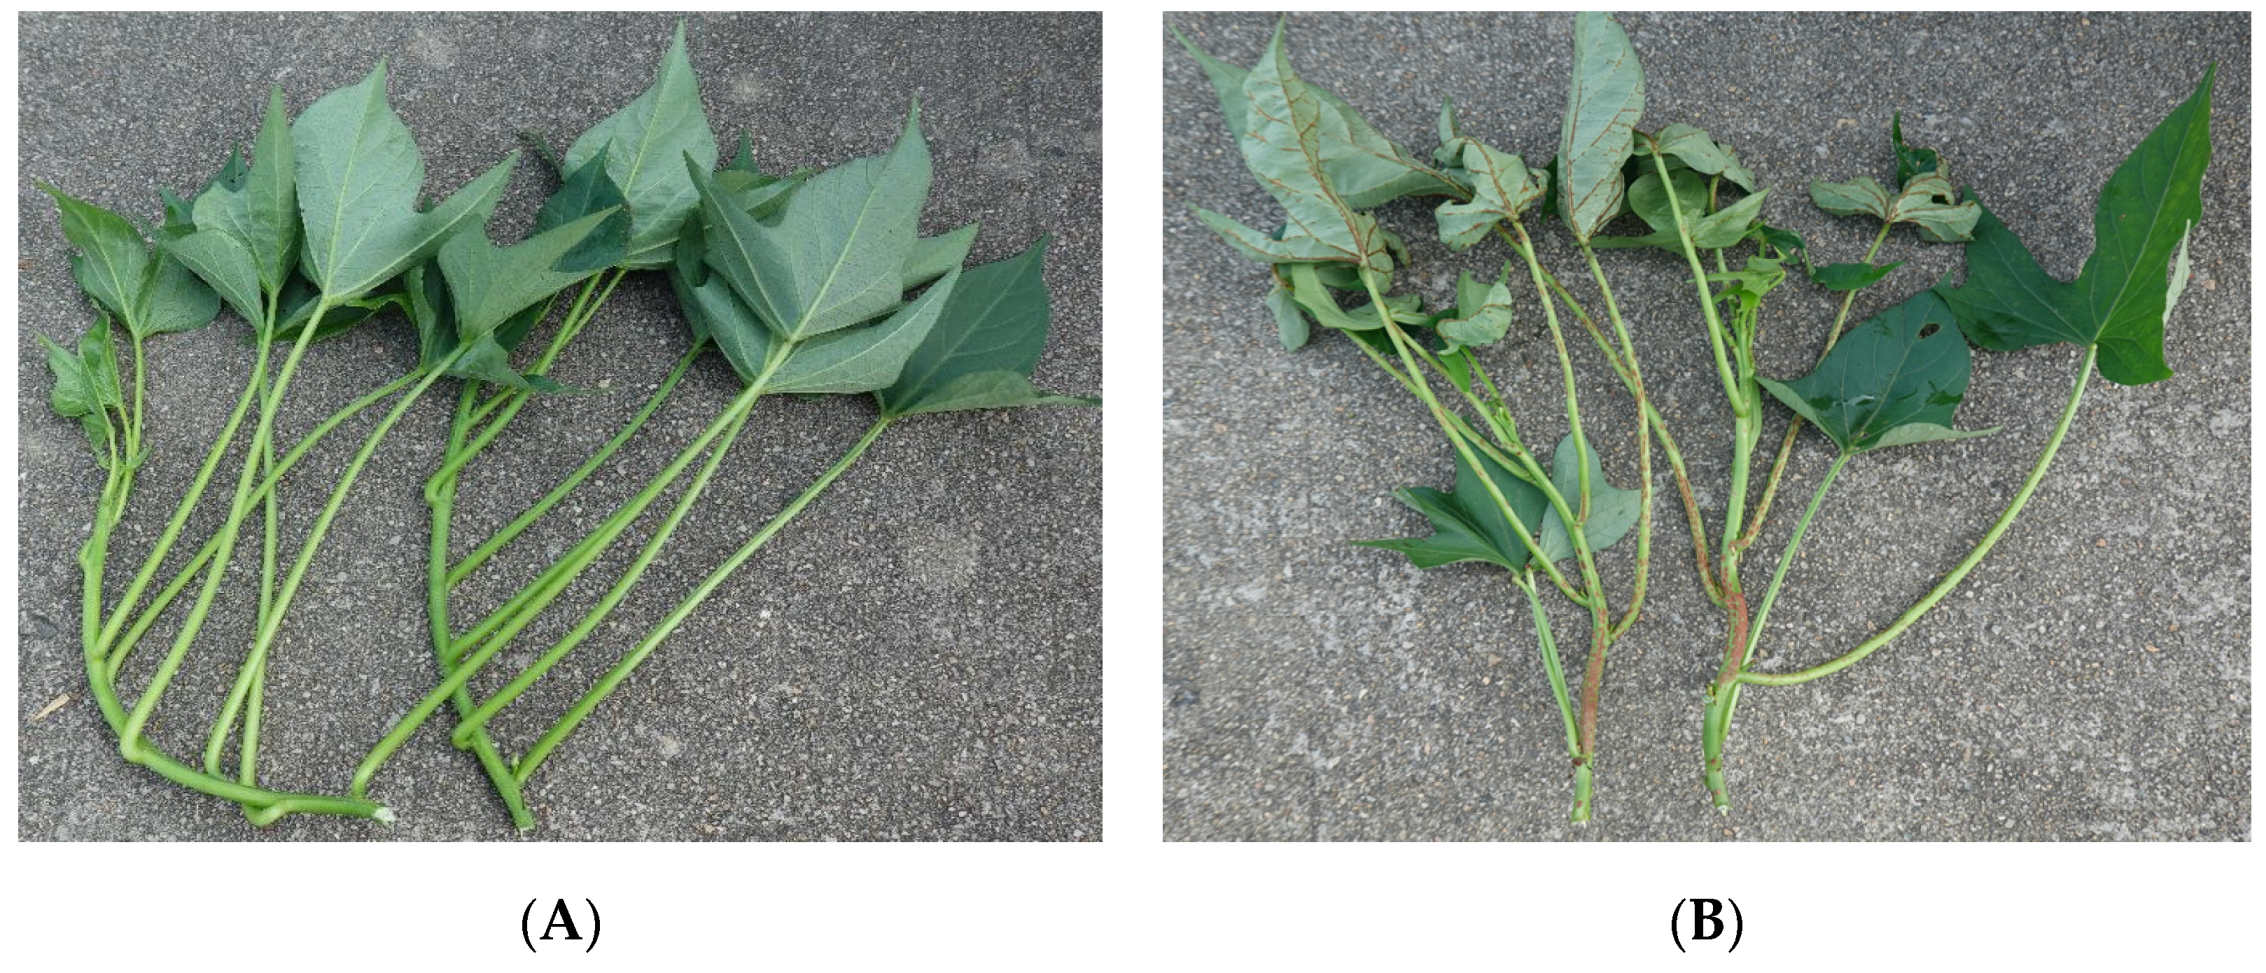
2.1. Study Site and Cultivation Methods

The experimental site was located at the Zhongluotan Baiyun Base of the Guangdong Academy of Agricultural Sciences in China (E 113.44, N 23.39), which has a subtropical monsoon climate and is hot and rainy. The soil is sandy loam, with pH 6.74, organic matter 1.35%, hydrolyzable nitrogen 75.6 mg kg−1, effective phosphorus 128 mg kg−1, and quick-acting potassium 180 mg kg−1. The sweetpotato variety used was Guangcaishu No. 5 (Figure 1). A total of eight plots were set up, including four for healthy plants and the other four for plants inoculated with scab disease. The inoculation was conducted according to a previous method, which has been proven using Koch’s law [10]. The cultivation model was also based on a previous study [29]. Each plot was 1.2 m long and 1 m wide, and 30 plants were planted per plot, with a row spacing of 30 cm × 20 cm. Samples were collected two months after planting with four replicates. For each replicate, three plants were infected with scab, while three plants were not infected. Plants were randomly selected from each plot, and the roots, stems, and leaves were obtained from each plant. For the leaves, the sixth or seventh leaf was selected from each plant, cut from the petiole, and placed in an envelope. Each envelope contained three leaves of the four replicates. The stem samples contained a mixture of young and old stems, and the root samples were a mixture of all the roots of the sweetpotato plants. The roots and stems were bagged separately, labeled, kept in an ice box, and taken to the laboratory as quickly as possible. The collected samples were rinsed with sterile water for 30 s, soaked in 70% ethanol for 30 s and then in 2.5% NaClO (that contained 0.1% Tween 80) for 3 min, and finally rinsed three times with sterile water. After sterilization, the samples were placed in centrifuge tubes, snap-frozen in liquid nitrogen, and stored at −80 °C until use. Finally, the samples were sent to Shanghai Majorbio Bio-pharm Technology Co., Ltd. (Shanghai, China) for analysis.

2.2. DNA Extraction

The total genomic DNA of the microbial communities was extracted using a FastDNA Spin Kit for Soil (MP Biomedicals, Seven Hills, NSW, USA), and the quality of the extracted genomic DNA was checked via gel electrophoresis using 1% agarose. The concentration and purity of the DNA were determined using NanoDrop2000 (Thermo Scientific, Waltham, MA, USA).

2.3. PCR Amplification

We classified and identified the endophytic fungal and bacterial populations in the sweetpotato roots, stems, and leaves using simultaneous sequencing the DNA amplicons of the fungal internal transcribed spacer regions (ITS) and bacterial (16S rRNA) genes. For fungi, ITS1F (5′-CTTGGTCATTTAGAGGAAGTAA-3′) and ITS2R (5′-GCTGCGTTCTTCATCGATGC-3′) primers were used. The PCR amplification conditions were as follows: 3 min of pre-denaturation at 95 °C, 35 cycles of denaturation at 95 °C for 30 s, annealing at 55 °C for 30 s, extension at 72 °C for 45 s, and a final 10 min extension at 72 °C. The PCR mixture (20 μL) consisted of 4 μL of 5× FastPfu buffer, 2 μL of 2.5 mM dNTPs, 0.8 μL of forward and reverse primers (5 μmol/L), 0.4 μL of FastPfu polymerase, 0.2 μL of bovine serum albumin (BSA), and 1 μL of DNA template (10 ng), which were brought to 20 μL with double-distilled water (ddH2O). The bacterial DNA was amplified using 799F (5′-AACMGGATTAGATACCCKG-3′), 1192R (5′-ACGGGCGGGTGTGTGTRC-3′), and 1193R (5′-ACGTCATCCCCACCTTCC-3′) primers. The DNA was amplified in two rounds (nested PCR). The first round of PCR primers was 799F-1392R, and the amplification conditions were as follows: 3 min of pre-denaturation at 95 °C, 27 cycles of denaturation at 95 °C for 30 s, annealing at 55 °C for 30 s, extension at 72 °C for 45 s, and a final extension at 72 °C for 10 min. The primers for the second round of PCR were 799F-1393R, and the amplification conditions were as follows: 3 min of pre-denaturation at 95 °C, 13 cycles of denaturation at 95 °C for 30 s, annealing at 55 °C for 30 s, extension at 72 °C for 45 s, and a final extension at 72 °C for 10 min. The PCR mixture (20 μL) consisted of 4 μL of 5 × FastPfu buffer, 2 μL of 2.5 mM dNTPs, 0.8 μL of forward and reverse primers (5 μmol/L), 0.4 μL of FastPfu polymerase, 0.2 μL of BSA, and 1 μL of DNA template (10 ng), which were brought to 20 μL with ddH2O. The products were stored at 4 °C in the PCR instrument (ABI GeneAmp® Model 9700; Applied Biosystems, Waltham, MA, USA). The products were detected with gel electrophoresis using 2% agarose, purified using the PCR Clean-Up Kit (Beijing, China), and quantified using Qubit 4.0 (Thermo Fisher Scientific, Waltham, MA, USA).

2.4. Illumina Library Construction

The purified PCR products were used to construct a library with a NEXTFLEX Rapid DNA-Seq Kit. The steps involved (1) splice linkage, (2) the removal of splice self-linking fragments using magnetic bead screening, (3) enrichment of the library templates via PCR amplification, and (4) recovery of the PCR products using magnetic beads to obtain the final library. The products were sequenced on an Illumina PE300 platform (Shanghai Meiji Biomedical Technology Co., Ltd., Shanghai, China). The raw data were uploaded to the Sequence Read Archive (SRA) of the NCBI database with accession number PRJNA1021769.

2.5. Illumina Sequencing

The library was sequenced using an Illumina MiSeq PE300 platform (Shanghai Meiji Biomedical Technology Co., Ltd., Shanghai, China), and the process was as follows: (1) One end of the complementary DNA fragment was chip-fixed to the embedded junction base in the chip and the other end of the DNA fragment with random complementary to another nearby embedded junction base, which formed a “bridge”; (2) PCR amplification was performed to produce DNA clusters; (3) the DNA amplicon was linearized into a single strand; (4) modified DNA polymerase and dNTP with four fluorescent markers were added to synthesize one base per cycle; (5) the surface of the reaction plate was scanned with a laser to read the nucleotide type that was polymerized in the first round of reaction for each template sequence; (6) the “fluorescent group” and the “termination group” were cleaved chemically to restore the 3′ end adhesion for continued polymerization of the second nucleotide; and (7) the fluorescence signals collected in each round were counted statistically to obtain the sequence of the template DNA fragments.

2.6. High-Throughput Sequencing

The paired-ended raw sequencing reads were quality-controlled using FASTP v. 0.19.6 software (https://github.com/OpenGene/fastp, accessed on 11 August 2021) and spliced using FLASH v. 1.2.11 software (http://www.cbcb.umd.edu/software/flash, accessed on 11 August 2021). The steps were as follows: (1) Bases with a quality value below 20 in the tail of the reads were filtered with a window of 50 bp, and if the average quality value in the window was <20, the back-end bases starting from the window were truncated. Reads < 50 bp after quality control (QC) were filtered, and those containing N bases were removed. (2) The overlapping paired-end (PE) reads were spliced (merged) into a single sequence, with a minimum overlap length of 10 bp. (3) The maximum mismatch ratio allowed in the overlap region of the spliced sequence was 0.2, and the non-conforming sequences were screened. (4) The samples were differentiated based on the first and last barcodes of the sequence and the primer, and the sequence orientation was adjusted. The number of mismatches allowed was 0, and the maximum number of primer mismatches was 2. The sequences were subjected to operational taxonomic unit (OTU) clustering after QC splicing using UPARSE v. 7.1 software (http://drive5.com/uparse/, accessed on 11 August 2021), and the chimeras were eliminated based on 97% similarity. To minimize the impact of sequencing depth on the subsequent analysis of the alpha- and beta-diversity data, we rarefied the sample sequences. The OTU species were annotated using the RDP classifier v. 2.11 (http://rdp.cme.msu.edu/, accessed on 11 August 2021) by comparing the sequences against the Silva 16S rRNA gene database (v 138). The confidence threshold of the comparison was 70%, and the community composition of each sample was counted at different species’ taxonomic levels. The 16S functional prediction analyses were performed using PICRUSt2 v. 2.2.0 software.

2.7. Data Analysis

The final OTU abundance table was filtered and used for further analysis of the species’ community composition, alpha-diversity, and beta-diversity. The alpha-diversity is characterized by species richness, diversity, and evenness, whereby the Chao index shows the community species richness, the Shannon index reflects the community species diversity, and the Heip index reflects the community evenness. Conversely, the beta-diversity is characterized by non-standard multidimensional scaling (NMDS), which compares samples on the basis of either evolutionary relationships or quantitative distance matrices. The Wilcoxon rank-sum test was used for the between-group difference analysis of the alpha-diversity, while principal coordinate analysis (PCoA) based on the Bray–Curtis distance algorithm was used to test the similarity of the microbial community structure between samples. PCoA was combined with a non-parametric test, permutational multivariate analysis of variance (PERMANOVA), to analyze the significant differences in the microbial community structure between the sample groups. Moreover, linear discriminant effect size (LEfSe) analysis (LDA > 3, p < 0.05) was used to identify the taxa with significant differences in their abundance from the phylum to genus levels among different groups. The species were selected for correlation network diagram analysis based on Spearman correlation |r| > 0.6 p < 0.05.

3. Results

3.1. Sequencing Data and Sequencing Depth Analysis

Through Illumina MiSeq sequencing, 1,621,708 effective fungal sequences and 1,522,834 effective bacterial sequences were obtained from 48 samples of healthy (H) and infected (D) sweetpotato plants. The number of fungal sequences ranged from 35,650 to 102,126, with an average sequence length that ranged from 231.409 to 274.399 (Tables S1 and S2). Moreover, the number of bacterial sequences ranged from 43,832 to 73,573, with the average sequence length ranging from 373.909 to 375.750. The effective sequences were divided into OTUs based on similarity, and those with >97% similarity to representative OTU sequences were selected for bioinformatics analysis. These constituted 634 fungal OTUs and 374 bacterial OTUs (Tables S3 and S4).
To construct alpha dilution curves (Figure 2) and estimate the differences in alpha-diversity (Figure 3), we excluded OTUs with only one or two sequences from the dataset because these sequences might have occurred due to sequencing artifacts. The slope of the dilution curve gradually flattened as the number of reads increased (Figure 2). This showed that the contribution of further sequencing to generate new OTUs made a negligible contribution and the sequencing depth remained sufficient to cover the majority of species in the endophyte community of the sample. The sequencing results included mostly bacterial and fungal taxa, and the data obtained were suited for subsequent comparisons of fungal and bacterial community structures in the samples.

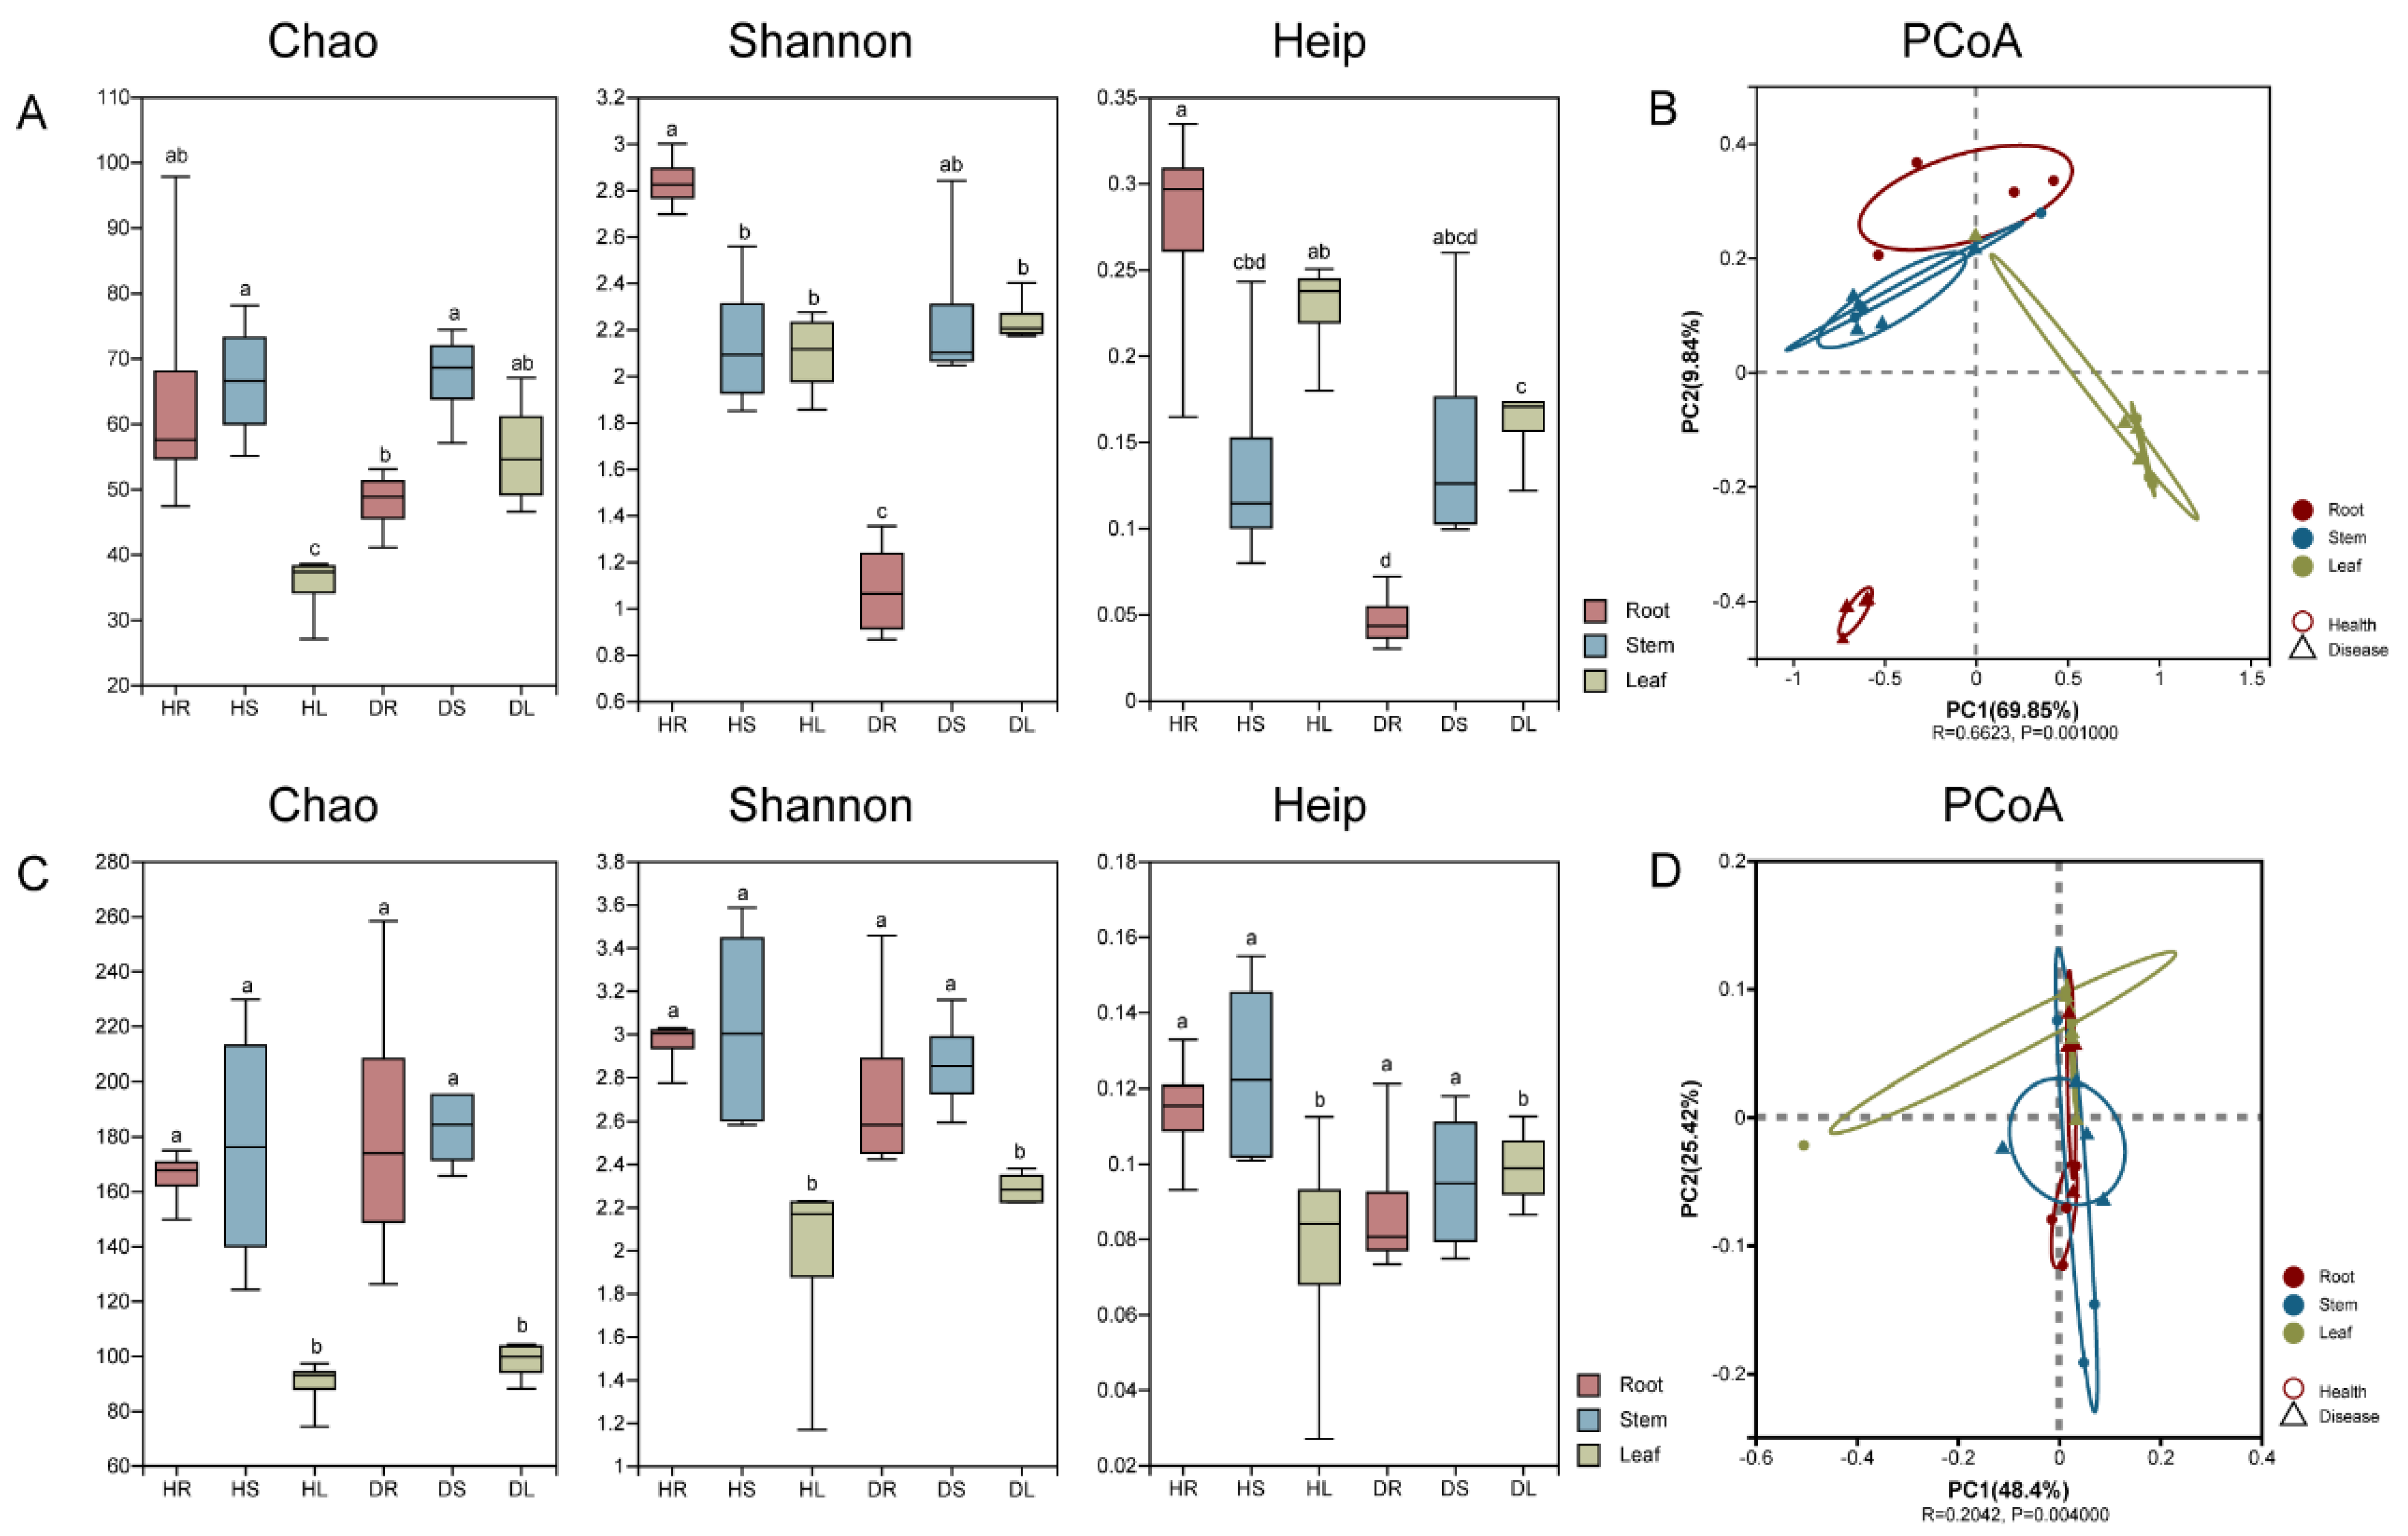
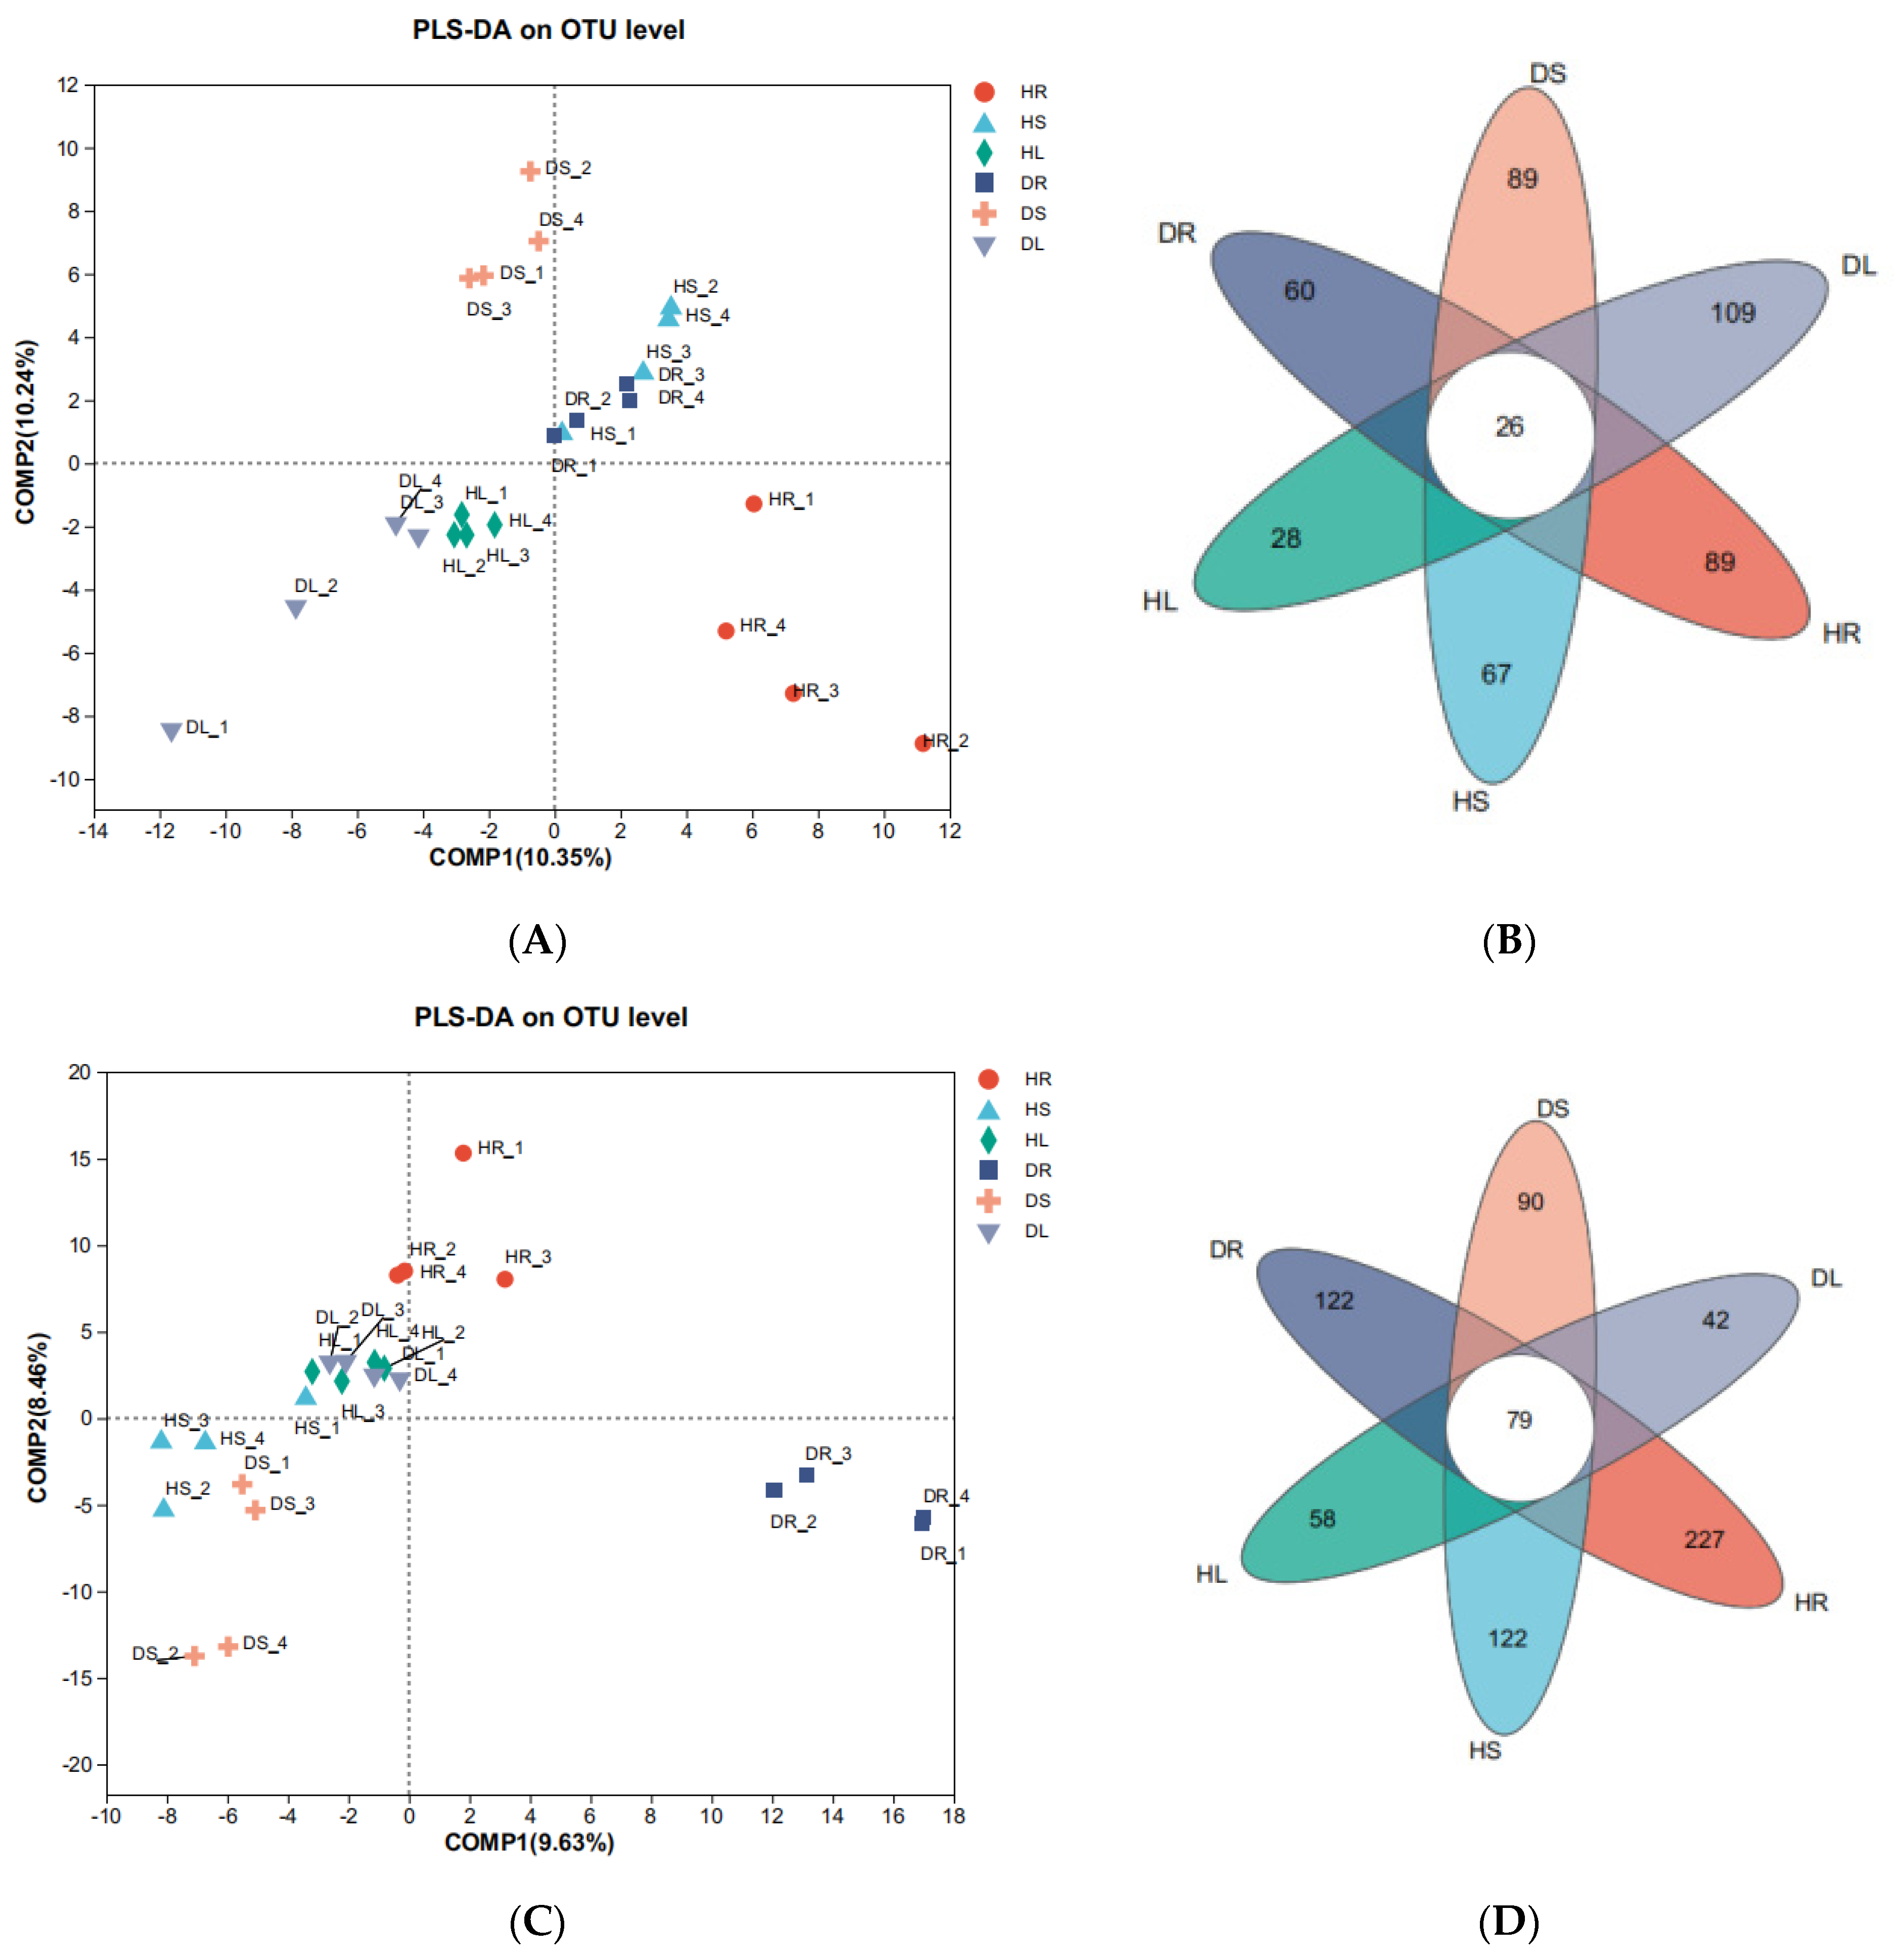
3.2. Distribution and Variation of the Endophytic Species in Different Tissues of Sweetpotato

The Alpha-diversity was used to analyze the abundance and diversity of endophytes in different tissues of healthy sweetpotato plants and those infected by scab. Due to the large variation in the effective sequence numbers between the samples, fungi were extracted and classified according to the minimum sample sequence number of 35,342, while bacteria were extracted and classified according to the minimum sample sequence number of 42,211. Thereafter, Chao (species richness), Shannon (diversity index), and Heip (evenness index) values were calculated (Figure 3). The results showed that the diversity of endophytic fungal communities in the healthy sweetpotato plants was maximal in the roots, followed by the stems and leaves (Figure 3A). The abundance and diversity of endophytic bacteria in the healthy sweetpotato plants were comparable and significantly higher in the roots than in the leaves (Figure 3C). The richness and diversity of the endophytic fungal communities in the roots were the lowest after infection and were significantly lower than those in the leaves. However, there were no changes in the endophytic bacteria richness and diversity in the roots, stems, and leaves after infection. Therefore, sweetpotato scab significantly reduced the diversity and evenness of the root endophytic fungal community and significantly increased the richness but reduced the evenness of the leaf endophytic fungal community (Figure 3A). There was no significant change in the abundance and diversity of endophytic bacteria in the infected roots, stems, and leaves (Figure 3C).
PCoA measurements were used to compare and analyze the similarity or dissimilarity between the endophytic flora in healthy sweetpotato plants and those infected by scab (Figure 3B,D). The results showed differences in the fungal endophytes between healthy and infected sweetpotato plants. The endophytic fungi in the sweetpotato roots formed two different groups and had obvious species composition changes after scab infection (Figure 3B). For the endophytic bacteria, there were no significant differences between the sweetpotato tissues from healthy and infected plants (Figure 3D).
According to partial least squares–discriminant analysis (PLS-DA), endophytic fungi from the roots affected by scab clustered with endophytic fungi from healthy stems and endophytic bacteria from the leaves affected by scab clustered with endophytic bacteria from healthy leaves. There was a significant difference in the clustering of endophytic between healthy and infected roots (Figure 4B).
A Venn diagram of the species showed 26 OTUs for healthy endophytic fungi and 79 OTUs for healthy endophytic bacteria in the leaves. The number of endophytic fungal OTUs in the infected leaves increased significantly, but no obvious change was observed in the number of endophytic bacteria (Figure 4C).

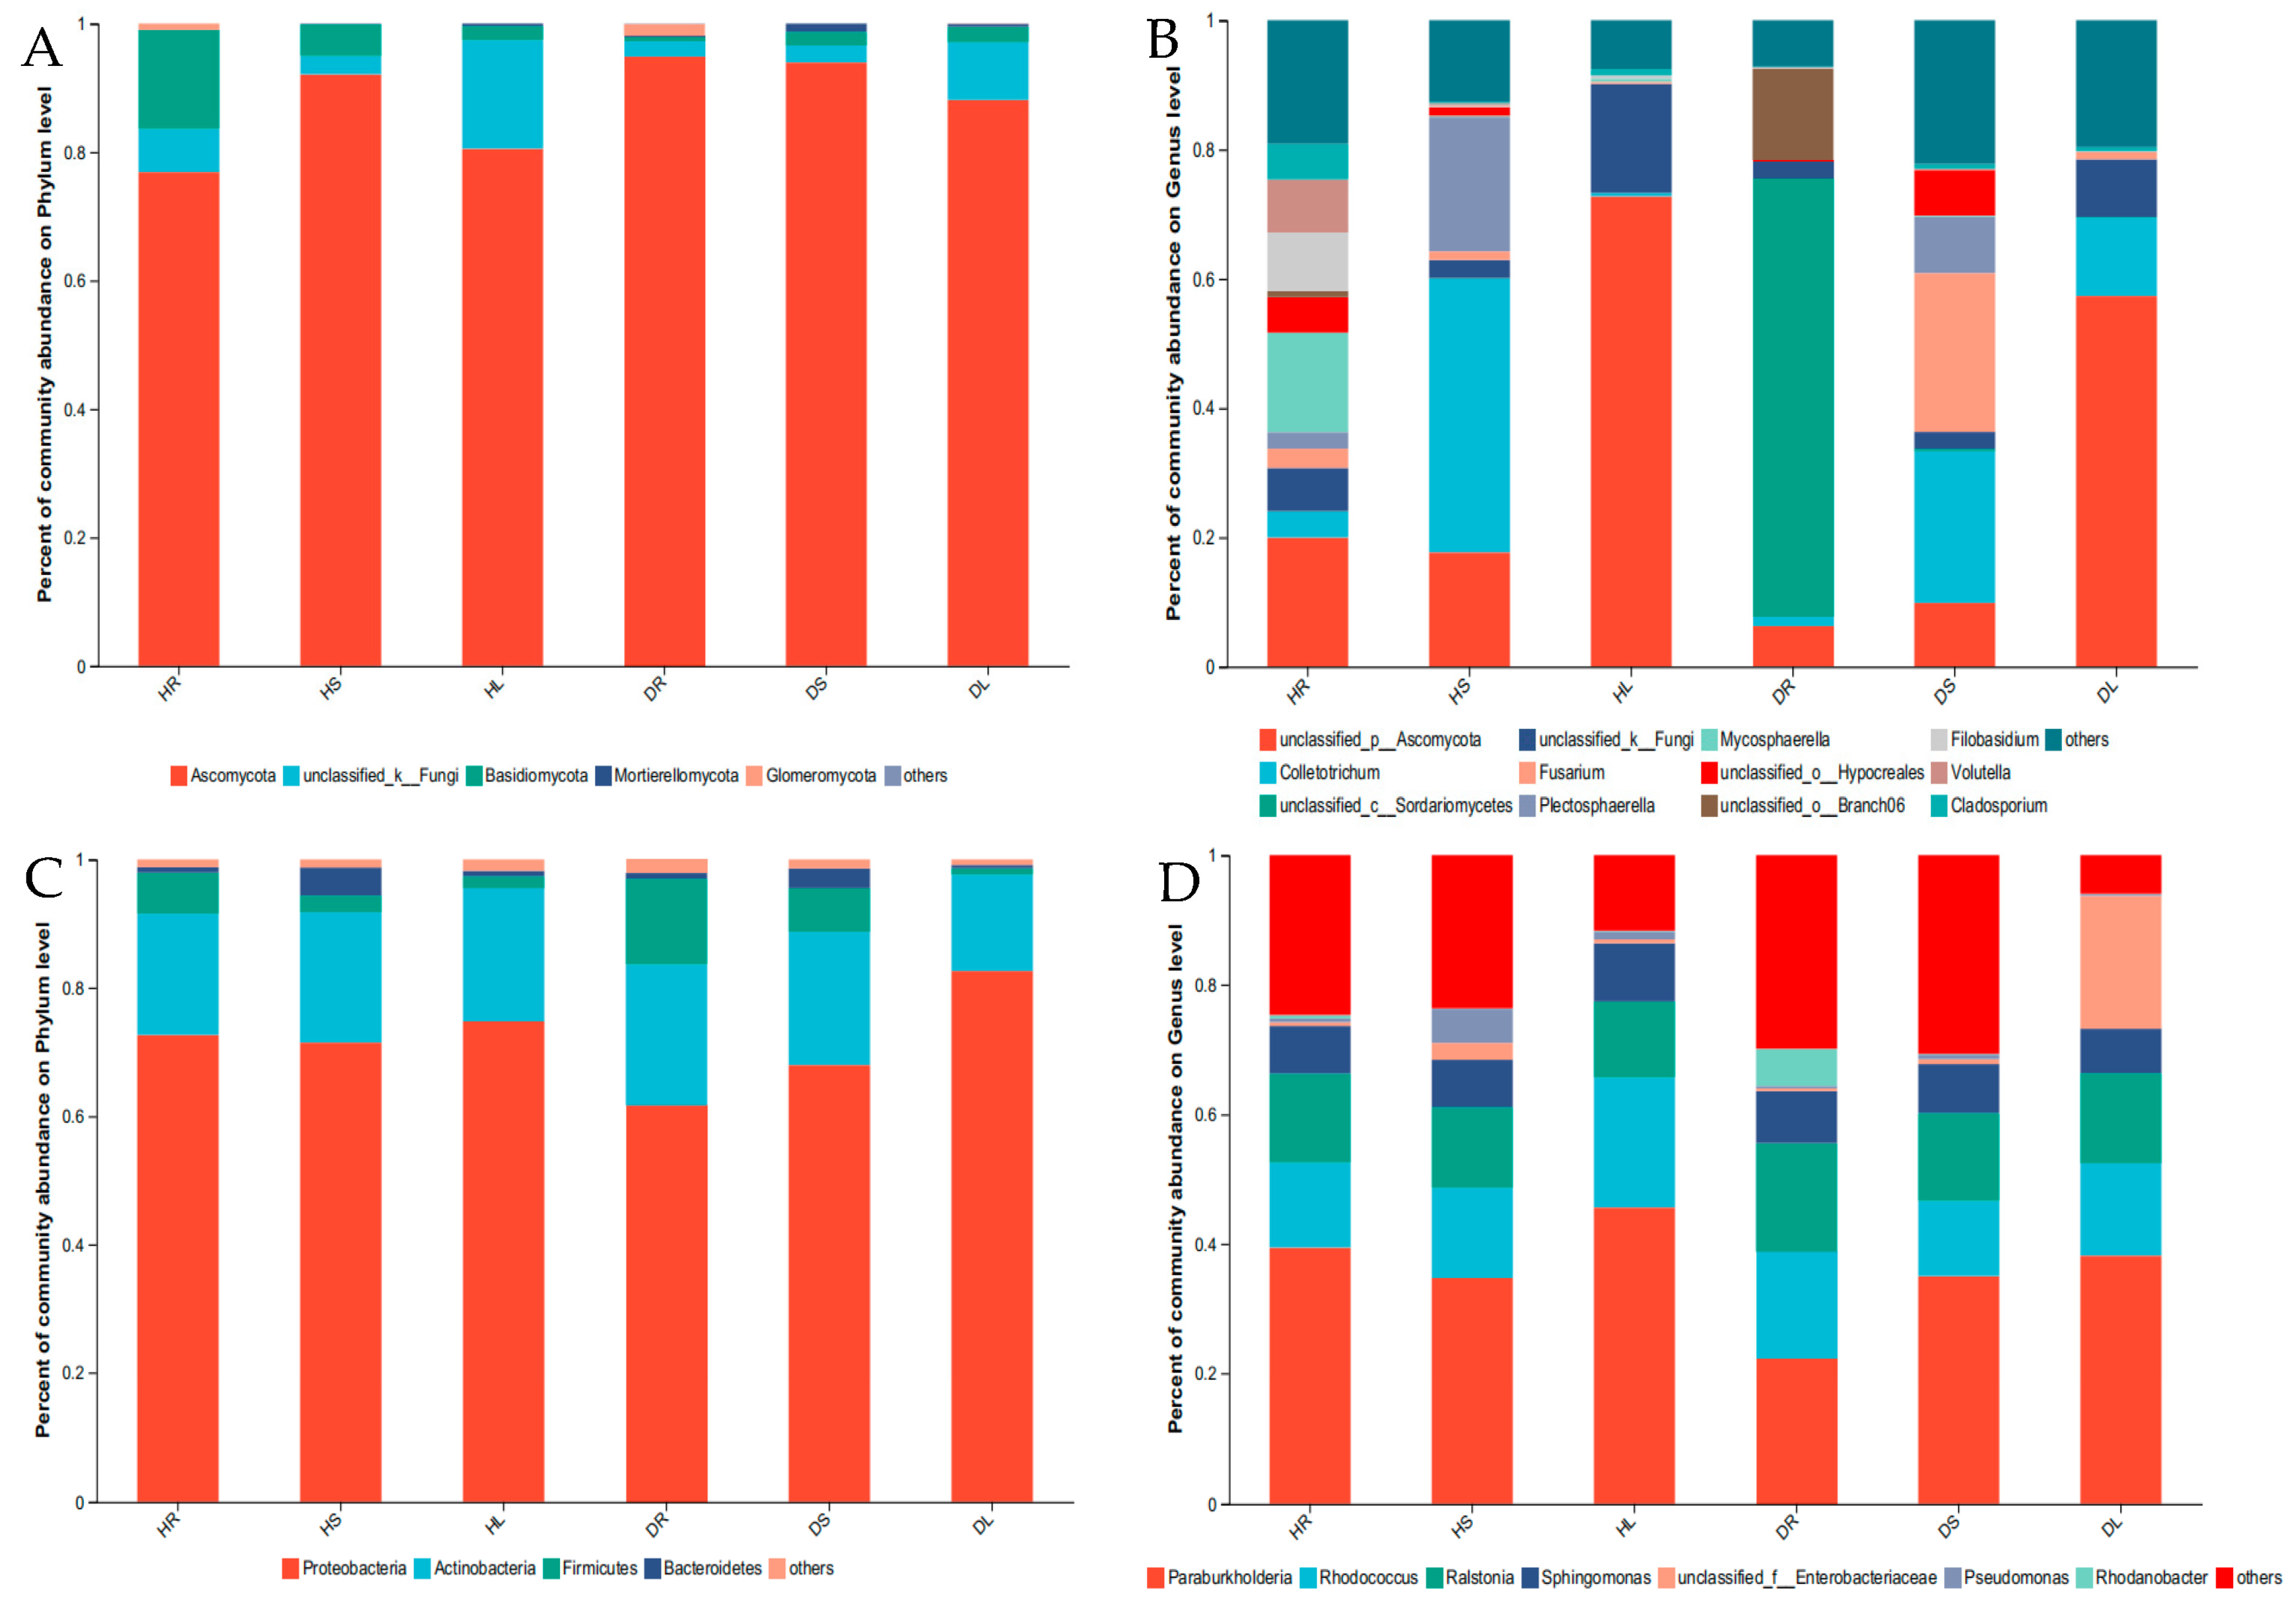
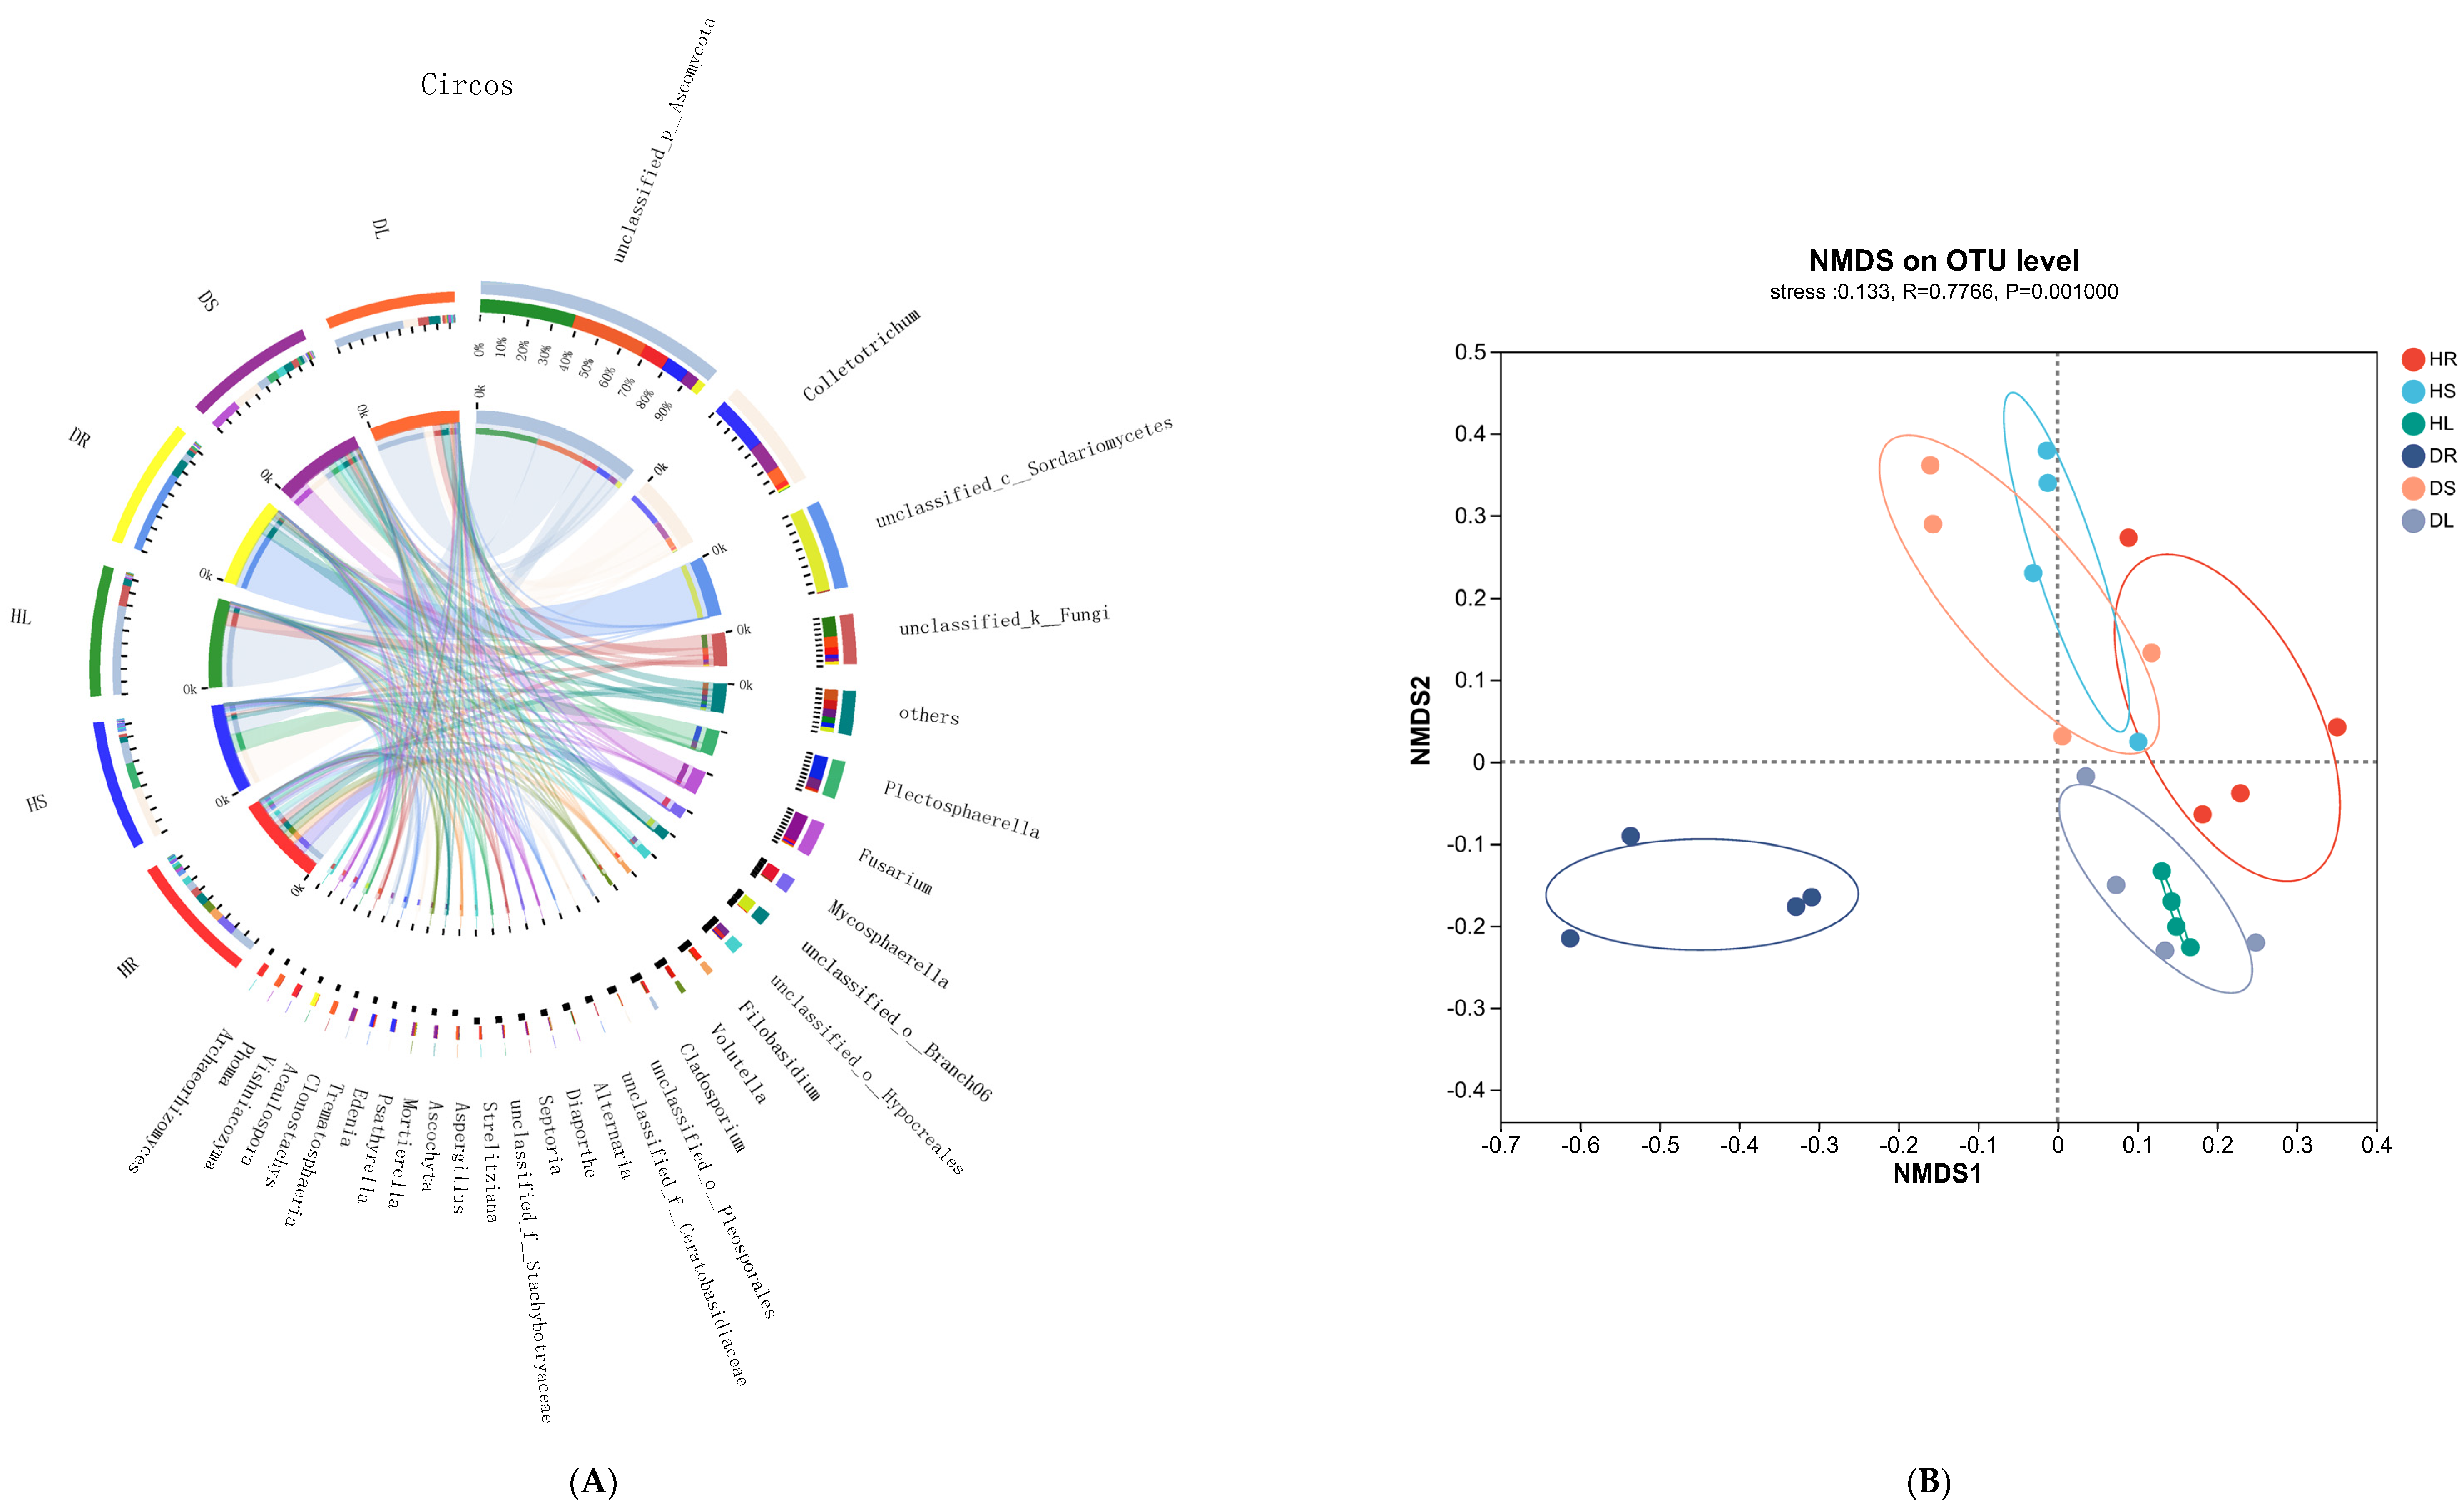
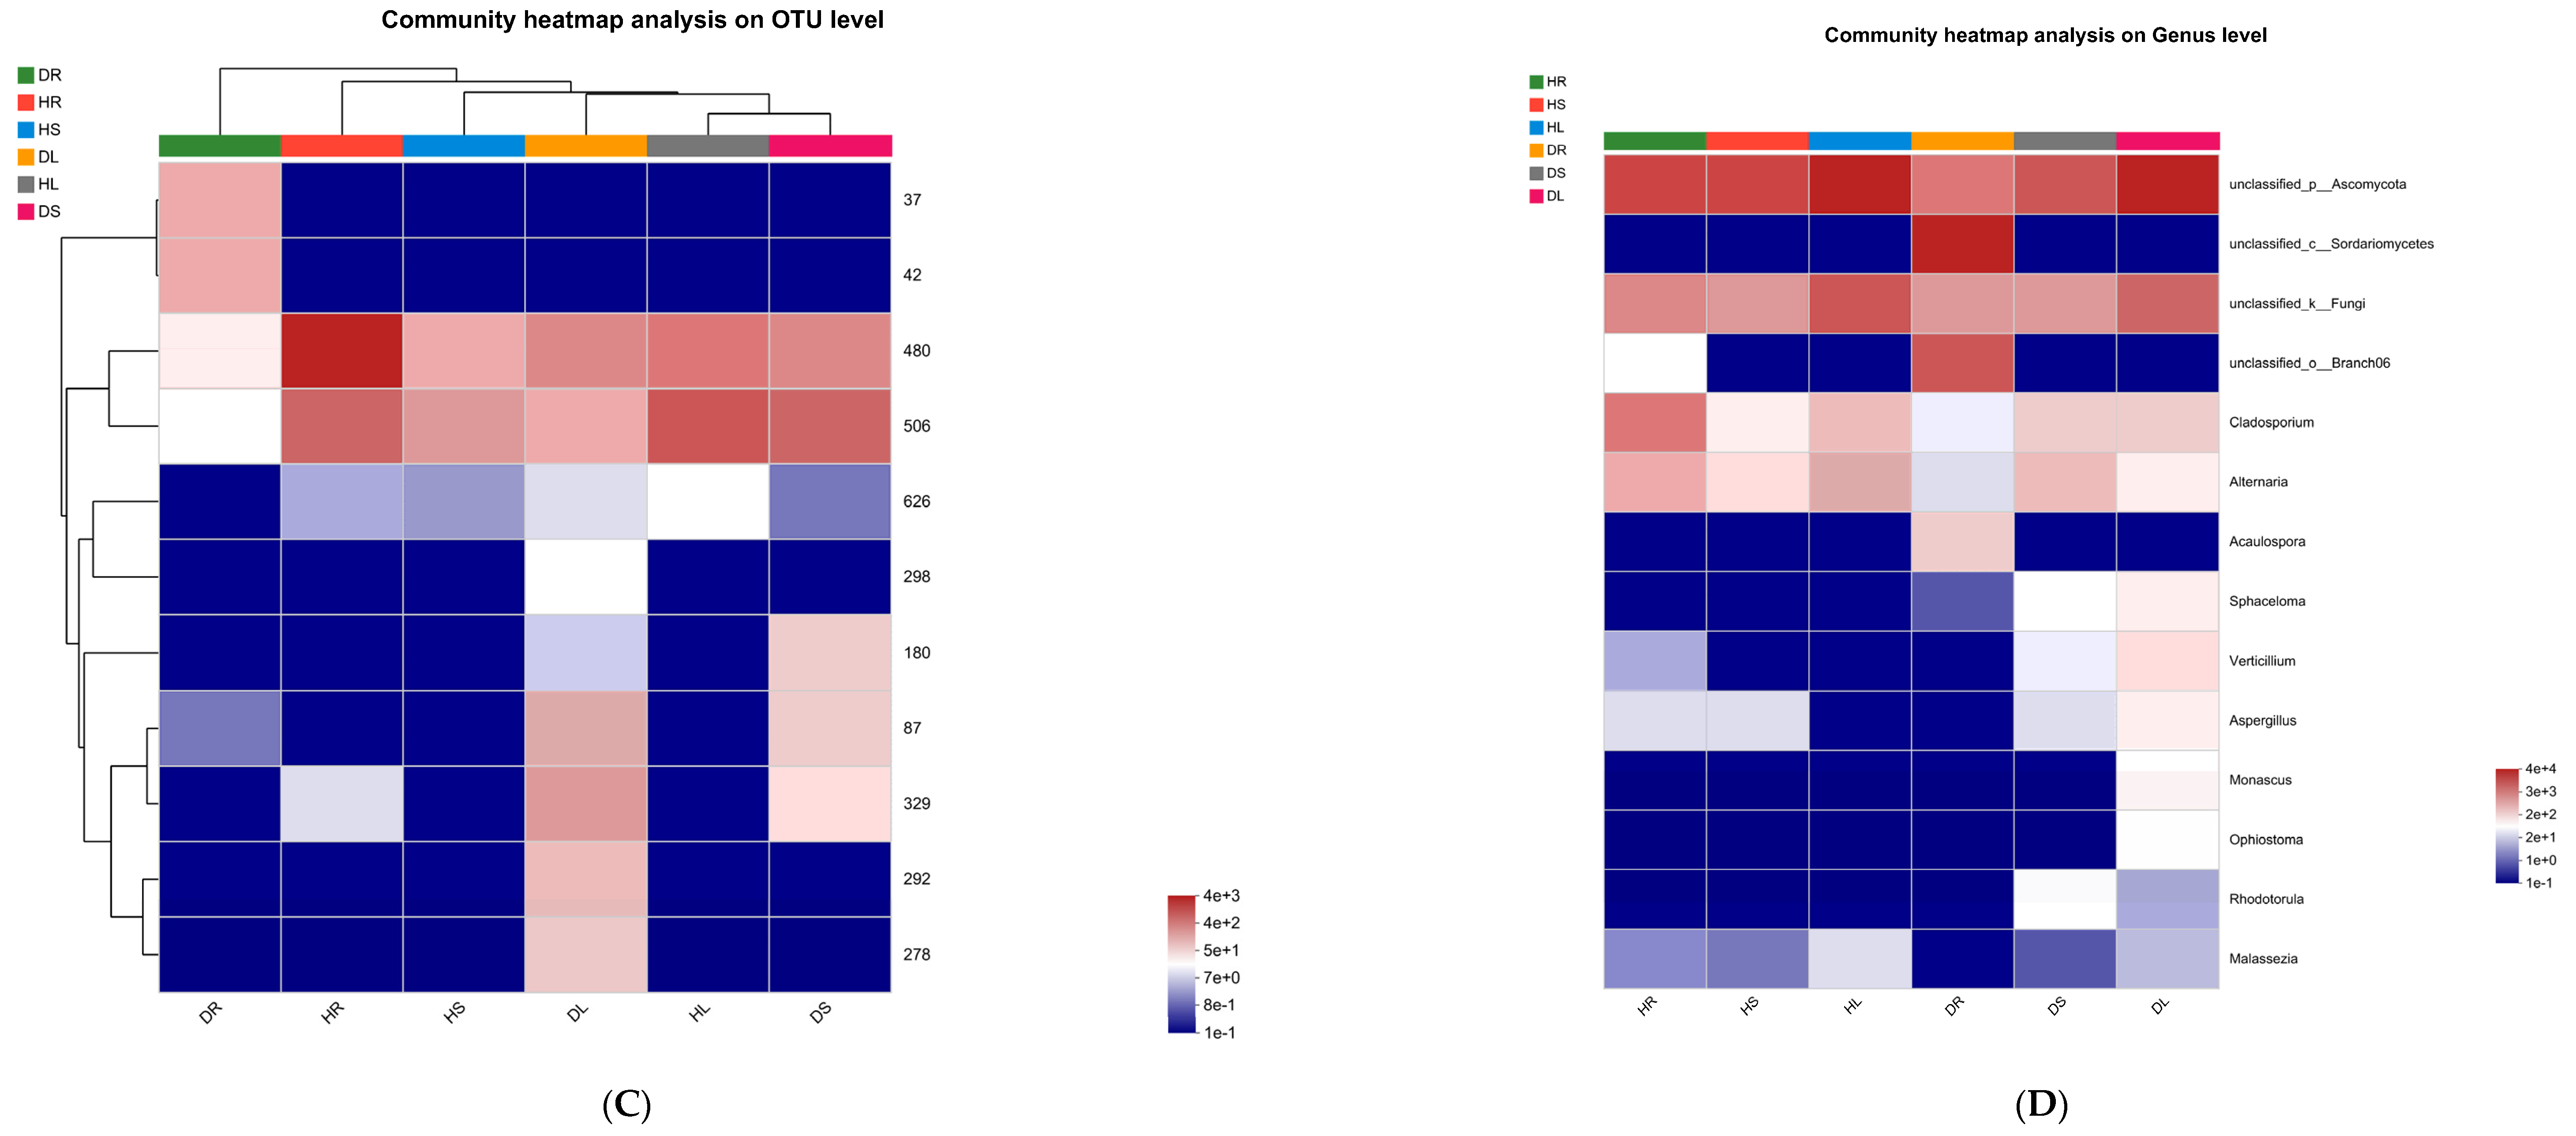
3.3. Composition of the Endophytes in Sweetpotato

The composition of endophytic fungi in different tissues of sweetpotato was studied at the phylum level, and their abundance ratio was <0.01 in all the samples (Figure 5). The results showed that Ascomycota was the dominant fungal taxon and accounted for most of the endophytic fungi in healthy and infected sweetpotato plants, following by Basidiomycota, Mortierellomycota, and Glomeromycota (Figure 5A). The main endophytic bacteria were Proteobacteria, Actinomycetes, Firmicutes, and Bacteroidetes (Figure 5B). At the genus level, the combined abundance ratio of endophytic fungi in all the samples was <0.05, and all the samples mainly contained unclassified genera of Ascomycota, Colletotrichum, and Fusarium (Figure 5A). Paraburkholderia, Rhodococcus, and Ralstonia dominated the endophytic bacterial population (Figure 5B).

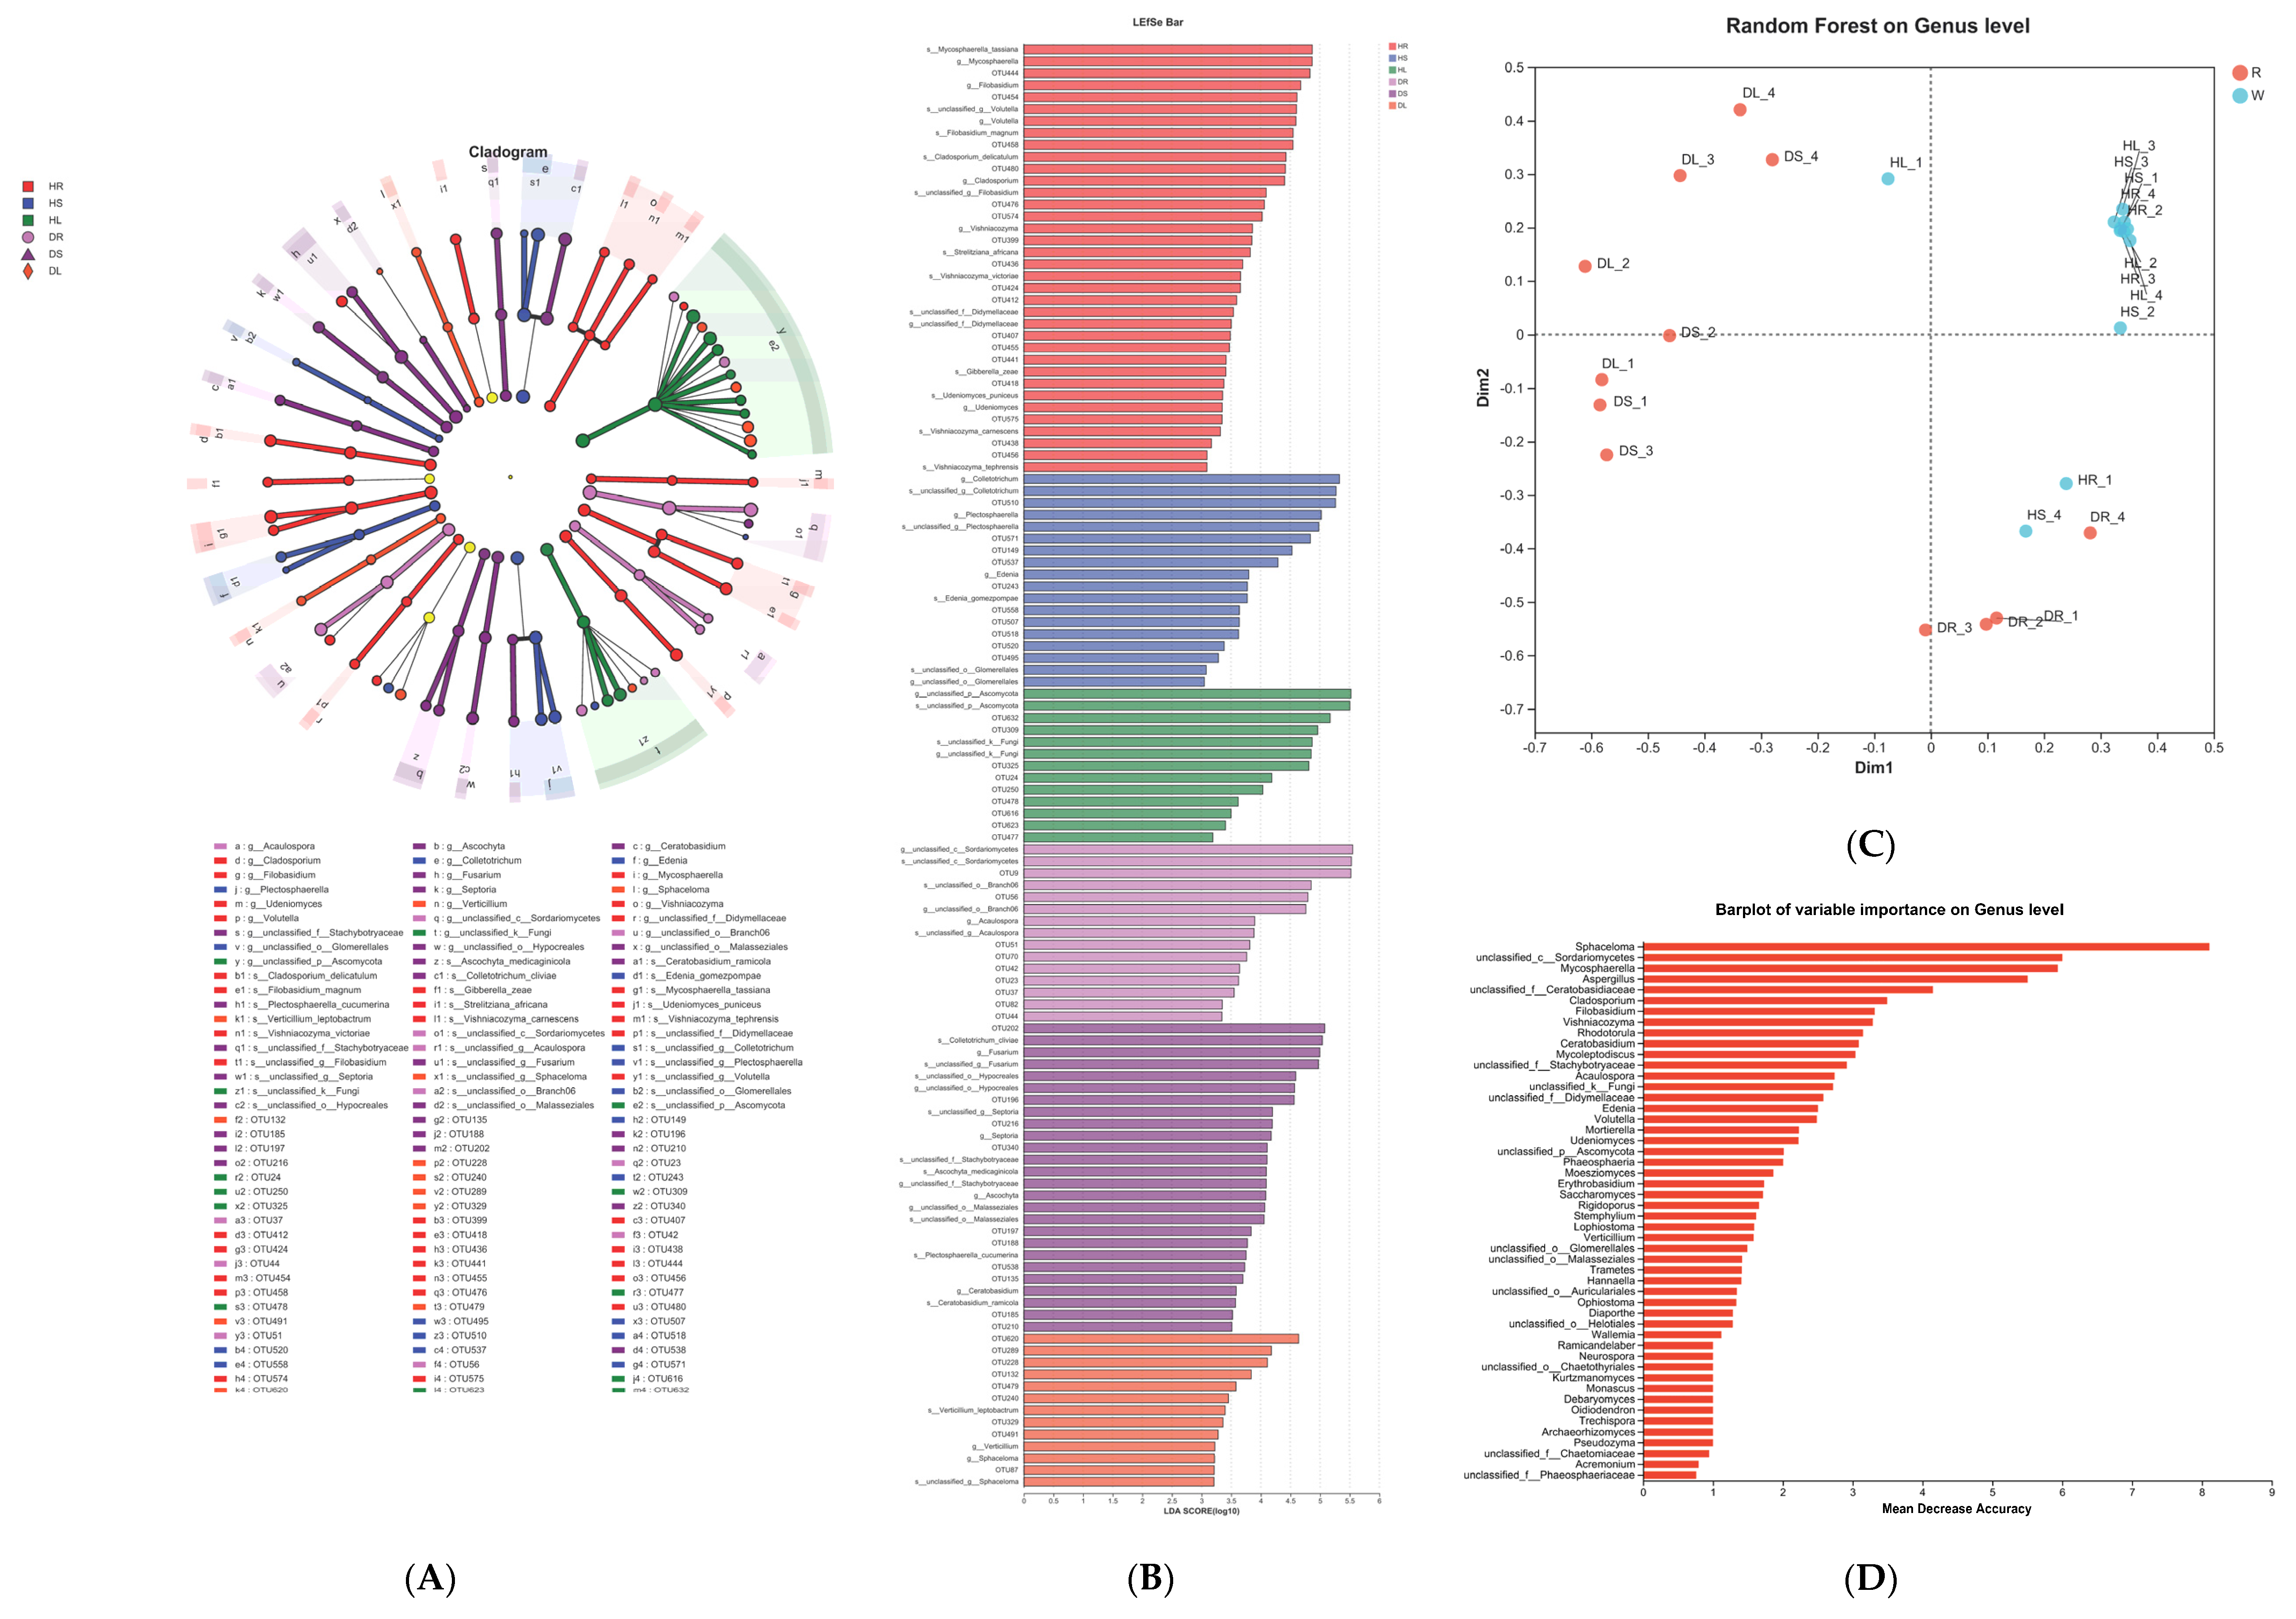
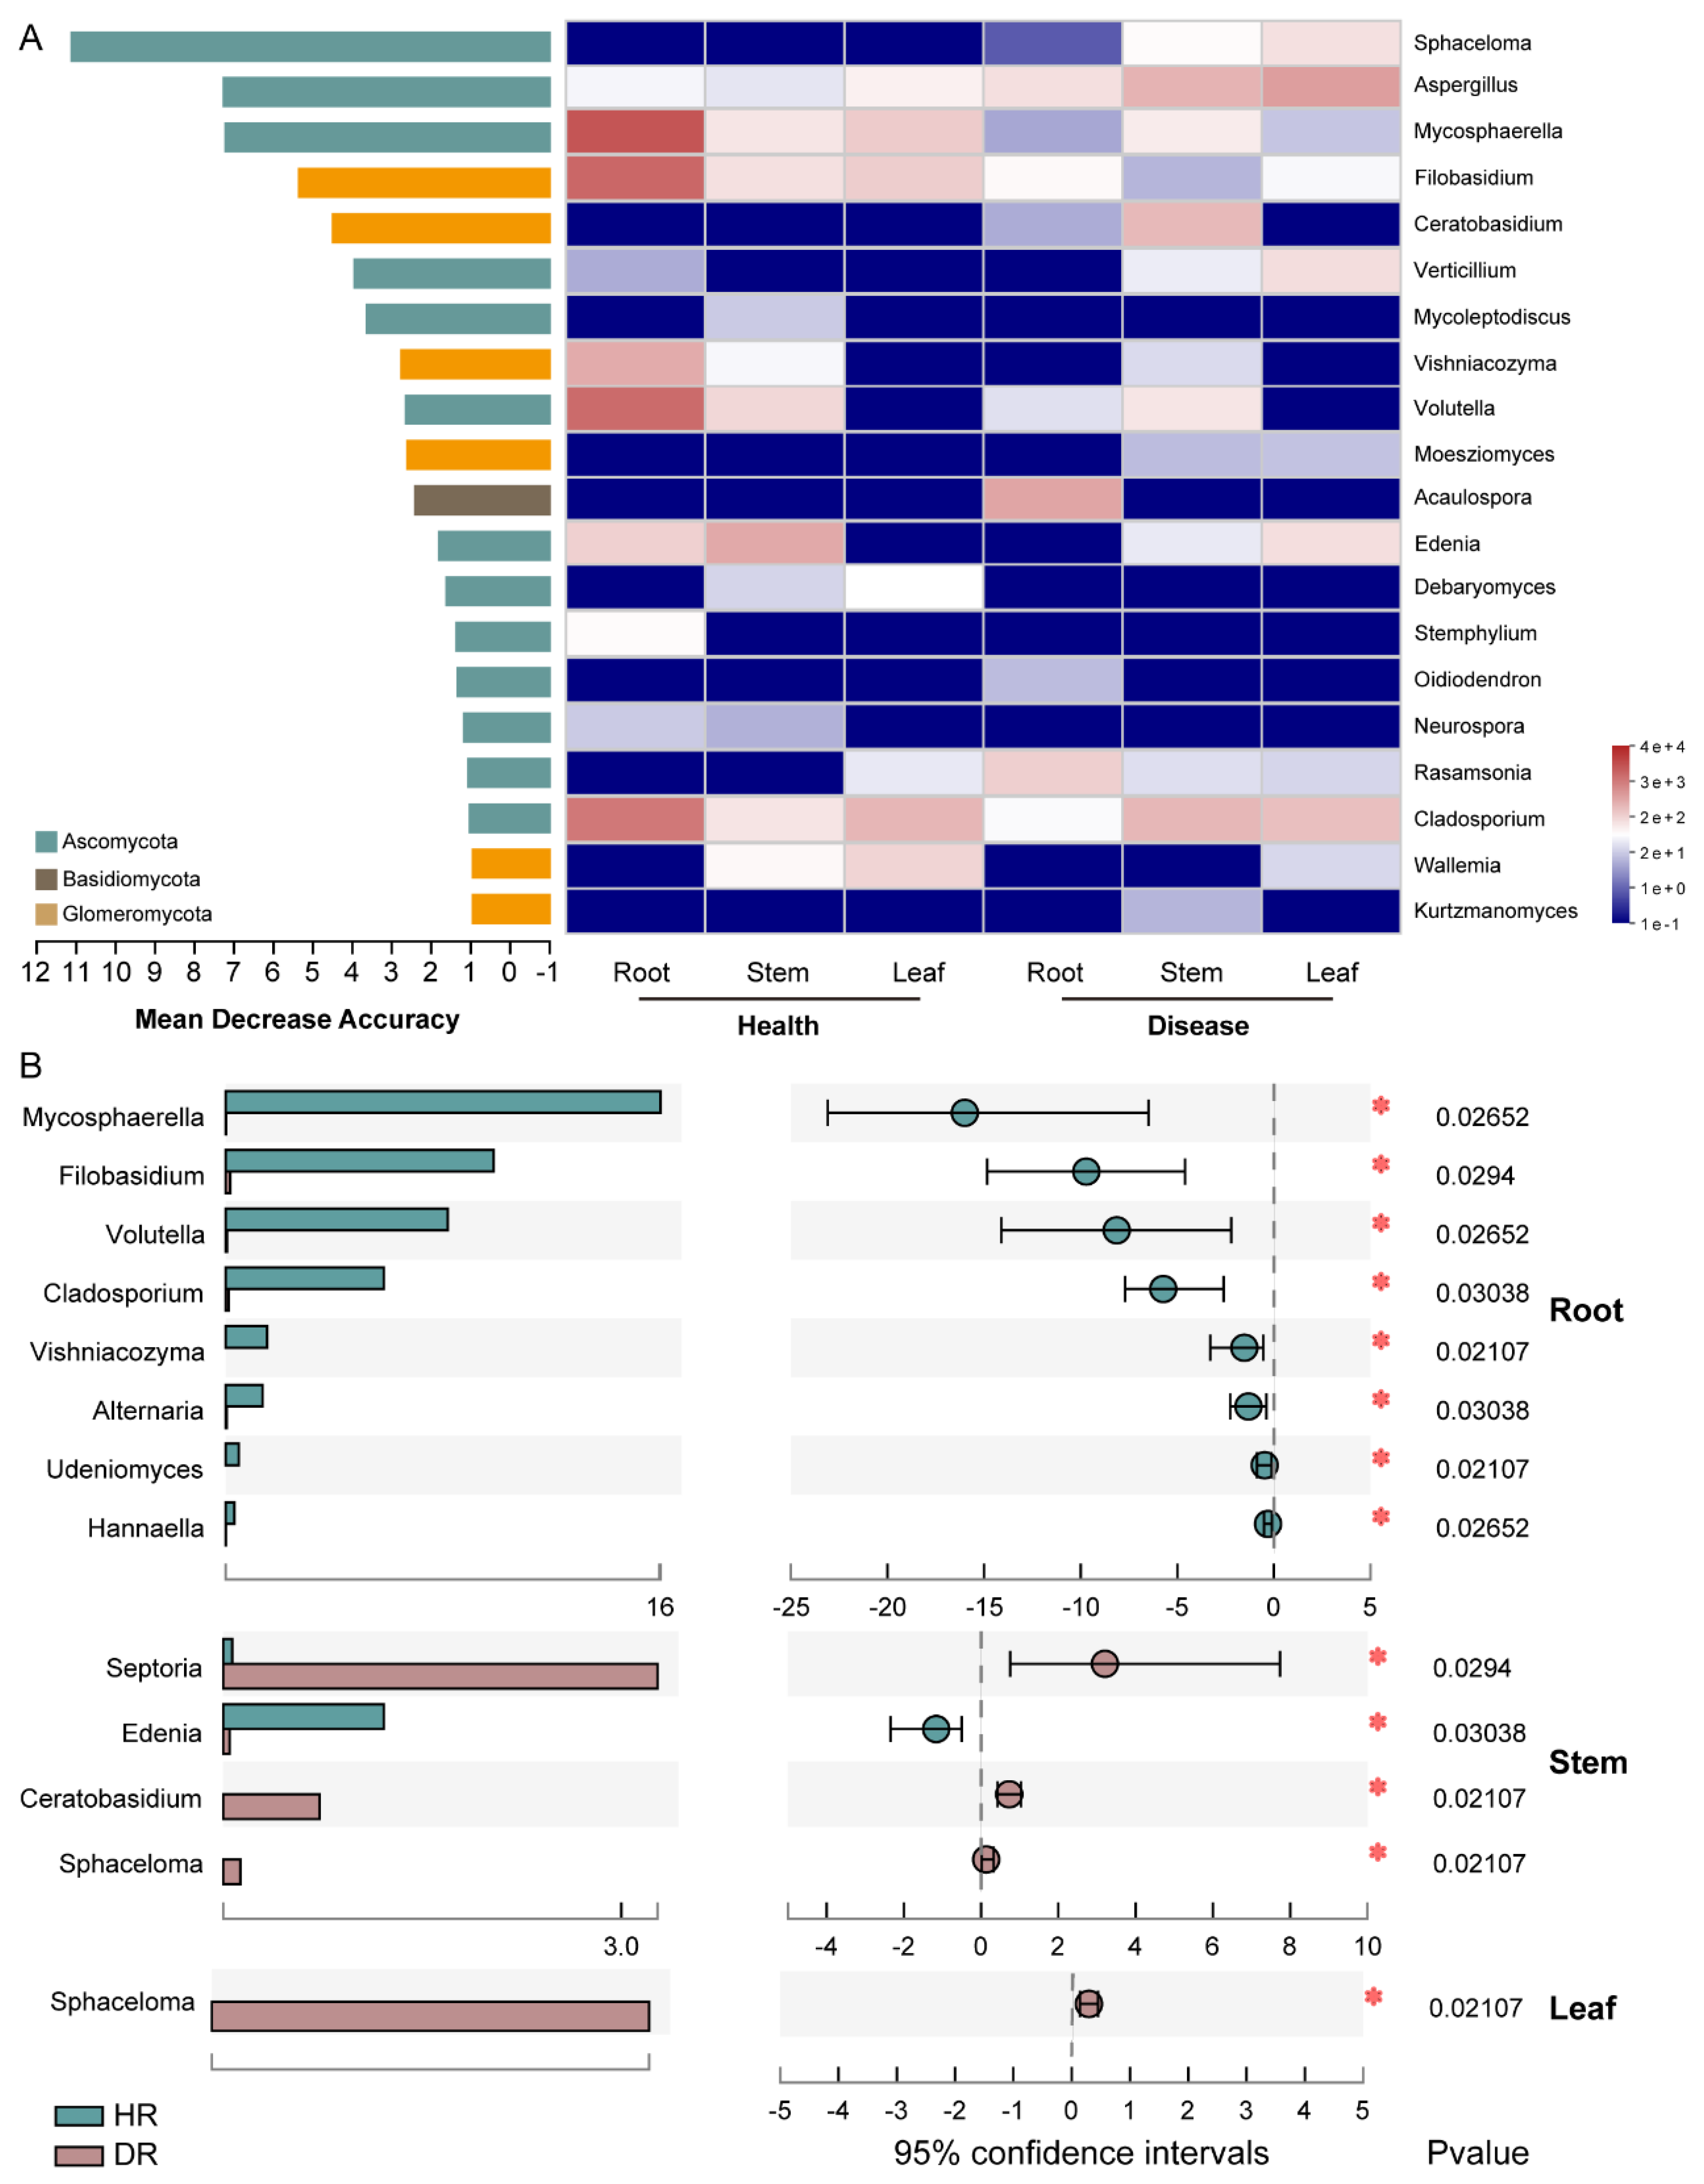
3.4. Analysis of the Endophytic Fungi in Sweetpotato Infected with Scab Disease

The Circos plot showed that Ascomycota was the most abundant fungal phylum (enriched in healthy and diseased leaves), followed by Colletotrichum (enriched in healthy and diseased stems and Sordariomycetes (enriched in diseased roots) (Figure 6A). NMDS analysis showed that endophytic fungi from the leaves clustered separately, and the diseased leaf OTUs included those from healthy leaves, while the diseased root OTUs were in a separate cluster (Figure 6B). The OTU analysis of the community heatmap showed that healthy and diseased leaves clustered together, which was similar to the results of healthy and diseased stems (Figure 6C). However, the healthy and diseased roots did not cluster together, and the OTUs of the diseased roots were in a separate branch. More differences in the flora from healthy and diseased roots were observed (Figure 6C). The pathogenic bacteria OTU87 and OTU329 were closely related, and both were enriched in the infected leaves (Figure 6C). In the community heatmap genus analysis, the pathogen Elsinoë was also enriched in the infected leaves (Figure 6D).
Based on the results of the hierarchy tree diagram of LEfSe multi-level species analysis, the OTUs were mainly clustered in the Ascomycota phylum, and the pathogen Elsinoë formed a separate branch, which was divided into OTU87, which clustered under diseased leaves. OTU329 represented Verticillium, which formed a single branch cluster under the diseased leaves (Figure 7A). The LDA discrimination results showed that OTU87 and Elsinoë were enriched in the diseased leaves (Figure 7B). A random forest analysis was used to select the most important biomarker species for sample classification and sequencing. The results showed that the roots, stems, and leaves of the healthy plants (W) clustered together, but there was no obvious clustering after infection (R) (Figure 7C). The impact of Elsinoë on the healthy and diseased sweetpotato groups was much higher than that of the other fungi (Figure 7D).
The results of the random forest species abundance analysis are shown in Figure 8. At the genus level, 20 representative fungi were analyzed and a heatmap was used to show the community composition distribution among multiple samples. It was found that the pathogen Elsinoë had the highest occurrence, and its abundance was low in healthy sweetpotato roots, stems, and leaves. However, its abundance after scab disease infection was significantly higher, particularly in the leaves. At the phylum level, the Ascomycota and Glomeromycota phyla accounted for the highest proportion (Figure 8A).
A Wilcoxon rank-sum test was used to test the significant difference in abundance between the two groups to determine the changes in endophyte community abundance caused by sweetpotato scab. The results showed that eight fungal genera, namely Mycosphaerella, Filobasidium, Volutella, Cladosporium, Vishniacozyma, Alternaria, Udeniomyces, and Hannaella, were significantly enriched in the healthy sweetpotato roots compared to those that were infected with scab disease (Figure 8B). The healthy sweetpotato stems were significantly richer in Edenia than those infected with scab disease, while the sweetpotato stems infected with scab were significantly richer in Septoria, Ceratobasidium, and Elsinoë. Notably, Elsinoë was the most abundant species in infected sweetpotato leaves, followed by infected sweetpotato stems, but it was not enriched in the healthy stems and leaves. This confirmed that the causal agent of scab is Elsinoë, which predominantly infects sweetpotato leaves and stems to a lesser extent, with no significant effect on the roots.

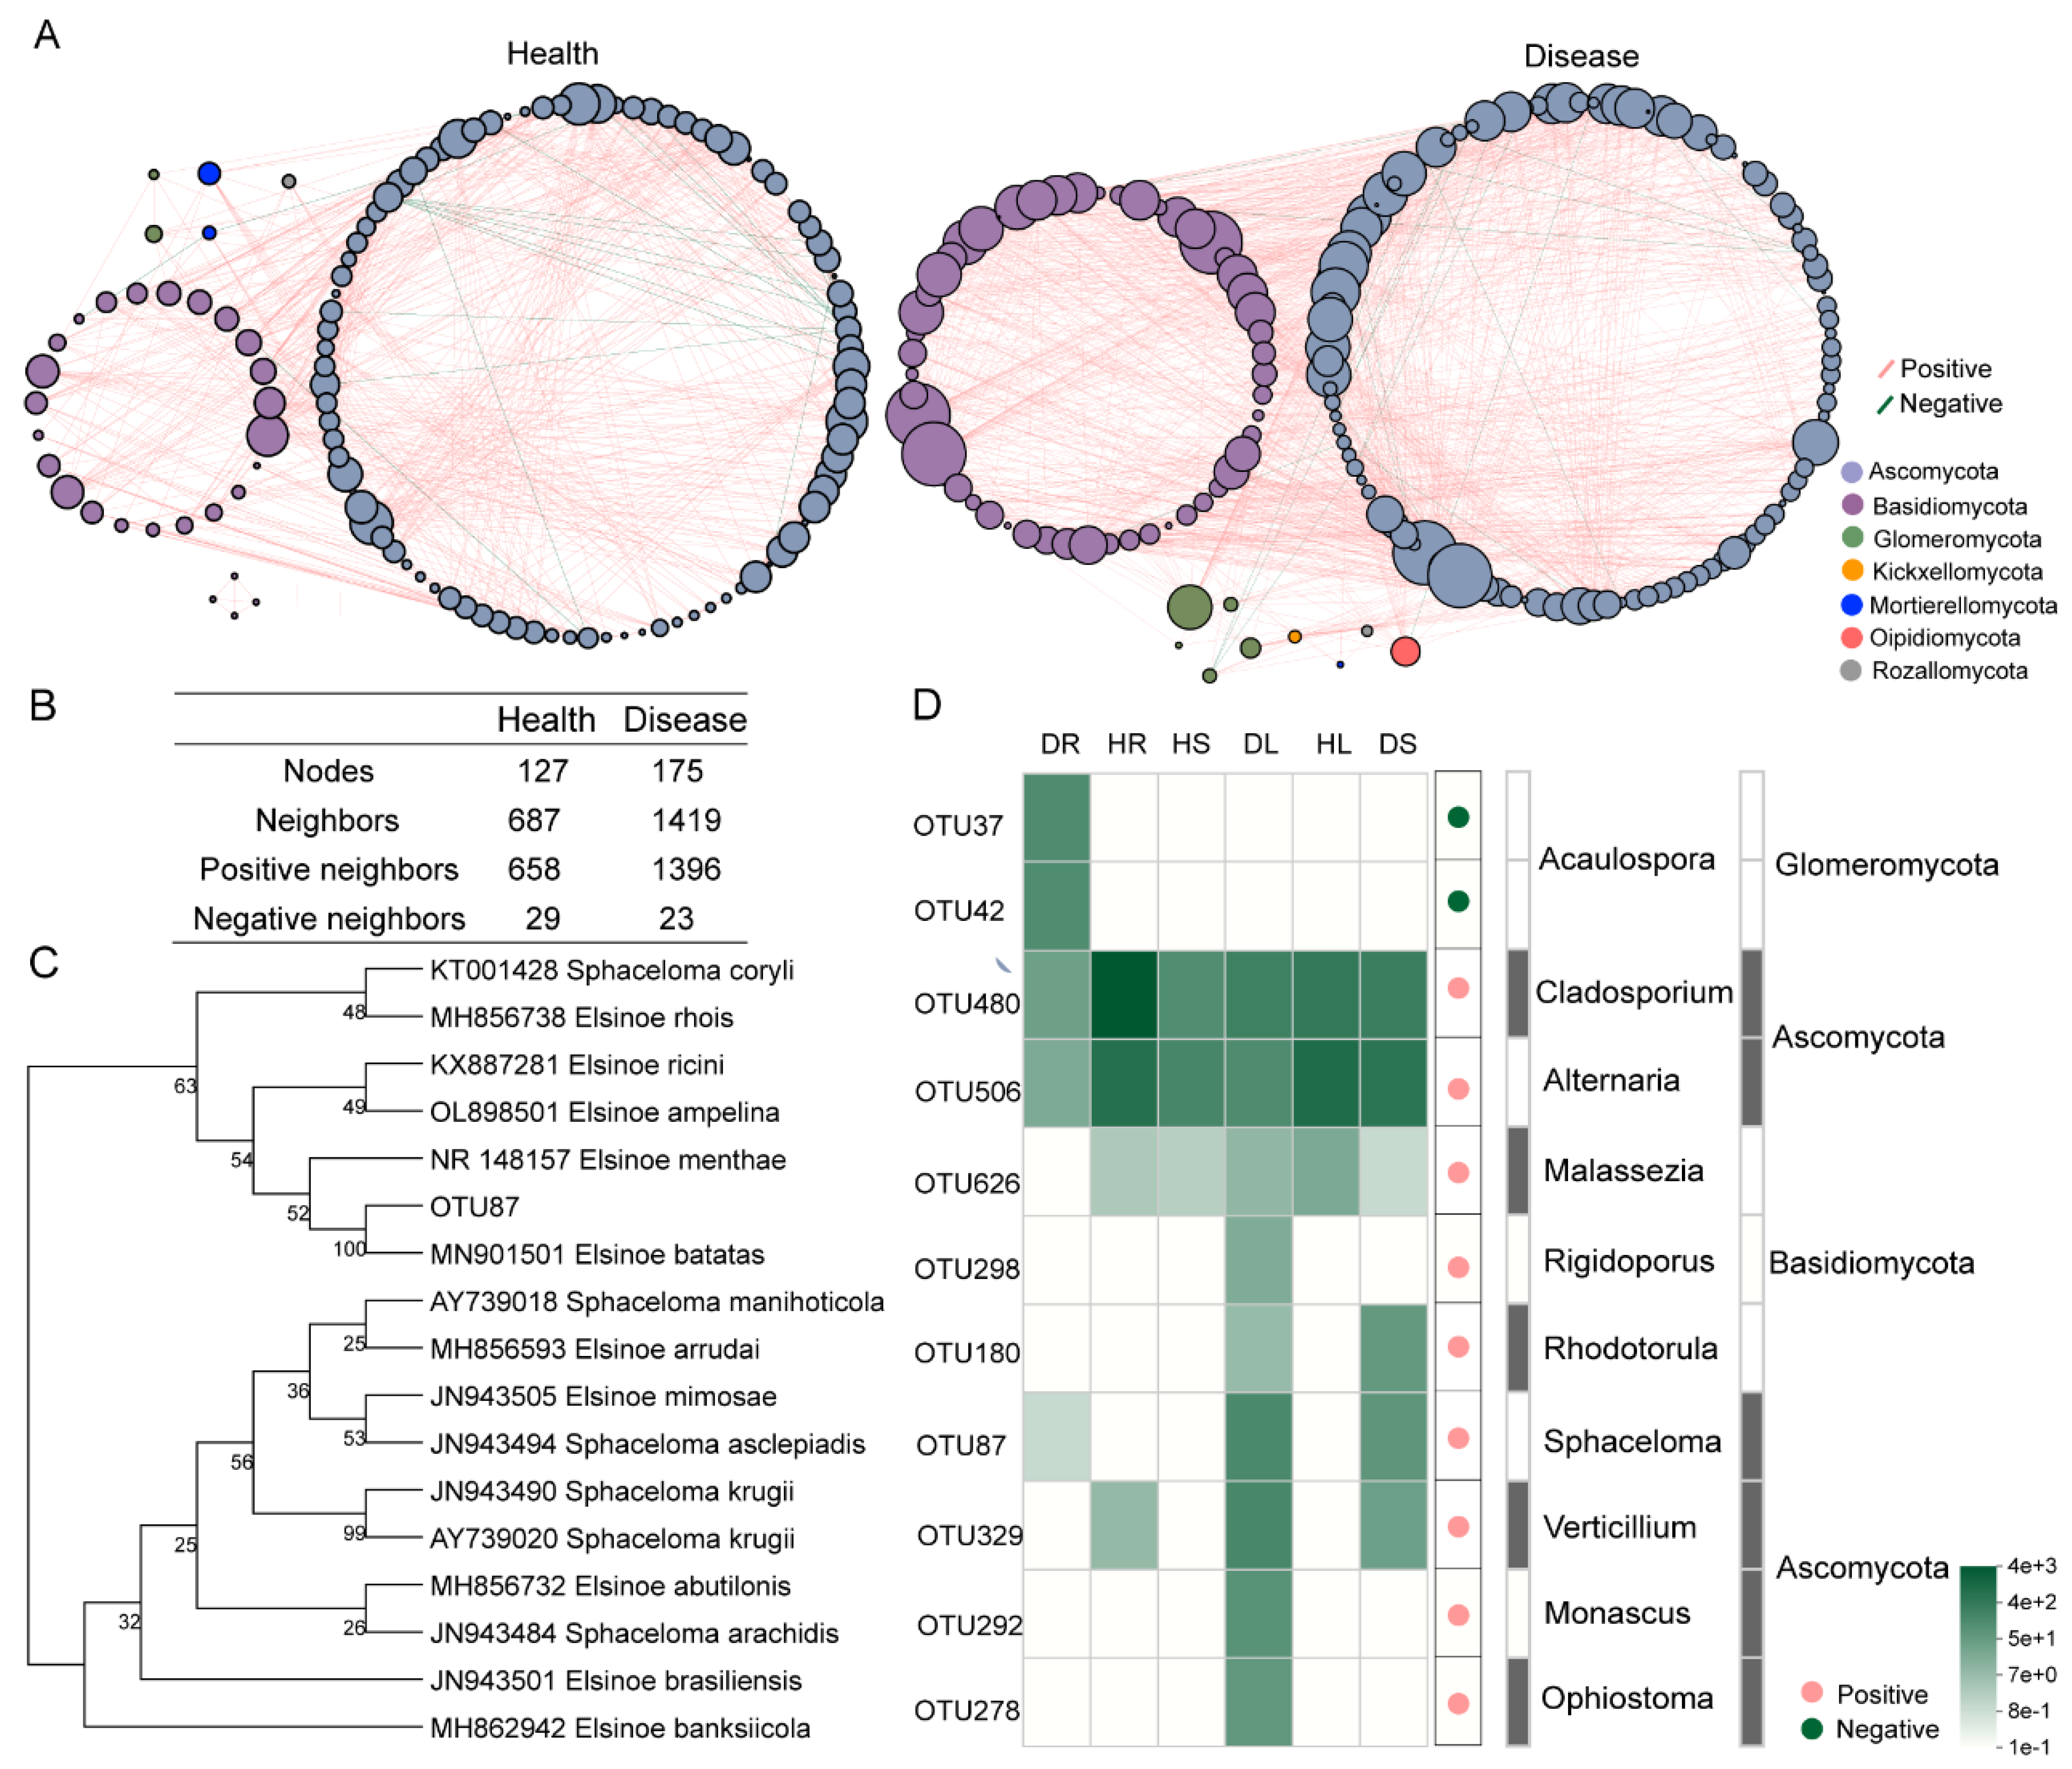
3.5. Relationship Analysis of the Endophytes Pathogenic to Sweetpotato Scab

Correlation coefficients were calculated at the phylum level for all the endophytic fungal species in sweetpotato and visualized using Cytoscape. The co-occurrence network diagram visually displayed the co-occurrence relationship. The network nodes represented fungal phyla, and the connecting lines of the nodes represented the species relations in the sample. There were 127 healthy sweetpotato nodes, with 658 positive correlation connections and 29 negative correlation connections, and 175 infected sweetpotato nodes, with 1396 positive correlation connections and 23 negative correlation connections. Ascomycota and Basidiomycota were the dominant phyla in healthy and infected plants (Figure 9A,B).
OTU87 (Elsinoë) was enriched in the sweetpotato stems and leaves infected with sweetpotato scab (Figure 9) and had the highest number (664) in the infected sweetpotato leaves. Moreover, 298 OTU87s were detected in the infected sweetpotato stems. The sequences of OTU87 were aligned using BLAST, and 16 species of the genus Elsinoë were selected to construct a phylogenetic tree to determine whether OTU87 is the pathogen that causes sweetpotato scab. The results showed that OTU87 clustered with Elsinoë batatas, with a support level of 100%, and it was identified as the causative agent of sweetpotato scab (Figure 9C). According to Spearman’s coefficient correlation, 10 OTU species that were significantly related to OTU87 were screened (Figure 9D), and these species were found to be distributed in 10 genera. Among them, only Acaulospora was negatively correlated with OTU87. The species that were positively correlated with OTU87 included members of Cladosporium, Alternaria, Malassezia, Rigidoporus, Rhodotorula, Elsinoë, Verticillium, Monascus, and Ophiostoma (Figure 9D). A heatmap was used to analyze the distribution of the abundance of OTUs related to OTU87 in the different tissues of sweetpotato (Figure 9D). The results showed that the strains that were negatively correlated with OTU87 were mostly distributed in the roots, while those that positively correlated with OTU87 were mostly distributed in the stems and leaves of infected sweetpotato plants, with most found in the leaves. The endophytic fungi that were positively correlated with OTU87 might also be pathogenic to sweetpotato scab (Figure 9D).

4. Discussion

Sweetpotato scab is one of the most destructive crop diseases. The disease was first reported in Taiwan and China and is currently widely distributed in Japan, Southeast Asia, and the Pacific Islands [12,13,30]. However, there are currently no effective methods to prevent and control this disease. After scab infection, the leaves, petioles, and stems of sweetpotato appear twisted, deformed, or even reduced in size. Thus, the growing areas of sweetpotato will soon diminish since the disease can cause yield losses of more than 50% [31,32]. Endophytes are considered candidates for sustainable agriculture because they play key roles in regulating the primary and secondary metabolism of host plants [33,34]. The direct and lasting interaction between endophytes and the host improves the host’s resistance to abiotic and biotic stresses, such as pathogens [33]. The abundant endophytes in sweetpotato have the potential to control sweetpotato diseases. For endophytic fungi, 63% of the sequences found in the core microbiome (genus level) are uncharacterized. This suggests that many core microorganisms in the different organs of sweetpotato have not yet been isolated, characterized, and described. This confirms the considerable advantages of high-throughput amplicon sequencing for microbial identification. Therefore, to better understand the relationship between endophytic communities and sweetpotato scab, we conducted this type of sequencing to detect endophytic flora in the roots, stems, and leaves of healthy and scabby sweetpotato samples.
Endophyte diversity, which has long been part of biodiversity and ecosystem research, has been reported to be critical for ecosystems to function efficiently [35]. Sweetpotato scab is caused by the conidia of pathogenic fungi, which are the inoculum for primary and secondary infections. The conidia spread through the movement of air and the splashing of rainwater and invade the plants through parasitic wounds or their epidermis. The pathogen mainly infects the leaves of sweetpotato [11,36]. This study also found that in sweetpotato samples infected by pathogenic fungi, the diversity of endophytic fungal flora in the roots was significantly lower than that in the leaves (p < 0.05). Similarly, by analyzing the significantly different species in different tissues of healthy and diseased sweetpotato groups, this study found that Elsinoë, the pathogenic fungus that causes sweetpotato scab, accumulates in the leaves of diseased sweetpotato. This result was similar to that of Huang et al. [11]. Other studies have shown that some endophytes are associated only with belowground tissues and others with aboveground tissues [37,38]. The sweetpotato scab pathogen colonizes the stems and leaves of sweetpotato from the outside and does not move from top to bottom to harm the belowground parts (roots) of sweetpotato. In addition, this study also found that the endophytic fungal community composition in different tissues of healthy and diseased samples was significantly different (p < 0.05), while the difference in endophytic bacteria was insignificant (p > 0.05). Thus, we hypothesized that unlike endophytic fungi, endophytic bacteria are not actively involved in the resistance of sweetpotato to the scab pathogen. Ebrahimi et al. [25] also reported similar results, whereby the endophytic fungi isolated from healthy apple fruits and apple tree leaves and branches had strong antifungal properties and could produce media-permeable metabolites, volatile organic compounds (VOCs), chitinases, and cellulases and promote phosphate solubilization as growth-promoting effects.
This study found that the abundance of endophytic fungal flora in healthy sweetpotato roots is significantly higher than that in the leaves (p < 0.05). After colonizing the plant roots, microorganisms can enter the plant and become endophytes, which can then colonize various belowground and aboveground plant organs as the plant grows [39,40]. The distribution and abundance of plant endophytes gradually decrease from bottom to top (from roots to leaves), which is considered to be the typical movement of plant endophytes [38]. It has been reported that endophytes in the belowground parts of plants originate from rhizosphere microorganisms, while other endophytes may originate from other plant compartments [41]. This study found additional niche differentiation of the microbiota in sweetpotato leaves relative to sweetpotato roots and stems at the OTU level. Beckers et al. [42] and Tardif et al. [43] also obtained similar results. Since biodiversity can reduce or increase the transmission of disease [44], we hypothesized that endophytic biodiversity may be related to the response of sweetpotato to infection by the scab pathogen. The abundance of endophytic fungi reduced, which promoted the invasion of pathogenic fungi and the occurrence of scab disease. Tian et al. [45] found that the Shannon index, the Simpson index, and observed OTU richness of the endophyte community of healthy roots are all higher than those with clubroot disease. This indicated that the endophyte communities in healthy roots have a higher diversity [45]. Zhao et al. made a similar discovery [46]. Therefore, this study hypothesized that increasing the abundance of endophytes in sweetpotato leaves could improve their disease resistance.
This study found that Ascomycota is the dominant endophytic fungus in healthy and diseased sweetpotato samples. It has been reported that Ascomycota is the largest fungal phylum, and its members exhibit a wide range of lifestyle diversity [47]. Moreover, Ascomycota is the most common group of endophytic fungi [48] and plays an important role in soil stability, plant biomass decomposition, and endogenous interactions with plants [49]. Ascomycota can also adapt well to life on or in plants, such as mustard (Sinapis spp.) and rapeseed (Brassica napus) [45]. Therefore, Ascomycota is an important component of the plant endophytic fungi. The predominant phylum of endophytic bacteria in healthy and diseased sweetpotato samples was Proteobacteria, followed by Actinobacteria and then Firmicutes. Proteobacteria, Actinobacteria, and Firmicutes are the most widely distributed plant endophytes bacteria and are associated with plant disease resistance [50]. It has been reported that Proteobacteria, Firmicutes, and Actinobacteria are important endophytic bacterial groups in healthy mulberries (Morus sp.) and those infected with the causal agent of bacterial blight (Pseudomonas syringae pv. mori). While the abundance of Proteobacteria in the diseased samples was significantly lower than that in the healthy samples, the opposite was true for Actinobacteria [28]. In addition, the richness of Proteobacteria and Actinobacteria in mulberry varieties with high and medium resistance to bacterial wilt was significantly higher than that in susceptible varieties [27]. In addition to changes in the species composition, it is equally important to study how the metabolome, proteome, and other components of sweetpotato endophytes change after infection with scab, which requires more researchers to be involved in the study.
This study analyzed species with significant variations in different tissues of healthy and diseased sweetpotato and found that the pathogenic fungi that cause sweetpotato scab increase significantly in the leaves and stems of diseased sweetpotato but are rarely found in the roots. Sweetpotato scab mainly damages the aboveground parts (leaves and stems) of sweetpotato, especially the young leaves, but does not damage the roots [11]. However, in this study, the difference in endophytic bacterial flora between the healthy and diseased samples was not obvious. It is hypothesized that endophytic fungi are the main endophytes responsible for the response against sweetpotato scab pathogens. The abundance of Elsinoë in the healthy sweetpotato roots, stems, and leaves was low, but the abundance increased significantly after scab infection, with the highest abundance occurring in the leaves. It has been reported that Elsinoë is an important causal agent of sweetpotato scab [14]. The pathogen can also cause anthracnose and scab in eucalyptus (Eucalyptus spp.) [51], grape (Vitis vinifera) [52], avocado (Persea americana) [53], citrus (Citrus spp.) [54], and poplar (Populus spp.) [55]. Thus, Elsinoë has a wide host range and can cause serious economic losses. In this study, we compared the sequences of Elsinoë and constructed a phylogenetic tree. The results showed that the sequence of OTU87 is consistent with that of Elsinoë batatas, which was identified as the causal agent of sweetpotato scab. This study again deduced that Elsinoë is an important pathogen that causes sweetpotato scab disease.
Compared with the healthy group, Septoria, Ceratobasidium, and Elsinoë were significantly increased in the stems and leaves of sweetpotato infected with sweetpotato scab (p < 0.05). In addition to Elsinoë, diseased sweetpotato stems also had Septoria and Ceratobasidium, which are important plant pathogens. It has been reported that S. steviae can cause stevia leaf spots [56], while S. erigerontisn can cause fleabane leaf spot disease [57]. Moreover, Ceratobasidium sp. can cause root rot in strawberry (Fragaria × ananassa), oriental blueberry (Elaeocarpus decipiens), bilberry (Vaccinium myrtilis), and almond (Prunus dulcis) [58,59]. Although no pathogen other than Elsinoë has hitherto been associated with the sweetpotato scab disease, our results suggest that this pathology may result from co-infection with other fungal taxa, such as Septoria and Ceratobasidium.
This study used the Spearman correlation coefficient to screen for strains related to the sweetpotato scab pathogen Elsinoë. Elsinoë was found to negatively correlate with Acaulospora but positively correlate with Cladosporium, Alternaria, Malassezia, Rigidoporus, Rhodotorula, Verticillium, Monascus, and Ophiostoma. Therefore, the negatively correlated Acaulospora may be a potential biocontrol fungal resource for sweetpotato scab, and the positively correlated Cladosporium and seven other genera may be co-pathogenic with Elsinoë. This research provides new insights and theoretical support for the study of endophytic fungal resources for sweetpotato scab and the development of fungal biocontrol agents that can antagonize sweetpotato scab disease.

5. Conclusions

In summary, the diversity of endophytic fungi in healthy sweetpotato shows the trend of root > stem > leaf, while the diversity of endophytic fungi in infected sweetpotato shows the trend of leaf > stem > root. The endophytic fungal diversity of the leaves and stems tends to increase after susceptibility to the disease and is significantly lower in the roots. After scab infection, the abundance of endophytic fungi changes significantly in different tissues. In particular, the diversity of endophytic fungal communities in the roots of infected sweetpotato is significantly reduced, while that in the leaves is significantly increased. Interestingly, the endophytic bacterial diversity and richness do not change significantly even after scab infection. Ascomycota is the dominant endophytic fungus, and Proteobacteria is the dominant endophytic bacterial species in sweetpotato. The scab pathogen Elsinoë was classified as OTU87 and is enriched in the leaves and stems of infected plants. Moreover, the number of pathogens shows a pattern of leaves > stems > roots, indicating that the pathogens are mainly airborne. Elsinoë is negatively correlated with Acaulospora and positively correlated with eight genera, including Cladosporium, Alternaria, and Malassezia. Future research should focus on controlling the pathogenic bacteria in the leaves and stems and exploring potential biocontrol fungal resources for sweetpotato scab.

Supplementary Materials

The following supporting information can be downloaded at https://www.mdpi.com/article/10.3390/agronomy13122965/s1: Table S1. Statistics on fungal samples. Table S2. Bacterial sample information statistics. Table S3. Fungal OTU table. Table S4. Bacterial OTU table.

Author Contributions

S.W. designed and conducted the experiments, analyzed the data, interpreted the results, and revised and edited the manuscript. T.M. and X.Y. collected the materials and assisted with the experiments and data analysis. Z.D., M.L., Z.Y. and Z.W. supervised the off-campus research. L.H. provided the experimental platform and support, project guidance, and funding. All authors have read and agreed to the published version of the manuscript.

Funding

This research was funded by the earmarked fund for CARS-10-Sweetpotato, the Key-Area Research and Development Program of Guangdong Province (no. 2020B020219001), and the Sweetpotato Potato Innovation Team of the Modern Agricultural Industry Technology System in Guangdong Province (2023KJ111).

Data Availability Statement

Data are contained within the article and Supplementary Materials.

Acknowledgments

We thank all our lab coworkers for their support during this project.

Conflicts of Interest

The authors declare no conflict of interest.

References

  1. Nguyen, H.C.; Chen, C.C.; Lin, K.H.; Chao, P.Y.; Lin, H.H.; Huang, M.Y. Bioactive Compounds, Antioxidants, and Health Benefits of Sweet Potato Leaves. Molecules 2021, 26, 1820. [Google Scholar] [CrossRef] [PubMed]
  2. Liu, Y.; Chen, Q.; Zhou, M.; Yang, X.; Yang, C.; Jiao, C. Sweet potato study in China: Stress response mechanisms, molecular breeding, and productivity. J. Plant Physiol. 2020, 254, 153283. [Google Scholar] [CrossRef] [PubMed]
  3. Agili, S.; Nyende, B.; Ngamau, K. Selection, yield evaluation, drought tolerance indices of Orange-Flesh Sweet Potato (Ipomoea batatas Lam) Hybrid Clone. J. Nutr. Food Sci. 2012, 3, 138. [Google Scholar] [CrossRef]
  4. Wang, F.; Tan, W.F.; Song, W.; Yang, S.T.; Qiao, S. Transcriptome analysis of sweet potato responses to potassium deficiency. BMC Genom. 2022, 15, 655. [Google Scholar] [CrossRef] [PubMed]
  5. Xiao, Y.; Zhu, M.; Gao, S. Genetic and Genomic Research on Sweet Potato for Sustainable Food and Nutritional Security. Genes 2022, 11, 1833. [Google Scholar] [CrossRef] [PubMed]
  6. Jiang, T.; Ye, S.; Liao, W.; Wu, M.; He, J.; Mateus, N.; Oliveira, H. The botanical profile, phytochemistry, biological activities and protected-delivery systems for purple sweet potato (Ipomoea batatas (L.) Lam.): An up-to-date review. Food Res. Int. 2022, 161, 111811. [Google Scholar] [CrossRef] [PubMed]
  7. Sheikha, A.F.E.; Ray, R.C. Potential impacts of bioprocessing of sweet potato: Review. Crit. Rev. Food Sci. Nutr. 2017, 57, 455–471. [Google Scholar] [CrossRef]
  8. Sun, H.; Mu, T.; Xi, L.; Zhang, M.; Chen, J. Sweet potato (Ipomoea batatas L.) leaves as nutritional and functional foods. Food Chem. 2014, 156, 380–389. [Google Scholar] [CrossRef]
  9. FAO. FAOSTAT. 2022. Available online: https://www.fao.org/faostat/en/#data/QCL (accessed on 30 October 2023).
  10. Zhang, X.X.; Chen, J.Y.; Fang, B.P.; Wang, Z.Y.; Yao, Z.F.; Huang, L.F. Identification of the pathogen causing sweet potato scab in Guangdong and resistance evaluation of main domestic leaf-vegetable sweet potato germplasm resources. J. Plant Prot. 2021, 48, 298–304. [Google Scholar] [CrossRef]
  11. Huang, S.H.; Huang, L.F.; Fang, B.P.; Chen, J.Y.; Zhang, X.J.; Li, Y.J.; Wang, Z.Y.; Luo, Z.X. Identification and control of leaf scab disease of sweetpotato. Guangdong Agric. Sci. 2011, S1, 80–81. [Google Scholar] [CrossRef]
  12. Clark, C.A.; Ferrin, D.M.; Smith, T.P.; Holmes, G.J. Compendium of Sweetpotato Diseases, Pests, and Disorders, 2nd ed.; American Phytopathological Society: St. Paul, MN, USA, 2013; p. 26. [Google Scholar] [CrossRef]
  13. Jenkins, A.E.; Viegas, A.P. Stem and foliage scab of sweet potato (Ipomoea batatas). J. Wash. Acad. Sci. 1943, 33, 244–249. Available online: https://biostor.org/reference/134201 (accessed on 25 July 2023).
  14. Zhang, X.X.; Zou, H.D.; Yang, Y.L.; Fang, B.P.; Huang, L.F. Genome Resource for Elsinoë batatas, the Causal Agent of Stem and Foliage Scab Disease of Sweet Potato. Phytopathology 2022, 112, 973–975. [Google Scholar] [CrossRef] [PubMed]
  15. Fan, X.L.; Barreto, R.W.; Groenewald, J.Z.; Bezerra, J.D.P.; Pereira, O.L.; Cheewangkoon, R.; Mostert, L.; Tian, C.M.; Crous, P.W. Phylogeny and taxonomy of the scab and spot anthracnose fungus Elsinoë (Myriangiales, Dothideomycetes). Stud. Mycol. 2017, 87, 1–41. [Google Scholar] [CrossRef] [PubMed]
  16. Chen, J.Y.; Fang, B.P.; Zhang, X.J.; Huang, L.F.; Wang, Z.Y.; Luo, Z.X. A New Leaf-vegetable Sweet Potato Cultivar ‘Guangcaishu 5’. Acta Hortic. Sin. 2021, 48, 2861–2862. [Google Scholar] [CrossRef]
  17. Mendes, R.; Garbeva, P.; Raaijmakers, J.M. The rhizosphere microbiome: Significance of plant beneficial, plant pathogenic, and human pathogenic microorganisms. FEMS Microbiol. Rev. 2013, 37, 634–663. [Google Scholar] [CrossRef] [PubMed]
  18. Qu, Q.; Zhang, Z.; Peijnenburg, W.J.G.M.; Liu, W.; Qian, H. Rhizosphere Microbiome Assembly and Its Impact on Plant Growth. J. Agric. Food Chem. 2020, 68, 5024–5038. [Google Scholar] [CrossRef] [PubMed]
  19. Trivedi, P.; Leach, J.E.; Tringe, S.G.; Sa, T.; Singh, B.K. Plant-microbiome interactions: From community assembly to plant health. Nat. Rev. Microbiol. 2020, 18, 607–621. [Google Scholar] [CrossRef]
  20. Matsumoto, H.; Fan, X.; Wang, Y.; Kusstatscher, P.; Duan, J.; Wu, S.; Chen, S.; Qiao, K.; Wang, Y.; Ma, B.; et al. Bacterial seed endophyte shapes disease resistance in rice. Nat. Plants 2021, 7, 60–72. [Google Scholar] [CrossRef]
  21. Yan, L.; Zhu, J.; Zhao, X.; Shi, J.; Jiang, C.; Shao, D. Beneficial effects of endophytic fungi colonization on plants. Appl. Microbiol. Biotechnol. 2019, 103, 3327–3340. [Google Scholar] [CrossRef]
  22. Padder, S.A.; Mansoor, S.; Bhat, S.A.; Baba, T.R.; Rather, R.A.; Wani, S.M.; Popescu, S.M.; Sofi, S.; Aziz, M.A.; Hefft, D.I.; et al. Bacterial Endophyte Community Dynamics in Apple (Malus domestica Borkh.) Germplasm and Their Evaluation for Scab Management Strategies. J. Fungi 2021, 7, 923. [Google Scholar] [CrossRef]
  23. Shuang, M.; Wang, Y.; Teng, W.; Jin, G. Isolation and identification of an endophytic bacteria Bacillus sp. K-9 exhibiting biocontrol activity against potato common scab. Arch. Microbiol. 2022, 14, 483. [Google Scholar] [CrossRef] [PubMed]
  24. Cui, L.; Yang, C.; Wang, Y.; Ma, T.; Cai, F.; Wei, L.; Jin, M.; Osei, R.; Zhang, J.; Tang, M. Potential of an endophytic bacteria Bacillus amyloliquefaciens 3–5 as biocontrol agent against potato scab. Microb. Pathog. 2022, 163, 105382. [Google Scholar] [CrossRef] [PubMed]
  25. Ebrahimi, L.; Hatami, R.S.; Etebarian, H.R. Apple Endophytic fungi and their antagonism against apple scab disease. Front. Microbiol. 2022, 13, 1024001. [Google Scholar] [CrossRef] [PubMed]
  26. Wang, C.J.; Wang, Y.Z.; Chu, Z.H.; Wang, P.S.; Liu, B.Y.; Li, B.Y.; Yu, X.L.; Luan, B.H. Endophytic Bacillus amyloliquefaciens YTB1407 elicits resistance against two fungal pathogens in sweet potato (Ipomoea batatas (L.) Lam.). J. Plant Physiol. 2020, 253, 153260. [Google Scholar] [CrossRef] [PubMed]
  27. Yuan, T.; Qazi, I.H.; Yang, P.; Zhang, X.; Li, J.; Liu, J. Analysis of endophytic bacterial flora of mulberry cultivars susceptible and resistant to bacterial wilt using metagenomic sequencing and culture-dependent approach. World J. Microbiol. Biotechnol. 2023, 39, 163. [Google Scholar] [CrossRef] [PubMed]
  28. Yuan, T.; Qazi, I.H.; Li, J.; Yang, P.; Yang, H.; Zhang, X.; Liu, W.; Liu, J. Analysis of changes in bacterial diversity in healthy and bacterial wilt mulberry samples using metagenomic sequencing and culture-dependent approaches. Front. Plant Sci. 2023, 23, 1206691. [Google Scholar] [CrossRef] [PubMed]
  29. Chen, J.Y.; Fang, B.P.; Li, Y.J.; Zhang, X.J.; Wang, Z.Y.; Huang, L.F.; Luo, Z.X.; Chen, X.L. Breeding of a new variety Guang Cai Shu No.3 for the tips of sweet potato vines as vegetable. Guangdong Agric. Sci. 2013, 40, 2. [Google Scholar] [CrossRef]
  30. Ames, T.; Smit, N.E.J.M.; Braun, A.R.; O’Sullivan, J.N.; Skoglund, L.G. Sweetpotato: Major Pests, Diseases, and Nutritional Disorders; Foliar and stem diseases caused by fungi; International Potato Center (CIP): Lima, Peru, 1997; p. 78. [Google Scholar]
  31. Ramsey, M.D.; Vawdrey, L.L.; Hardy, J. Scab (Sphaceloma batatas) a new disease of sweet potatoes in Australia: Fungicide and cultivar evaluation. Aust. J. Exp. Agric. 1988, 28, 137–141. [Google Scholar] [CrossRef]
  32. Fang, S.M.; Ke, Y.Q.; Huang, C.M.; Zhang, Y.J. The evaluation of resistance and analysis of resistant mechanism of sweet potato varieties to leaf scab disease. Acta Phytopathol. 2004, 31, 38–44. [Google Scholar]
  33. Dubey, A.; Malla, M.A.; Kumar, A.; Dayanandan, S.; Khan, M.L. Plants endophytes: Unveiling hidden agenda for bioprospecting toward sustainable agriculture. Crit. Rev. Biotechnol. 2020, 40, 1210–1231. [Google Scholar] [CrossRef]
  34. Pandey, S.S.; Jain, R.; Bhardwaj, P.; Thakur, A.; Kumari, M.; Bhushan, S.; Kumar, S. Plant probiotics—Endophytes pivotal to plant health. Microbiol. Res. 2022, 263, 127148. [Google Scholar] [CrossRef] [PubMed]
  35. Cappelli, S.L.; Domeignoz-Horta, L.A.; Loaiza, V.; Laine, A.L. Laine Plant biodiversity promotes sustainable agriculture directly and via belowground effects. Trends Plant Sci. 2022, 27, 674–687. [Google Scholar] [CrossRef] [PubMed]
  36. Cai, T. The occurrence pattern and control technology of sweet potato scab disease. Fujian Agric. 2006, 9, 23. [Google Scholar]
  37. Davide, B.; Klaus, S.; Stijn, S. Structure and Functions of the Bacterial Microbiota of Plants. Annu. Rev. Plant Biol. 2013, 64, 807–838. [Google Scholar] [CrossRef]
  38. Rosenblueth, M.; Martínez-Romero, E. Rhizobium etli maize populations and their competitiveness for root colonization. Arch. Microbiol. 2004, 181, 337–344. [Google Scholar] [CrossRef] [PubMed]
  39. Chi, F.; Shen, S.H.; Cheng, H.P.; Jing, Y.X.; Yanni, Y.G.; Dazzo, F.B. Ascending migration of endophytic rhizobia, from roots to leaves, inside rice plants and assessment of benefits to rice growth physiology. Appl. Environ. Microbiol. 2005, 71, 7271–7278. [Google Scholar] [CrossRef] [PubMed]
  40. Compant, S.; Kaplan, H.; Sessitsch, A.; Nowak, J.; Barka, E.A.; Clement, C. Endophytic colonization of Vitis vinifera L. by Burkholderia phytofirmans strain PsJN: From the rhizosphere to inflorescence tissues. FEMS Microbiol. Ecol. 2008, 63, 84–93. [Google Scholar] [CrossRef]
  41. Hironobu, M.; Hisao, M. Endophytic Bacteria in the Rice Plant. Microbes Environ. 2009, 23, 109–117. [Google Scholar] [CrossRef]
  42. Beckers, B.; Beeck, M.O.D.; Weyens, N.; Boerjan, W.; Vangronsveld, J. Structural variability and niche differentiation in the rhizosphere and endosphere bacterial microbiome of field-grown poplar trees. Microbiome 2017, 5, 25. [Google Scholar] [CrossRef]
  43. Tardif, S.; Yergeau, É.; Tremblay, J.; Legendre, P.; Whyte, L.G.; Greer, C.W. The willow microbiome is influenced by soil petroleum-hydrocarbon concentration with plant compartment-specific effects. Front. Microbiol. 2016, 7, 1363. [Google Scholar] [CrossRef]
  44. Ampt, E.A.; Ruijven, J.V.; Zwart, M.P.; Raaijmakers, J.M.; Termorshuizen, A.J.; Mommer, L. Plant neighbours can make or break the disease transmission chain of a fungal root pathogen. New Phytol. 2022, 233, 1303–1316. [Google Scholar] [CrossRef] [PubMed]
  45. Tian, X.; Wang, D.; Mao, Z.; Pan, L.; Liao, J.; Cai, Z. Infection of Plasmodiophora brassicae changes the fungal endophyte community of tumourous stem mustard roots as revealed by high-throughput sequencing and culture-dependent methods. PLoS ONE 2019, 12, e0214975. [Google Scholar] [CrossRef] [PubMed]
  46. Zhao, Y.; Gao, Z.X.; Tian, B.N.; Bi, K.; Chen, T.; Liu, H.Q.; Xie, J.T.; Cheng, J.S.; Fu, Y.P.; Jiang, D.H.; et al. Endosphere microbiome comparison between symptomatic and asymptomatic roots of Brassica napus infected with Plasmodiophora brassicae. PLoS ONE 2017, 12, e0185907. [Google Scholar] [CrossRef] [PubMed]
  47. Hill, R.; Levicky, Q.; Pitsillides, F.; Junnonen, A.; Arrigoni, E.; Bonnin, J.M.; Kermode, A.; Mian, S.; Leitch, I.J.; Buddie, A.G.; et al. Tapping Culture Collections for Fungal Endophytes: First Genome Assemblies for Three Genera and Five Species in the Ascomycota. Genome Biol. Evol. 2023, 3, evad038. [Google Scholar] [CrossRef] [PubMed]
  48. Angelini, P.; Rubini, A.; Gigante, D.; Reale, L.; Pagiotti, R.; Venanzoni, R. The endophytic fungal communities associated with the leaves and roots of the common reed (Phragmites australis) in Lake Trasimeno (Perugia, Italy) in declining and healthy stands. Fungal Ecol. 2012, 5, 683–693. [Google Scholar] [CrossRef]
  49. Challacombe, J.F.; Hesse, C.N.; Bramer, L.M.; McCue, L.A.; Lipton, M.; Purvine, S.; Nicora, C.; Gallegos-Graves, V.; Porras-Alfaro, A.; Kuske, C.R. Genomes and secretomes of Ascomycota fungi reveal diverse functions in plant biomass decomposition and pathogenesis. BMC Genom. 2019, 12, 976. [Google Scholar] [CrossRef]
  50. Rana, K.L.; Kour, D.; Kaur, T.; Devi, R.; Yadav, A.N.; Yadav, N.; Dhaliwal, H.S.; Saxena, A.K. Endophytic microbes: Biodiversity, plant growth-promoting mechanisms and potential applications for agricultural sustainability. Antonie Van Leeuwenhoek 2020, 113, 1075–1107. [Google Scholar] [CrossRef] [PubMed]
  51. Crous, P.W.; Wingfield, M.J.; Cheewangkoon, R.; Carnegie, A.J.; Burgess, T.I.; Summerell, B.A.; Edwards, J.; Taylor, P.W.J.; Groenewald, J.Z. Foliar pathogens of eucalypts. Stud. Mycol. 2019, 94, 125–298. [Google Scholar] [CrossRef]
  52. Li, Z.; Santos, R.F.D.; Gao, L.; Chang, P.; Wang, X. Current status and future prospects of grapevine anthracnose caused by Elsinoë ampelina: An important disease in humid grape-growing regions. Mol. Plant Pathol. 2021, 22, 899–910. [Google Scholar] [CrossRef]
  53. Lederson, G.B.; Romina, G. Genome Sequence Resource of the Avocado Scab Pathogen Elsinoë perseae. Microbiol. Resour. Announc. 2023, 12, e00190-23. [Google Scholar] [CrossRef]
  54. Chung, K.R. Elsinoë fawcettii and Elsinoë australis: The fungal pathogens causing citrus scab. Mol. Plant Pathol. 2011, 12, 123–135. [Google Scholar] [CrossRef] [PubMed]
  55. Zhao, L.; Xiao, H.; Ma, X.; Cheng, Q. Elsinoë australis Causing Spot Anthracnose on Poplar in China. Plant Dis. 2020, 104, 2202–2209. [Google Scholar] [CrossRef]
  56. Termsung, N.; Cheewangkoon, R.; Kunasakdakul, K. First report of Septoria steviae causing stevia leaf spot in Thailand. J. Phytopathol. 2021, 12, 260–268. [Google Scholar] [CrossRef]
  57. Na, Y.E.; Choi, I.Y.; Abasova, L.; Shin, H.D. First report of leaf spot caused by Septoria erigerontis on Conyza sumatrensis in Korea. Plant Dis. 2023, 107, 561. [Google Scholar] [CrossRef]
  58. Aktan, Z.C.; Soylu, S.; Çiftçi, O.; Türkölmez, Ş. First report of root rot caused by Ceratobasidium sp. on sweet almond in Turkey. J. Plant Pathol. 2019, 102, 241–242. [Google Scholar] [CrossRef]
  59. Baiswar, P.; Ngachan, S.V. First Report of Root and Collar Rot of Strawberry (Fragaria × ananassa) Caused by Ceratobasidium sp. AG-B(o) (Binucleate Rhizoctonia) in India. Plant Dis. 2017, 102, 1035. [Google Scholar] [CrossRef]
Figure 1. (A) Healthy stems and leaves. (B) Infected stems and leaves of sweetpotato plants with scab disease (picked at the Baiyun Experimental Base in Guangdong, China).
Agronomy 13 02965 g001
Figure 2. Dilution curve analysis: (A) fungi and (B) bacteria. Dilution curves for gene reads with 97% sequence similarity based on operational taxonomic units (OTUs). The horizontal coordinate represents the amount of randomly selected sequencing data, and the vertical coordinate represents the number of species observed.
Agronomy 13 02965 g002
Figure 3. (A) fungi and (C) bacteria: Chao, Shannon, and Heip index analyses; (B) fungi and (D) bacteria: PCoA. (A,C) Alpha-diversity analysis index of the intergroup difference test. This demonstrates the significant differences between the two selected sample groups, with the name of the group in the horizontal axes and the range of indices for each group in the vertical axes. (B,D) Principal component analysis (PCoA). The x-axis and the y-axis represent the two selected principal axes, and the percentage indicates the degree of explanation of the differences in the composition of the samples by the principal axes. Dots of different colors or shapes represent the samples in different groupings, and when the dots of the two samples are closer, the composition of the species in the two samples is more similar.
Agronomy 13 02965 g003
Figure 4. (A) fungi and (C) bacteria: partial least squares–discriminant analysis (PLS-DA); (B) fungi and (D) bacteria: Venn’s analysis. (A,C) Dots of different colors or shapes represent sample groups in different environments or conditions, and the scales on the x- and y-axes are relative distances with no practical significance. (B,D) Different colors represent different subgroups (or samples); overlapping numbers represent the number of species common to multiple subgroups, and non-overlapping numbers represent the number of species specific to the corresponding subgroups.
Agronomy 13 02965 g004
Figure 5. Column chart of species composition based on phyla and genera: (A) phylum of fungi, (B) genera of fungi, (C) phylum of bacteria, and (D) genera of bacteria. The horizontal coordinate is the name of the sample, and the vertical coordinate is the proportion of the species in that sample, with differently colored bars representing different species and the length of the bar representing the size of the proportion of that species.
Agronomy 13 02965 g005
Figure 6. Analysis of the relationship between fungi samples in different tissues. (Sphaceloma in the figure is replaced with Elsinoë in the text.) (A) Circos samples were plotted against species, and the relative sequence abundance (%) of the Circos endophytic fungi was analyzed at the genus level. The small half-circle (left half-circle) indicates the species composition in a sample, with the color of the outer ribbon representing the subgroup from which it comes, the color of the inner ribbon representing the species, and the length representing the relative abundance of that species in the corresponding sample. The large half-circle (right half-circle) indicates the proportion of distribution of a species in different samples at that taxonomic level, with the outer ribbon representing the species, the color of the inner ribbon representing the different subgroups, and the length representing the proportion of the distribution of the sample in a given species. (B) Non-standard multidimensional scaling (NMDS) analyses. Dots of different colors or shapes represent different groupings of samples, and the closer the dots of two samples, the more similar the species composition of the two samples. (C) Community heatmap analyses of operational taxonomic units (OTUs). The horizontal coordinate is the sample name, and the vertical coordinate is the species name. The change in the abundance of different species in the sample is shown by the color gradient of the color block, and the values represented by the color gradient are shown on the right side of the figure. (D) Community heatmap analyses of the genera.
Agronomy 13 02965 g006aAgronomy 13 02965 g006b
Figure 7. (A) Linear discriminant effect size (LefSe) analyses and statistical information on species abundance in random forests. (Sphaceloma in the figure is replaced with Elsinoë in the text.) Multi-level species dendrograms showing taxa that differ significantly across organizational communities. Different colors represent different taxa, and the classification of taxa at the genus, class, and operational taxonomic unit (OTU) levels is shown in order from the inside out. (B) Linear discriminant analysis (LDA) scores of different species. Species with higher than the estimated value were considered significantly different. The default score was 3.0. The length of the histograms represents the LDA scores, which show the degree of influence of the clusters that are significantly different. (C) Distribution and classification of random forest samples. Differently colored dots represent different groupings of samples, and closer dots indicate that the species composition of the two samples is more similar. (D) Statistical information on the abundance of species in random forests, species importance ranking plot, with the y-axis showing the importance measure (e.g., species) and the x-axis showing the importance measure/standard deviation value of the species. The y-axis corresponds to the name of the species after it has been ranked in order of importance.
Agronomy 13 02965 g007
Figure 8. Distribution of the heatmap community composition of the top 20 representative fungi at the genus level (A) and significance difference test between groups (B). (Sphaceloma in the figure is replaced with Elsinoë in the text.) (A) Colors on the left represent the phylum classification of the operational taxonomic units (OTUs), and on the right is the heatmap analysis of the abundance of the 20 fungal OTUs. (B) Significantly different species in different tissues of sweetpotato, with differently colored boxes representing different groups.
Agronomy 13 02965 g008
Figure 9. Analysis of operational taxonomic unit 87 (OTU87). (Sphaceloma in the figure is replaced with Elsinoë in the text). (A) Correlation network diagram of OTU87, (B) node connectivity statistics, (C) phylogenetic tree diagram, and (D) correlation distribution of OTU87 in each group (red indicates a positive correlation, and green indicates a negative correlation).
Agronomy 13 02965 g009
Disclaimer/Publisher’s Note: The statements, opinions and data contained in all publications are solely those of the individual author(s) and contributor(s) and not of MDPI and/or the editor(s). MDPI and/or the editor(s) disclaim responsibility for any injury to people or property resulting from any ideas, methods, instructions or products referred to in the content.

