Article

Detection of the Grassland Weed Phlomoides umbrosa Using Multi-Source Imagery and an Improved YOLOv8 Network

1
Key Laboratory of Oasis Agricultural Pest Management and Plant Protection Resources Utilization, College of Agriculture, Shihezi University, Shihezi 832003, China
2
College of Mechanical and Electrical Engineering, Shihezi University, Shihezi 832003, China
*
Authors to whom correspondence should be addressed.
These authors contributed equally to this work.
Agronomy 2023, 13(12), 3001; https://doi.org/10.3390/agronomy13123001
Submission received: 8 November 2023 / Revised: 29 November 2023 / Accepted: 4 December 2023 / Published: 6 December 2023

Abstract

:
Grasslands are the mainstay of terrestrial ecosystems and crucial ecological barriers, serving as the foundation for the development of grassland husbandry. However, the frequent occurrence of poisonous plants in grasslands weakens the stability of grassland ecosystems and constrains the growth of grassland livestock husbandry. To achieve early detection of the grassland weed Phlomoides umbrosa (Turcz.) Kamelin & Makhm, this study improves the YOLO-v8 model and proposes a BSS-YOLOv8 network model using UAV images. Using UAV, we can obtain early-stage image data of P. umbrosa and build a seedling dataset. To address challenges such as the complex grassland background and the dwarf seedlings of P. umbrosa, this study incorporated the BoTNet module into the backbone network of the YOLO-v8 model. Enhancing the integrity of feature extraction by linking global and local features through its multi-head self-attention mechanism (MHSA). Additionally, a detection layer was added in the model’s neck structure with an output feature map scale of 160 × 160 to further integrate P. umbrosa feature details from the shallow neural network, thereby strengthening the recognition of small target P. umbrosa. The use of GSConv, as a replacement for some standard convolutions, not only reduced model computational complexity but also further improved its detection performance. Ablation test results reveal that the BSS-YOLOv8 network model achieved a precision of 91.1%, a recall rate of 86.7%, an mAP50 of 92.6%, an F1-Score of 88.85%, and an mAP50:95 of 61.3% on the P. umbrosa seedling dataset. Compared with the baseline network, it demonstrated respective improvements of 2.5%, 3.8%, 3.4%, 3.19%, and 4.4%. When compared to other object detection models (YOLO-v5, Faster R-CNN, etc.), the BSS-YOLOv8 model similarly achieved the best detection performance. The BSS-YOLOv8 proposed in this study enables rapid identification of P. umbrosa seedlings in grassland backgrounds, holding significant importance for early detection and control of weeds in grasslands.

1. Introduction

Grassland is an important component of terrestrial ecosystems [1], serving as the three major sources of food for humans along with cultivated land and water bodies [2]. It is the basic means of production and a specific survival area for various rare wild animals and plants, and the people of pastoral areas rely on it for survival [3]. Serving as a crucial ecological barrier, grassland also has highly important ecological functions in water conservation, wind prevention and sand fixation, soil and water conservation, carbon fixation and nitrogen storage, climate regulation, and biodiversity maintenance [2,4,5,6,7]. However, in recent years, due to various factors such as human activities and climate change, the frequent occurrence of weeds disasters in grassland has weakened the stability and ecological service functions of grassland ecosystems, seriously affecting the development of grassland animal husbandry [8,9,10].
P. umbrosa is a perennial herbaceous plant of the Lamiaceae (Carl Linnaeus) family, not consumed by livestock. It is widely distributed in the grasslands of western China and competes with forage plants for living space, sunlight, and water resources [11]. Extensive outbreaks of P. umbrosa can lead to irreversible damage to grassland ecosystems. Early monitoring and control are crucial in preventing the spread of P. umbrosa. Currently, the investigation of weeds in grasslands still relies on manual field surveys conducted by professionals in grassland and plant protection [12]. However, the grassland area is vast and the terrain is complex. A traditional manual investigation is time-consuming and laborious [13], with small regional coverage, and it also has disadvantages such as poor representativeness, poor timeliness, and subjectivity [14]. Furthermore, large-scale manual surveys can also cause a certain level of disruption to grassland ecosystems. Consequently, accurately assessing and predicting the extent and severity of damage caused by weeds is challenging.
Unmanned aerial vehicle (UAV) remote sensing, with its low operational costs, high flexibility, rapid data acquisition, and extensive coverage, has been widely applied in various fields of precision agriculture [15], particularly showing unique advantages in plant growth monitoring. Jin and Liu et al. used UAV remote sensing to obtain plant images during the emergence stage of wheat and effectively monitored their density [16]. Kitano and Mendes, along with their team, obtained high-definition images of corn plants using UAV and RGB sensors, enabling the rapid identification and counting of field corn plants [17]. Bayraktar and Basarkan, along with their team, utilized UAV remote sensing to achieve the identification of several ornamental plant species [18]. Kattenborn and Eichel, together with their research team, accurately identified and segmented vegetation communities from high-resolution UAV images [19].
With the application of computer vision technology in agriculture, object detection methods based on deep learning have been widely studied and developed in the field of plant monitoring due to their strong learning ability and wide range of adaptation [20,21,22]. Currently, deep learning target detection algorithms can be divided into two categories: two stage and one stage [23]. The two-stage model, represented by R-CNN and Faster R-CNN, selects the target region in the input image first, and then identifies and locates the target in the candidate region [22]. Although it has advantages in high accuracy, large computational data and complex model structures require higher hardware and more time [24]. In contrast, the one-stage model can directly identify and locate objects within the image, which is less accurate but greatly improves detection speed, resulting in better real-time performance.
The YOLO (You Only Look Once) series, as representatives of the one-stage model, can achieve better detection results while maintaining detection speed through reasonable design and modifications to their network structure. They show great potential in the field of plant detection [25]. Chen and Wang et al. improved the yolov4 model by adding an SE attention mechanism to the network structure for detecting weeds in sesame fields and obtained 96.16% mAP, which can achieve accurate identification of weeds [26]. Wang and Cheng et al. constructed a yolov5s network integrating the CBAM attention mechanism for the invasive plant Solanum nigrum, and optimized the training process using multi-scale training methods. The precision and recall were significantly improved compared to yolov5s, which was helpful for early invasion monitoring of Solanum nigrum (linn) [27]. Zhang and Wang et al. achieved the identification and localization of weeds in wheat fields by combining UAV images with yolov3-tiny and converting pixel coordinates into positional coordinates [28]. Tsai, F. et al. achieved higher detection accuracy for tomato fruits by introducing the BotNet module into YOLOv5m [29]. Feng and Yu et al. substituted the standard convolution in the neck structure of YOLOv5s with GSConv and introduced the VoV-GSCSP module. They implemented the winter jujube detection based on the optimized YOLOv5s, achieving high accuracy in complex jujube orchard environments [30]. Yao and Qi et al. improved YOLOv5 by adding small target detection layers, achieving high-precision defect detection during the kiwi processing [31]. Li and Zhang et al., based on the YOLOv5 network, improved detection accuracy by adding small target detection layers and adjusting the number of target detection layers to filter out a multi-scale detection structure suitable for jujube, providing a reference for deploying automatic picking of flat jujubes in the field [32].
The YOLO series of models have achieved precise identification and positioning of crops and weeds, while UAV remote sensing can quickly and extensively obtain target image data. The combination of UAVs and YOLO provides a new approach for detecting large-scale weeds in grassland. The main focus of this study is to collect image data of P. umbrosa seedlings, and then establish an image dataset. In this study, based on the improvement and optimization of the original YOLOv8n, the BSS-YOLOv8 model is proposed to enhance the detection capability of P. umbrosa seedlings. The specific optimization details are as follows:
(1)
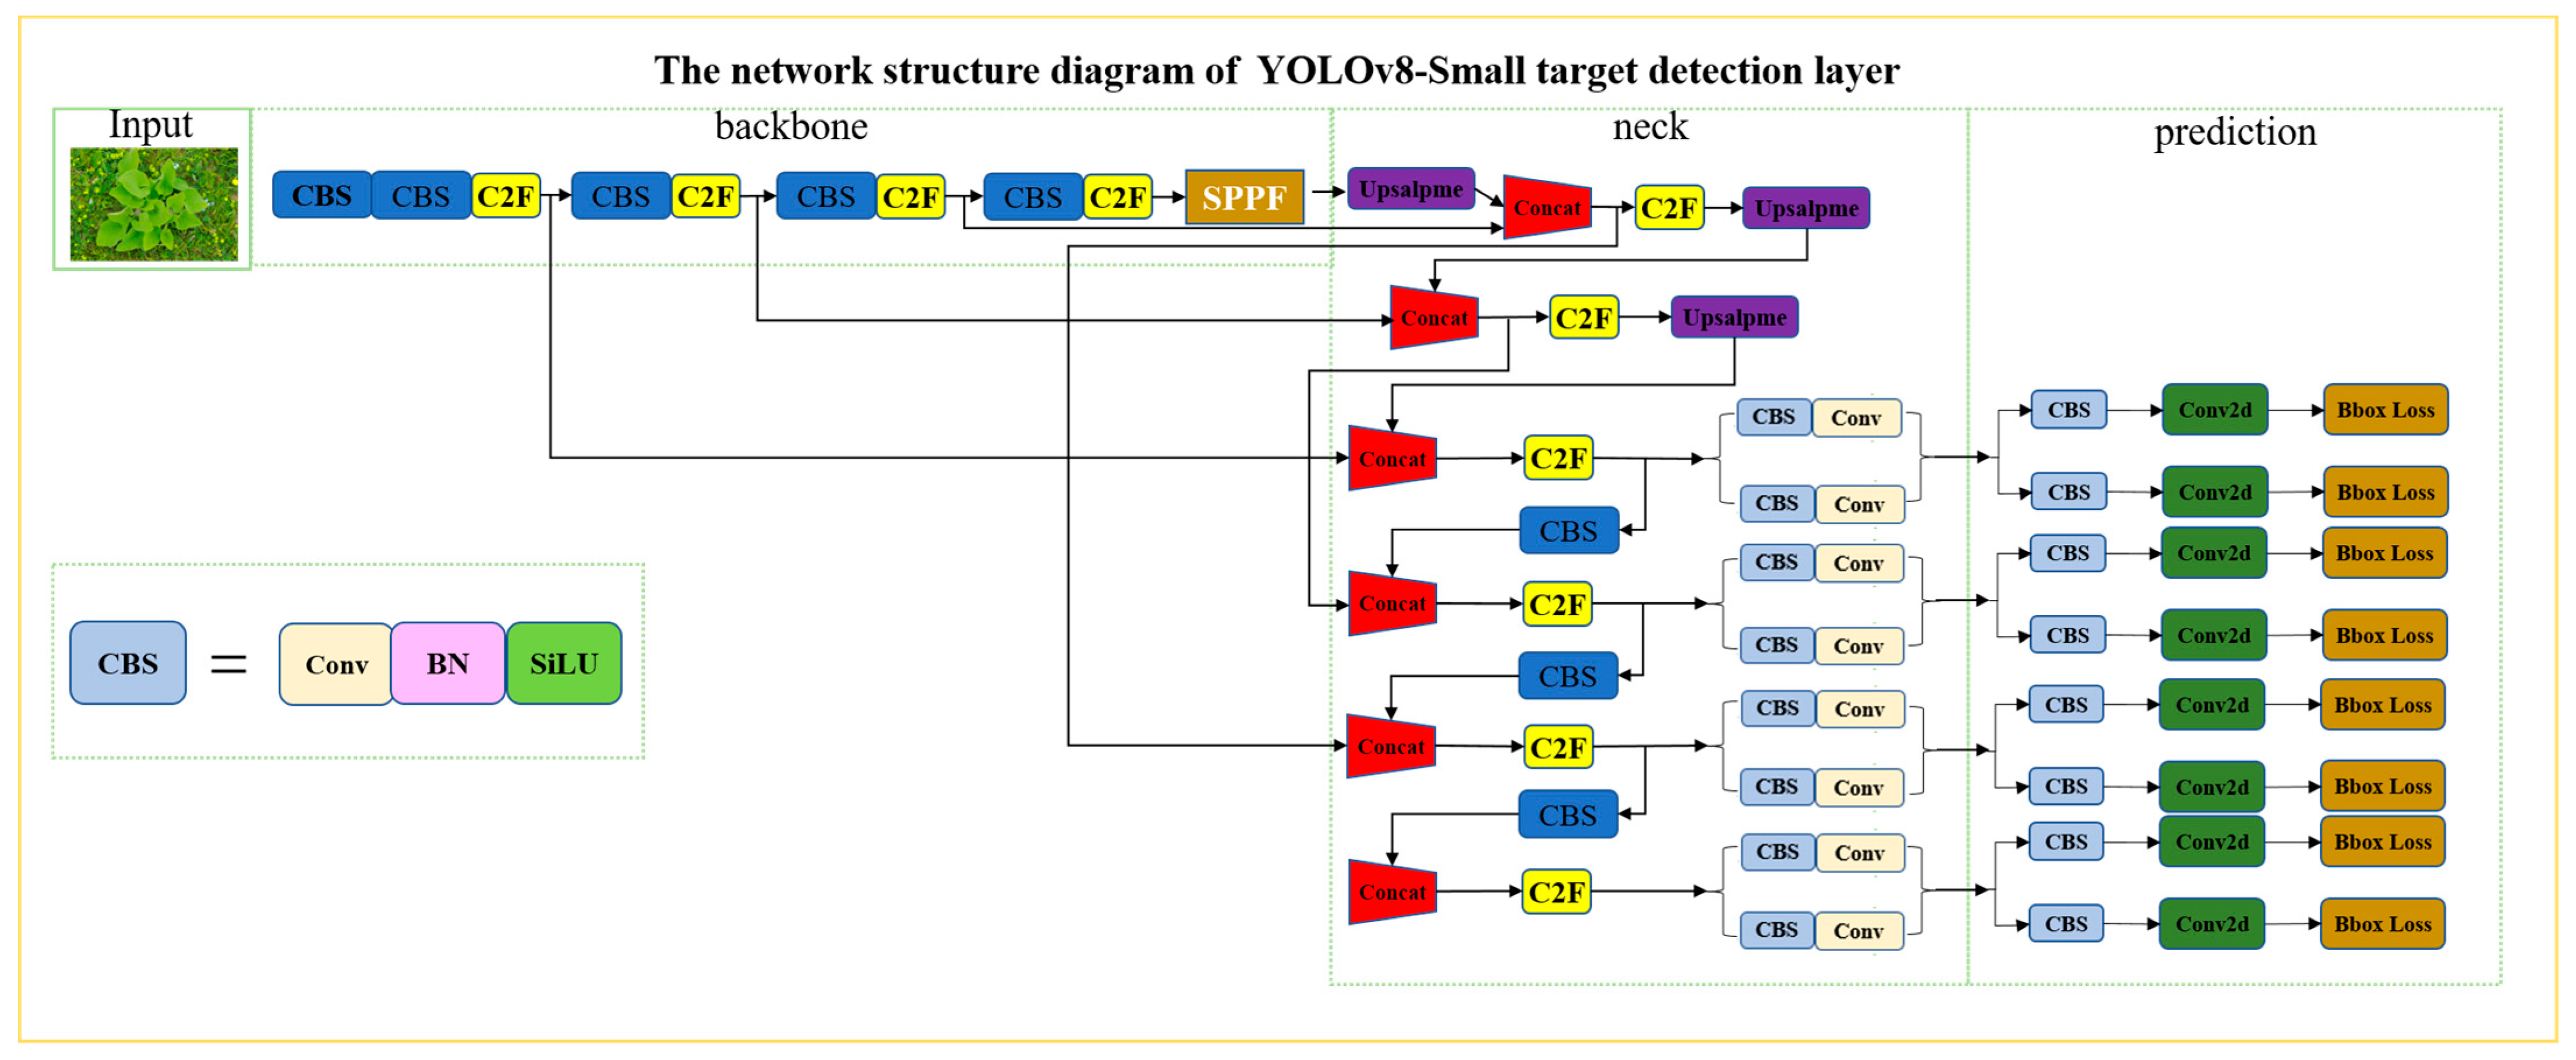
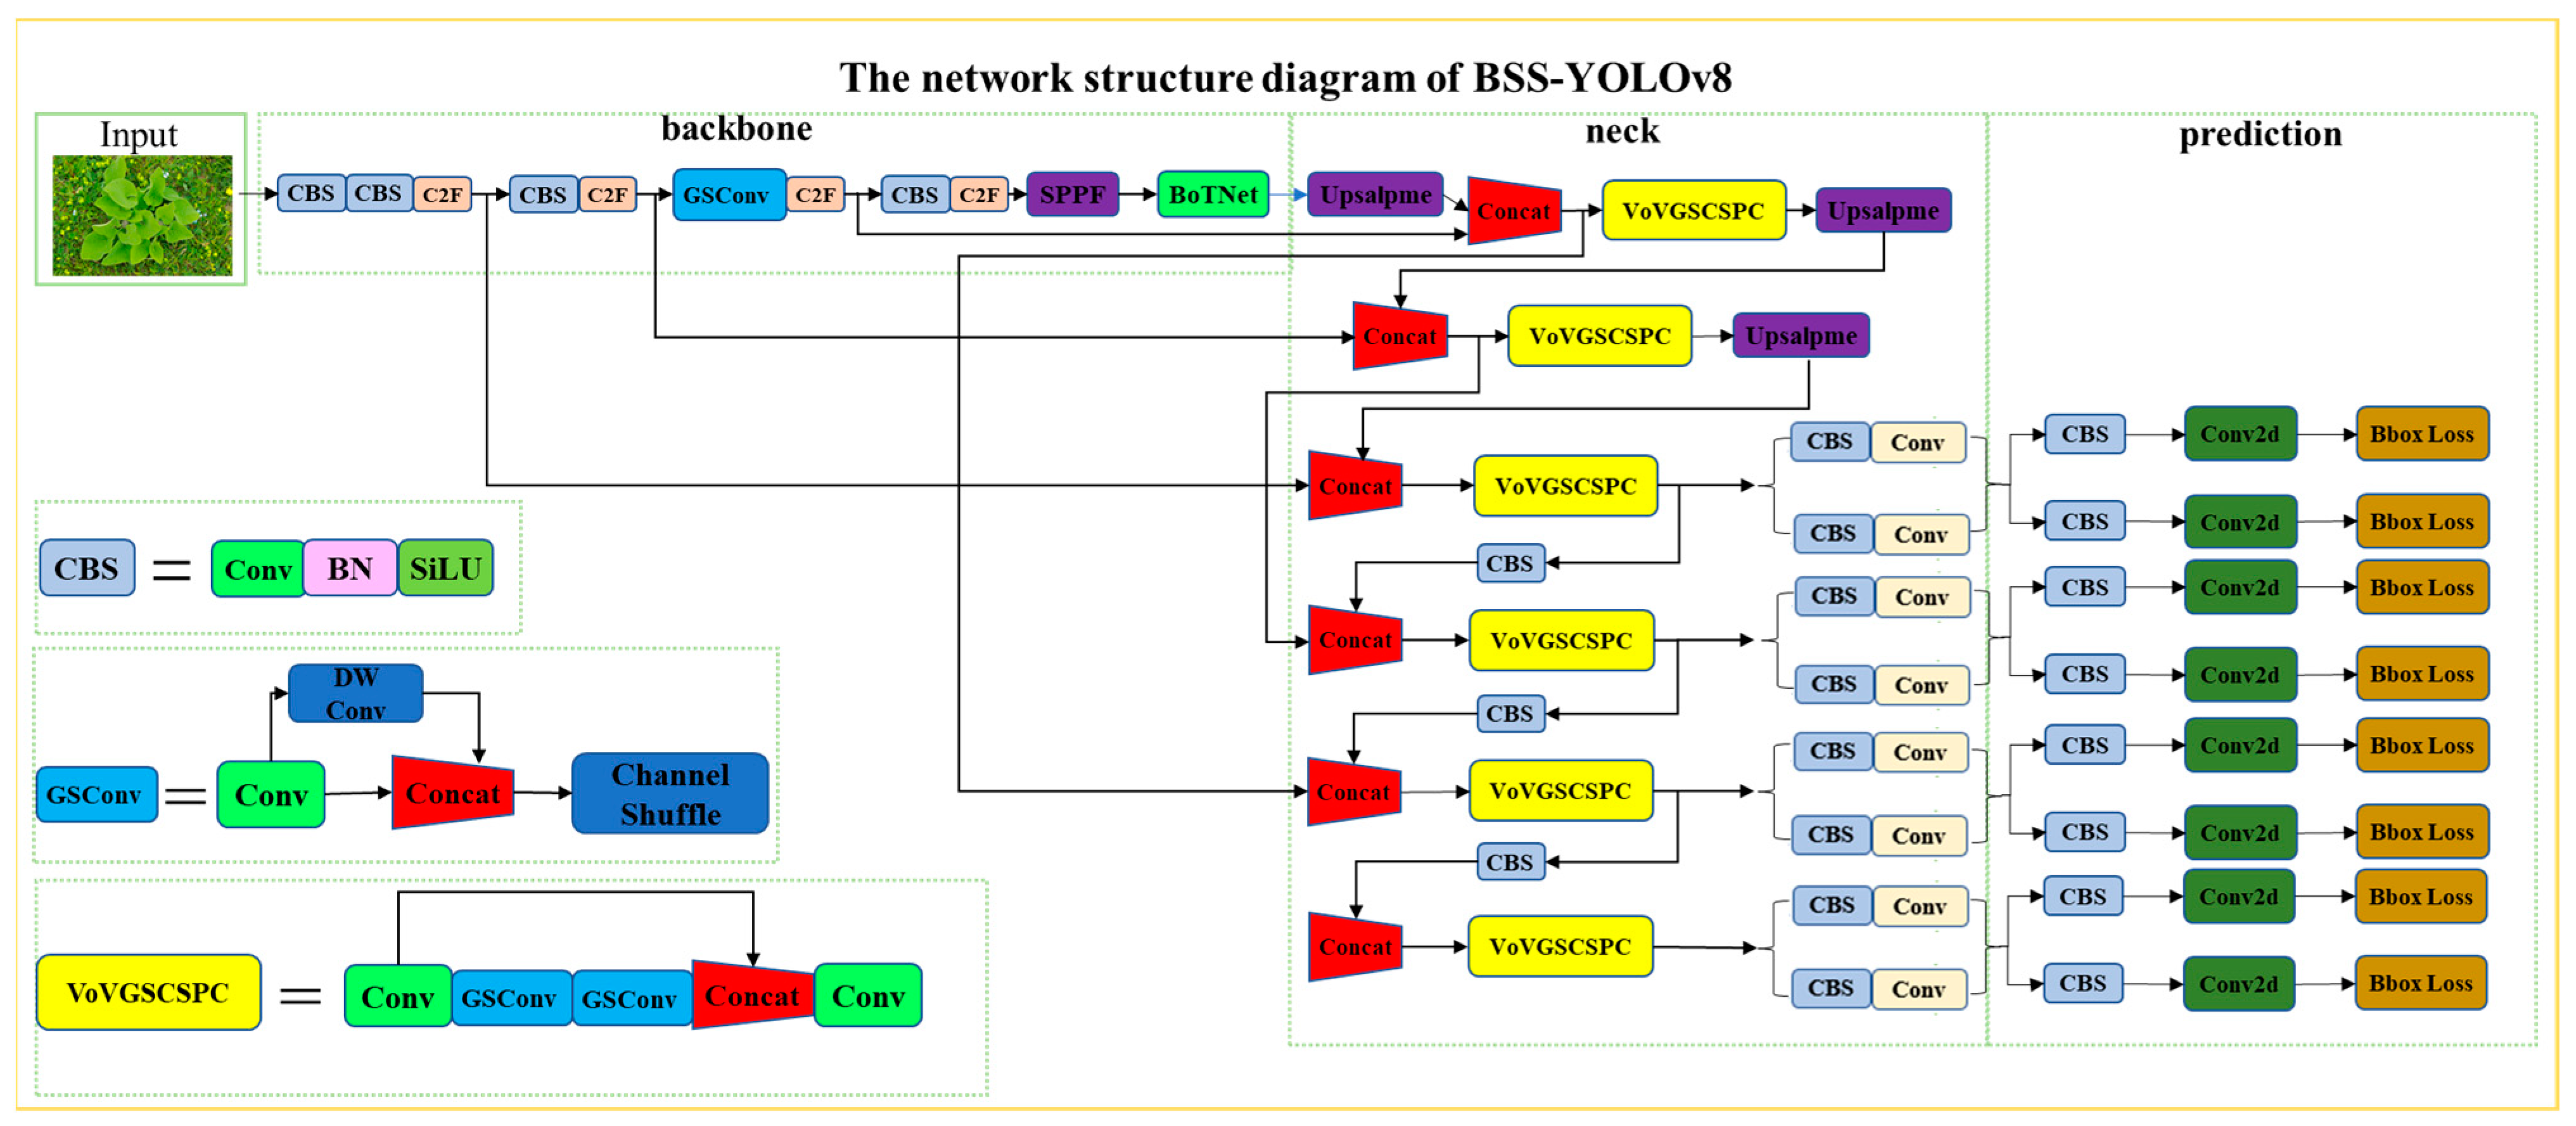
In the neck structure of YOLOv8n, an additional small target detection layer with an output feature map scale of 160 × 160 is added to extract the details and features of P. umbrosa through a multi-receptive field, reducing the loss of small target feature information.
(2)
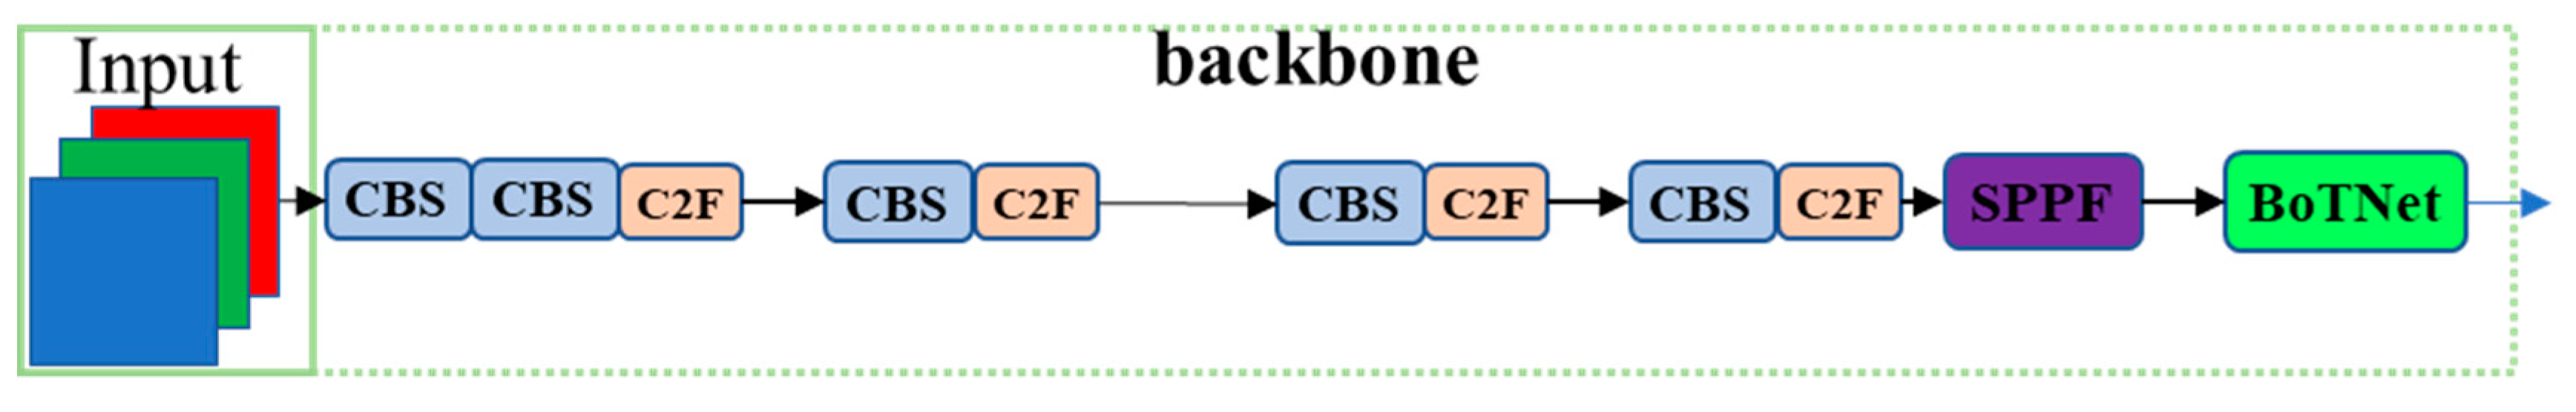
Introduce the BoTNet module into the backbone network of YOLOv8n, combining convolution operations and a multi-head self-attention mechanism (MHSA) to address both local and global features, enhancing the richness and completeness of feature extraction.
(3)
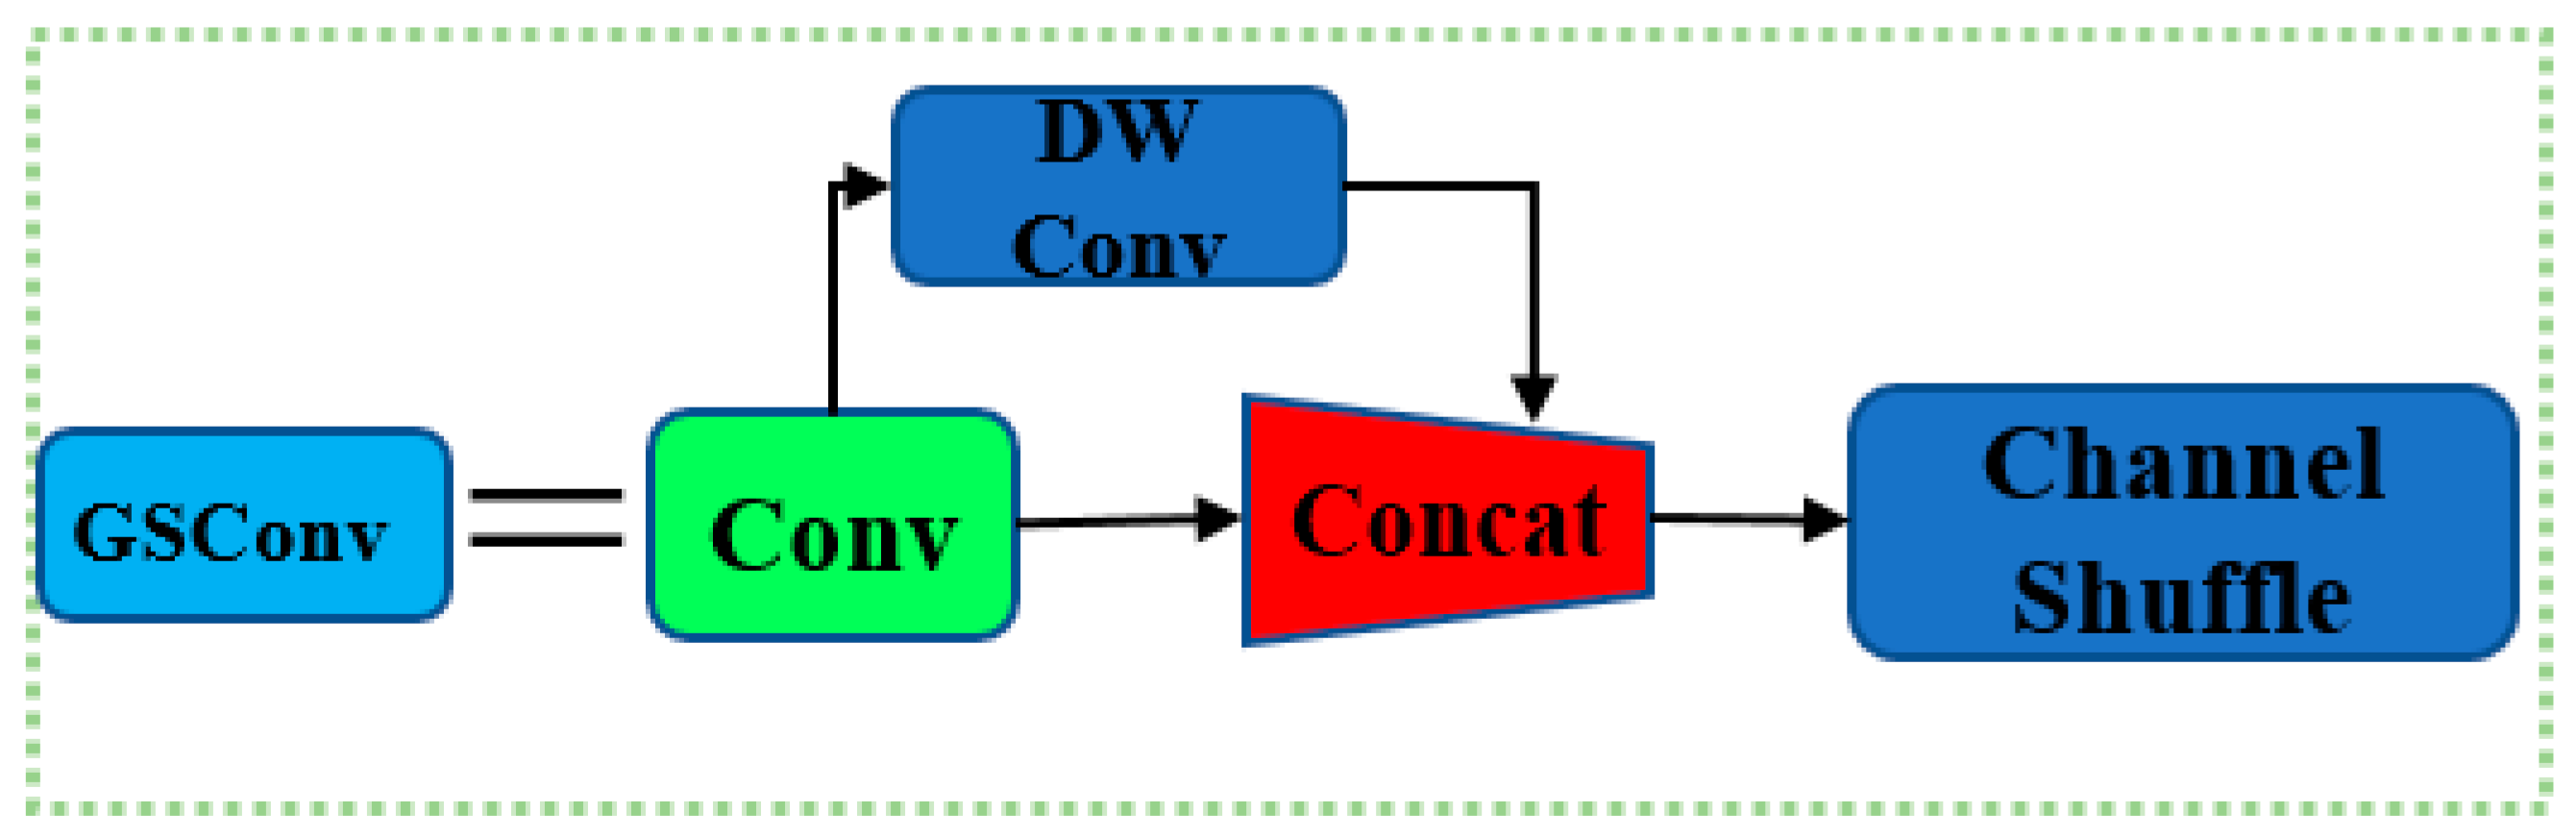
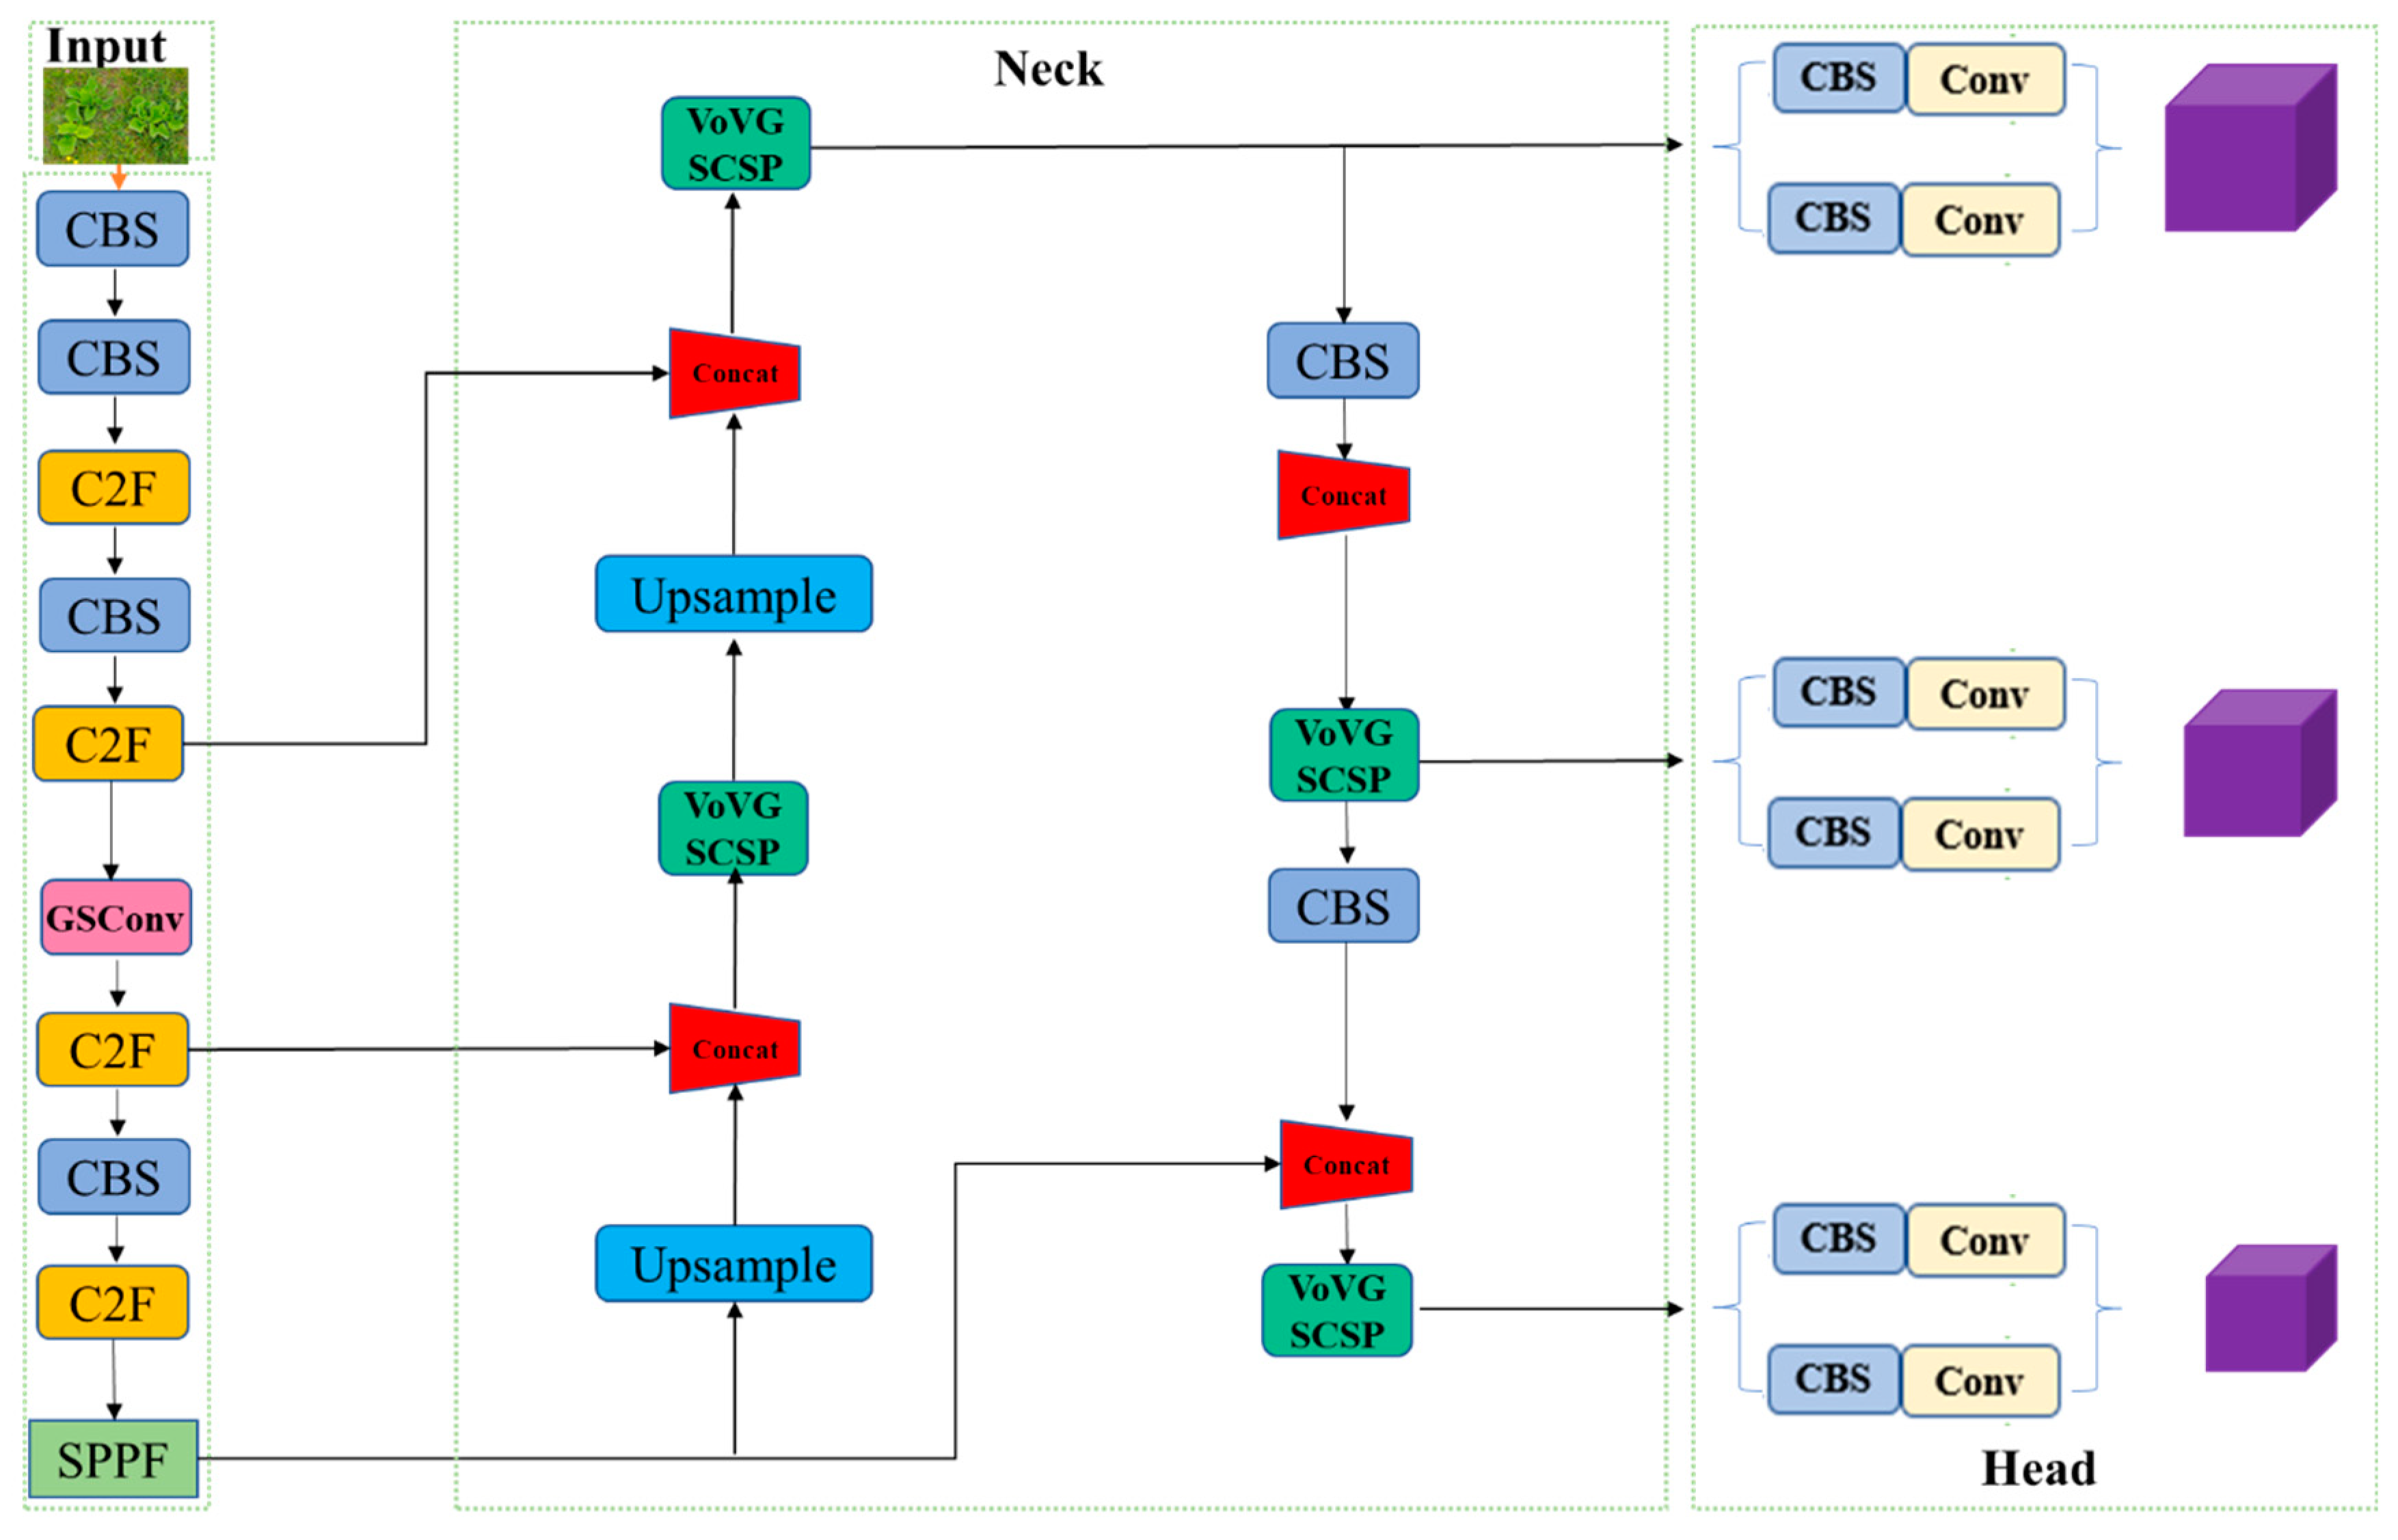
GSConv is integrated into the YOLOv8n network to replace some standard convolutions. By fusing feature information extracted from standard convolution and depth-separable convolution, the computational complexity of the model is reduced and the diversity of feature extraction is increased, thereby improving the detection accuracy of the model.

2. Materials and Methods

2.1. Image Collection and Dataset Construction

2.1.1. Study Area and Data Collection

The study area of this paper is the grassland under the jurisdiction of Shuanghe City, the Fifth Division of the Xinjiang Production and Construction Corps (44°21′–45°14′ N, 80°80′–83°41′ E), located in the western section of the northern Tianshan Mountains, in the western part of the Junggar Basin, in the hinterland of the Eurasian continent, with predominantly hilly terrain.
The study area belongs to a typical temperate continental climate, suitable for the growth of high-quality forage grass. Additionally, a grassland weed, P. umbrosa, is distributed here. Data collection took place in June 2023, during which the weed P. umbrosa, growing significantly faster than forage grass had entered the seedling stage and exhibited rapid growth, forming a preliminary scale, while the majority of forage grass remained in the germination state. To ensure data diversity, changes in light and overall environmental conditions were used as criteria for image collection. Different lighting conditions and various weather conditions for P. umbrosa seedlings were collected through aerial and ground photography at different times over five consecutive days, ensuring the universality of the images in the real world and the generalization ability of the model.
The aerial survey data of P. umbrosa were collected by a UAV (DJI Mavic 3, DJI, Shenzhen, China. see Table 1 for specific configurations) equipped with a Hasselblad camera (Hasselblad Group, Gothenburg, Sweden), following a pre-established route set within the grassland. The UAV’s flying altitude was set between 3.5 and 5 m, and the flight path was along a pre-set route, moving uniformly in a straight line with an overall “S” shape. The UAV can not only capture broader and more comprehensive environmental images, collecting more information on P. umbrosa but also have features such as fast image acquisition and high flexibility. The use of UAVs has provided more abundant data for scientific research, significantly improving work efficiency. To enhance sample diversity and improve the robustness of the convolutional network, this study also collected image data using smartphones and cameras. Both devices obtained vertical images of P. umbrosa from different heights, with smartphones at 1.0–1.5 m and cameras at 0.5 m. Compared with the UAV, smartphones, and cameras can capture more local information about P. umbrosa seedlings, providing more comprehensive detail features for scientific research. The sample images captured by the three types of devices are shown in Figure 1, and Table 2 provides the resolution of the sample images captured by each imaging device and the pixel proportion of P. umbrosa in the images.

2.1.2. Image Preprocessing and Dataset Construction

In this study, OpenCV (version 4.5.1) was used to process the P. umbrosa images captured by the UAV, with images of P. umbrosa extracted at intervals, specifically taking one image for every 60 frames. The opencv-processed images were integrated with images collected from other devices, resulting in a total of 2180 effective images captured at different times and scales. Out of these, 2032 images were captured by the UAV, while 60 and 88 images were, respectively, obtained by Smartphone and Canon EOS Kiss X10.
In the preliminary experiment, the inclusion of P. umbrosa seedlings with incomplete edges in the training data resulted in the model incorrectly identifying different branches of the same plant as multiple P. umbrosa seedlings. Therefore, Photoshop software (version 24.0.0) was used to check all images and trim the missing seedlings at the edges of the images to ensure that all seedlings in the subsequent images were in a complete state. Then, LabelImg software (version 1.8.6) was used to label the P. umbrosa seedlings in the images. Annotation is performed using the minimum bounding rectangle of the target, with the label marked as “P. umbrosa”. The annotation results are stored in YOLO standard format TXT files, including information such as category, center coordinates of the annotation box (proportional), width (proportional), and height (proportional). A total of 124,329 P. umbrosa instances of varying sizes were annotated. Finally, all images were divided into a training set, a validation set, and testing in the proportion 7:2:1 (images captured by the three devices were divided into dataset subsets while maintaining this ratio).

2.2. Construction of the BSS-YOLOv8 Network Model

2.2.1. YOLOv8 Network Model

YOLOv8, the latest algorithm in the YOLO series, comes from the same design team as YOLOv5. Building upon the success of the previous version, YOLOv5, YOLOv8 has undergone new improvements and introduced new features [33]. The network structure of YOLOv8 is shown in Figure 2.
The main purpose of the input terminal is to preprocess images, including reducing or enlarging the image to the size specified by YOLOv8 training, 640 × 640, and enhancing the image data through Mosaic and other methods to achieve better training effects. Unlike yolov5, the YOLOX training strategy has introduced the operation of turning off Mosiac enhancement in the last 10 epochs [34], further improving the training efficiency of the model.
The skeleton network of YOLOv8 still follows the idea of CSP (CSPParkNet-53) [35]. After downsampling the input features 5 times, image features are sequentially obtained based on 5 different scales. Unlike YOLOv5, in YOLOv8, the C3 module is replaced by the C2f module. The traditional C3 module can only perform simple processing on adjacent BottleNeck structures, and the extracted features contain limited between the upper and lower layers information, making it unable to transfer and extract features across layers. The design of the C2f module references the C3 module and the ELAN module in YOLOv7 [36], adding a series of cross-layer transfers, eliminating convolution operations in branches, and adding additional split operations. These operations enable YOLOv8 to obtain richer gradient flow information while maintaining lightweight The SPPF (Spatial Pyramid Pooling with Fusion) structure is added to the last layer of the YOLOv8 network’s backbone to concatenate the pooled outputs into a fixed-length feature vector, thereby achieving adaptive size output. Compared to SPP, the addition of SPPF improves the detection ability of YOLOv8 for occluded, blurred, and small targets.
YOLOv8’s neck section still adopts a combination of FPN and PAN structure for multi-scale fusion of image features. The FPN structure performs upsampling from top to bottom [37], while the PAN structure performs downsampling from bottom to top [38]. The bidirectional fusion of the two achieves complementary positional and semantic information, allowing feature maps of different sizes to contain both image semantic and image feature information, greatly enriching the integrity of features and improving the accuracy of detecting images of different sizes. Unlike in the past, YOLOv8 does not continue to use the convolutional structure in the PAN-FPN upsampling stage, which to some extent ensures the lightweight and efficient performance of the model.
The Head section adopts the current mainstream Decoupled Head structure to separate the classification head and detection head. Decoupled Head designs different independent detectors for different scales, each consisting of a convolutional and fully connected layer, for target classification and predictive bounding box regression at that scale. The binary cross entropy loss (BCE loss) is used for target classification tasks while referencing the asymmetric weighting operation of VFL [39]. For the prediction boundary box regression task, Bbox Loss is used to measure the loss function, which includes CIoU and DFL.YOLOv8 abandons the previous Anchor-based method and instead uses the Anchor-free method to determine positive and negative samples in a more concise and efficient way.
For the convenience of users in different scenarios to test the balance between speed and accuracy, the YOLOv8 series provides 5 different size models for users to choose from, including YOLOv8n, YOLOv8s, YOLOv8m, YOLOv8l, and YOLOv8x. Compared with other models, YOLOv8n is more lightweight and easy to deploy on site. Therefore, this study chose YOLOv8n as the baseline network.

2.2.2. YOLOv8-BoTNet

BoTNet (Bottleneck Transformers) is a backbone architecture proposed by Aravind Srinivas [40]. It combines convolutional neural networks and self-attention mechanisms, having powerful capabilities in computer vision tasks. As shown in Figure 3, the last three convolutional layers of ResNet are replaced with multi-head self-attention modules (MHSA). YOLOv8 employs a convolutional neural network (CNN) as the backbone for feature extraction. Translation invariance and locality are two inherent properties of convolutional neural networks [41], which lead to the lack of global and long-distance modeling capabilities in the YOLOv8 model. By introducing the BoTNet module, the YOLOv8 model can form a CNN + TransFormer architecture, taking into account both local and global features, which helps to extract richer, more representative, and discriminative features, especially in images containing small targets and complex backgrounds. The addition of a multi-head self-attention mechanism (MHSA) allows the model to capture broader contextual information around the target, increases receptive fields, and effectively processes targets at different scales and backgrounds, improving the robustness of the model.
In this study, the BoTNet module is introduced into the YOLOv8n backbone network, as shown in Figure 4. The BoTNet module is inserted after the SPPF layer. By incorporating the multi-head self-attention mechanism (MHSA) to introduce global dependencies, the model’s ability to extract features of P. umbrosa of different sizes in the complex grassland background is strengthened. The integration of local and global features enriches the completeness of P. umbrosa feature extraction, effectively enhancing the model’s detection accuracy.

2.2.3. YOLOv8-GSConv

In order to better apply in mobile places and meet the real-time requirements of object detection, the standard convolution (SC) in network structures is usually replaced by deep separable convolution (DSC). However, deep separable convolution (DSC) is prone to losing some semantic information during spatial dimension compression and channel expansion of feature maps, resulting in poor feature extraction ability for targets. The proposal of GSConv effectively solves this problem [42], and its structure is shown in Figure 5. Firstly, input a labeled convolution for downsampling, then use DWConv, and concatenate the output results of the two convolutions. Finally, perform the Shuffle operation by grouping the feature maps on the channel dimension, interleaving and rearranging the corresponding channels of the two convolutional outputs, to fuse the feature information generated by standard convolution and deep separable convolution [43], increase the diversity and richness of feature extraction, reduce computational complexity, and improve the model’s generalization ability.
This study not only uses GSConv to replace some standard convolutions, but also introduces a one-time aggregation method to design a cross-level partial network (GSCSP) module, VoV-GSCSP. By selecting global contextual information through cross-stage network connections, the model’s feature extraction ability is further improved. The model improvement details are shown in Figure 6. The flexible combination of GSConv and VoV-GSCSP can effectively improve the model’s ability to detect rough edges.

2.2.4. YOLOv8- Small Target Detection Layer

In the neck structure of the YOLOv8 network, a three-layer scale feature map design is employed. After feature fusion, three different feature maps with scales of 80 × 80, 40 × 40, and 20 × 20 are output for detecting targets at 8 × 8, 16 × 16, and 32 × 32, respectively. The larger-scale feature map has a smaller receptive field and contains more target locations and local feature details, making it suitable for detecting small targets [44]. Conversely, the smaller-scale feature map has a larger receptive field and rich semantic information, but less distinct local details, making it suitable for detecting large targets. However, the P. umbrosa seedlings are small and the grassland background is complex, especially when using UAV as image acquisition devices. There are many small and densely distributed seedlings in the images. The YOLOv8 network’s largest feature map is 80 × 80, which may not adequately meet the requirements for detecting P. umbrosa seedlings.
In this study, a small target detection layer with an output feature map scale of 160 × 160 is added to the neck feature fusion stage of the YOLOv8n network to detect small P. umbrosa seedlings of 4 × 4 or larger. Details of the improvement can be found in Figure 7. The addition of the small target detection layer enables the YOLOv8n network to use a smaller receptive field for target detection. By narrowing the receptive field, the model can better capture the details and features of P. umbrosa seedlings. Furthermore, the small target detection layer improves the resolution of feature maps by increasing the number of convolution kernels and reducing their size, allowing for the capture of more fine-grained details of P. umbrosa. The construction of the small target detection layer allows YOLOv8n to utilize four different scale detection layers for feature fusion, effectively utilizing semantic information and fine-grained details from various levels, thereby reducing the risk of missing or misidentifying small target P. umbrosa seedlings and making the identification and positioning of pellagra seedlings more accurate.

2.2.5. BSS-YOLOv8 Network Model

In this study, we integrated the BoTNet, GSConv, and small target detection layer modules into the backbone and neck structure of the YOLOv8n network model, proposing the BSS-YOLOv8 model, as shown in Figure 8. The BSS-YOLOv8 model can comprehensively consider both global and local features, better capture broader contextual information surrounding the P. umbrosa seedlings, and improve the richness and diversity of P. umbrosa’s detailed features. Additionally, it leverages multi-receptive fields and multi-scale detection layers to improve the model’s robustness and generalization, delivering excellent detection performance even in the presence of small targets, and densely distributed targets.

2.3. Experimental Design

The network model training and testing tasks in this study are performed by a computer equipped with Intel(R) Xeon(R) Gold 6330 CPU (Intel Corporation, Santa Clara, CA, USA) and NVIDIA RTX 3090 GPU (NVIDIA Corporation, Santa Clara, CA, USA). The specific hardware configuration and operating environment are shown in Table 3. The model training process uses the initial parameters of YOLOv8n as the training weights, with a training iteration period of 100, a batch size of 8, and an input image size of 1138 × 640.
In order to evaluate the optimization effect of different introduction modules of the BSS-YOLOv8 model on the detection of P. umbrosa, eight sets of ablation experiments are conducted to validate the detection effect of the YOLOv8n baseline network, the network model with three separate modules added, the network model with three modules combined in pairs, and the BSS-YOLOv8 network model with three modules added simultaneously. Finally, the detection effectiveness of other mainstream models in the field of target detection on the dataset of P. umbrosa seedlings is also referenced, further verifying the effectiveness of the BSS-YOLOv8 network model optimization and the feasibility of early real-time detection of P. umbrosa.

2.4. Model Evaluation Metrics

In this study, Precision, Recall, mAP50 (mean average precision), mAP50:95, F1 score, and PR curve are used as comprehensive indicators to evaluate the performance of YOLOv8 and improved models.
Precision refers to the ratio of correctly identified P. umbrosa instances to all detected P. umbrosa instances, while recall represents the ratio of correctly identified P. umbrosa instances to all annotated P. umbrosa instances. The calculation formulas are as follows:
Precision = TP TP + FP
Recall = TP TP + FN
TP represents the number of accurate identifications of P. umbrosa seedlings detected by the YOLOv8 network model. FP represents the number of inaccurate identifications of P. umbrosa seedlings detected by the YOLOv8 network model.
AP, or Average Precision, is the average precision at different recall points and is represented by the area under the PR curve on the PR curve chart. The average of AP values for multiple categories is the mAP. A higher mAP value indicates a higher average accuracy of the model’s detection for each category. The calculation formulas are as follows:
AP = 0 1 Precision Recall d Recall
m A P = 1 N i = 1 N A P i
F1-score is a commonly used metric for evaluating classification problems. It is the harmonic mean of precision and recall, ranging from 0 to 1. The calculation formula is as follows:
F 1 - score = 2 × P r e c i s i o n × R e c a l l P r e c i s i o n + R e c a l l

3. Results

3.1. Improved BSS-YOLOv8 Object Detection Network

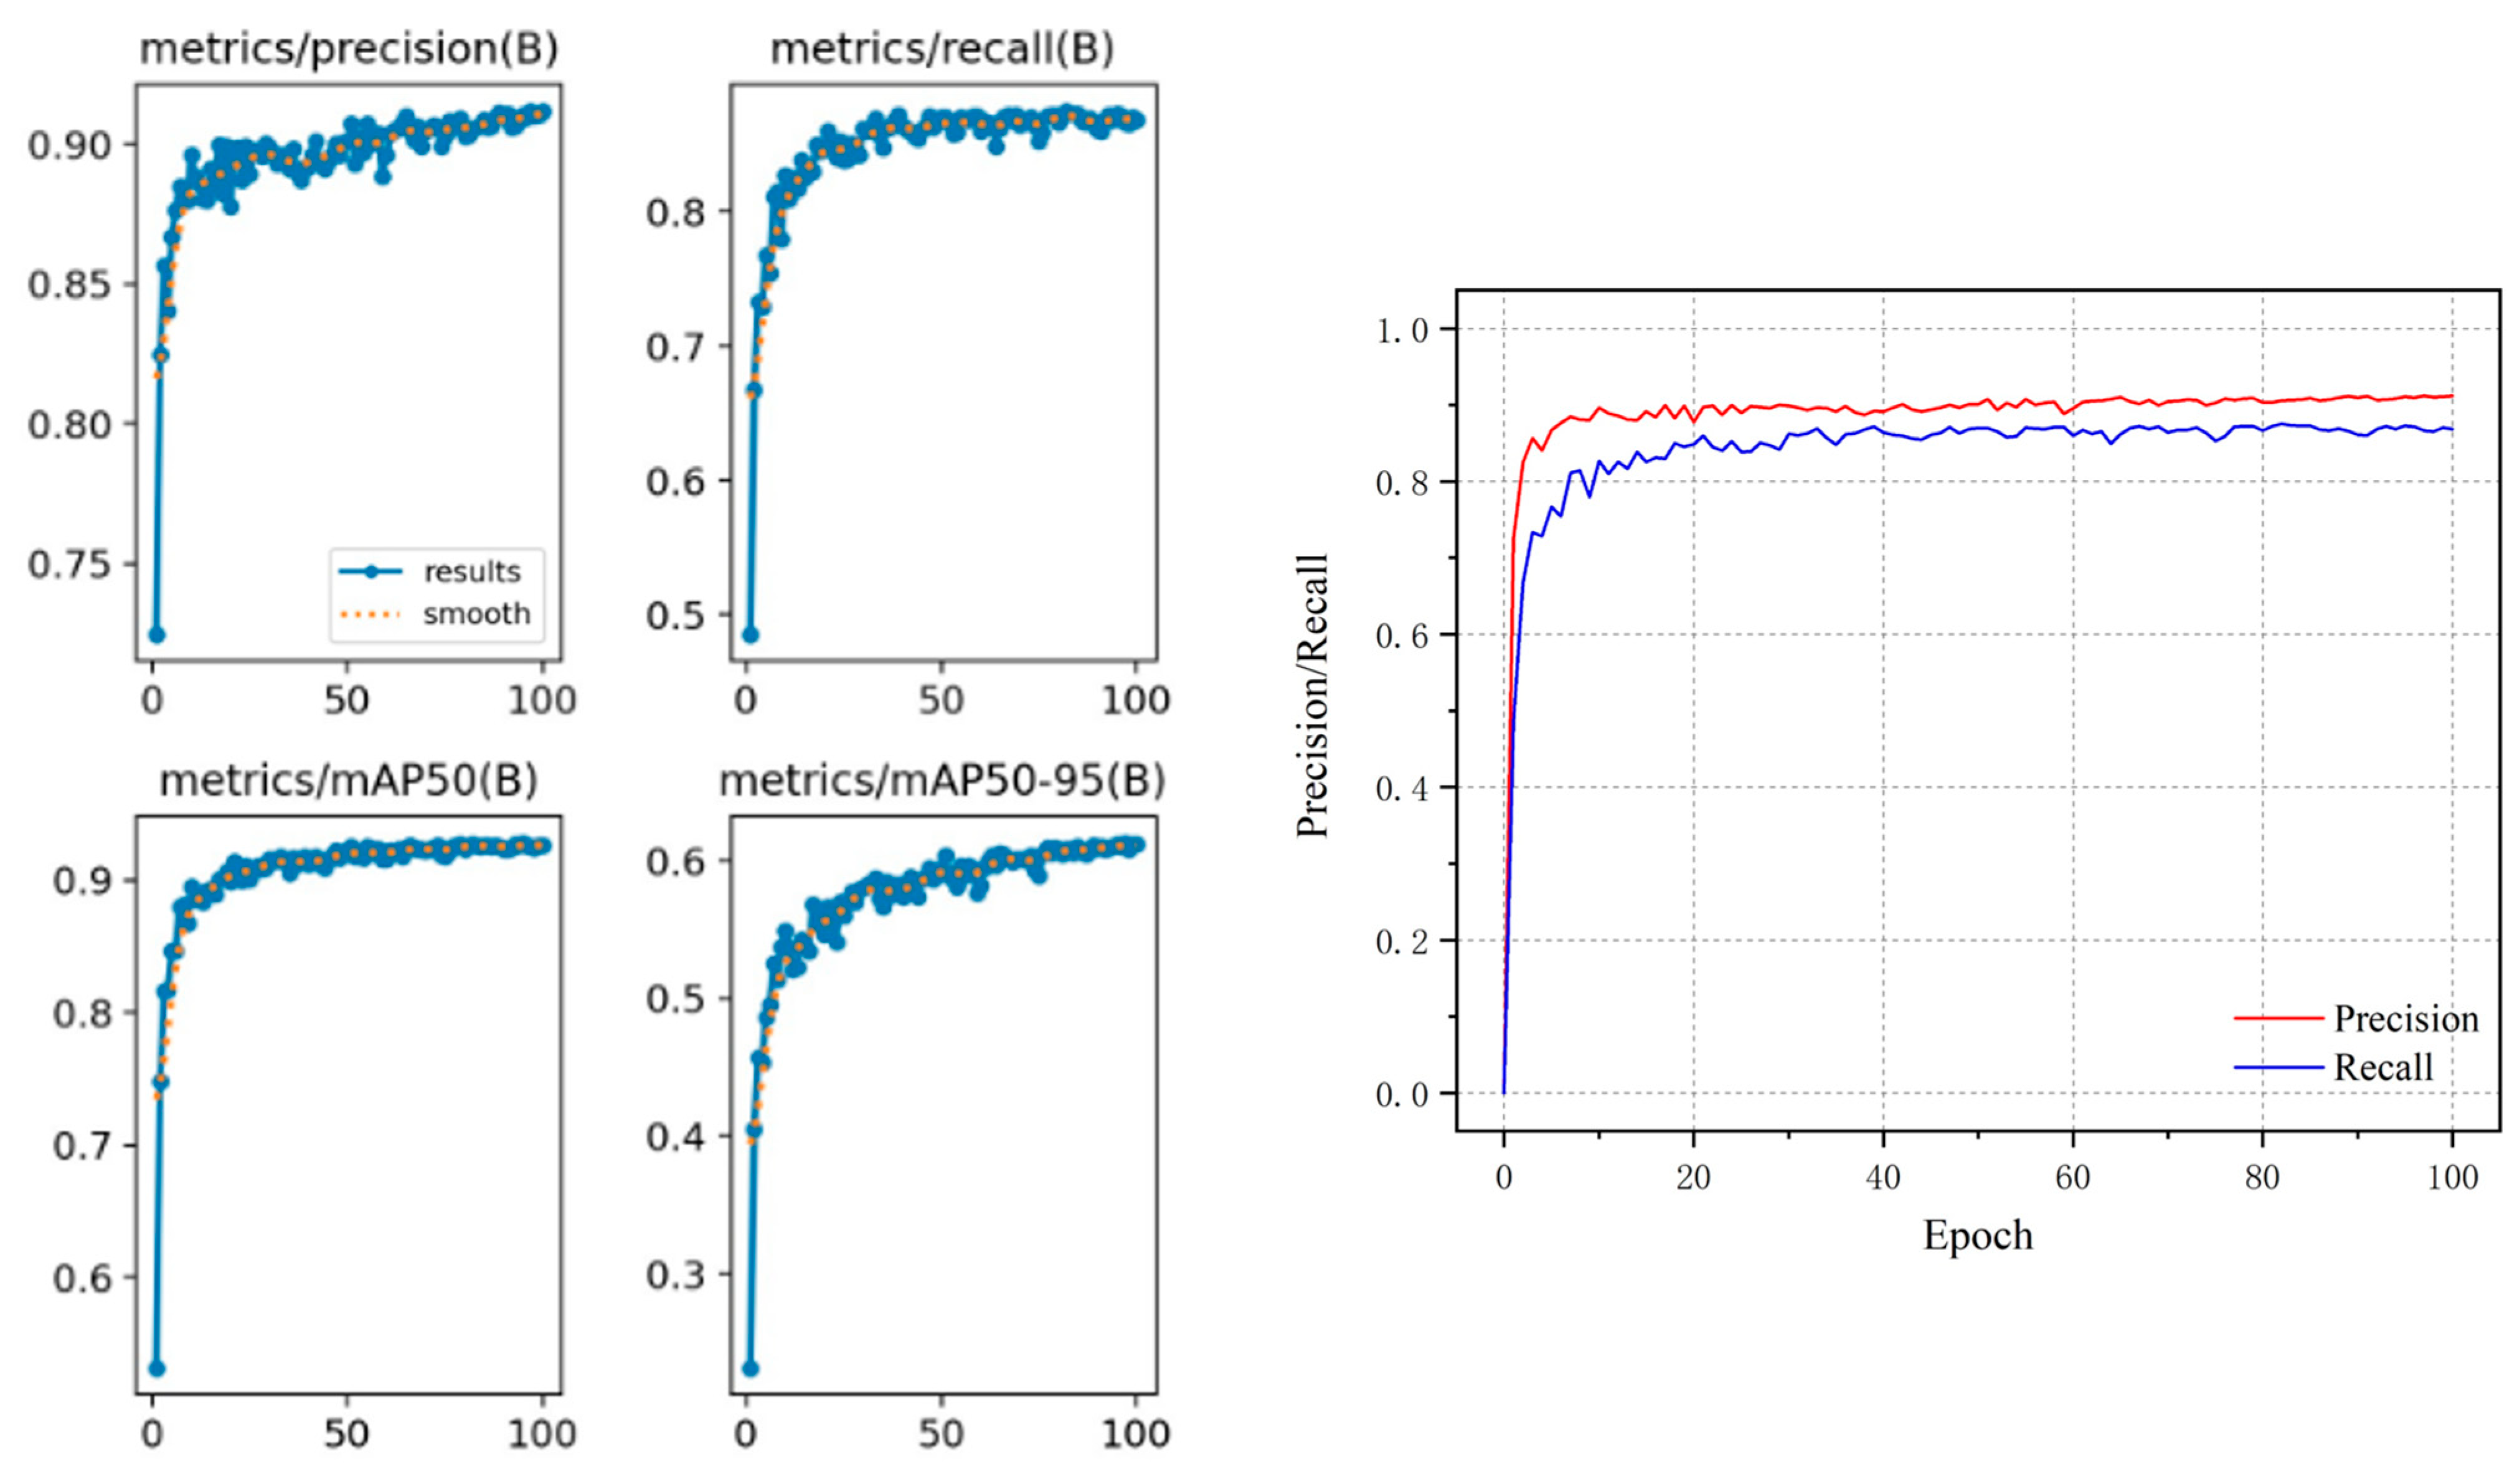
3.1.1. Loss Variations of BSS-YOLOv8

Figure 9 shows the loss curve changes of the BSS-YOLOv8 model proposed in this article in terms of classification loss, confidence loss, and localization loss on the rough seedling training set and validation set, in order to verify the convergence ability of the BSS-YOLOv8 model. Moreover, In Figure 10, we also show the precision, recall, and mAP curve of the BSS-YOLOv8 model as a function of the number of iterations. From Figure 10, it can be clearly seen that the loss trend of the BSS-YOLOv8 model, whether in the training set or the validation set, first rapidly decreases, then tends to flatten out and fluctuates within a small range. This indicates that the BSS-YOLOv8 model has good fitting ability for the detection of rough fringes, and there is no overfitting or underfitting phenomenon. The good performance of the BSS-YOLOv8 model can also be intuitively demonstrated in Figure 10: precision, recall, and mAP rapidly increase to a higher value with the increase in iteration times, then gradually increase slowly, and, finally, stabilize.

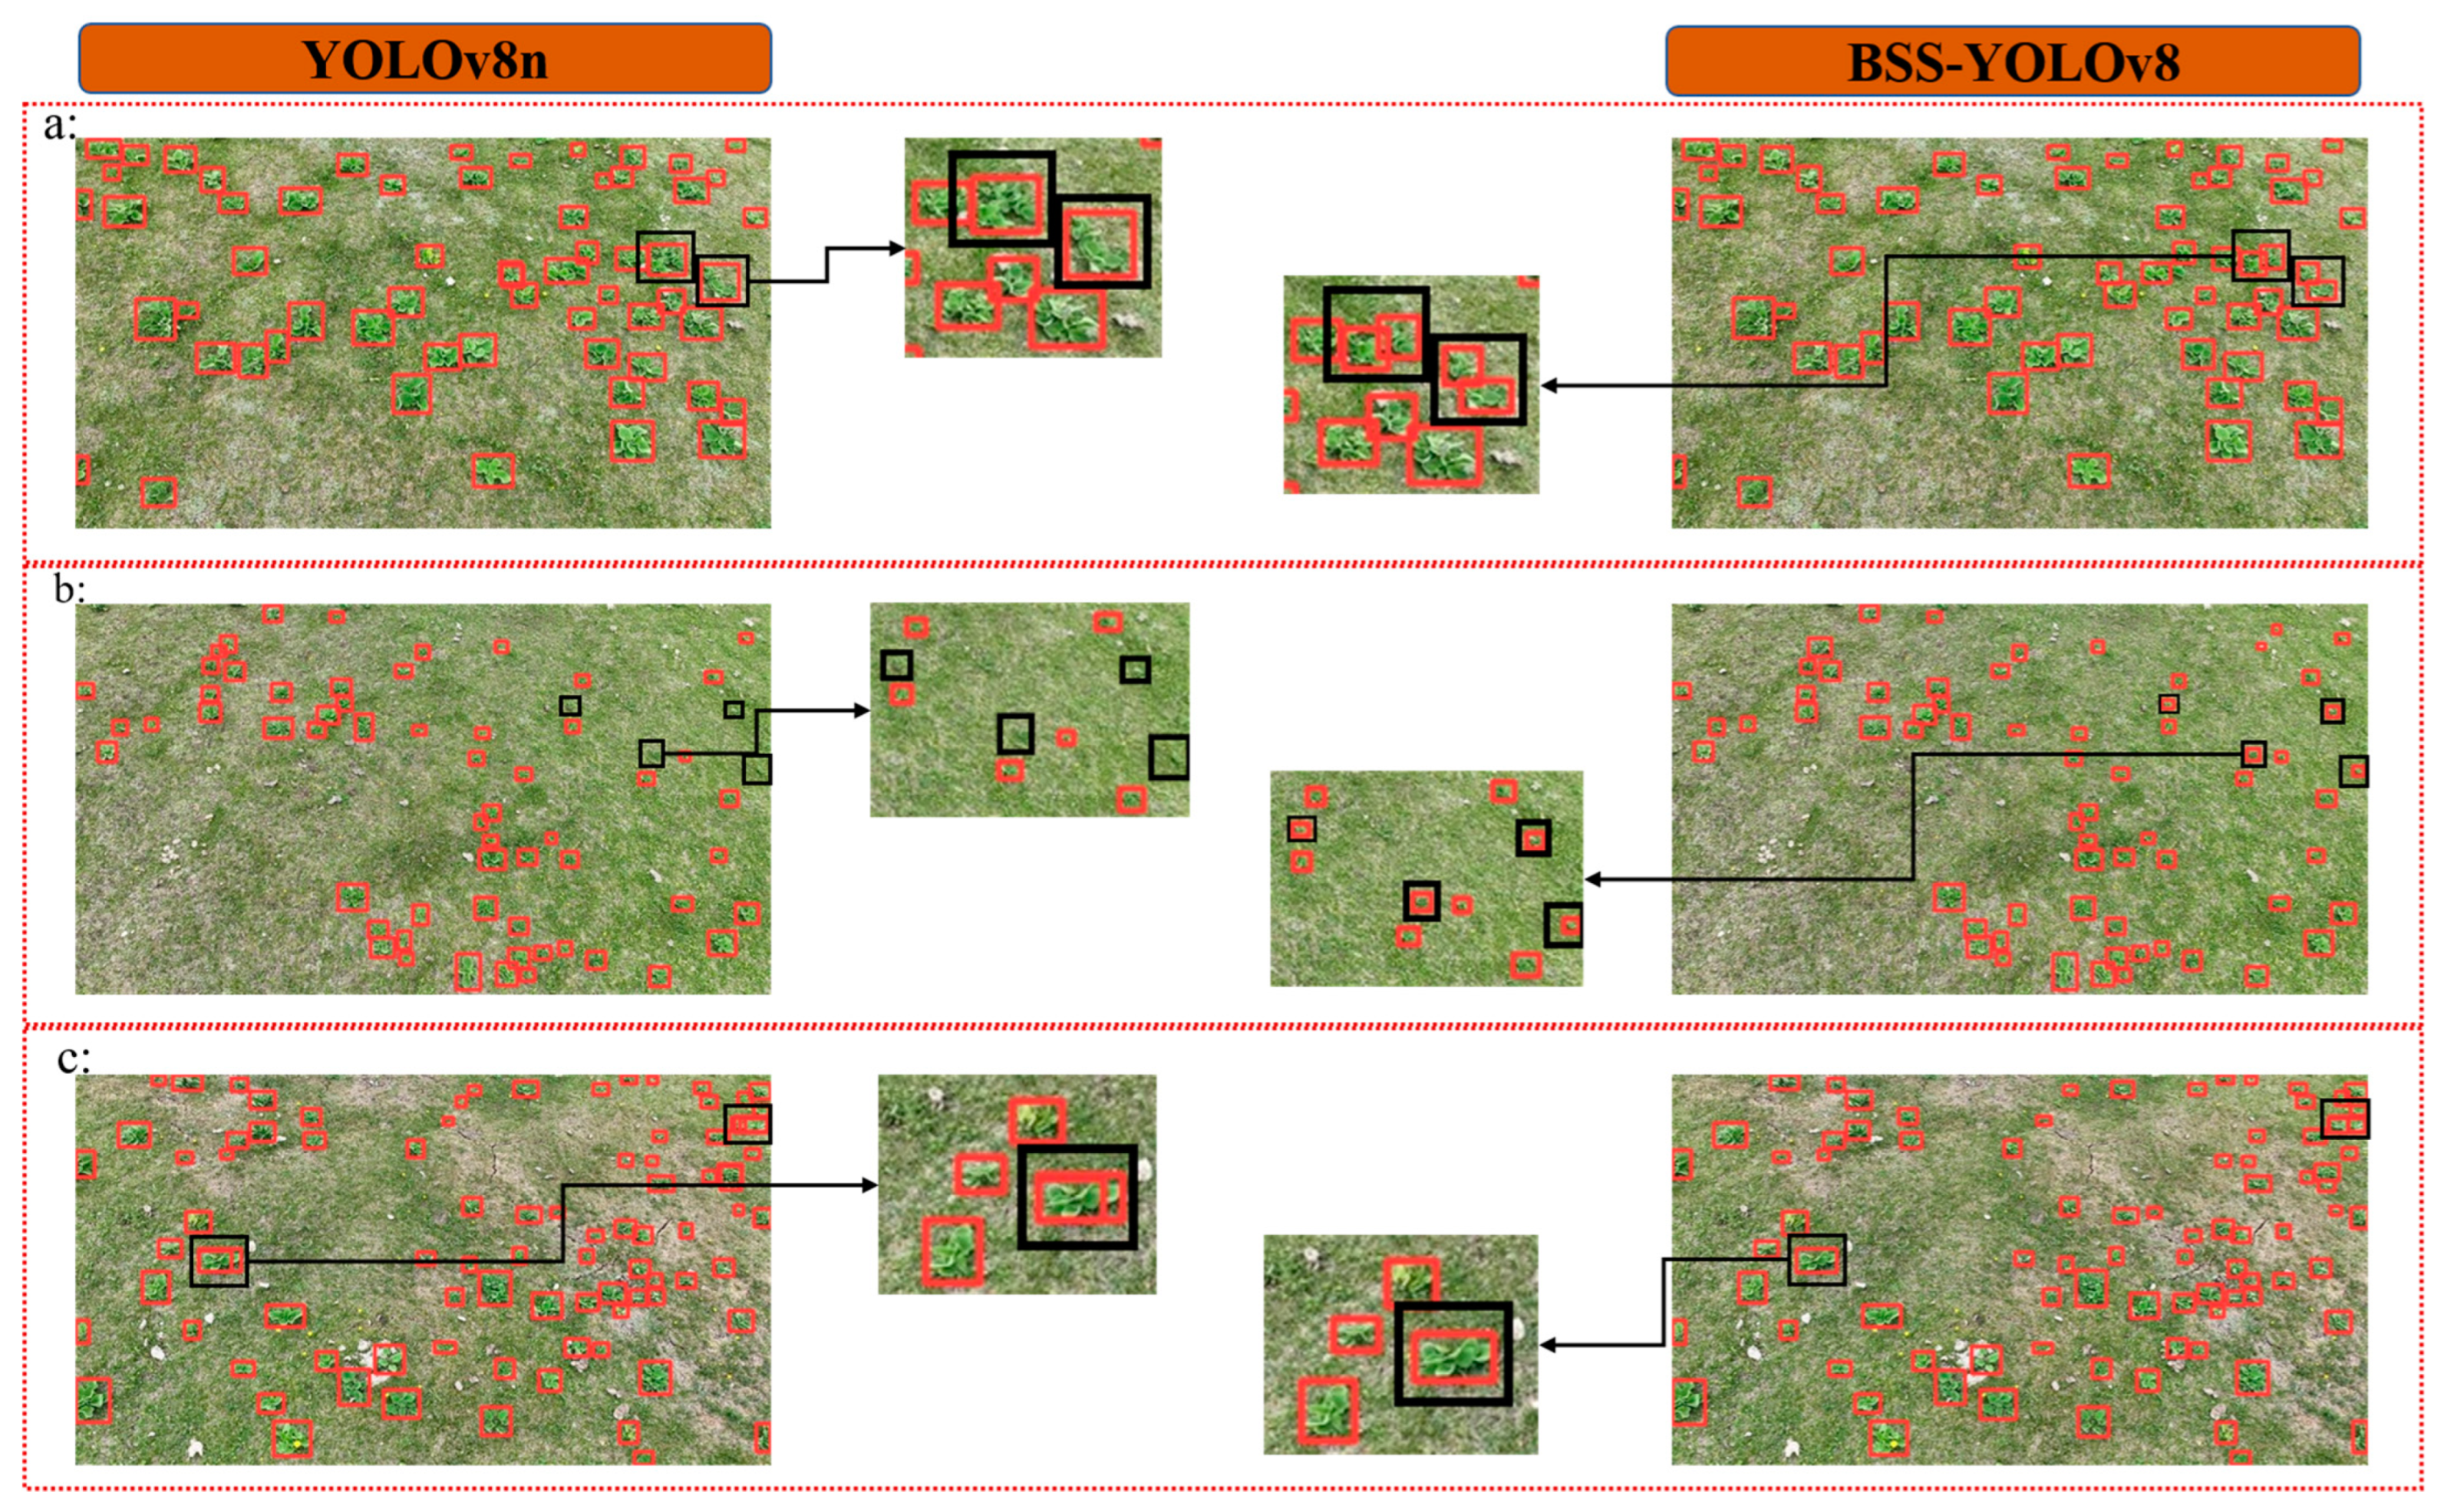
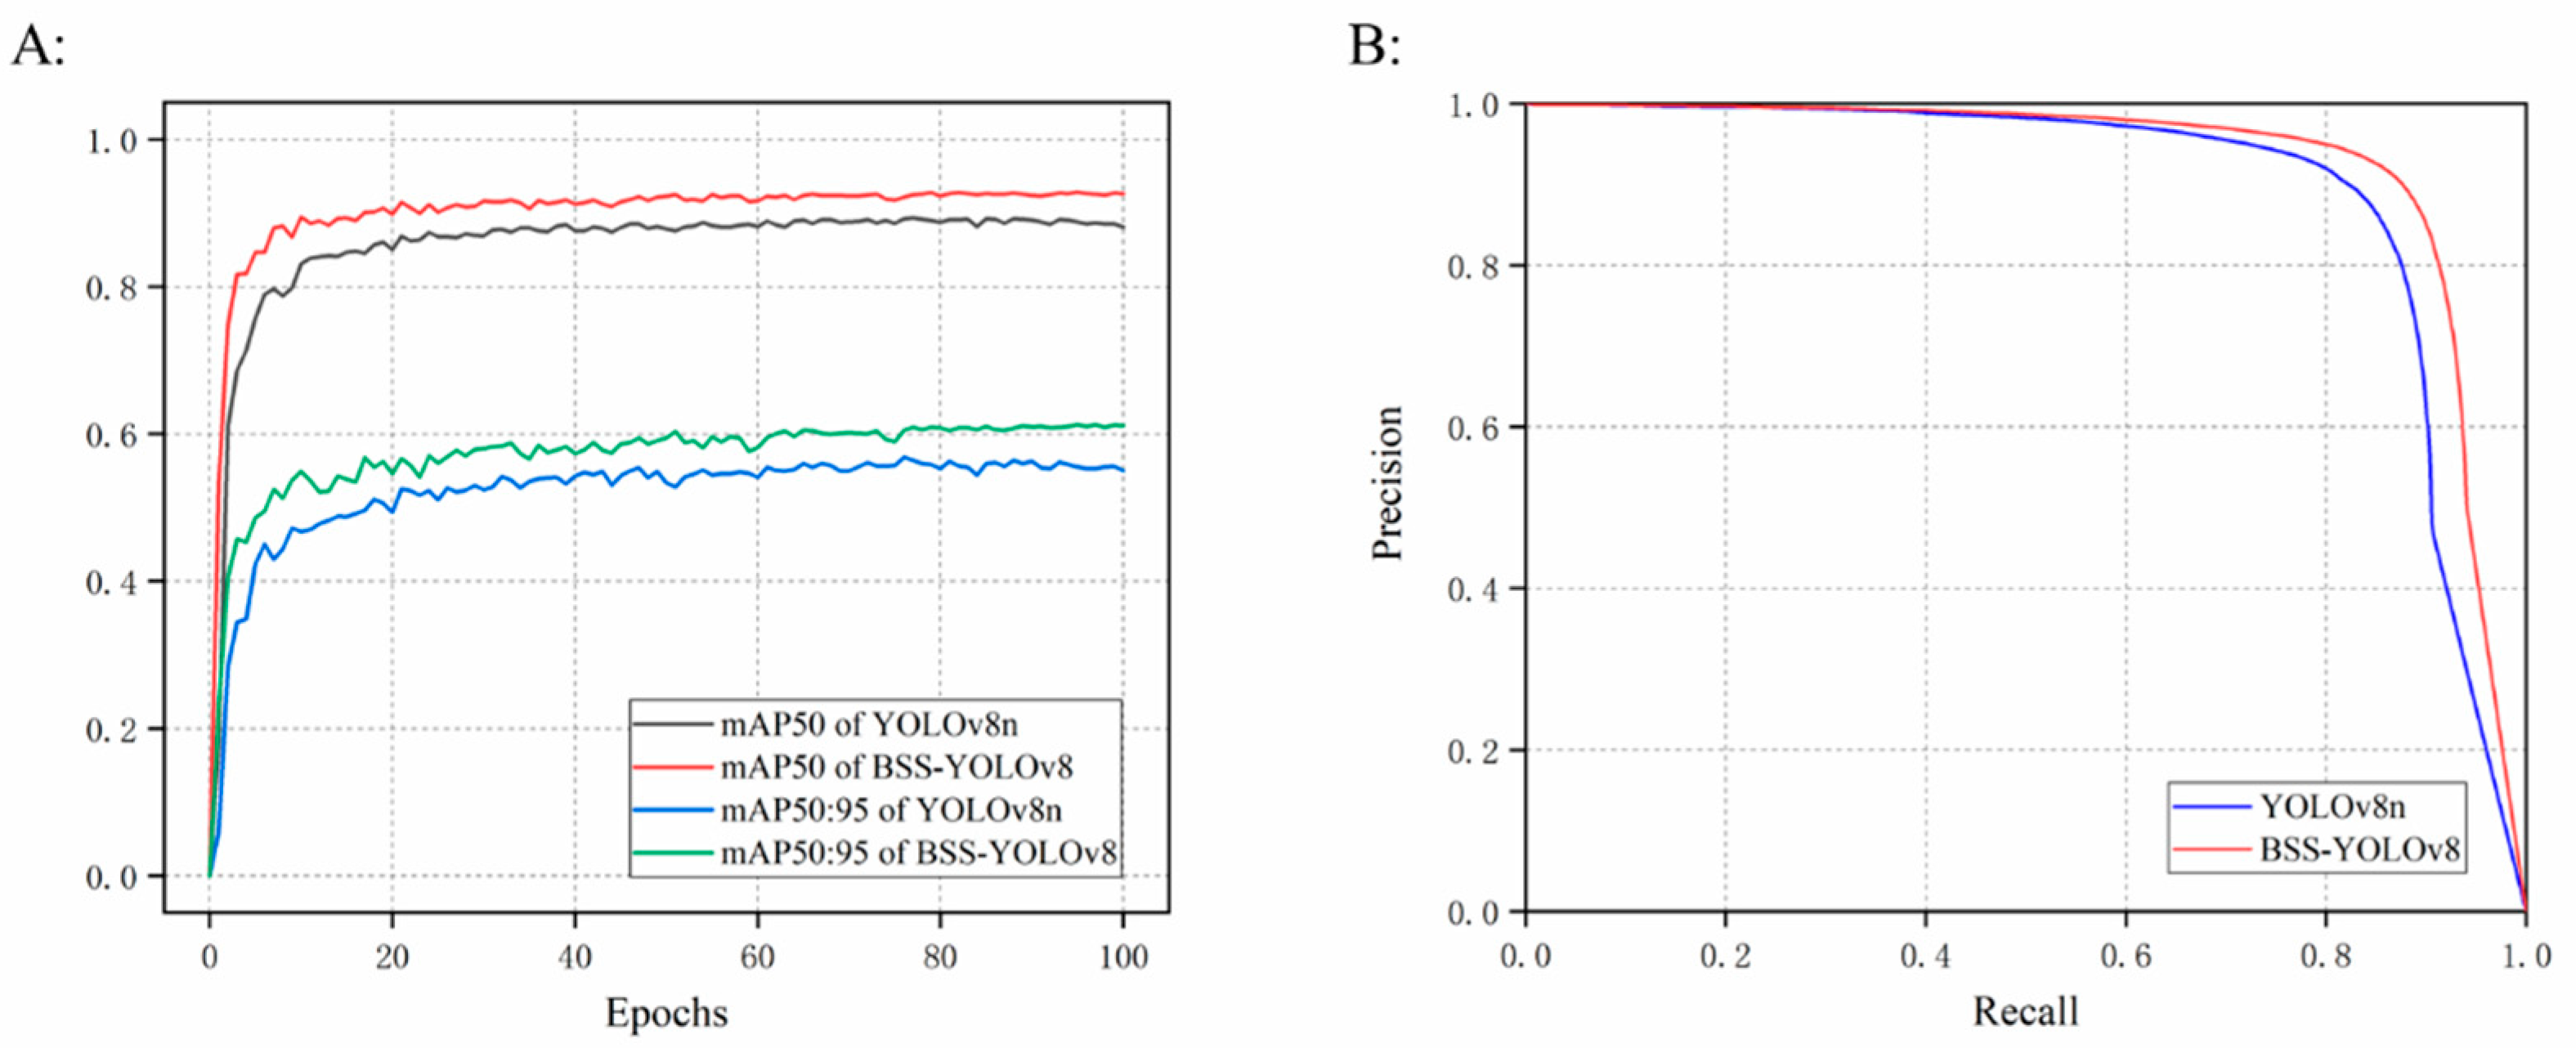
3.1.2. Detection Performance of BSS-YOLOv8

To visually demonstrate the improved performance of the BSS-YOLOv8 model on the detection of P. umbrosa seedlings, we selected a subset of image samples from the dataset and performed detection using YOLOv8n and BSS-YOLOv8, as shown in Figure 11. The black boxes in the figure highlight the differences in detection between the two models. In the sample images, P. umbrosa plants are short and relatively densely distributed. The presence of classification labels and confidence values in the detection images can obstruct some targets, making it impractical for us to make comparisons. Hence, in the process of P. umbrosa detection in this paper, only the detection boxes were preserved, and the classification labels and confidence values were concealed.
(1)
In group a images, YOLOv8 identifies densely distributed P. umbrosa plants as individual P. umbrosa, while BSS-YOLOv8 accurately recognizes each individual P. umbrosa plant. This indicates that, compared to YOLOv8, the BSS-YOLOv8 model proposed in this study excels in detecting densely distributed and mutually occluded P. umbrosa.
(2)
In group b images, BSS-YOLOv8 detects more and smaller P. umbrosa than YOLOv8n, reducing the likelihood of missing and misidentifying small target P. umbrosa. This indicates that BSS-YOLOv8 enhances the detection capability for small P. umbrosa seedlings.
(3)
In group c images, some P. umbrosa have lush growth with distinct stem and leaf branches. YOLOv8n incorrectly identifies different stem and leaf branches of the same P. umbrosa as multiple P. umbrosa plants, resulting in duplicate detections, while BSS-YOLOv8 effectively avoided this issue.
In summary, the BSS-YOLOv8 model exhibits superior detection capabilities compared to the baseline network YOLOv8n. It also demonstrates good identification performance when detecting small and dense targets, showcasing robustness and generalization.

3.2. Results of Ablation Experiments

In this study, 8 groups of ablation tests are conducted to verify the optimization effects of different modules on the detection of P. umbrosa, by analyzing their detection effects separately or in different combinations added to YOLOv8. To ensure the reliability of the experiments, the ablation experiments are conducted under the same dataset and operating environment, with epoch set to 100 and batch size set to 8.
The results of the ablation experiments are shown in Table 4. The addition of the small target detection layer improves the precision, recall, mAP50, mAP50:95, and F1-Score of the YOLOv8 model reaching 90.2%, 84.7%, 91.3%, 58.9%, and 87.36%, respectively, which improved by 1.6%, 1.8%, 2.1%, 2%, and 1.7% compared with the baseline network YOLOv8n. This indicates that the small target detection layer has effectively improved the YOLOv8 network’s ability to capture detailed features of P. umbrosa seedlings by narrowing the receptive field and other methods, avoiding missed and erroneous detection of small target P. umbrosa. Compared with the baseline network YOLOv8n, the model fused with the GSConv module shows better detection performance, achieving a precision of 89.4%, a recall of 85.5%, a Map50 of 91.1%, a Map50:95 of 59.3%, and an F1 Score of 87.35%. Especially, the recall increased by 2.6% compared to the baseline network. This indicates that the GSConv and VoV-GSCSP modules effectively enhance the diversity and richness of feature extraction while simplifying the network structure.
Compared with the significant improvement in model detection performance when the small target detection layer and GSConv module are added, the optimization effect of the BoTNet module when inserted into YOLOv8n alone is weak. However, when BoTNet is introduced into the YOLOv8n network structure together with the small target detection layer, it exhibits a more outstanding optimization effect than adding them individually. On the basis of the small target detection layer, the BoTNet module is added to better integrate the detailed information of the small target detection layer through the Multi-Head Self-Altention(MHSA) and can combine local features and global features to capture more extensive information around the small target, improving the detection ability of densely distributed small target in the complex environment background. Compared with the baseline network, the combination of the small target detection layer and BoTNet effectively enhances various detection metrics, achieving outstanding performance on the P. umbrosa seedling dataset, with 90.1% Precision, 86.6% Recall, 91.8% Map50, 59.1% Map50:95, and an 88.32% F1-score.
It can be clearly seen from the table that the BSS-YOLOv8 model, composed of BoTNet, GSConv, and a small object detection layer, which are integrated into the YOLOv8 network structure, has the most excellent detection performance. Compared with the baseline network, the detection ability of various detection indicators of the BSS-YOLOv8 model has significantly improved. The comparison of mAP and PR curves is shown in Figure 12. The BSS-YOLOv8 model achieves 91.1% Precision, 86.7% Recall, 92.6% mAP50, 61.3% map50:95, and 88.95% F1 score on the P. umbrosa seedling dataset, which can accurately and effectively identify P. umbrosa seedling in complex backgrounds.

3.3. Comparison with Other Object Detection Models

This study further verifies the effectiveness of improving the BSS-YOLOv8 model by comparing its detection performance with other mainstream models in the field of object detection, including two-stage and one-stage algorithms. To ensure the authenticity and effectiveness of the comparison, we still use the same dataset and operating environment, with epoch set to 100 and batch size set to 8.
As a representative of two-stage algorithms, the design of two-stage computational reasoning for Faster R-CNN greatly improves the detection accuracy of the model. However, Faster R-CNN uses high-dimensional feature maps for prediction, which can easily overlook more detailed feature information, resulting in poor performance in small object detection tasks. From Table 5, it can be seen that Faster R-CNN only achieves a precision of 82.4%, a recall of 71.6%, and a Map50 of 80.2% in the dataset of P. umbrosa seedlings constructed in this article. Moreover, the model is complex, computationally intensive, and has poor real-time performance, which cannot effectively meet the real-time monitoring requirements for the early occurrence of P. umbrosa.
The one-stage algorithm SSD model has limited representational capacity in shallow feature maps, resulting in poor robustness for small object detection [45]. As a result, it does not perform well on the P. umbrosa seedling dataset constructed in this paper. Apart from YOLOv3-tiny, which sacrifices some accuracy due to its lightweight design, the other YOLO models tested in the experiment demonstrate excellent detection performance on the P. umbrosa dataset. The proposed BSS-YOLOv8 model in this study achieves the best detection results on the P. umbrosa dataset, enabling the timely detection of P. umbrosa.

4. Discussion

The proposed BSS-YOLOv8 model in this paper is primarily designed for recognizing the grassland weed P. umbrosa, showing potential applications in the identification of other plants and small targets. Although this study has made certain progress, there are still some issues to be noted. Compared to the baseline network YOLOv8n, the improved BSS-YOLOv8 model has achieved enhancements in metrics such as accuracy and mAP. However, there are still a few instances of both missed detections and false positives. This indicates the need for a more diverse dataset to enhance the model’s training effectiveness, while the number of images collected by different devices should be balanced as much as possible. Additionally, we can explore capturing images from different angles or placing targets in more complex backgrounds to increase the diversity of feature acquisition, further enhancing the model’s accuracy and generalization.
In this study, our focus has been on enhancing metrics such as accuracy, recall, and mAP, without specifically targeting improvements in model size and fps. This approach may limit the model’s capability for real-time and efficient detection of targets on embedded and resource-constrained devices. Therefore, our future work will involve implementing lightweight improvements to the model while maintaining accuracy. This includes exploring techniques such as channel pruning and replacing the current backbone networks with more lightweight alternatives. We plan to integrate the BSS-YOLOv8 network model into drones or intelligent robots used for monitoring, refining a workflow for intelligent detection to achieve real-time identification of grassland weed P. umbrosa in images.
Additionally, we have observed the outstanding performance of other advanced models, such as the large-scale CNN-based model InternImage, which is built on deformable convolutions. It not only features effective receptive fields necessary for downstream tasks like detection and segmentation but also demonstrates spatial aggregation abilities that adapt to inputs and tasks. This method reduces the inductive bias of traditional CNNs, contributing to a more robust network performance. Wang and Zhao et al. achieved a new record of 65.4 mAP using InternImage-H on the coco test-dev dataset [46]. Zong and Song et al. introduced a novel collaborative mixed-assignment training scheme, known as Co-DETR, aimed at learning a more efficient and effective detector based on DETR using various label assignment methods. They established a new record with a 66.0 AP on the COCO test-dev dataset [47], marking it as the first model on COCO test-dev to surpass the 66.0 AP threshold. These works have inspired us, and in the future, we will endeavor to explore additional models to achieve superior detection performance.

5. Conclusions

In this study, we established a dataset of P. umbrosa grassland weed seedlings based on three types of images: UAV, camera, and smartphone. To the best of our knowledge, this is the first P. umbrosa dataset in the world. Additionally, we adapted a convolutional neural network from the YOLOv8n architecture to accommodate small-sized weeds. We enhanced the model’s detection performance for P. umbrosa by incorporating the BoTNet module, introducing a multi-head self-attention module (MHSA) into the network structure, substituting some standard convolutions with GSConv, adding the VoV-GSCSP module, and introducing a detection layer for small targets in the neck. The results reveal that the BSS-YOLOv8 network model achieved a precision of 91.1%, a recall rate of 86.7%, an mAP50 of 92.6%, an F1-Score of 88.85%, and an mAP50:95 of 61.3% on the P. umbrosa seedling dataset. Compared with the baseline network, it demonstrated respective improvements of 2.5%, 3.8%, 3.4%, 3.19%, and 4.4%. When compared to other object detection models (YOLO-v5, Faster R-CNN, etc.), the BSS-YOLOv8 model similarly achieved the best detection performance.
The BSS-YOLOv8 model exhibits excellent performance and robustness in detecting small target P. umbrosa seedlings, striking a balance between detection accuracy and real-time capability. The method of using UAVs to capture high-resolution images of grassland vegetation and then rapidly detecting P. umbrosa using the BSS-YOLOv8 network model provides a new approach to early prevention of P. umbrosa. This approach aligns with the precision agriculture requirements of modern society.

Author Contributions

Conceptualization, B.G. and S.L.; methodology, B.G. and S.L.; investigation, B.G., H.T. and S.W.; data curation, B.G.; writing—original draft preparation, B.G. and S.L.; writing—review and editing, B.G., S.L., C.W. and D.Y.; funding acquisition, C.W. and D.Y. All authors have read and agreed to the published version of the manuscript.

Funding

This work was supported by the Survey of Harmful Organisms in the Grasslands of Xinjiang Production and Construction Corps (XJFS-ZFCG-002-02).

Data Availability Statement

The data presented in this study are available on request from the corresponding authors.

Acknowledgments

We would also like to thank all reviewers for their valuable comments.

Conflicts of Interest

The authors declare no conflict of interest.

References

  1. Lemaire, G.; Hodgson, J.; Chabbi, A. Grassland Productivity and Ecosystem Services; CABI: Wallingford, UK, 2011. [Google Scholar]
  2. O’Mara, F.P. The role of grasslands in food security and climate change. Ann. Bot. 2012, 110, 1263–1270. [Google Scholar] [CrossRef] [PubMed]
  3. Bugalho, M.N.; Abreu, J.M. The multifunctional role of grasslands. In Sustainable Mediterranean Grasslands and Their Multi-Functions; CIHEAM/FAO/ENMP/SPPF: Zaragoza, Spain, 2008; pp. 25–30. [Google Scholar]
  4. Boval, M.; Dixon, R.M. The importance of grasslands for animal production and other functions: A review on management and methodological progress in the tropics. Animal 2012, 6, 748–762. [Google Scholar] [CrossRef] [PubMed]
  5. Soussana, J.F.; Klumpp, K.; Ehrhardt, F. The role of grasslands in mitigating climate change. In EGF at 50: The Future of European Grasslands; Grassland Science in Europe; Hopkins, A., Collins, R.P., Fraser, M.D., King, V.R., Lloyd, D.C., Moorby, J.M., Robson, P.R.H., Eds.; EGF: Gogerddan, UK, 2014; Volume 19, pp. 75–89. [Google Scholar]
  6. Huguenin-Elie, O.; Delaby, L.; Klumpp, K.; Lemauviel-Lavenant, S. The role of grasslands in biogeochemical cycles and biodiversity conservation. In Improving grassland and Pasture Management in Temperate Agriculture; Burleigh Dodds Science Publishing: London, UK, 2019; pp. 23–50. [Google Scholar]
  7. Kachler, J.; Benra, F.; Bolliger, R.; Isaac, R.; Bonn, A.; Felipe-Lucia, M.R. Can we have it all? The role of grassland conservation in supporting forage production and plant diversity. Landsc. Ecol. 2023, 1–15. [Google Scholar] [CrossRef]
  8. Guo, Y.Z.; Zhang, R.H.; Sun, T.; Zhao, S.J.; You, Y.F.; Lu, H.; Wu, C.C.; Zhao, B.Y. Harm, control and comprehensive utilization of poisonous weeds in natural grasslands of Gansu Province. Acta Agrestia Sin. 2017, 25, 243. [Google Scholar]
  9. Shang, Z.H.; Dong, Q.M.; Shi, J.J.; Zhou, H.K.; Dong, S.K.; Shao, X.Q.; Li, S.X.; Wang, Y.L.; Ma, Y.S.; Ding, L.M. Research progress in recent ten years of ecological restoration for ‘Black Soil Land’ degraded grassland on Tibetan Plateau—Concurrently discuss of ecological restoration in Sangjiangyuan region. Acta Agrestia Sin. 2018, 26, 1. [Google Scholar]
  10. Xing, F.; An, R.; Wang, B.; Miao, J.; Jiang, T.; Huang, X.; Hu, Y. Mapping the occurrence and spatial distribution of noxious weed species with multisource data in degraded grasslands in the Three-River Headwaters Region, China. Sci. Total Environ. 2021, 801, 149714. [Google Scholar] [CrossRef]
  11. Zhao, B.-Y.; Liu, Z.-Y.; Lu, H.; Wang, Z.-X.; Sun, L.-S.; Wan, X.-P.; Guo, X.; Zhao, Y.-T.; Wang, J.-J.; Shi, Z.-C. Damage and control of poisonous weeds in western grassland of China. Agric. Sci. China 2010, 9, 1512–1521. [Google Scholar] [CrossRef]
  12. Chang, S.H.; Wang, L.; Jiang, J.C.; Liu, Y.J.; Peng, Z.C.; Han, T.H.; Huang, W.G.; Hou, F.J. Developments Course and Prospect of Grassland Survey and Monitoring Domestic and Abroad. Acta Agrestia Sin. 2023, 31, 1281. [Google Scholar]
  13. Li, Y.; Guo, Z.; Shuang, F.; Zhang, M.; Li, X. Key technologies of machine vision for weeding robots: A review and benchmark. Comput. Electron. Agric. 2022, 196, 106880. [Google Scholar] [CrossRef]
  14. Zhang, J.; Huang, Y.; Pu, R.; Gonzalez-Moreno, P.; Yuan, L.; Wu, K.; Huang, W. Monitoring plant diseases and pests through remote sensing technology: A review. Comput. Electron. Agric. 2019, 165, 104943. [Google Scholar] [CrossRef]
  15. Neupane, K.; Baysal-Gurel, F. Automatic identification and monitoring of plant diseases using unmanned aerial vehicles: A review. Remote Sens. 2021, 13, 3841. [Google Scholar] [CrossRef]
  16. Jin, X.; Liu, S.; Baret, F.; Hemerlé, M.; Comar, A. Estimates of plant density of wheat crops at emergence from very low altitude UAV imagery. Remote Sens. Environ. 2017, 198, 105–114. [Google Scholar] [CrossRef]
  17. Kitano, B.T.; Mendes, C.C.T.; Geus, A.R.; Oliveira, H.C.; Souza, J.R. Corn plant counting using deep learning and UAV images. IEEE Geosci. Remote Sens. Lett. 2019, 1–5. [Google Scholar] [CrossRef]
  18. Bayraktar, E.; Basarkan, M.E.; Celebi, N. A low-cost UAV framework towards ornamental plant detection and counting in the wild. ISPRS J. Photogramm. Remote Sens. 2020, 167, 1–11. [Google Scholar] [CrossRef]
  19. Kattenborn, T.; Eichel, J.; Fassnacht, F.E. Convolutional Neural Networks enable efficient, accurate and fine-grained segmentation of plant species and communities from high-resolution UAV imagery. Sci. Rep. 2019, 9, 17656. [Google Scholar] [CrossRef] [PubMed]
  20. Liu, J.; Wang, X. Plant diseases and pests detection based on deep learning: A review. Plant Methods 2021, 17, 22. [Google Scholar] [CrossRef] [PubMed]
  21. Fatih, B.; Kayaalp, F. Review of machine learning and deep learning models in agriculture. Int. Adv. Res. Eng. J. 2021, 5, 309–323. [Google Scholar]
  22. Pinheiro, I.; Moreira, G.; da Silva, D.Q.; Magalhães, S.; Valente, A.; Oliveira, P.M.; Cunha, M.; Santos, F. Deep Learning YOLO-Based Solution for Grape Bunch Detection and Assessment of Biophysical Lesions. Agronomy 2023, 13, 1120. [Google Scholar] [CrossRef]
  23. Maity, M.; Banerjee, S.; Chaudhuri, S.S. Faster R-CNN and yolo based vehicle detection: A survey. In Proceedings of the 2021 5th International Conference on Computing Methodologies and Communication (ICCMC), Erode, India, 8–10 April 2021. [Google Scholar]
  24. Hu, B.; Wang, J. Detection of PCB surface defects with improved faster-RCNN and feature pyramid network. IEEE Access 2020, 8, 108335–108345. [Google Scholar] [CrossRef]
  25. Liu, B.; Bruch, R. Weed detection for selective spraying: A review. Curr. Robot. Rep. 2020, 1, 19–26. [Google Scholar] [CrossRef]
  26. Chen, J.; Wang, H.; Zhang, H.; Luo, T.; Wei, D.; Long, T.; Wang, Z. Weed detection in sesame fields using a YOLO model with an enhanced attention mechanism and feature fusion. Comput. Electron. Agric. 2022, 202, 107412. [Google Scholar] [CrossRef]
  27. Wang, Q.; Cheng, M.; Huang, S.; Cai, Z.; Zhang, J.; Yuan, H. A deep learning approach incorporating YOLO v5 and attention mechanisms for field real-time detection of the invasive weed Solanum rostratum Dunal seedlings. Comput. Electron. Agric. 2022, 199, 107194. [Google Scholar] [CrossRef]
  28. Zhang, R.; Wang, C.; Hu, X.; Liu, Y.; Chen, S.; Su, B. Weed location and recognition based on UAV imaging and deep learning. Int. J. Precis. Agric. Aviat. 2020, 3, 23–29. [Google Scholar] [CrossRef]
  29. Tsai, F.-T.; Nguyen, V.-T.; Duong, T.-P.; Phan, Q.-H.; Lien, C.-H. Tomato Fruit Detection Using Modified Yolov5m Model with Convolutional Neural Networks. Plants 2023, 12, 3067. [Google Scholar] [CrossRef]
  30. Feng, J.; Yu, C.; Shi, X.; Zheng, Z.; Yang, L.; Hu, Y. Research on Winter Jujube Object Detection Based on Optimized Yolov5s. Agronomy 2023, 13, 810. [Google Scholar] [CrossRef]
  31. Yao, J.; Qi, J.; Zhang, J.; Shao, H.; Yang, J.; Li, X. A real-time detection algorithm for Kiwifruit defects based on YOLOv5. Electronics 2021, 10, 1711. [Google Scholar] [CrossRef]
  32. Li, S.; Zhang, S.; Xue, J.; Sun, H. Lightweight target detection for the field flat jujube based on improved YOLOv5. Comput. Electron. Agric. 2022, 202, 107391. [Google Scholar] [CrossRef]
  33. Terven, J.; Cordova-Esparza, D. A comprehensive review of YOLO: From YOLOv1 to YOLOv8 and beyond. arXiv 2023, arXiv:2304.00501. [Google Scholar]
  34. Ge, Z.; Liu, S.; Wang, F.; Li, Z.; Sun, J. Yolox: Exceeding yolo series in 2021. arXiv 2021, arXiv:2107.08430. [Google Scholar]
  35. Redmon, J.; Farhadi, A. YOLOv3: An Incremental Improvement. arXiv 2018, arXiv:1804.02767. [Google Scholar]
  36. Li, Y.; Fan, Q.; Huang, H.; Han, Z.; Gu, Q. A Modified YOLOv8 Detection Network for UAV Aerial Image Recognition. Drones 2023, 7, 304. [Google Scholar] [CrossRef]
  37. Lin, T.Y.; Dollár, P.; Girshick, R.; He, K.; Hariharan, B.; Belongie, S. Feature pyramid networks for object detection. In Proceedings of the IEEE Conference on Computer Vision and Pattern Recognition, Honolulu, HI, USA, 21–26 July 2017. [Google Scholar]
  38. Liu, S.; Qi, L.; Qin, H.; Shi, J.; Jia, J. Path aggregation network for instance segmentation. In Proceedings of the IEEE Conference on Computer Vision and Pattern Recognition, Salt Lake City, UT, USA, 18–23 June 2018. [Google Scholar]
  39. Cao, Y.; Chen, K.; Loy, C.C.; Lin, D. Prime sample attention in object detection. In Proceedings of the IEEE/CVF Conference on Computer Vision and Pattern Recognition, Seattle, WA, USA, 13–19 June 2020. [Google Scholar]
  40. Srinivas, A.; Lin, T.Y.; Parmar, N.; Shlens, J.; Abbeel, P.; Vaswani, A. Bottleneck transformers for visual recognition. In Proceedings of the IEEE/CVF Conference on Computer Vision and Pattern Recognition, Virtual, 19–25 June 2021. [Google Scholar]
  41. Datta, S. A review on convolutional neural networks. In Advances in Communication, Devices and Networking: Proceedings of ICCDN 2019, Sikkim, India, 9–10 December 2019; Springer: Singapore, 2020; Volume 3, pp. 445–452. [Google Scholar]
  42. Li, H.; Li, J.; Wei, H.; Liu, Z.; Zhan, Z.; Ren, Q. Slim-neck by GSConv: A better design paradigm of detector architectures for autonomous vehicles. arXiv 2022, arXiv:2206.02424. [Google Scholar]
  43. Wu, T.; Zhang, Q.; Wu, J.; Liu, Q.; Su, J.; Li, H. An improved YOLOv5s model for effectively predict sugarcane seed replenishment positions verified by a field re-seeding robot. Comput. Electron. Agric. 2023, 214, 108280. [Google Scholar] [CrossRef]
  44. Liu, Q.; Zhang, Y.; Yang, G. Small unopened cotton boll counting by detection with MRF-YOLO in the wild. Comput. Electron. Agric. 2023, 204, 107576. [Google Scholar] [CrossRef]
  45. Choi, H.-T.; Lee, H.-J.; Kang, H.; Yu, S.; Park, H.-H. SSD-EMB: An improved SSD using enhanced feature map block for object detection. Sensors 2021, 21, 2842. [Google Scholar] [CrossRef] [PubMed]
  46. Wang, W.; Dai, J.; Chen, Z.; Huang, Z.; Li, Z.; Zhu, X.; Hu, X.; Lu, T.; Lu, L.; Li, H.; et al. InternImage: Exploring large-scale vision foundation models with deformable convolutions. arXiv 2022, arXiv:2211.05778. [Google Scholar]
  47. Zong, Z.; Song, G.; Liu, Y. DETRs with collaborative hybrid assignments training. In Proceedings of the IEEE/CVF International Conference on Computer Vision, Vancouver, BC, Canada, 18–22 June 2023. [Google Scholar]
Figure 1. Sample images taken by three devices. The red box indicates individual P. umbrosa plants in images captured by three different devices.
Agronomy 13 03001 g001
Figure 2. The YOLOv8 network structure diagram.
Agronomy 13 03001 g002
Figure 3. (a) ResNet bottleneck and (b) BoTNet transformer bottleneck.
Agronomy 13 03001 g003
Figure 4. YOLOv8 backbone network structure after the introduction of BoTNet module.
Agronomy 13 03001 g004
Figure 5. Structure of the GSConv module.
Agronomy 13 03001 g005
Figure 6. DSConv and vovgscsp id added to the network structure.
Agronomy 13 03001 g006
Figure 7. The network structure diagram of YOLOv8-small target detection layer.
Agronomy 13 03001 g007
Figure 8. The network structure diagram of BSS-YOLOv8.
Agronomy 13 03001 g008
Figure 9. Loss variation curve of BSS-YOLOv8.
Agronomy 13 03001 g009
Figure 10. Metric variation curve with number of iterations.
Agronomy 13 03001 g010
Figure 11. Comparison of detection effect between YOLOv8 and BSS-YOLOv8. Images in sets (ac) respectively illustrate the detection results of the baseline network YOLOv8n and BSS-YOLOv8 in three different scenarios: densely distributed P.umbrosa, small target P.umbrosa, and stem-leaf branching P.umbrosa. The black boxes in the figure highlight the differences in detection between the two models.
Agronomy 13 03001 g011
Figure 12. (A) The training mAP curve and (B) the PR curve of YOLOv8n and BSS-YOLOv8.
Agronomy 13 03001 g012
Table 1. UAV configuration parameters.
AppellationParameterNumerical Value
AircraftProduct typequadcopter
Product positioningprofessional grade
Flight time35 min
Operating temperature−10–40 °C
SensorHasselblad camera4/3-inch CMOS, 20 million pixels
Long-focus camera1/2-inch CMOS, 12 million pixels
Other parametersProduct weight899 g
Control distance8000 m
Table 2. The resolution of the sample images collected by the three devices.
Image Acquisition Equipment Image ResolutionThe Average Pixel Proportion of Each P. umbrosa in the Image
Smartphone1890 × 126110.15%
Canon EOX Kiss X102400 × 160042.85%
Dji Mavic 33840 × 21600.093%
Table 3. Hardware configuration and operating environment.
ConfigurationParameter
CPURTX3090
GPUIntel(R) Xeon(R) Gold 6330 CPU
Operating systemWindows 10
PyTorch versionsPyTorch 1.9.0
Python versionsPython 3.8
Cuda versionsCuda 11.1
Table 4. Results of ablation experiments.
ModelPrecision (%)Recall (%)mAP50 (%)F1-Score (%)mAP50:95 (%)
YOLOv8n88.682.989.285.6656.9
+BoTNet89.383.489.786.3057.4
+Small target detection layer90.284.791.387.3658.9
+GSConv89.485.591.187.3559.3
+GSConv+BoTNet89.484.991.387.0959.5
+GSConv+ small target detection layer90.583.792.386.9760.4
+Small target detection layer+BoTNet90.186.691.888.3259.1
BSS-YOLOv891.186.792.688.8561.3
Table 5. Comparison of target detection algorithms.
Model Precision (%)Recall (%)mAP50 (%)F1 Score (%)mAP50:95
YOLOv888.682.989.285.6656.9
YOLOv3-tiny84.163.176.172.1046.6
YOLOv588.782.589.385.4955.8
YOLOv688.282.288.685.0956.4
Faster R-CNN82.471.681.285.2050.3
SSD78.569.274.173.5645.2
BSS-YOLOv891.186.792.688.8561.3
Disclaimer/Publisher’s Note: The statements, opinions and data contained in all publications are solely those of the individual author(s) and contributor(s) and not of MDPI and/or the editor(s). MDPI and/or the editor(s) disclaim responsibility for any injury to people or property resulting from any ideas, methods, instructions or products referred to in the content.

