Article

A Simulation Study on Optimization of Sowing Time of Maize (Zea mays L.) for Maximization of Growth and Yield in the Present Context of Climate Change under the North China Plain

1
Collaborative Innovation Center on Forecast and Evaluation of Meteorological Disasters (CIC-FEMD), Nanjing University of Information Science & Technology, Nanjing 210044, China
2
State Key Laboratory of Severe Weather, Chinese Academy of Meteorological Sciences, Beijing 100081, China
3
CMA-CAU Jointly Laboratory of Agriculture Addressing Climate Change, Beijing 100081, China
4
Hebei Gucheng Agricultural Meteorology National Observation and Research Station, Baoding 072656, China
*
Author to whom correspondence should be addressed.
Agronomy 2023, 13(2), 385; https://doi.org/10.3390/agronomy13020385
Submission received: 25 December 2022 / Revised: 25 January 2023 / Accepted: 26 January 2023 / Published: 28 January 2023

Abstract

:
Adjusting the sowing dates of crops is an effective measure for adapting them to climate change, but very few studies have explained how the optimum sowing dates can be determined. In this study, we used the sowing date field data from 2018 to 2021 from Hebei Gucheng Agricultural Meteorology National Observation and Research Station to analyze the effects of the sowing date on growth, development, and yield of maize, and to quantify the impact of light-temperature potential productivity on different stages of the yield formation. The results showed that delayed sowing decreased the vegetative growth period (VGP) and increased the reproductive growth period (RGP) of maize. The light-temperature potential productivity of the whole growth (WG) period had an exponential relationship with the theoretical yield. At least 14,614.95 kg ha−1 of light-temperature potential productivity was needed to produce grain yield. The maximum theoretical yield was approximately 18,052.56 kg ha−1, as indicated by the curve simulation results. The influence of light-temperature potential productivity on theoretical yield was as follows: VGP > RGP > vegetative and reproductive period (VRP). Accordingly, a method for determining the sowing time window based on VGP was established, and the optimal sowing dates were estimated for 1995–2021 and the SSP2-4.5 scenario in CMIP6 in the middle of this century (2030–2060). The simulation results showed that the optimum sowing date of maize “Lianyu 1” at the study site was 20–25 May in 1995–2021. In the middle of this century, the optimal sowing time of maize was ahead of schedule and the suitable sowing window was increased slightly. We conclude that advancing the sowing date of maize is a practical strategy for enhancing yield in the context of climate warming, and this strategy will provide a meaningful reference for scientific optimization of sowing dates to adapt maize to climate change.

1. Introduction

The North China Plain is one of the most important corn production regions in China, representing 11.2% and 6.9% of the cropped area and total maize (Zea mays L.) production, respectively [1], and playing an important role in China as well as in global food security. By 2050, the world’s population is expected to reach 9.7 billion [2], which will inevitably exert pressure on the agricultural system. Meeting the food demand of the rising global population is one of the most pressing challenges for agricultural science. The Sixth Assessment Report (AR6) of the Intergovernmental Panel on Climate Change (IPCC) states that the increase in global temperature is expected to reach 1.5 °C or more within 20 years, and weather extremes are expected to occur more frequently and become more severe [3]. Climate change will continue to negatively impact agricultural production in this century in the absence of measures to adapt crops to climate change [4]. Agriculture is considered one of the most vulnerable productive sectors, with maize being vulnerable to global climate change and its consequences [5].
Temperature and solar radiation are major meteorological variables that influence crop growth [6,7], as grain yield is closely related to local light and heat conditions [8]. Accumulated solar radiation affects crop growth and development through photosynthesis, which has a major impact on the entire growth lifecycle of crops. Sufficient light duration and effective light intensity during crop growth are beneficial for assimilates’ production, transport, and accumulation [9]; they also stimulate crop growth and yield. Increasing temperatures accelerate the development of crops, resulting in a decline in crop yield [10,11]. However, excessively prolonging the growing season may not be the optimal strategy. The field trial is the most efficient way to study the direct effects of climate change on crops and changing the sowing date is an effective strategy to slow the growth rate and avoid heat damage; climate change can also change the resource allocation of light and temperature in each growth stage, affecting the growth and development of the crops, consequently hampering crop yield and traits [12]. Thus, adjusting the sowing date has the merits of being a relatively less expensive strategy than others and does not require extra investments [13]. Numerous studies have evaluated the influence of climate change on crop yield, which varies significantly across the globe [14]. A strategy to improve maize yield in some areas is early sowing. To some extent, early sowing could extend the grain-filling duration [15], reduce the risk of frost, and allow efficient use of climatic resources [16], thereby increasing crop yield [17,18]. Zhu et al. [19] showed that an increase in maize potential yields with advanced sowing dates in high latitudes. In heat-stressed areas, postponing the sowing date to delay grain filling until late summer or early autumn would effectively prevent the effects of extreme heat and extend the grain-filling duration [20]. By increasing plant photosynthetic capacity, grain yield can be improved. Guo et al. [21] reported that a delayed sowing date could obtain the optimal temperature around flowering, and thereby increasing photosynthetic capacity.
Different developmental stages have varying sensitivities to meteorological factors. The duration of the vegetative growth period (VGP) and filling period affect crop yield [22], and a high yield requires a balance between the accumulation of assimilates during the VGP and the allocation of photosynthates to sink during the reproductive growth period (RGP). Many studies have investigated the correlation between meteorological factors and yield at different growth stages, mainly through model simulations and regional field record data. The results showed that the effective accumulated temperature had a more significant correlation with yield after the silking stage than before [23], and the average daily temperature during the RGP had a greater effect on yield than that in the other periods [24]. Maize growth is often hindered by excessively high daytime temperatures, which can shorten the duration of VGP and reduce the yield [25]. The flowering stage is particularly vulnerable to heat stress [26] and drought stress [27], which will lead to a decreased kernel number and kernel weight. High temperatures during the grain-filling stage shortens the grain-filling duration and eventually decreases the grain weight and yield [28,29]. At present, there are very few quantitative studies on the effect of meteorological factors on the different stages of maize yield. This study was based on the experimental data of the sowing dates during 2018–2021 from the Gucheng Agricultural Meteorology National Field Science Observation and Research Station in northern North China. The specific objectives of this study were (i) to identify the effects of changes in climate resources on maize growth and yield at different sowing dates, (ii) to evaluate the response of different developmental stages to light and temperature resources, in order to identify the critical period of crop yield formation, and (iii) to quantify the contribution of light-temperature potential yield to maize productivity by adjusting the maize sowing date in the present context of climate change.

2. Material and Methods

2.1. Study Site

Sowing date trials were conducted 4 times per year during the growing season, and over 4 years (2018 to 2021), within the Hebei Gucheng Agricultural Meteorology National Observation and Research Station (Gucheng). The site is located east of Gucheng Town, Dingxing County, Hebei Province. The climate is continental monsoon, with a warm and humid summer and a dry and cold winter. The mean annual temperature is 12.2 °C, with a mean annual minimum temperature of 6.45 °C and a mean annual maximum temperature of 19.0 °C. The mean annual precipitation is approximately 501.9 mm, and the mean annual sunshine is 2403.6 h. The experimental field is flat with a deep soil layer, and the soil type is classified as sandy loam. The main properties of the soil were organic carbon 3.67 g kg−1, nitrogen 0.87 g kg−1, and phosphorus 25.76 mg kg−1, with a bulk density of 1.37 g·cm−3 and a PH of 8.19 [30]. The traditional cropping system of winter wheat–summer maize rotation is the cultivation practice.

2.2. Experimental Design

The maize variety used in our field study was ‘Lianyu 1’, which is a cultivar that is mainly planted in maize-growing areas in the Hebei province, China. It’s a medium maturing summer maize hybrid and the growth period is approximately 90 d. The average yield is 9000–9750 kg ha−1 with a suitable planting density of 57,000–63,000 plants ha−1. The treatments consisted of four sowing dates for maize: 18 June as the conventional sowing date (S2), 8 June at 10 days (S1) earlier than S2, 28 June at 10 days (S3) later than S2, and 8 July at 20 days (S4) later than S2. Each experiment plot was designed as a Latin square with four replicates for each treatment, and each plot was 30 m2. The planting density was 6 plants per m2 for every sowing date, and each plot was spaced from each other by 0.5 m to prevent cross contact among the different plots. There was no shelter around the experimental site, which was surrounded by fields that had been planted with maize to avoid the influence of the microclimate. Field management, including irrigation and fertilization, was consistent with local agricultural practices. After sowing, irrigation was first applied for about 2 h to ensure enough soil water for emergence. Subsequently, the maize plants relied mainly on natural precipitation for growth and development. When rainfall was insufficient, manual irrigation was applied to replenish soil moisture. Compound fertilizer (N:P2O5:K2O = 26%:14%:5%) was applied at the rate of 830 kg ha−1. Pest and weed control were also carried out as per the recommended practices, and no obvious diseases were observed during the experiment.

2.3. Data Sources

Meteorological data were derived from the records of automatic weather stations, including air temperature, daily maximum temperature, daily minimum temperature, daily average temperature, sunshine hours, and precipitation. In this study, we obtained historical simulations (2000–2014) and future scenario simulations (2015–2060) of solar radiations, minimum temperature, maximum temperature, and average temperature from the ACCESS-CM2 SSP2-4.5 model in CMIP6. Meteorological factors were interpolated using the inverse distance weighted (IDW) method. Meanwhile, based on 15 years of daily meteorological data in the research station, revising the historical simulations using linear regression. According to the regression equation obtained, the future daily meteorological data had been determined.
In this study, different maize growth periods were observed in line with the Agricultural Meteorological Observation Standard. The jointing period was identified when the flat basal internodes of maize had become round and the stem nodes near the ground had hardened. The heading date was identified when the top spikelet of the male panicle emerged from the leaf sheaths. Anthesis was recorded when the anthers of the middle and upper parts of the male panicle were exposed and the pollen was released. The mature stage was recorded when the outer bracts of more than 80% of the plant turned yellow, the filaments withered, and the seeds hardened, showing the inherent colour of this variety. Sampling was performed during the maturity stage, with three replicates and each replicate containing 5 individual plants. The kernel number per ear was counted, the hundred-kernel weight was measured, and the theoretical yield was estimated in g m−2; the yield was then converted to kg ha−1.

2.4. Data Analysis

(1)
Reproduction period
The study focused on three phases: the vegetative growth period (VGP), reproductive growth period (RGP), and vegetative and reproductive period (VRP). The VGP lasts from sowing to jointing; VRP, from jointing to flowering; and RGP, from flowering to maturity [21]. The durations of different developmental stages and light-temperature resources were calculated.
(2)
Solar radiation
The total solar radiation Q s was calculated using the Angstrom [31] empirical Equations (1)–(6). Previous studies reported a and b values of 0.143 and 0.585 in eastern China, and 0.185 and 0.595 in western China, respectively [32], which the empirical coefficients are related to the geographical location and atmospheric quality, expressing the fraction of extra-terrestrial radiation reaching the earth on overcast days [33].
Q s = a + b n N Q a
Q a = 37.6051 × d r × ω sin ϕ sin δ + cos ϕ cos δ s i n ω
d r = 1 + 0.033 × cos 2 π 365 J
δ = 0.409 δ = 0.409 × sin 2 π 365 J 1.39
ω s = arccos tan ϕ × tan δ
N = 24 π ω s
where Q S is the solar radiation (MJ m−2 d−1), Q a is the extra-terrestrial radiation (MJ m−2 d−1), N is the maximum possible duration of sunshine or daylight hours (h), n is the actual duration of sunshine (h), d r is the reciprocal of relative distance between Earth–sun, ω s is the sunset hour angle(rad), ϕ is the latitude (rad), δ is the solar decimation (rad), and J is the number of days in the year.
(3)
Potential photosynthetic productivity
The photosynthetic potential productivity is the maximum yield determined only by solar radiation in a certain area, which is not affected by temperature, fertilizer, soil, water, plant diseases, insect pests, or other factors [34]. In this study, Hou Guangliang’s [35] method was used for the calculations,
Y ( Q ) = k ε ψ Ω ( 1 α ) ( 1 β ) ( 1 ρ ) ( 1 γ ) ( 1 ω ) ( 1 η ) 1 ( 1 ζ ) 1 q 1 s Q s
where Y ( Q ) is the daily photosynthetic potential productivity (kg ha−1) during the maize growth period; k is the unit conversion function; ε is the ratio of photosynthetic active radiation to the total solar radiation on the ground, with 0.49; ψ is the quantum efficiency of photosynthesis, with 0.224; Ω is the photosynthetic capacity of crops to fix CO2, with 1.0; α is the reflectivity of crop population, with 0.08; β is the transmittance of a luxuriant plant population, with 0.06; ρ is the absorption rate of non-photosynthetic organs, with 0.1; γ is the limit rate of light saturation, with 0.01; ω is the respiration rate, with 0.3; η is the standard water content of maize grain, with 0.15; ζ is the mineral content of maize plants, with 0.08; q is the energy requirement for 1 kg dry matter formation (MJ·kg−1), with 17.8; s is the harvest index of maize, with 0.40; and Q s is the total solar radiation during crop growth (MJ·m−2).
(4)
Light-temperature potential productivity
Light-temperature potential productivity represents the productivity ascertained by solar radiation and thermal conditions without being affected by water, fertilizer, soil, diseases, and insect pests. It is the maximum yield per unit area of land [34]. This calculation was performed on a level-by-level basis,
Y T = Y Q f t
f ( t ) = 0 t < t min , t > t max t t min t op t min t min t < t op t max t t max t op t op t t max
where Y T is the light-temperature potential productivity (kg ha−1); f t is the temperature coefficient; t is the average temperature; and t min (°C), t max (°C), and t op (°C) represent the lower, upper, and optimal temperature limits during the growing period, respectively. The specific values are listed in Table 1.
(5)
Accumulated temperature model
Accumulated temperature refers to the accumulated value of the average temperature above the lower temperature limit of growth and development. The common accumulated temperature model and Shen Guoquan’s nonlinear accumulated temperature model were used to simulate the response of maize to temperatures at different development stages.
(a)
The growth rate increases with increasing temperature after the temperature reaches the lower limit of crop growth and development and is relatively stable, which can be calculated as follows:
T = A + n B
where T is a certain period of the active accumulated temperature, A is the effective accumulated temperature, n is the duration of the different growth stages, and B is the lower temperature limit of the biological system.
(b)
Shen [36] believed that there was a nonlinear relationship between crop growth rate and temperature given the effectiveness of three base temperatures for crop development, which can be calculated using Equation (11):
A ( T ) = K ( T B ) p ( M T ) 1 Q
where A(T) is the effective accumulated temperature; B is the lower temperature limit; M is the upper temperature limit; T is the average temperature during the growth period; and K, P, and Q are the study-specific parameters. Empirically, the parameter p value is 0.5 when the number of samples is small, also P and Q are greater than 0.

3. Results

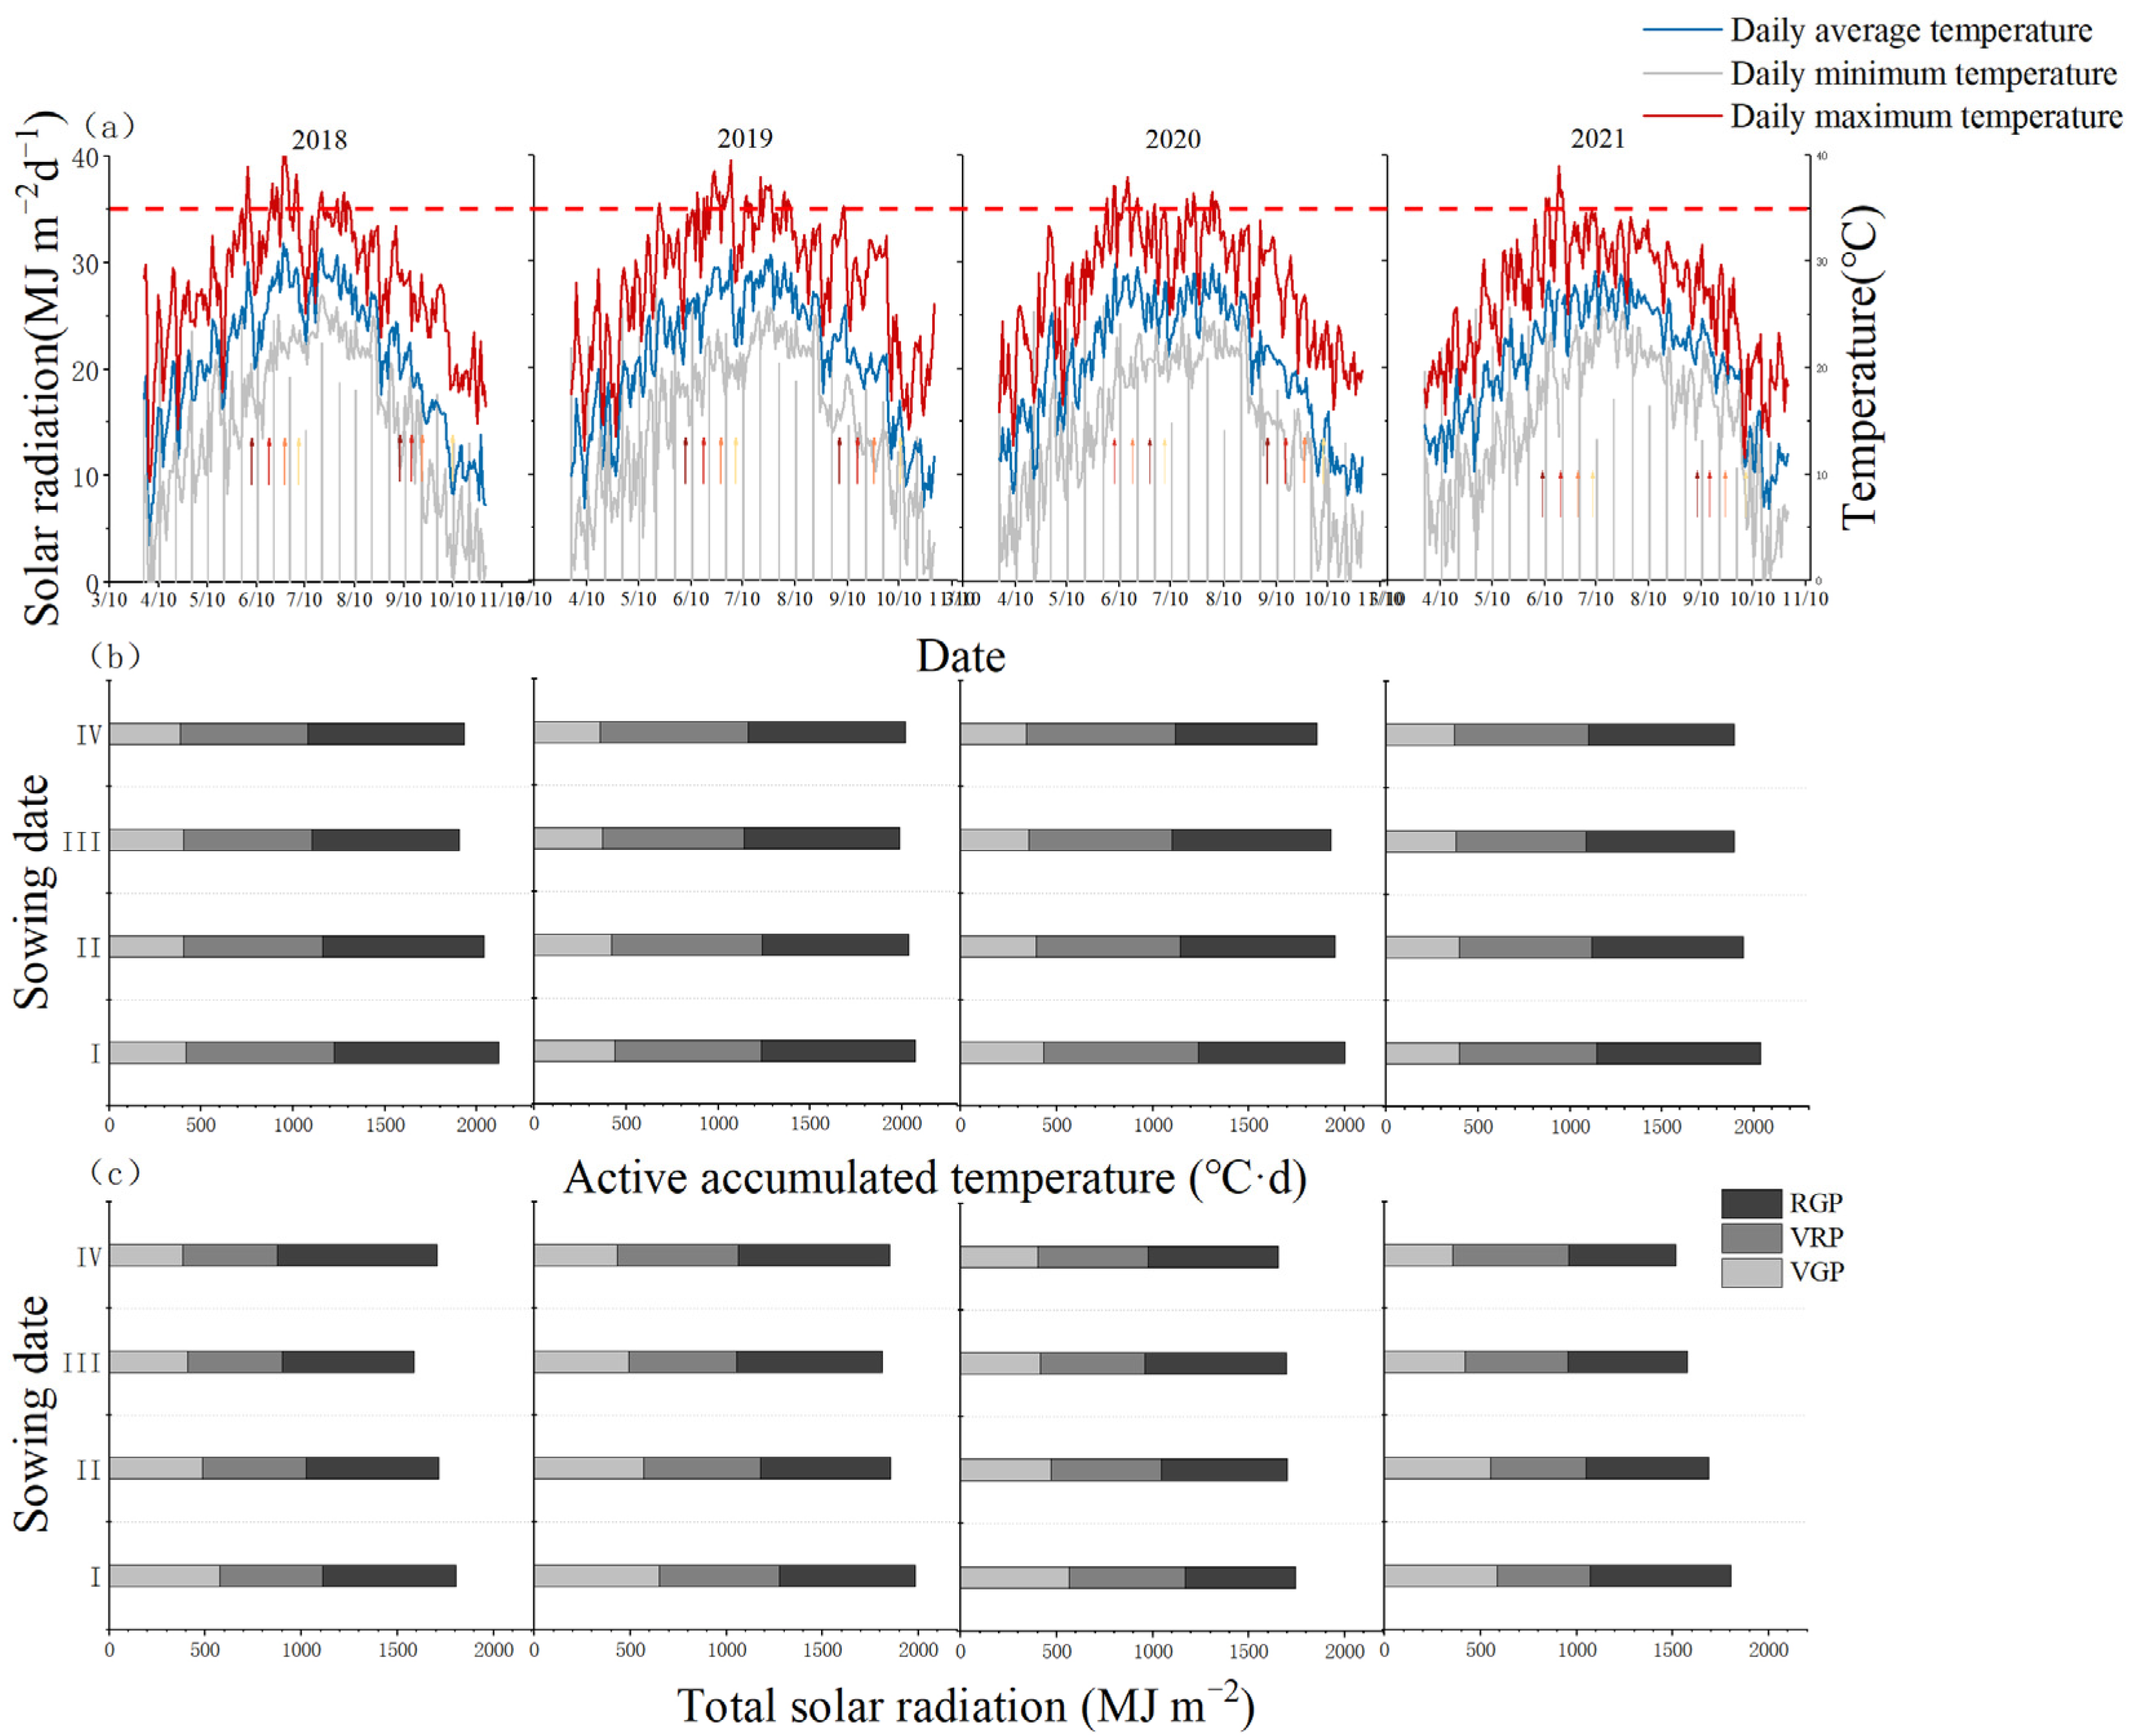
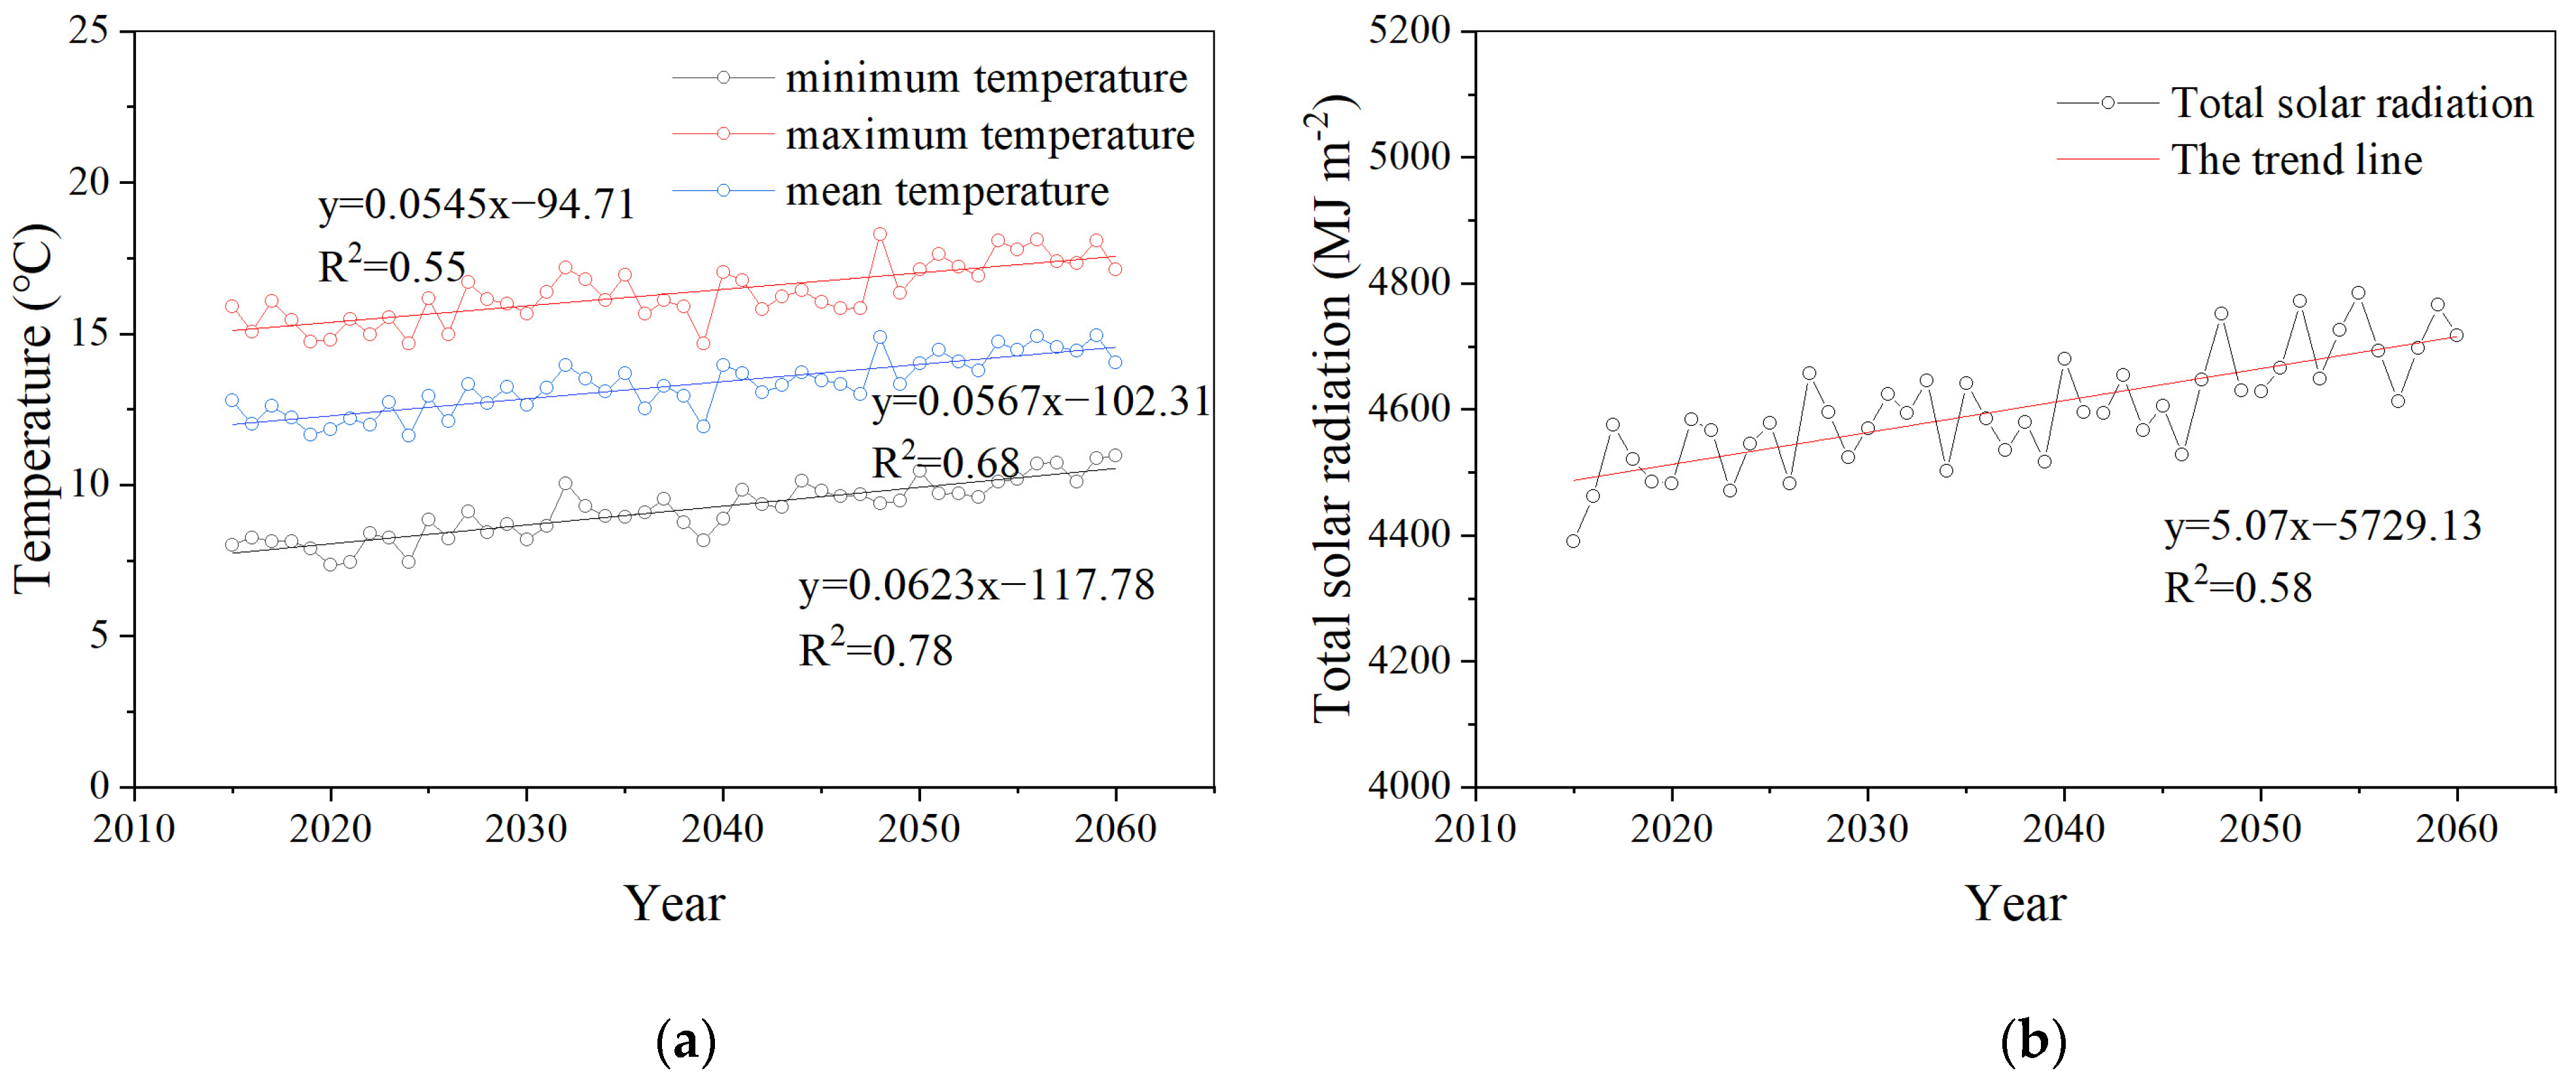
3.1. Change of Climate Resources

The growth period of maize at Gucheng station is mainly from May to October, and the daily mean air temperature, daily maximum air temperature, daily minimum air temperature, and solar radiation during the sowing period are shown in Figure 1a. The daily minimum temperature was below 10 °C before early May and after early October, with no significant periods of low temperature encountered at other times. The temperature increased gradually during the growth period, reaching a maximum in mid-July, and then decreasing gradually. The average solar radiation was low only in early July, with plenty of sunshine at other times. There were significant differences in the meteorological factors during the different sowing dates in the maize growth period (Figure 1b,c). During the whole growth (WG) period, the active accumulated temperature decreased with the delay in the sowing date; the highest accumulated temperature was 2020.23–2120.52 °C·d in different years, which all presented at 10 days ahead of the sowing date (S1). The active cumulative temperature was relatively low at 1851.93–1985.77 °C·d for the 10-day (S3) and 20-day (S4) delayed sowing dates. In different years, the active accumulated temperature decreased in response to the delayed sowing date in the VGP of maize, with the smallest value recorded for the 20-day delay (S4). In addition, the active cumulative temperature of the VRP and RGP did not significantly change with the delay in the sowing date. During the WG period, the variation in the total solar radiation with the delay in the sowing date differed between the years (Figure 1c). The total solar radiation displayed a tendency to decrease at first and increase later with the postponement of the sowing date in 2018 and 2019, with minimum values of 1584.18 MJ m−2 and 1810.80 MJ m−2, respectively, recorded in S3. Unlike 2018 and 2019, 2020 and 2021 showed a decreasing trend with the delay in the sowing date and the minimum values of 1653.43MJ m−2 and 1515.50 MJ m−2, respectively, were recorded in S4. The total solar radiation decreased with the delay in the sowing date during the VGP, and the extent of the decrease differed between the years. The total solar radiation in the VRP did not change significantly with the sowing date. The interannual variation trend in the total solar radiation differed substantially among the different sowing times during RGP, except for S3 that showed the minimum value of 1810.78 MJ m−2 in 2019, and S4 that showed the minimum values in the other years.
In the SSP2-4.5 scenario, the mean annual maximum temperature, mean annual minimum temperature, and mean annual temperature at the research site were 16.4 °C, 9.3 °C, and 13.3 °C, respectively (Figure 2a). In addition, all meteorological factors exhibited a fluctuating upward trend during 2015–2060. The annual minimum temperature had the fastest growth rate, which was 0.6 °C per decade (p < 0.01). The total solar radiation has obvious characteristics with the inter-annual variation (Figure 2b), showing a rising trend when fluctuating, with an average of 4784.89 MJ m−2.

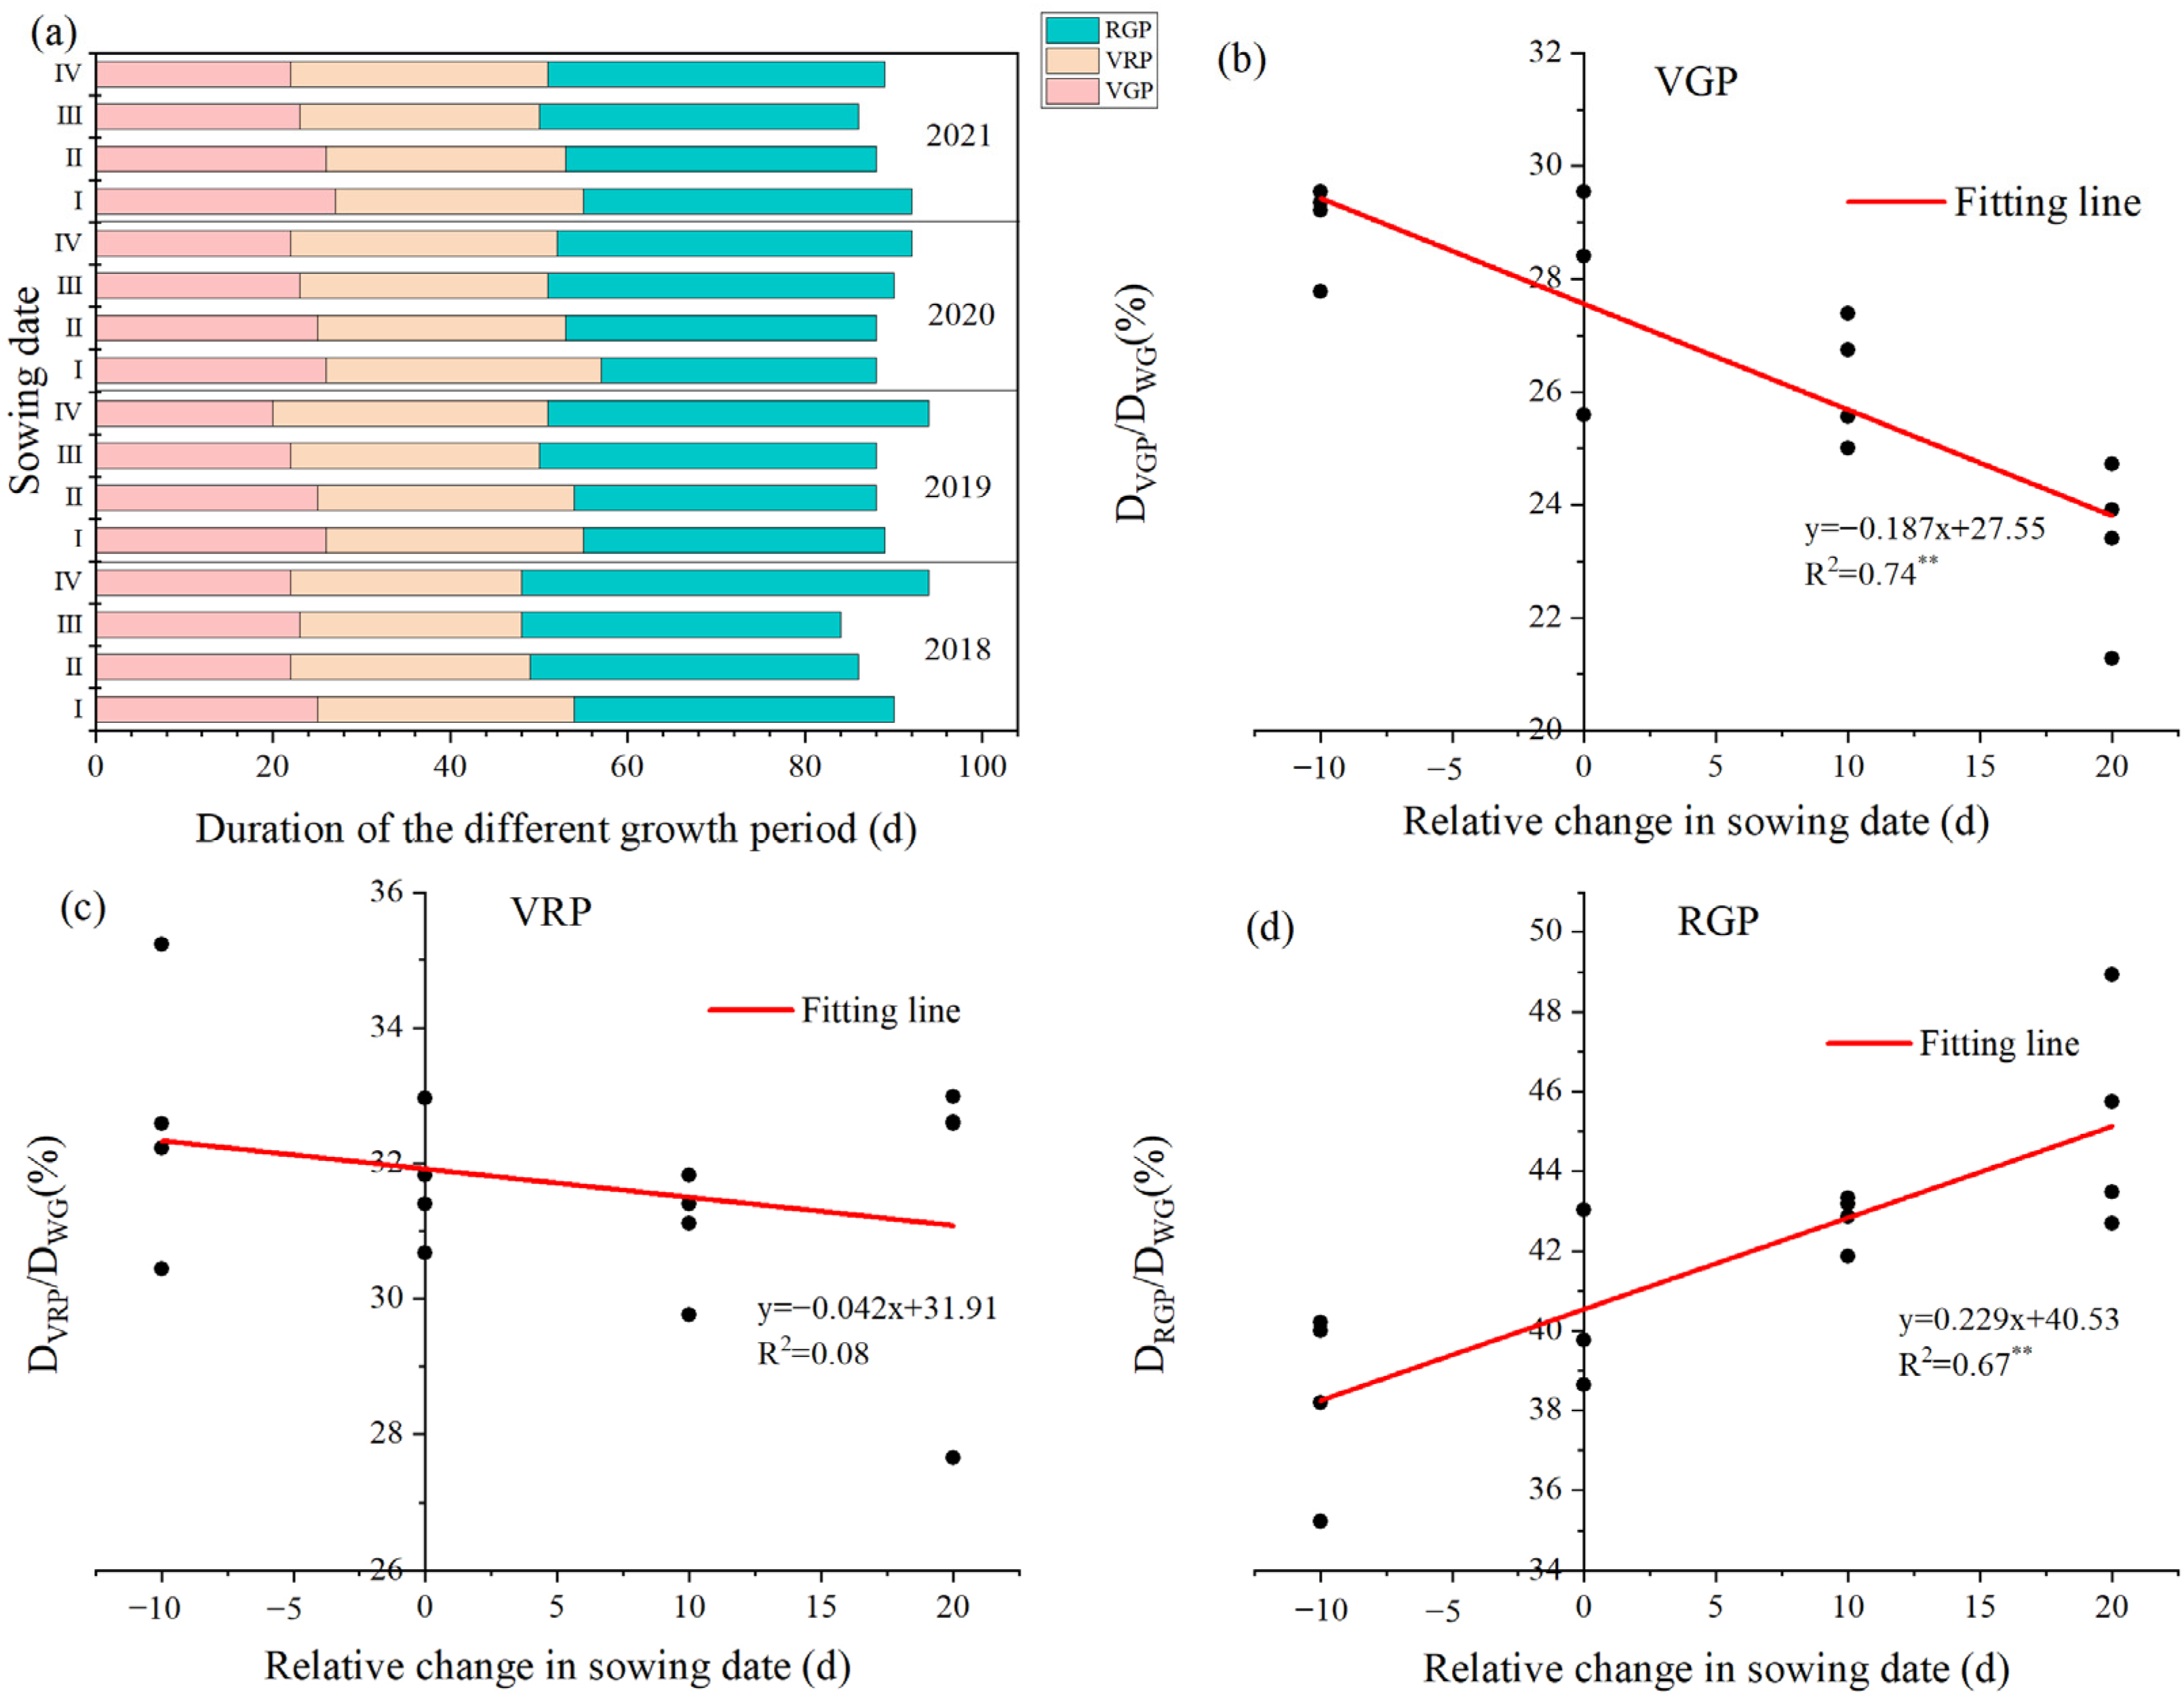
3.2. Analysis of Growth Process and Light-Temperature Resources in Different Stages

The sowing date had a significant effect on the growth process of maize at Gucheng Station. With the delay in the sowing date, the duration of the WG period (DWG) first decreased and then increased. The DWG was the longest with the 20-day delay in the sowing date in most years (Figure 3a). The duration of each sowing period was expressed as the durations of the RGP (DRGP), VRP (DVRP), and VGP (DVGP). The DVGP showed an overall trend of shortening with sowing delay; the average shortening of DVGP was 4 d in different years, and the proportion of DVGP to DWG decreased. The percentage of DVGP to DWG decreased by 0.18% for each day delay in the sowing date (Figure 3b). The DVRP was less affected by the sowing date, with no significant differences overall, and the proportion of DVRP to DWG showed no significant change (Figure 3c). The DRGP increased with sowing delay, and the average increase in DRGP with sowing delay in different years was 7 d, which increased the proportion of DRGP to DWG. The proportion of DRGP to DWG increased by 0.23% for each day delay in sowing (Figure 3d). These results indicate that the change in the sowing date had an influence on the duration of the early and late growth stages of maize but to a different extent. As the sowing date was delayed, the ratios of the durations of the different development periods changed, showing a shift from the VGP to RGP, which was the main reason for the change in the DWG.
The staged seeding test ensured that the soil moisture was suitable. Therefore, in this study, we regarded 1/n as the development rate at a certain stage and established a corresponding growth rate model (Table 2). The results showed a linear correlation between the growth rate and the mean temperature during the VGP (Figure 3); the growth rate increased with an increase in temperature; early sowing resulted in a reduction in the average temperature during the VGP, a slowing of the growth rate, and a lengthening of the development period. From the accumulated temperature model (Equation (13)), we found that the lower limit of the mean air temperature during the VGP was 20.1 °C, requiring an effective cumulative temperature of at least 153.19 °C·d. The relationship between light-temperature potential yield and the DVGP was a parabola (Equation (12)), where the light-temperature potential yield was at least 4161.60 kg ha−1. The lower limit of the mean air temperature during the VRP was 20.3 °C, requiring an effective cumulative temperature of at least 185.53 °C·d, where the maximum light-temperature potential yield was 11,065.05 kg ha−1 (Equations (15)–(17)). According to the nonlinear accumulated temperature model (Equation (11)) proposed by Shen Guoquan, there was a nonlinear relationship between the average temperature and the development rate during RGP (Equation (19)). The contribution of one unit increase in temperature to the reproductive growth rate differed at different temperature levels (Equation (20)). There was one event of strong wind and heavy rainfall in late August 2018, causing severe lodging in S3 and S4. Therefore, the data of RGP in S3 and S4 were eliminated from the detailed analyses as shown in the table.

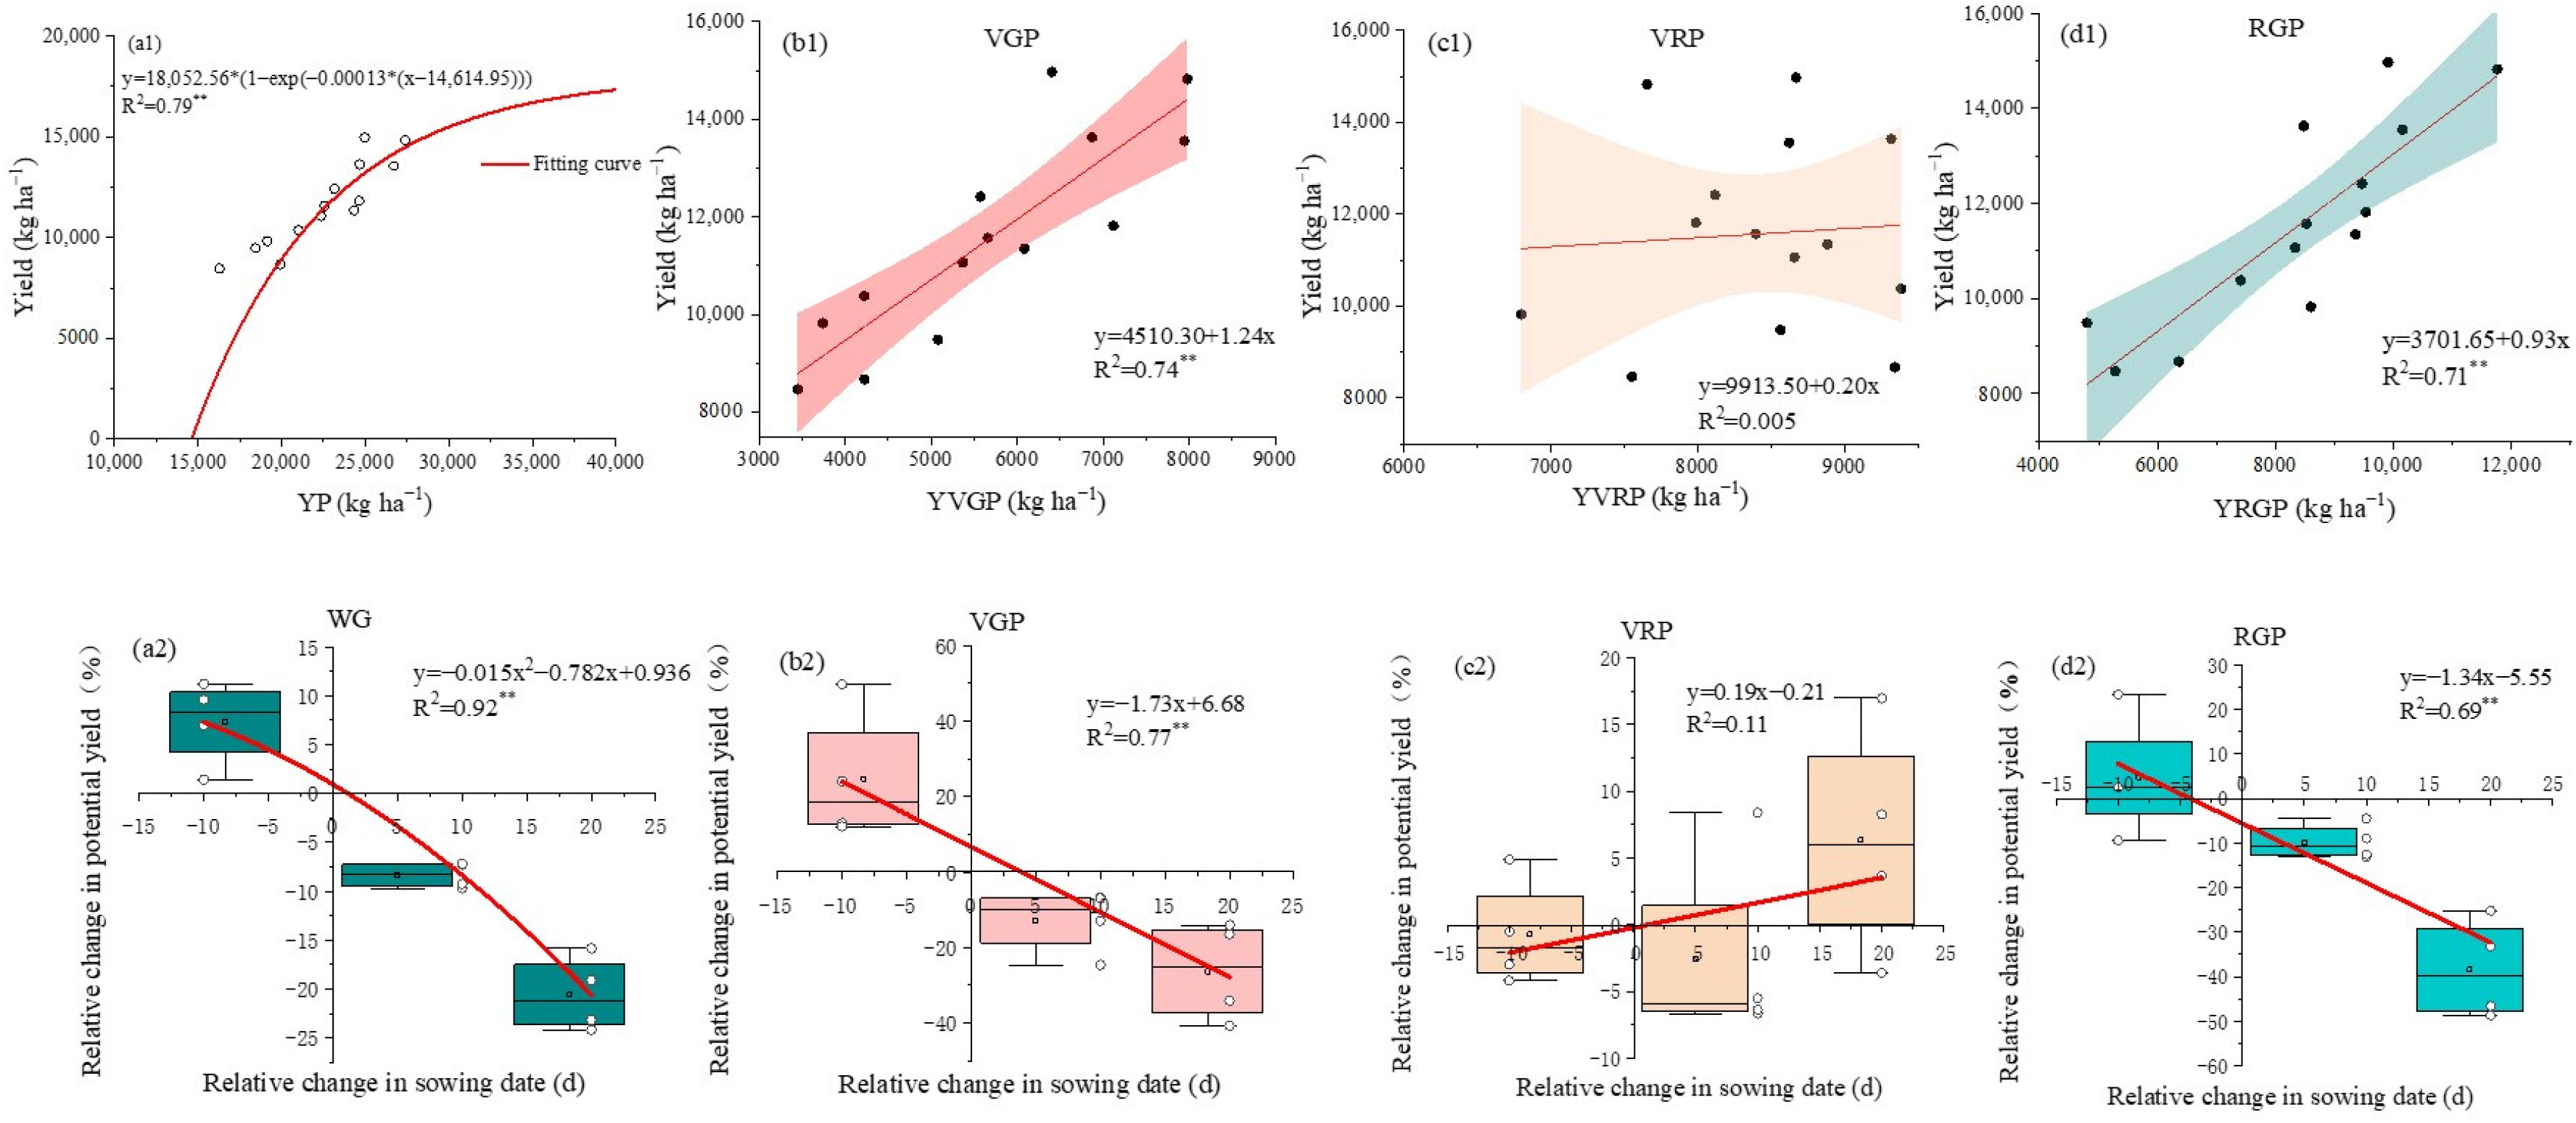
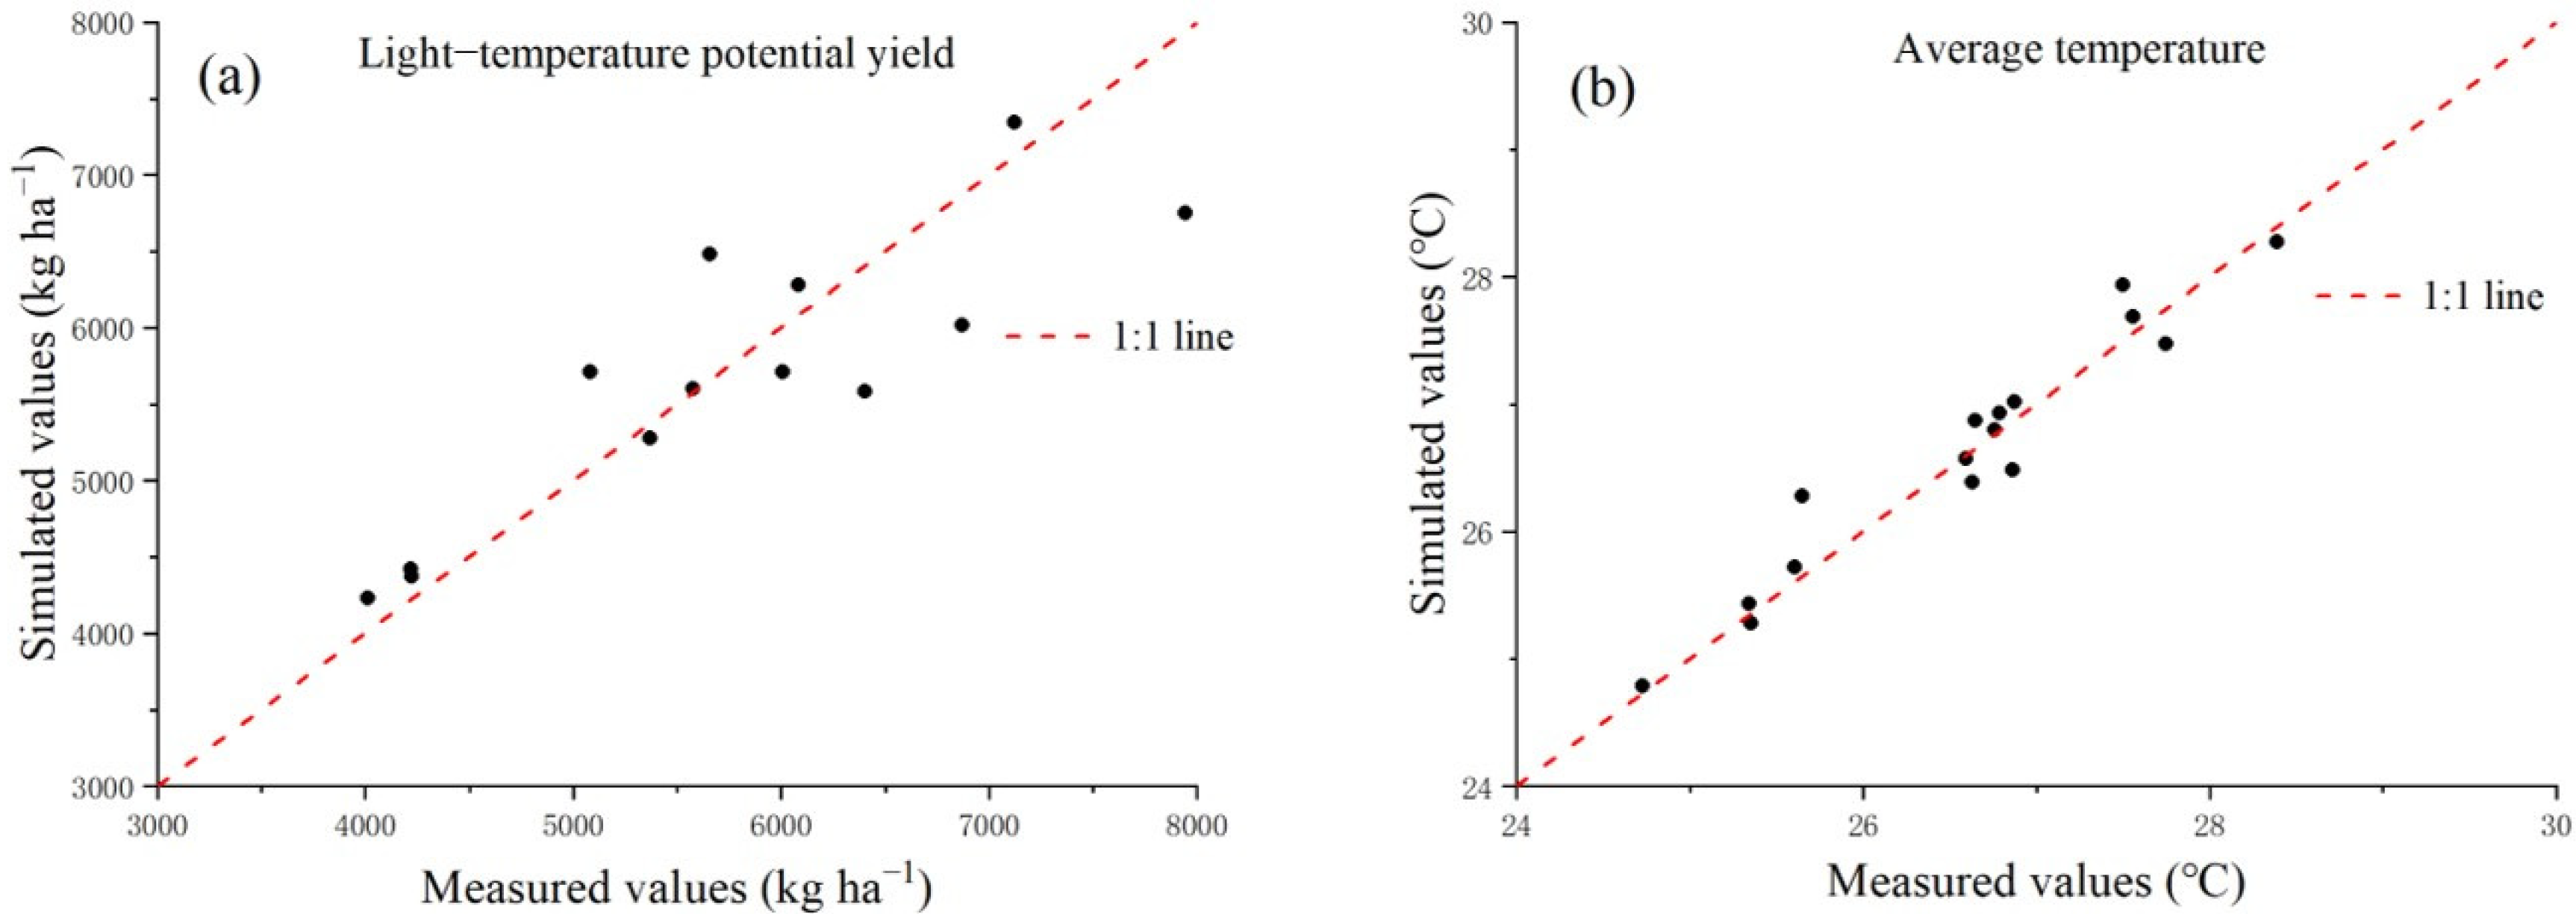
3.3. Relationship between Light-Temperature Potential Yield and Yield

We found an exponential relationship between the light-temperature potential yield and the theoretical yield of maize in the WG period (Figure 4(a1); R2 = 0.79). Under the current cultivation and management measures, the predicted peak yield of maize was 18,052.56 kg ha−1, and a light-temperature potential yield of at least 14,614.95 kg ha−1 was required to meet the requirements for yield formation. However, the response of maize yield to the light-temperature potential yield was different at different growth stages (Figure 4(b1)). During the VGP of maize, the light-temperature potential yield (YVGP) was significantly and positively correlated with the theoretical yield (p < 0.01), which could increase yield with an increase in YVGP, explaining 74% of the yield difference. During the VRP, there was no significant relationship between the light-temperature potential yield (YVRP) and the theoretical yield (Figure 4(c1)). During the RGP, the light-temperature potential yield (YRGP) was positively correlated with the grain yield, and YRGP explained 71% of the difference in the yield (Figure 4(d1)). Therefore, the light-temperature conditions during the vegetative and reproductive growth stages were equally important for the maize yield formation at the Gucheng station. The slope of the fitted equation βYVGP > βYRGP indicated that the maize yield at the Gucheng station was more sensitive to changes in YVGP.
According to the multivariate regression models based on the light-temperature potential yield at different stages and the changes in the sowing date, we concluded that the sowing date had a significant effect on the light-temperature potential yield of maize (p < 0.01, R2 = 0.92), and the fitting results of the two methods were preferable. An early sowing date has a positive effect, while a late sowing date has a negative effect on potential yield (Figure 4(a2)), and the light-temperature potential yield varied between −25% and 12% depending on the sowing date. The fitting results showed that the light-temperature potential yield would reach the extreme value of approximately 30,745.20 kg ha−1 26 d ahead of the sowing date. Further delaying of the sowing date will not result in a further increase in the potential yield. Therefore, early sowing dates can increase the potential maize yield. In addition, the effect of the sowing date on the light-temperature potential yield differed at the different growth stages of maize. The relative change in the light-temperature potential yield of each stage at a 10-day delayed sowing (S3) was the smallest with the least inter-annual variability.
There was a significantly negative correlation between the sowing date and the light-temperature potential yield in the VGP and RGP (p < 0.01) but not in the VRP (Figure 4(c2)). According to the results of linear regression, we can conclude that for each 1 d delay in the sowing date, the light-temperature yield potential was reduced by 1.73% in the VGP and 1.34% in the RGP.

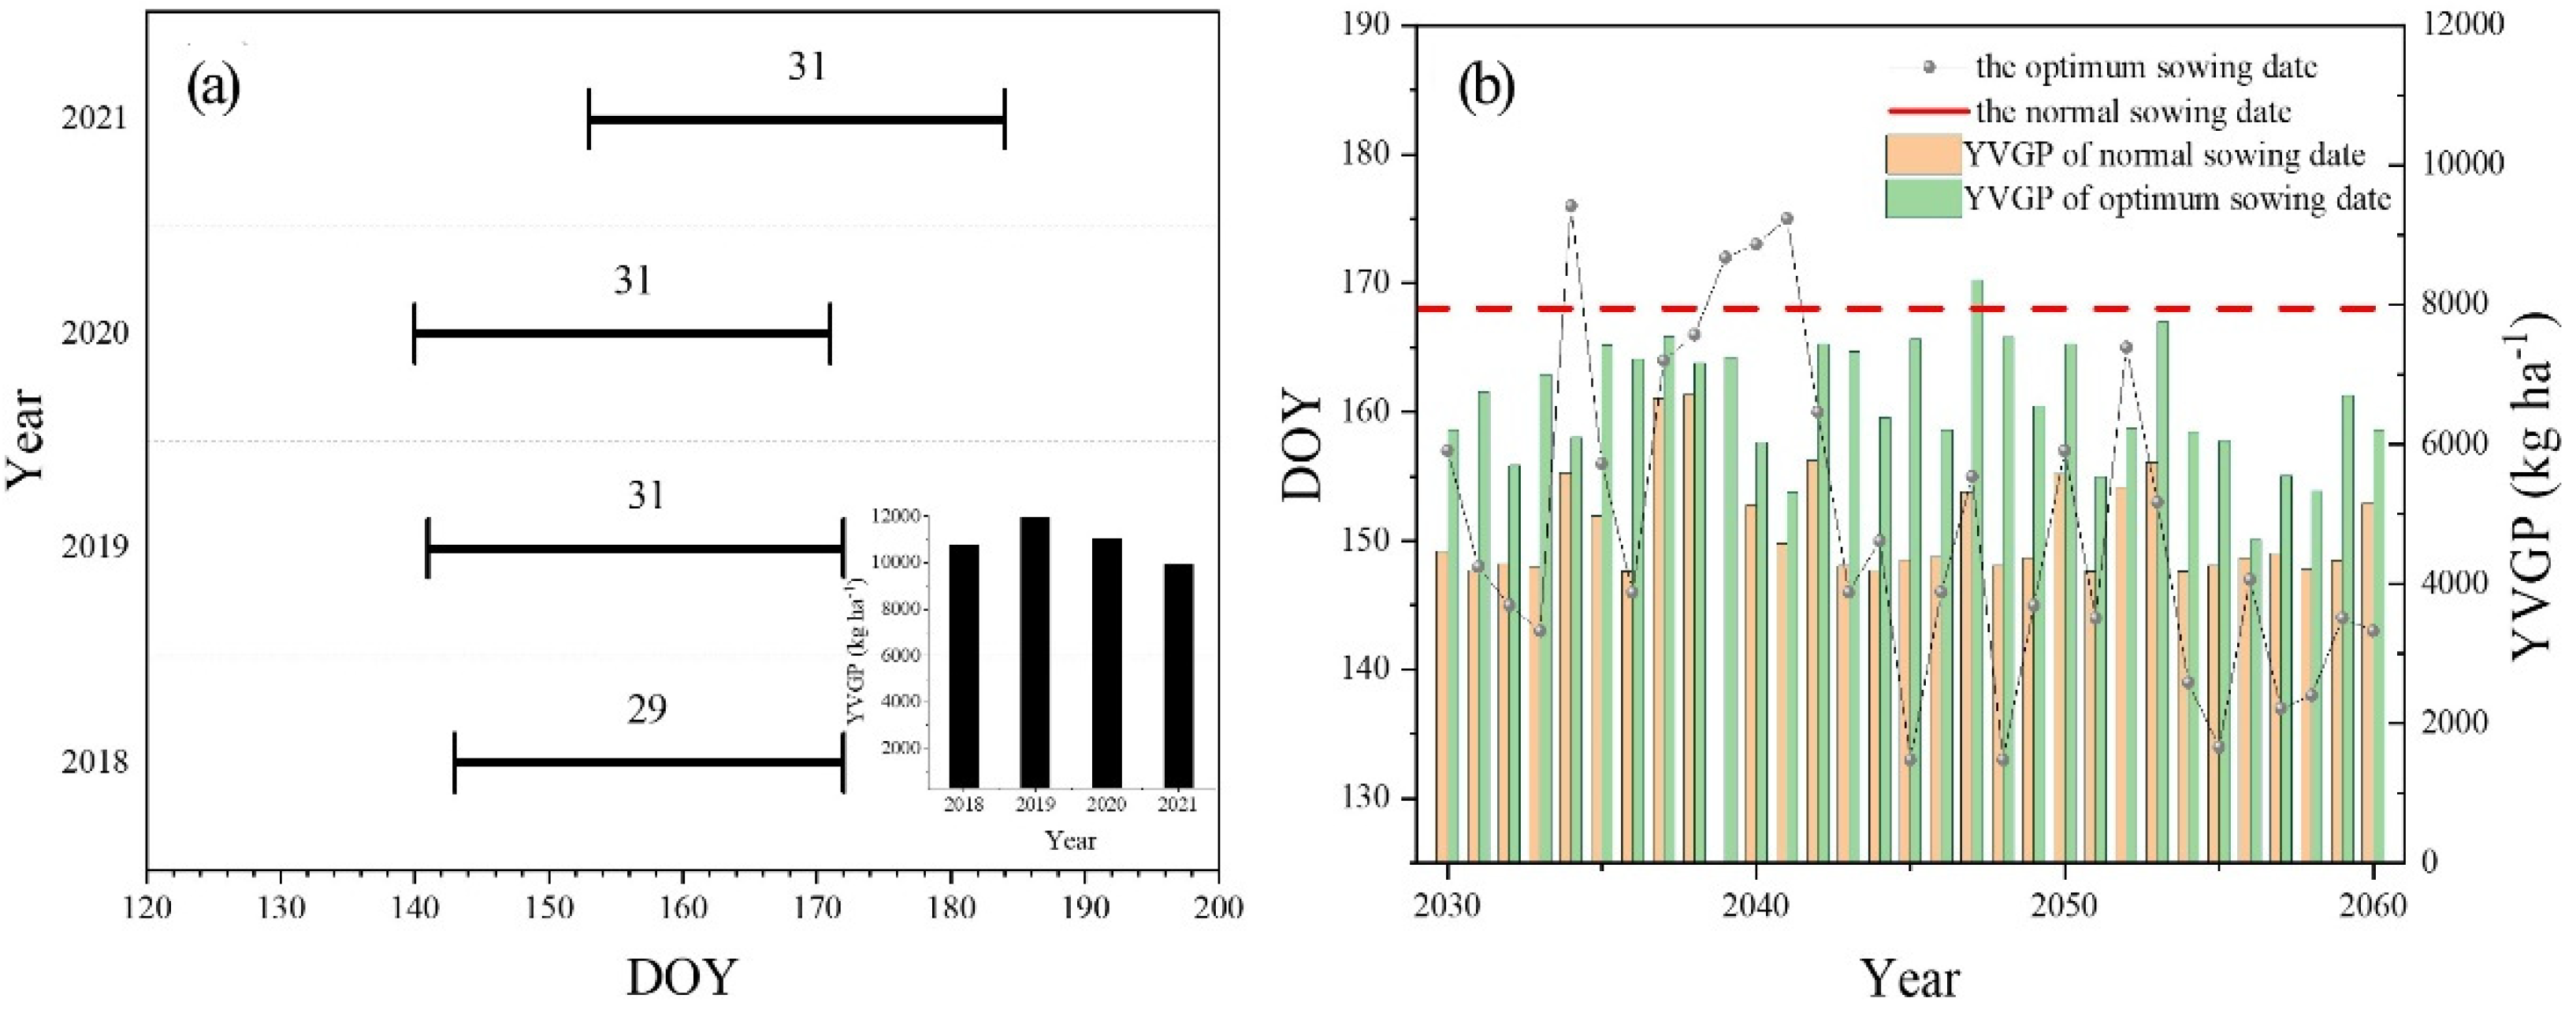
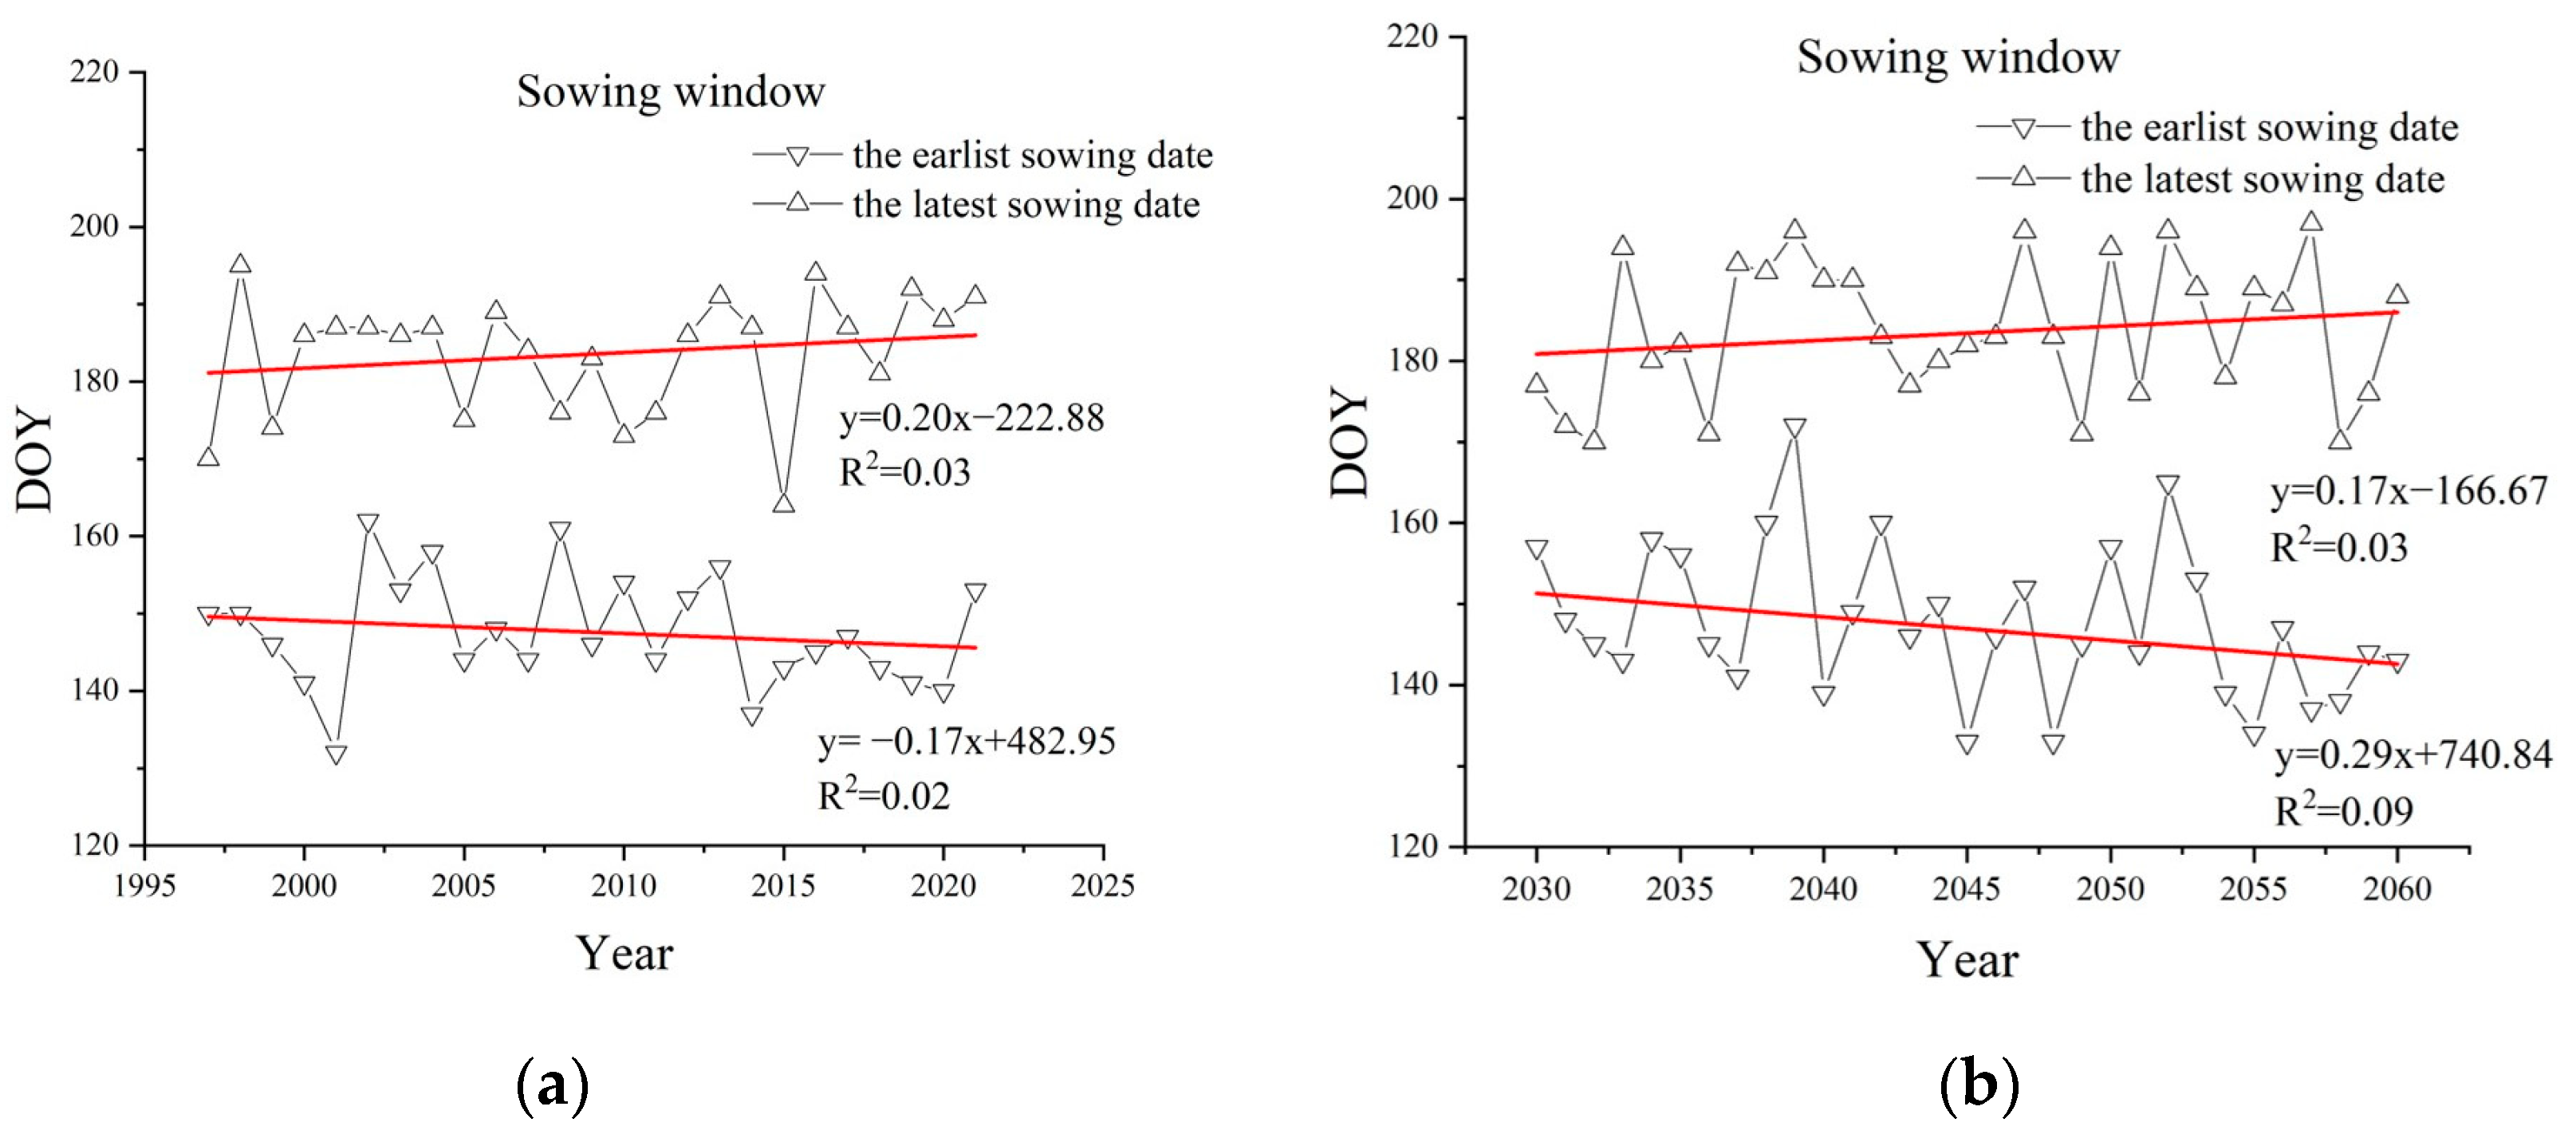
3.4. Analysis of Suitable Sowing Date of Maize

It was found that the effects of light and temperature at different growth stages on the theoretical yield of maize were YVGP > YRGP > YVRP. Therefore, starting from the initial day when the annual mean daily temperature is ≥10 °C, the window of the VGP can be determined in advance. This is performed by iterating the date backward day-by-day, until the day when the effective accumulated temperature of a certain stage meets the minimum developmental requirement and the light-temperature potential yield level, and the development rate reaches the maize growth conditions (Equations (12) and (14)). Further, to identify the window of the RGP and to find the last 1 d that meets the minimum temperature of 15 °C for maize growth as the end point, starting from the last 1 d of each year, the date can be iterated forward day-by-day until the conditions of light-temperature and growth rate in the RGP are satisfied (Equations (18)–(20)); since there was no significant change in the duration of the VRP that lasted for 26–30 d and the response of the theoretical yield to the potential yield of the VRP was not obvious, the average number of development days of 28 d was considered the duration of the VRP. According to the above simulated values, the range of suitable sowing date was identified together. The results showed that the error between the fitting value of days during the VGP and the measured value was within ±0–5 d (Table 3), and since the measured and simulated light-temperature potential yield of VGP were distributed around the 1:1 line from 2018 to 2021 (Figure 5), the overall accuracy was considered to be reliable. Thus, we can further confirm the growth period window.
Because the theoretical yield of maize and the YVGP showed a very significant positive correlation, the optimal sowing date in Gucheng was determined by the sowing date corresponding to the maximum light-temperature potential yield during the VRP in this study. The prediction of the optimum sowing date of maize is shown in Figure 6a. The results showed that the optimum sowing date and duration of the VGP differed among various years. The optimal sowing dates from 2018 to 2021 were 143 d, 141 d, 140 d, and 153 d, respectively, and the durations of the VGP were 29 d, 31 d, 31 d, and 31 d, respectively. The light-temperature potential yield in the VGP was the highest at the optimal sowing date in 2019, at 11,974.35 kg ha−1 and the lowest at the optimal sowing date in 2021 at 9936.00 kg ha−1. Under the climate warming scenario of SSP2-4.5, the optimum sowing date is about 10–15 days earlier than the current normal sowing date (S2) during the mid-21st century (2030–2060). However, due to the low average daily temperature of 2023, the normal sowing date is not suitable for maize cultivation (Figure 6b). It’s necessary to delay the sowing date to ensure the growth and development of maize. By comparing the light-temperature yield potential of the VGP on different sowing dates, it was found that the highest light-temperature yield potential could not be reached at the normal sowing date. The light-temperature yield potential of the VGP was significantly higher after the adjusted sowing date (green columns) than that during the normal sowing date (yellow columns). The simulation was based on historical meteorological data from 1997 to 2021 (Figure 7a) and the future meteorological data under the scenario of SSP2-4.5(Figure 7b); we found that there was a difference in performance between the earliest sowing date and the latest sowing date. The overall performance was that the advance of the earliest sowing date and the postponement of the latest sowing date, while the suitable sowing window increased slightly.

4. Discussion

4.1. Sowing Date affects Maize Growth Stage by Changing the Availability of the Light and Temperature Resources

The VGP of maize in the North China Plain is generally from May to July, which is a period of temperature increase. With the delay in the sowing date under well-watered conditions, the development rate was accelerated; as the daily average temperature increased, the VGP shortened, and the duration of the WG shortened [37]. In addition, the duration of the VRP also decreases with a reduction in photosynthesis [38]. In this study, the VGP duration was the shortest, whereas the WG duration was the longest when the sowing date was delayed by 20 d (S4). This result may be attributed to the lack of light and temperature at the grain-filling stage of the maize caused by late sowing, which could be compensated for by an increase in the length of the reproductive period to guarantee normal grain filling, ultimately lengthening the duration of the RGP. With a delay in the sowing date, the distribution proportion of the different growth stages of maize shifted from vegetative growth to reproductive growth.

4.2. VGP had a Stronger Effect on Maize Yield Than RGP

The availability of light and temperature resources at different growth stages is an internal factor that affects maize yield. In other words, the change in the sowing date did not completely explain the change in the maize yield. Different studies have reported variations in the effect of sowing dates on yield. With the delay in the sowing date, the maize yield and yield components showed a decreasing trend [39]. In the North China Plain, maize yield showed a trend of first increasing and then decreasing, and there was no significant relationship between the sowing date and the yield components (number of ears, kernels per ear, and thousand-kernel weight) [29]; although the grain number is strongly affected by abiotic stress [40], the sowing date did not have a significant effect on the yield, and the explanation rate of yield variation was low [19]. In addition to inter-annual variations in climate, grain yield strongly depends on intra-annual climatic conditions, particularly during the key periods of the growth season [41]. It was found that the effect of weather conditions is more pronounced during the RGP than during the VGP. Climate extremes severely impact the RGP [21], and changes in the frequency and intensity of extreme temperatures may have an extreme effect on crop development and agricultural systems during the RGP [42]. However, other studies have observed that the VGP is more susceptible to high-temperature stress than the RGP, reporting a decrease in the grain number of panicles and the yield of rice under heat stress [26]. A possible reason behind the different results is that different cultivars have different susceptibilities to climate change [43]. Although the VGP and RGP were equally important for maize growth, the effect of the former was more pronounced on the yield. In general, the magnitude of the influence of light and temperature on the yield differed between regions, and the effects of climatic resources were entirely different across different varieties, even within the same area. The effective accumulated temperature limits the yield of early-maturing varieties compared to that of late-maturing varieties [23]. Given the complexity of the crop growth process, agriculture has faced and continues to face the ongoing challenges of climate change.

4.3. Measures for Adapting Maize Production to Climate Change

Studies have shown that the grain yield of maize can be increased by early sowing [44]. This study showed that 20 May to 25 May was the optimum sowing date for maize in the Gucheng region. However, the optimum sowing period should not be applied to all types of maize in different regions, as it may change owing to climatic conditions, cropping systems, maize varieties, and maturity in specific regions. The simulation of sowing dates from 2030 to 2060 is based on the simulation results under the SSP2-4.5 scenario. Since it is not possible to accurately predict future economic, policy, and demographic changes in Gucheng, the model chosen is only subject to climate change under specific conditions, which may skew the predictions. This study was based on planting areas that were under the winter wheat–summer maize rotation. To a certain extent, adjusting the sowing date could ease the effect of crop rotation, providing a window for the wheat–maize rotation and increasing the annual grain yield. This present study has only considered how to adjust the sowing date to increase the maize yield. In fact, to ensure a high and stable yield in different sowing periods, the suitable sowing period of winter wheat after maize maturity should also be taken into consideration. The conclusion is that the maize sowing window widened, but the variety changes and interannual nitrogen fertilizer application were not taken into account in this study. Farmers usually determine the sowing date according to specific conditions. The effects of agronomic measures, nitrogen management, and variety improvement should be comprehensively studied in future studies to provide better data for increasing maize production in North China.

4.4. Future Scope of Research

China’s corn belt is mostly distributed in narrow areas moving from northeast to southwest, where the terrain and landform are complex, the differences in regional climate are evident. There is a variation in the intensity of climate change in different regions, so its impact on maize varies as well. Therefore, it’s noteworthy that studies like ours could have different results depending on the latitude. In addition, the maize variety may also play an important role in the yield. An early sowing date is beneficial to the long-season varieties; it’s desirable to be able to be tolerant of relatively low temperatures that can occur after sowing. Moreover, the impact of extreme events needs to be considered comprehensively. Future studies will be needed to estimate the impact of climate variations on maize yield at the regional scale and the interactive effectiveness of adjusting the sowing date and altering the cultivar.

5. Conclusions

Changing the sowing date affects the light-temperature resource allocation at different growth stages. This will surely lead to changes in the development and growth rates of maize and, in turn, influence the duration of the different developmental stages. The present study demonstrated that the light-temperature potential productivity during the WG of maize is exponentially related to the theoretical yield. The minimum required light-temperature potential yield was 14,614.95 kg ha−1 and the maximum theoretical yield was approximately 18,052.56 kg ha−1. The VGP had a dominant effect on the yield. Under the background of climate warming, we found that the sowing time window in Gucheng may widen, and appropriate advanced sowing dates could ensure successful vegetative growth of maize and increase yield.

Author Contributions

Conceptualization, G.Z. and Y.W.; methodology, G.Z.; software, Y.W.; validation, Y.W. and S.R.; formal analysis, Y.W. and H.Z.; investigation, Y.S. and S.R.; resources, J.G.; data curation, Y.S., J.G., H.Z. and X.S.; writing—original draft preparation, Y.W.; writing—review and editing, G.Z., Y.S., S.R., H.Z. and X.S.; visualization, Y.W., G.Z. and Y.S.; project administration, G.Z.; funding acquisition, G.Z. All authors have read and agreed to the published version of the manuscript.

Funding

This work is supported by National Natural Science Foundation of China (No. 42130514), the program of China Meteorological Administration (CXFZ2022J051), and the Basic Research Fund of Chinese Academy of Meteorological Sciences (2020Z004, 2022Y015).

Institutional Review Board Statement

Not applicable.

Informed Consent Statement

Not applicable.

Data Availability Statement

Not applicable.

Acknowledgments

The authors would like to thank the editor and reviewers for their assistance and valuable comments.

Conflicts of Interest

The authors declare no conflict of interest.

References

  1. National Bureau of Statistics of China. China Statistical Yearbook; China Statistic Press: Beijing, China, 2021. (In Chinese)
  2. United Nation, Department of Economic and Social Affairs, P.D. World Population Prospects 2022: Ten Key Messages. Available online: https://population.un.org/wpp/Publications (accessed on 30 July 2022).
  3. IPCC. Climate Change 2021: The Physical Science Basis. Contribution of Working Group I to the Sixth Assessment Report of the Intergovernmental Panel on Climate Change; Cambridge University Press: Cambridge, UK, 2021.
  4. Duan, J.; Yuan, J.; Xu, X.; Ju, H. Interpretation of the IPCC AR6 report on agricultural systems. Clim. Chang. Res. 2022, 18, 1673–1719. (In Chinese) [Google Scholar]
  5. Kamali, B.; Abbaspour, K.C.; Wehrli, B.; Yang, H. Drought vulnerability assessment of maize in Sub-Saharan Africa: Insights from physical and social perspectives. Glob. Planet. Chang. 2018, 162, 266–274. [Google Scholar] [CrossRef] [Green Version]
  6. Heim, R.R. A Comparison of the Early 21st Century Drought in the USA to the 1930s and 1950s Drought Episodes. Bull. Am. Meteorol. Soc. 2017, 98, 2579–2592. [Google Scholar] [CrossRef]
  7. Zhang, J.; Liu, Y. Decoupling of impact factors reveals the response of cash crops phenology to climate change and adaptive management practice. Agr. For. Meteorol. 2022, 322, 109010. [Google Scholar] [CrossRef]
  8. Yan, P.; Chen, Y.; Sui, P.; Vogel, A.; Zhang, X. Effect of maize plant morphology on the formation of apical kernels at different sowing dates and under different plant densities. Field Crop. Res. 2018, 223, 83–92. [Google Scholar] [CrossRef]
  9. Huang, M.; Shan, S.; Zhou, X.; Chen, J.; Cao, F.; Jiang, L.; Zou, Y. Leaf photosynthetic performance related to higher radiation use efficiency and grain yield in hybrid rice. Field Crop. Res. 2016, 193, 87–93. [Google Scholar] [CrossRef]
  10. Nasim, W.; Belhouchette, H.; Ahmad, A.; Habib-Ur-Rahman, M.; Jabran, K.; Ullah, K.; Fahad, S.; Shakeel, M.; Hoogenboom, G. Modelling climate change impacts and adaptation strategies for sunflower in Pakistan. Outlook Agric. 2016, 45, 39–45. [Google Scholar] [CrossRef]
  11. Zhang, Y.; Zhang, L.; Yang, N.; Huth, N.; Wang, E.; van der Werf, W.; Evers, J.B.; Wang, Q.; Zhang, D.; Wang, R.; et al. Optimized sowing time windows mitigate climate risks for oats production under cool semi-arid growing conditions. Agr. For. Meteorol. 2019, 266–267, 184–197. [Google Scholar] [CrossRef]
  12. Xu, K.; Sun, Z.; Huo, Z.Y.; Dai, Q.G.; Zhang, H.C.; Liu, J.; Song, Y.S.; Yang, D.L.; Wei, H.Y.; Wu, A.G.; et al. Effects of Seeding Date and Variety Type on Yield, Growth Stage and Utilization of Temperature and Sunshine in Rice. Sci. Agric. Sin. 2013, 46, 4222–4233. (In Chinese) [Google Scholar] [CrossRef]
  13. Owusu, E.S.; Bravo-Ureta, B.E. Reap when you sow? The productivity impacts of early sowing in Malawi. Agr. Syst. 2022, 199, 103412. [Google Scholar] [CrossRef]
  14. Zhong, X.Y.; Li, Q.P.; Yang, F.; Chen, D.; He, L.H.; Yang, Z.P.; Wu, Z.Y.; Lu, H.; Li, Z.Z.; Zeng, Y.L. Higher solar radiation and lower temperature enhance biomass production and grain yield of rice under high-altitude condition. Arch. Agron. Soil Sci. 2021, 68, 1664–1680. [Google Scholar] [CrossRef]
  15. Amas, J.I.; Fernandez, J.A.; Curin, F.; Cirilo, A.G.; Ciampitti, I.A.; Otegui, M.E. Maize genetic progress in the central Pampas of Argentina: Effects of contrasting sowing dates. Field Crop. Res. 2022, 281, 108492. [Google Scholar] [CrossRef]
  16. Wang, J.; Wang, E.; Yang, X.; Zhang, F.; Yin, H. Increased yield potential of wheat-maize cropping system in the North China Plain by climate change adaptation. Clim. Chang. 2012, 113, 825–840. [Google Scholar] [CrossRef]
  17. Collins, B.; Chenu, K. Improving productivity of Australian wheat by adapting sowing date and genotype phenology to future climate. Clim. Risk Manag. 2021, 32, 100300. [Google Scholar] [CrossRef]
  18. Liu, Z.; Hubbard, K.G.; Lin, X.; Yang, X. Negative effects of climate warming on maize yield are reversed by the changing of sowing date and cultivar selection in Northeast China. Glob. Chang. Biol. 2013, 19, 3481–3492. [Google Scholar] [CrossRef] [PubMed]
  19. Zhu, G.; Liu, Z.; Qiao, S.; Zhang, Z.; Huang, Q.; Su, Z.; Yang, X. How could observed sowing dates contribute to maize potential yield under climate change in Northeast China based on APSIM model. Eur. J. Agron. 2022, 136, 126511. [Google Scholar] [CrossRef]
  20. Lv, Z.; Li, F.; Lu, G. Adjusting sowing date and cultivar shift improve maize adaption to climate change in China. Mitig. Adapt. Strateg. Glob. Chang. 2019, 25, 87–106. [Google Scholar] [CrossRef]
  21. Guo, Y.; Lu, X.; Zhang, J.; Li, K.; Tong, Z. Joint analysis of drought and heat events during maize (Zea mays L.) growth periods using copula and cloud models: A case study of Songliao Plain. Agr. Water Manag. 2022, 259, 107238. [Google Scholar] [CrossRef]
  22. Sharma, R.C. Duration of the vegetative and reproductive period in relation to yield performance of spring wheat [vegetative growth period, grain filling period]. Eur. J. Agron. 1992, 1, 133–137. [Google Scholar] [CrossRef]
  23. Chen, J.; Ren, B.; Zhao, B.; Liu, P.; Yang, J. Determination on Suitable Sowing Date of Summer Maize Hybrids Based on Effective Accumulated Temperature in Growth Period. Agric. Sin. 2021, 54, 3632–3646. (In Chinese) [Google Scholar] [CrossRef]
  24. Zhan, W.; Zhang, J.; Yuan, J.; Liang, Y.; Cheng, S.; Zhang, S.; Ren, J.; Liu, J.; Cai, H. Adjusting sowing dates enhance the efficiency of climate and nutrient resources for spring maize. J. Plant Nutr. Fertil. 2021, 27, 1725–1734. (In Chinese) [Google Scholar] [CrossRef]
  25. Shao, R.X.; Kang-Ke, Y.U.; Hong-Wei, L.I.; Jia, S.J.; Yang, Q.H.; Zhao, X.; Zhao, Y.L.; Liu, T.X. The effect of elevating temperature on the growth and development of reproductive organs and yield of summer maize. J. Integr. Agr. 2021, 259, 107238. [Google Scholar] [CrossRef]
  26. Cheabu, S.; Moung-Ngam, P.; Arikit, S.; Vanavichit, A.; Malumpong, C. Effects of Heat Stress at Vegetative and Reproductive Stages on Spikelet Fertility. Rice Sci. 2018, 25, 218–226. [Google Scholar] [CrossRef]
  27. Shao, R.; Jia, S.; Tang, Y.; Zhang, J.; Zhao, X. Soil water deficit suppresses development of maize ear by altering metabolism and photosynthesis. Environ. Exp. Bot. 2021, 192, 104651. [Google Scholar] [CrossRef]
  28. Ataur, R.M.; Jiro, C.; Satoshi, Y.; Ajms, K. Growth and yield components of wheat genotypes exposed to high temperature stress under control environment. Bangladesh J. Agric. Res. 2009, 34, 360–372. [Google Scholar] [CrossRef] [Green Version]
  29. Tian, B.; Zhu, J.; Nie, Y.; Xu, C.; Meng, Q.; Wang, P. Mitigating heat and chilling stress by adjusting the sowing date of maize in the North China Plain. J. Agron. Crop. Sci. 2019, 205, 77–87. [Google Scholar] [CrossRef] [Green Version]
  30. Zhou, H.; Zhou, G.; He, Q.; Zhou, L.; Ji, Y.; Zhou, M. Environmental explanation of maize specific leaf area under varying water stress regimes. Environ. Exp. Bot. 2020, 171, 103932. [Google Scholar] [CrossRef]
  31. Angstrom, A. Solar and terrestrial radiation. Report to the international commission for solar research on actinometric investigations of solar and atmospheric radiation. Q. J. R. Meteorol. Soc. 2010, 50, 121–126. [Google Scholar] [CrossRef]
  32. He, Q.H.; Xie, Y. Research on the Climatological Method of Solar Radiation in China. J. Nat. Resour. 2010, 25, 308–319. (In Chinese) [Google Scholar] [CrossRef]
  33. Tymvios, F.S.; Jacovides, C.P.; Michaelides, S.C.; Scouteli, C. Comparative study of ngstrm’s and artificial neural networks’ methodologies in estimating global solar radiation. Sol. Energy 2005, 78, 752–762. [Google Scholar] [CrossRef]
  34. Han, R.Q.; Zheng, D.; Dai, E.F.; Wu, S.H. Response of Production Potential to Climate Fluctuation in Major Grain Regions of China. Resour. Sci. 2014, 36, 2611–2623. (In Chinese) [Google Scholar]
  35. Hou, G.L.; Liu, Y.F. Climate potential productivity and its partition in China. J. Nat. Resour. 1985, 3, 52–59. (In Chinese) [Google Scholar]
  36. Shen, G.Q. Model of nonlinearity temperature on developing rate of crops. Meteorol. Mon. 1980, 31, 9–11. (In Chinese) [Google Scholar] [CrossRef]
  37. Li, Z.; Yang, P.; Tang, H.; Wu, W.; Yin, H.; Liu, Z.; Zhang, L. Response of maize phenology to climate warming in Northeast China between 1990 and 2012. Reg. Environ. Chang. 2013, 14, 39–48. [Google Scholar] [CrossRef]
  38. Ioslovich, I.; Gutman, P.O. On the botanic model of plant growth with intermediate vegetative-reproductive stage. Popul. Biol. 2005, 68, 147–156. [Google Scholar] [CrossRef] [PubMed]
  39. Han, H.; Zhang, L.; Sun, M.; Li, J.; Chang, X.; Guo, Z.J.; Wang, X.F. Response of Growth, Development and Yield of Different Summer Maize Cultivars to Sowing Date in Huang-Huai-Hai Plain. J. Maize Sci. 2020, 28, 106–114. (In Chinese) [Google Scholar] [CrossRef]
  40. Gao, Z.; Feng, H.Y.; Liang, X.G.; Lin, S.; Zhou, S.L. Adjusting the sowing date of spring maize did not mitigate against heat stress in the North China Plain. Agr. For. Meteorol. 2021, 298–299, 108274. [Google Scholar] [CrossRef]
  41. Addy, J.; Ellis, R.H.; Macdonald, A.J.; Semenov, M.A.; Mead, A. Changes in agricultural climate in South-Eastern England from 1892 to 2016 and differences in cereal and permanent grassland yield. Agr. For. Meteorol. 2021, 308–309, 108560. [Google Scholar] [CrossRef]
  42. Talukder, A.S.M.H.M.; McDonald, G.K.; Gill, G.S. Effect of short-term heat stress prior to flowering and at early grain set on the utilization of water-soluble carbohydrate by wheat genotypes. Field Crop. Res. 2013, 147, 1–11. [Google Scholar] [CrossRef]
  43. Anwar, M.R.; Liu, D.L.; Farquharson, R.; Macadam, I.; Abadi, A.; Finlayson, J.; Wang, B.; Ramilan, T. Climate change impacts on phenology and yields of five broadacre crops at four climatologically distinct locations in Australia. Agr. Syst. 2015, 132, 133–144. [Google Scholar] [CrossRef] [Green Version]
  44. Zou, J.; Cui, Z.; Xu, Y.; Zhu, X. Comparison of Grain Dehydration Process and Yield Formation for Summer Maize under Different Sowing Dates in Huanghuaihai Plain. Chin. J. Agrometeorol. 2022, 43, 112–123. (In Chinese) [Google Scholar] [CrossRef]
Figure 1. Meteorological conditions at the study site from 2018 to 2021. (a) The red line represents daily maximum temperature; blue line, daily average temperature; and black line, minimum temperature; the grey bars represent average solar radiation. (b) An accumulated temperature of ≥10 °C and (c) total solar radiation during the growth period. Grey bars from shallow to deep represent the vegetative growth period (VGP), the vegetative and reproductive period (VRP), and the reproductive growth period (RGP).
Agronomy 13 00385 g001
Figure 2. Climate resource changes from 2015 to 2060. (a) The red circle represents mean annual maximum temperature; blue circle, mean annual temperature; and black circle, mean annual minimum temperature. (b) The black circle represents total annual solar radiation; the red line indicates the fitted trend line.
Agronomy 13 00385 g002
Figure 3. The duration of each growth stage for different sowing dates from 2018 to 2021 (a), where red, yellow, and blue represent the VGP, VRP, and RGP, respectively. Proportions of the durations of VGP (b), VRP (c), and RGP (d) to the duration of the WG period, respectively. Statistical significance is represented by asterisks (** p < 0.01).
Agronomy 13 00385 g003
Figure 4. Relationship between light-temperature potential yield and theoretical yield of maize at different growth stages (a1d1), representing the WG, VGP, VRP, and RGP, respectively; the shaded area indicates the 95% confidence interval. The influence of sowing date on theoretical yield is indicated by graphs of the relative changes in conventional sowing against theoretical yield (a2d2); red lines represent the fitted regression trend line. Statistical significance is represented by asterisks (** p < 0.01).
Agronomy 13 00385 g004
Figure 5. Measured and simulated values from 2018 to 2021. (a) Light-temperature potential yield; (b) average temperature during growth in the VGP; the red dotted line is the 1:1 line.
Agronomy 13 00385 g005
Figure 6. The optimum sowing date in different years and the light-temperature potential yield of VGP. (a) Line segment lengths indicate that the duration of the vegetative growth period (DVGP) at optimum sowing date and the black columns represent the light-temperature potential yield during 2018–2021. (b) The black circle indicates the optimum sowing date during 2030–2060, the red dotted line indicates the normal sowing date, and the yellow and green columns denote the light-temperature potential yield in normal and optimum sowing dates, respectively.
Agronomy 13 00385 g006
Figure 7. Suitable sowing window of maize in different years, (a) 1997–2021, (b) 2030–2060.
Agronomy 13 00385 g007
Table 1. The empirical value of three critical points of temperature at different growth stages of maize.
Development StageThree Critical Points of Temperature (°C)
TminTopTmax
Sowing-jointing102532
Jointing-heading102735
Heading-maturity152332
Table 2. Relationship between light-temperature resources and duration of growth stages of maize.
Development Stage ModelSample SizesDetermination CoefficientSequence Number
Vegetative growth period Y p = 82.89 n 2 3314.8 n + 37303 160.81 **(12)
T = 20.053 n + 153.19 160.80 **(13)
1 n = 0.0065 T 0.1309 160.80 **(14)
Vegetative and reproductive period Y p = 11.14 n 2 + 980.59 n 10516 160.51 *(15)
T = 20.289 n + 185.53 160.67 **(16)
1 n = 0.0054 T 0.1093 160.67 **(17)
Reproductive growth period Y p = 23.656 n 2 + 1511.6 n 14585 140.43 *(18)
A T = e 11.005 ( T 15 ) 0.5 ( 32 T ) 1 + 0.9915 140.73 **(19)
1 n = 1 e 11.005 ( T 15 ) 1.5 ( 32 T ) 1.9915 140.73 **(20)
Note: Statistical significance is represented by asterisks (* p < 0.05, ** p < 0.01); n is the duration in days; T is the daily mean temperature during the stage of the “n”; Yp represents the light-temperature potential yield; T is the active accumulated temperature, A(T) is the effective accumulated temperature, and 1/n is the development rate.
Table 3. Simulated and measured values of the durations of the vegetative growth period (VGP).
Year Sowing Date (DOY)Actual Duration
(d)
Simulated Duration (d)Difference Value (d)YearSowing Date (DOY)Actual Duration
(d)
Simulated Duration (d)Difference Value (d)
201815825223202015926215
1682222016925223
1782327−41792325−2
1882225−31892223−1
20191582621520211582728−1
1682521416826251
1782221117823212
1882020018822211
Disclaimer/Publisher’s Note: The statements, opinions and data contained in all publications are solely those of the individual author(s) and contributor(s) and not of MDPI and/or the editor(s). MDPI and/or the editor(s) disclaim responsibility for any injury to people or property resulting from any ideas, methods, instructions or products referred to in the content.

