Abstract
In the field of precision agriculture research, it is very important to monitor crop growth in time so as to effectively conduct field diagnosis and management and accurately predict yield and quality. In this experiment, the relationship between the vegetation index of Zhengdan 958 and Suyu 41 and their yield and quality when reducing N application (25 and 50% N reduction compared to local conventional N application rate) under low, medium and high planting densities (60,000, 75,000 and 90,000 plants·ha−1) during 2018–2020 was investigated using multispectral images obtained from UAV monitoring. The results showed that under different density treatments, the normalized vegetation index (NDVI) and ratio vegetation index (RVI) decreased with the decrease in nitrogen application, while the plant senescence reflectance index (PSRI) increased. Through principal component analysis (PCA) and subordinate function analysis, the comprehensive score of each treatment can reflect the maize yield and total protein content under each treatment. Based on the vegetation index, predictive models of maize yield and protein content were established. The best prediction period for grain yield and protein content were physiological maturity and 35 days after silking (R4), respectively. The R2 of the predictive models are greater than 0.734 and 0.769, respectively. Multi-period and multi-vegetation indexes can better monitor crop growth and help agricultural field management.
1. Introduction
Maize is a multifunctional crop integrating grain and forage crops. In China, approximately 70% of the maize is used as feed [1]. However, with the continuous improvement in maize yield, the protein content of hybrids decreased gradually, which greatly reduced the feed efficiency [2]. It is essential to improve the grain yield and protein quality simultaneously to balance the demand for maize production. The main way to improve yield is to select density tolerant varieties and adopt high-density cultivation [3,4,5]. In addition, reasonable nitrogen (N) application is also important to the yield and quality of maize. Nevertheless, farmers used to apply excessive N fertilizer to increase the yield, which was not conducive to yield and quality improvement and led to resource waste [6]. Therefore, it is imperative to determine the suitable N and density combination to improve yield and maintain protein quality.
As a short-term crop, maize has a tall plant type, difficult sampling and poor representation in the field. When the micro-environment of crops alters, the vegetation coverage, biomass accumulation and translocation changes and the plant canopy reflection spectrum is also adjusted [7]. Existing research shows that the canopy reflectance spectra of plant leaves with different biochemical compositions is also different [8]. Different physical and chemical properties of crops will show different absorption of frequency doubling and frequency combination at the spectral level; thus we can use visible light and near-infrared spectroscopy to analyze the substance qualitatively or quantitatively [9]. Based on Unmanned Aerial Vehicle (UAV) multispectral images, the N status of crops can be monitored quickly and non-destructively, which is conducive to the fine management of crops [10]. High-throughput phenotypic analysis of crops can also be carried out according to the obtained plant height, canopy coverage and vegetation index, so as to indirectly estimate the physiological and environmental stress status of crops [11], which is of great significance for realizing agricultural precision, informatization and intelligence. Multispectral imaging technology is a new, rapid, nondestructive testing technology developed in recent years. It combines spectral information with imaging data, uses chemometrics technology to screen and model the data, and then constructs a fast, nondestructive, efficient and accurate evaluation method of the grain yield [12] and quality [13]. It can timely and effectively guide maize production and promote the development of maize production to precision. However, the accuracy of the predictive model established using single-band reflectance to monitor crop growth is not as good as that of the vegetation index [14] because the vegetation index not only weakens the influence of external environmental factors on spectral signals, but also contains information about canopy structure and material characteristics. The vegetation index has been used to predict nitrogen accumulation [15], crown-layer chlorophyll content [16] and leaf area index [17]. Previous studies have shown that NDVI, RVI, DVI and other vegetation indexes have a positive correlation with crop yield [18]. There is significant correlation between crop protein and some bands of the canopy spectrum [19]. In theory, yield and protein content can be estimated by spectral characteristics of these sensitive bands. Previous researchers have also established yield-prediction models using NDVI [20], RVI [21], DVI [22], and protein-content-prediction models using NDVI [23], RVI [24] and SIPI [25].
The subordinate function analysis is often used to evaluate crop resistance [26] and variety selection [27]. However, there are many indicators involved in the evaluation and there is a certain correlation between the indicators, so there are some limitations in the comprehensive evaluation of crops using only the subordinate function method [28]. Principal component analysis (PCA) is an analysis method that clusters multivariate data and reduces dimensions. The advantage of this analysis method is that many original indicators can be integrated into several relatively independent comprehensive indicators by taking advantage of the deep relationship between indicators. Therefore, following PCA, subordinate function analysis is more suitable for comprehensive evaluation. However, this assessment method is rarely used to assess crop growth among treatments. Therefore, this study tried to use this evaluation method to evaluate the difference in maize growth among treatments.
At present, most studies on monitoring maize yield and quality using UAV hyperspectral imaging technology are reflected by a single or several vegetation indexes [29]. Few studies have combined and synthesized these vegetation indexes as new indicators for monitoring maize yield and quality. ew studies have investigated the monitoring effect of UAV on maize yield and quality, taking into account the impact of cultivation measures. Therefore, we conducted a field experiment in 2019–2020. In this experiment, Zhengdan 958 and Suyu 41 were used as materials, and three planting densities of low, medium and high (60,000, 75,000 and 90,000 plants·ha−1) with conventional N application, N reduction by 25% and N reduction by 50% (300, 225 and 150 kg·ha−1) were set. The purpose of our study was to (1) determine the response effect of the vegetation index on maize growth, (2) analyze maize growth under different treatments by comprehensive scoring of the vegetation index, (3) explore the predictive effect of multispectral imaging on maize yield and protein content prediction, (4) expand the application scope and improve the precision of UAV monitoring of crop growth and (5) create a practical model for predicting the grain yield and protein content of summer maize.
2. Materials and Methods
2.1. Experimental Site
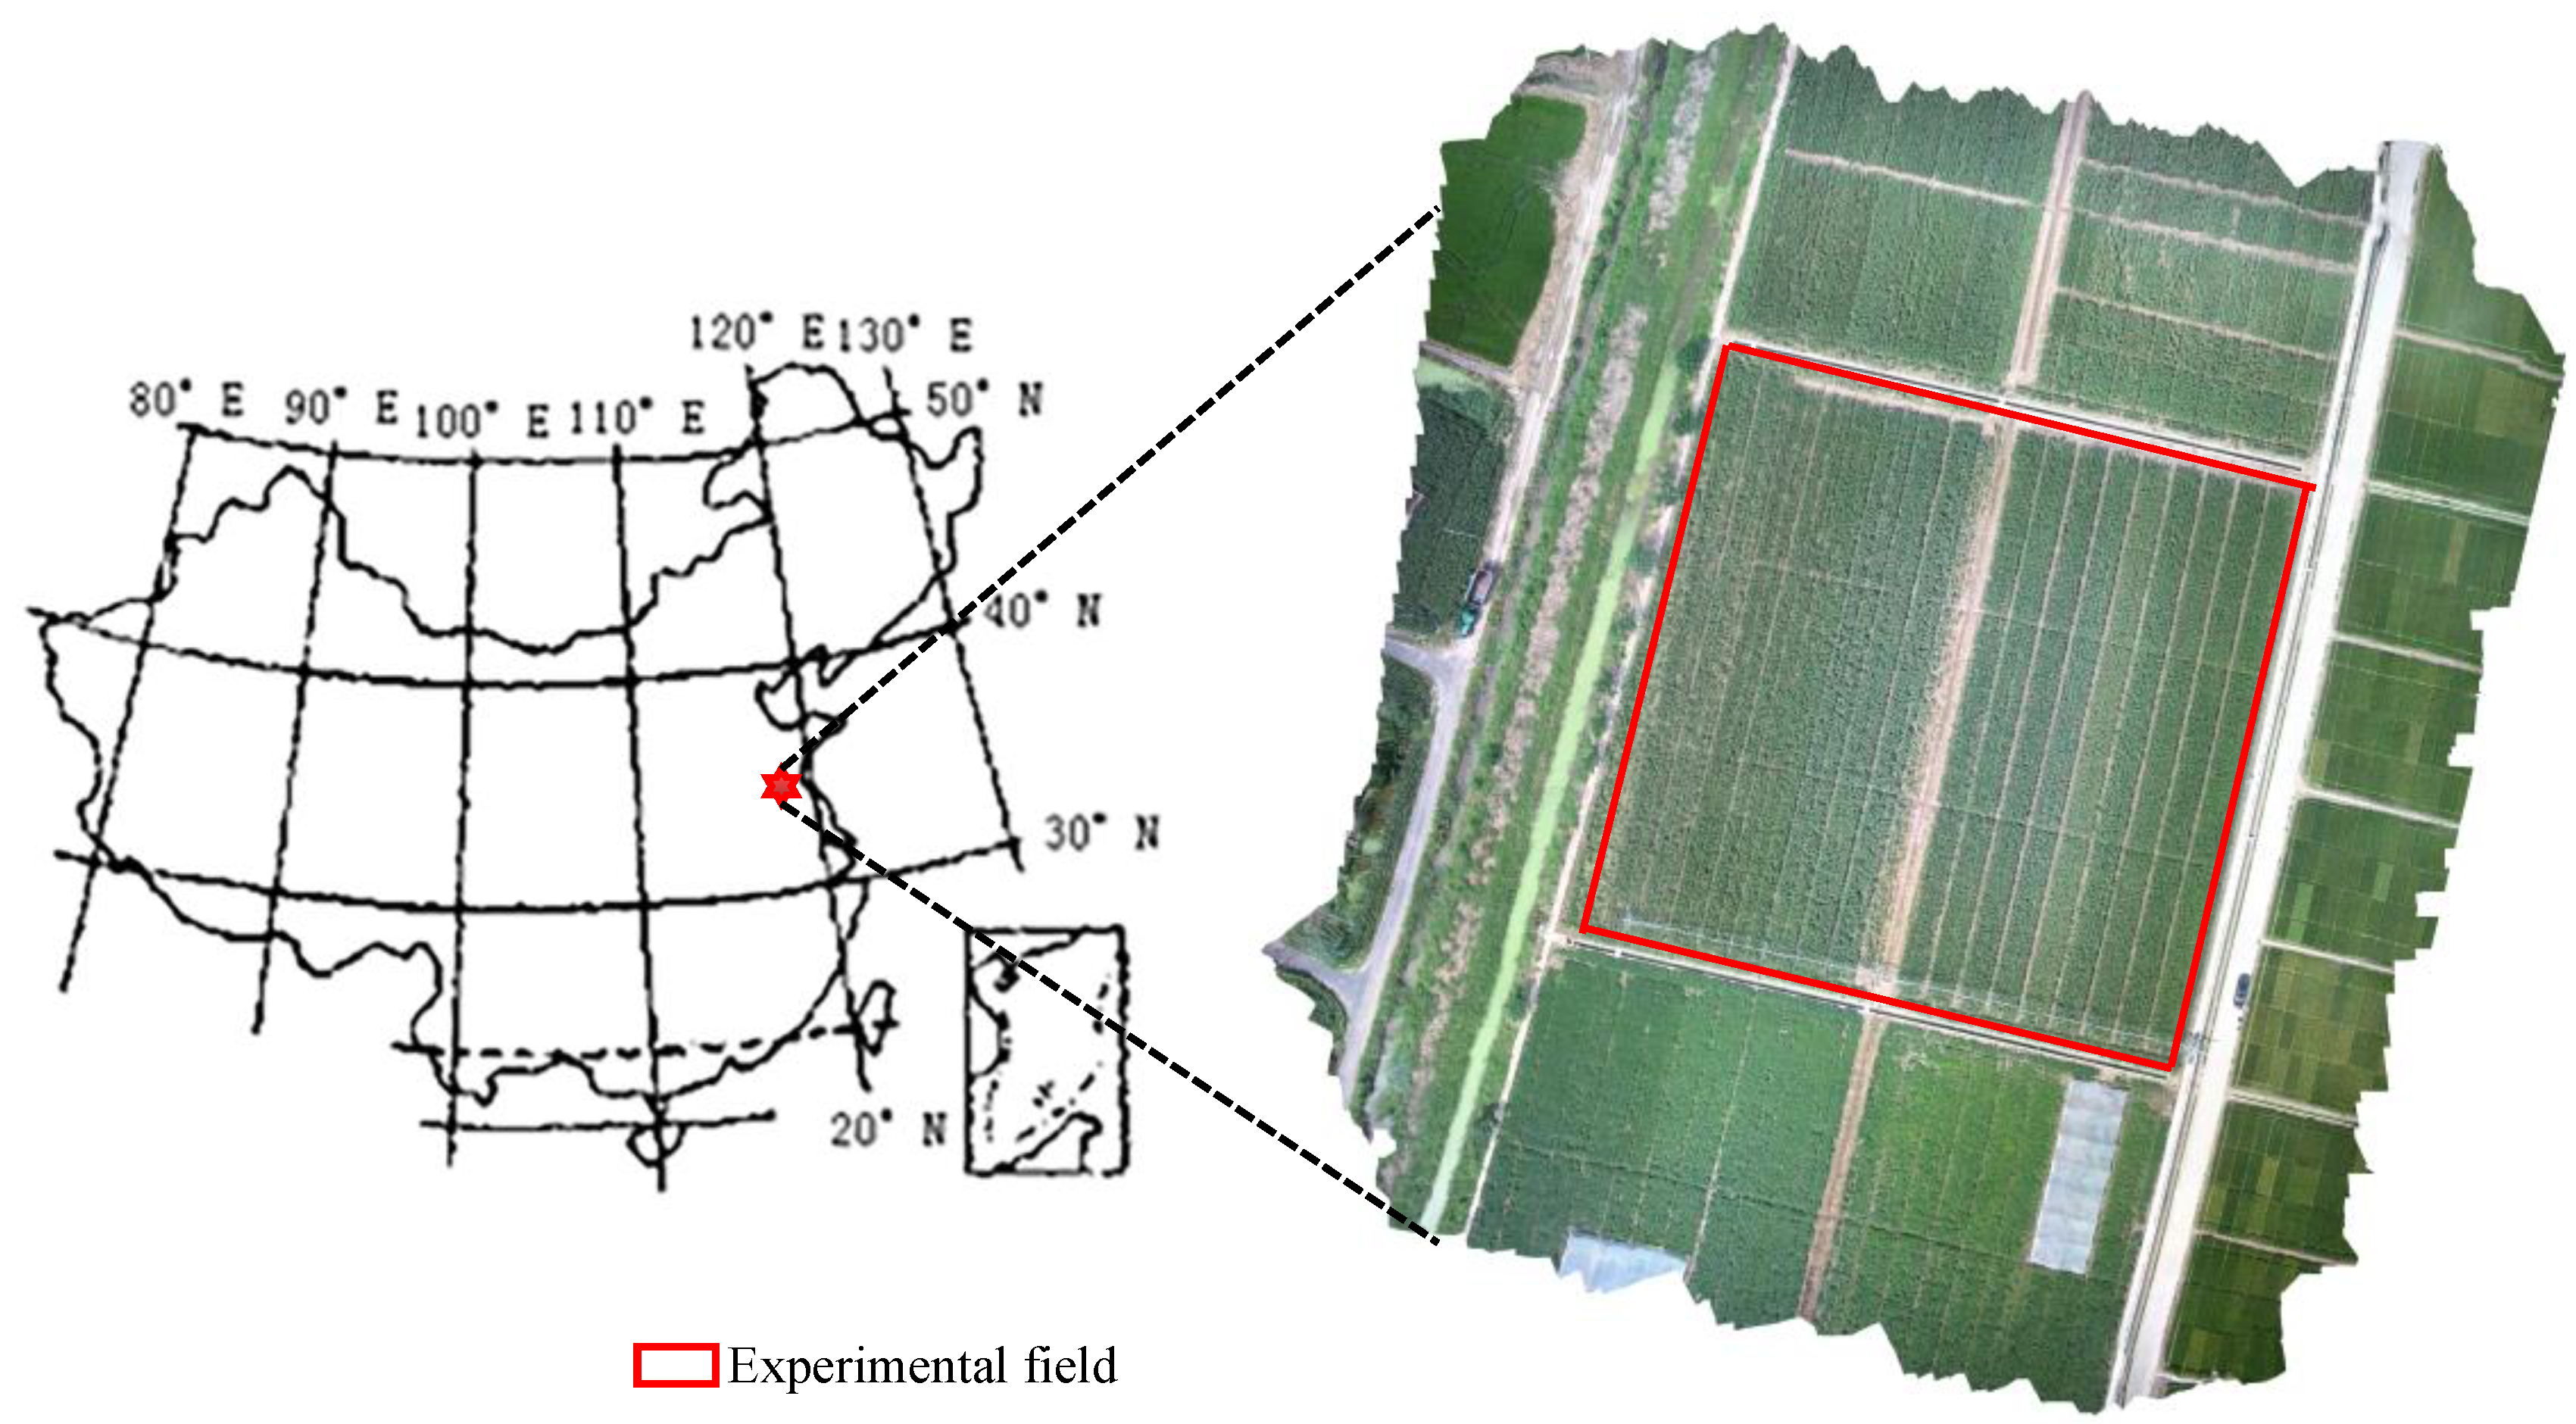
The field experiment was conducted in the Experimental Farm of Lianyungang Academy of Agricultural Sciences, Jiangsu Province, China (34.57° N, 119.32° E) from 2019 to 2020. The altitude of this area is 1 m. The average content of organic matter in the tillage layer was 10.2 g·kg−1 and the total nitrogen (N), rapid phosphorus (P), and rapid potassium (K) were 0.84 g·kg−1, 94.2 mg·kg−1 and 141.5 mg·kg−1, respectively. The available phosphorus and potassium were determined with molybdenum blue colorimetry and flame photometry, respectively. The type of soil is clay with a field capacity of 28%, PH of 7.3% and bulk density of 1.3 g/cm3. The total rainfall during the crop growth period was 257.45 mm and 437.2 mm in 2019 and 2020, respectively. The average temperature during the growth period in 2019 and 2020 was 25.5 °C and 22.7 °C, respectively. The location diagram of the test area is shown in Figure 1.
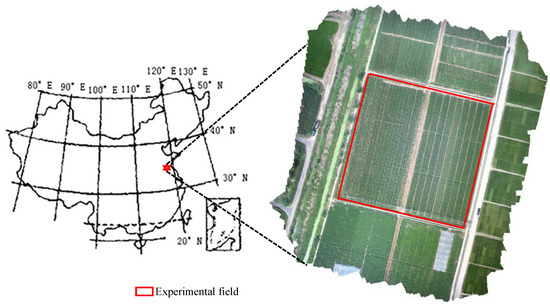
Figure 1.
Location of the study area, the Experimental Farm of Lianyungang (China).
2.2. Crop Management and Experimental Design
The maize varieties Zhengdan 958 and Suyu 41 were selected as experimental materials. They are erectophile maize hybrids that are suitable for dense planting. Their growth period was about 95–110 d in the test area. Their plant height is 230–240 cm, and the ear length is 18–20 cm. Both the two varieties are widely grown in Jiangsu Province. Three planting densities of low (local conventional density), medium and high (60,000, 75,000 and 90,000 plants·ha−1) and three nitrogen application levels of local conventional nitrogen (N) application, 25 and 50% N reduction compared with conventional N application (300, 225 and 150 kg·ha−1) were set. The experiment was sown at the end of June and harvested at the beginning of October every year. Due to the different weather conditions between years, the specific dates varied. The average moisture content of the grain at harvest was 25–30%. The forecrop was wheat. Before sowing, a compound fertilizer with N-P-K of 18%-18%-18% was applied in each plot. At the V6 and V12, urea was topdressing. The experiments were established in a split-plot design consisting of three replicates, with planting densities as the main plot and N rates as the sub-plot. The size of each subplot was 12.0 m × 5.0 m (rows spaced 60 cm apart) and the interval between each plot was 1 m. During the growth period, we ensured a good water supply, timely management of diseases, pests and weeds and a good growth environment for the plants.
2.3. Observations and Measurements
2.3.1. Grain Yield
Three rows of 5 m ears were harvested at maturity. The moisture was measured with a moisture meter and dried naturally. The GY was expressed at a moisture content of 14.0%.
2.3.2. Grain Protein Content
Grain samples were ground and then digested by adding 10 mL H2SO4-H2O2 to each sample. The N content of grain was measured using the semi-micro Kjedahl method (KjeltecTM 8200 Auto Distillation Unit, Foss, Hillerød, Denmark, Yuen and Pollard 1953; Bremner 1960). The grain protein content is determined by multiplying the nitrogen content by 6.25.
2.3.3. Multi-Spectral Data Acquisition
In this study, the Ecodroneuas-8 multi-spectral UAV (EcoDroneUAS-8) was used with a multispectral camera (rededge MX, Micasense, Raleigh, NCS, USA) for data acquisition (Table 1). The field test data were obtained at 14 days (R2) after silking, 35 days after silking (R4) and physiological maturity (R6). The flight time of the UAV was about 12:00 am, with good lighting conditions, no wind or breeze and no clouds. The UAV flew at 20 m, the heading overlap rate was 75% and the sideway overlap rate was 75%. Pix4dMapper software was used to Mosaic the UAV image, and the UAV digital orthophoto was obtained. The ENVI software was used to extract the data. The reflectivity values of the maize canopy in 5 bands were extracted through the processing and analysis of UAV multi-spectral images and the data were statistically analyzed. According to the band characteristics of multispectral sensors and the results of previous studies, several spectral indexes were calculated (Table 2).

Table 1.
Multispectral camera parameters.

Table 2.
Vegetation indexes, formulas, and references used in this study.
2.4. Statistical Analysis
Microsoft Excel 2013 and SigmaPlot 12.5 were used to process the test data and plot, and SPSS 20.0 was used for data statistics and analysis and significance analysis (LSD method).
The vegetation index value was used for principal component analysis (PCA) to evaluate the differences among the 9 treatments, and the final total score was calculated through the subordinate function analysis to represent the advantages and disadvantages of the treatment. Pearson correlation was calculated to determine the relationship between the score and its yield and protein content.
According to the subordinate function formula of fuzzy mathematics, the parameters and indicators in the test process are quantitatively transformed to obtain the subordinate function value, which is used to compare the yield and quality under different treatments. At present, subordinate function analysis is a common method to evaluate abiotic resistance, and it is calculated using the following formula [30,31]:
where u(Xj) is the subordinate function value of the j-th comprehensive indicator, Xj is the j-th comprehensive indicator value, Xmax is the maximum value of the j-th comprehensive indicator, and Xmin is the minimum value of the j-th comprehensive indicator.
where Wj is the index weight of the j-th comprehensive indicator among all comprehensive indicators and Pj is the contribution rate of the j-th comprehensive indicator.
where D is the comprehensive evaluation value of the different treatments. The higher the D value, the better the treatment; the lower the D value, the worse the treatment.
3. Results
3.1. Change in Vegetation Index
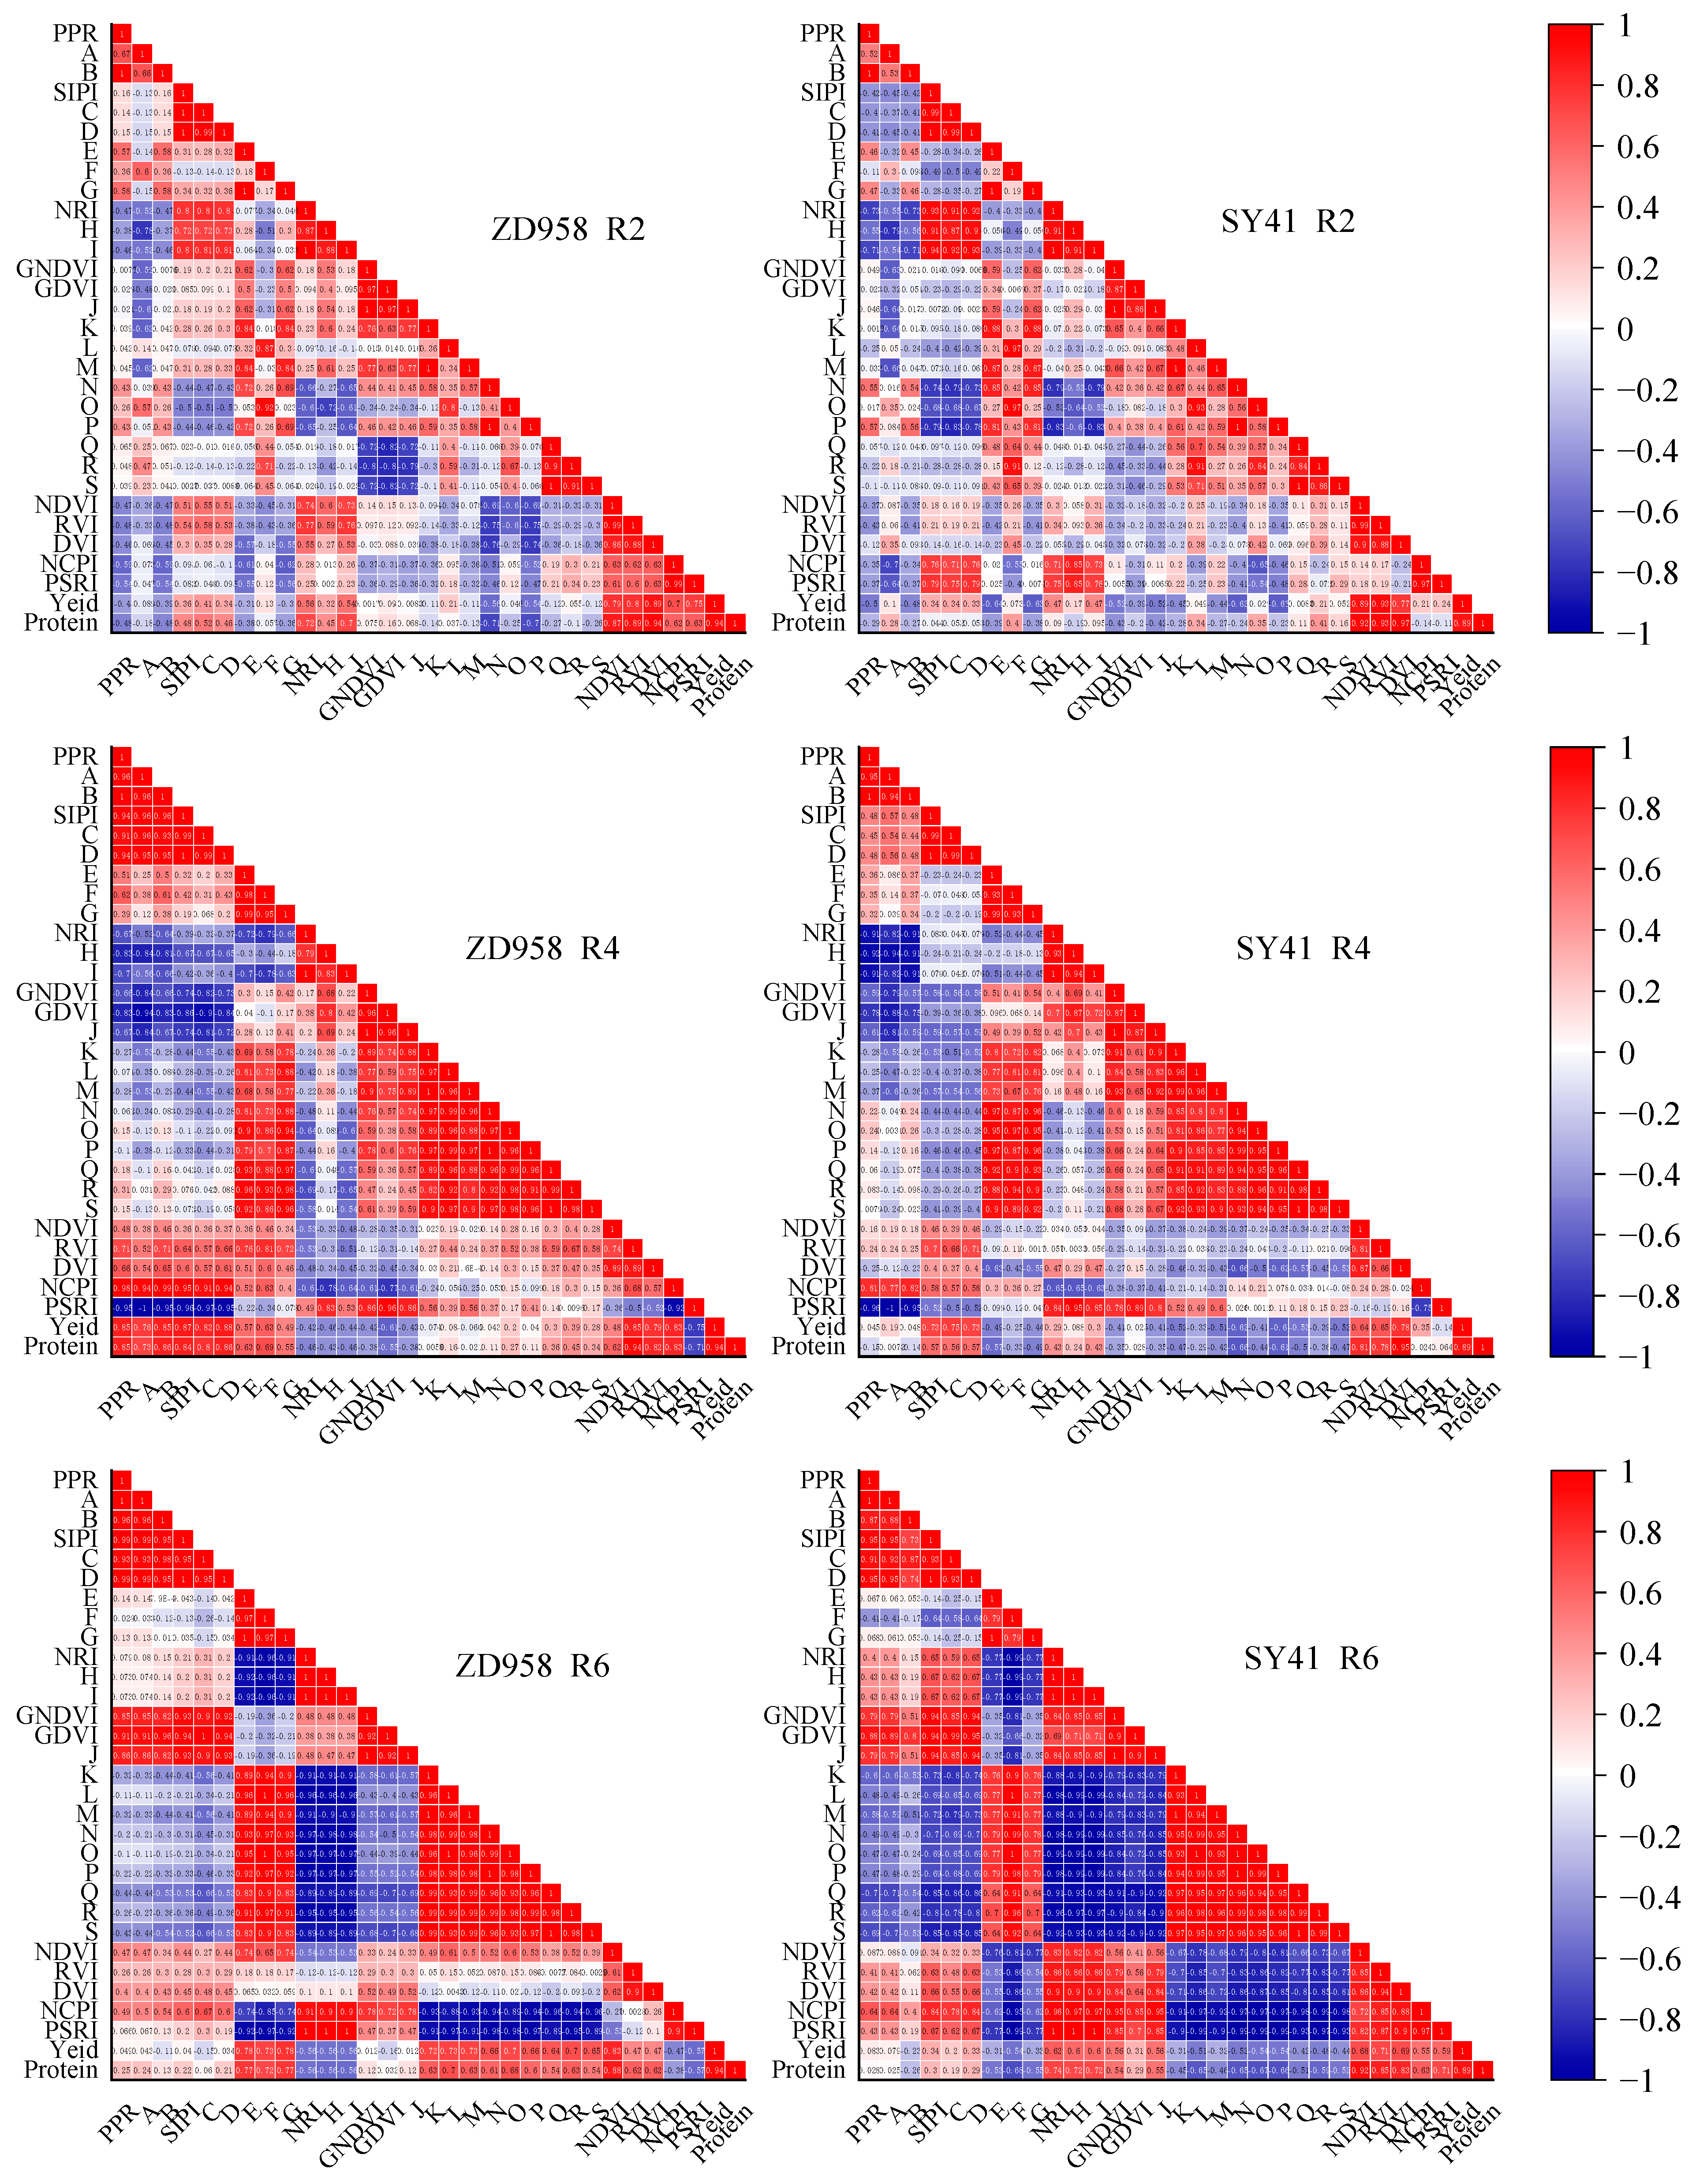
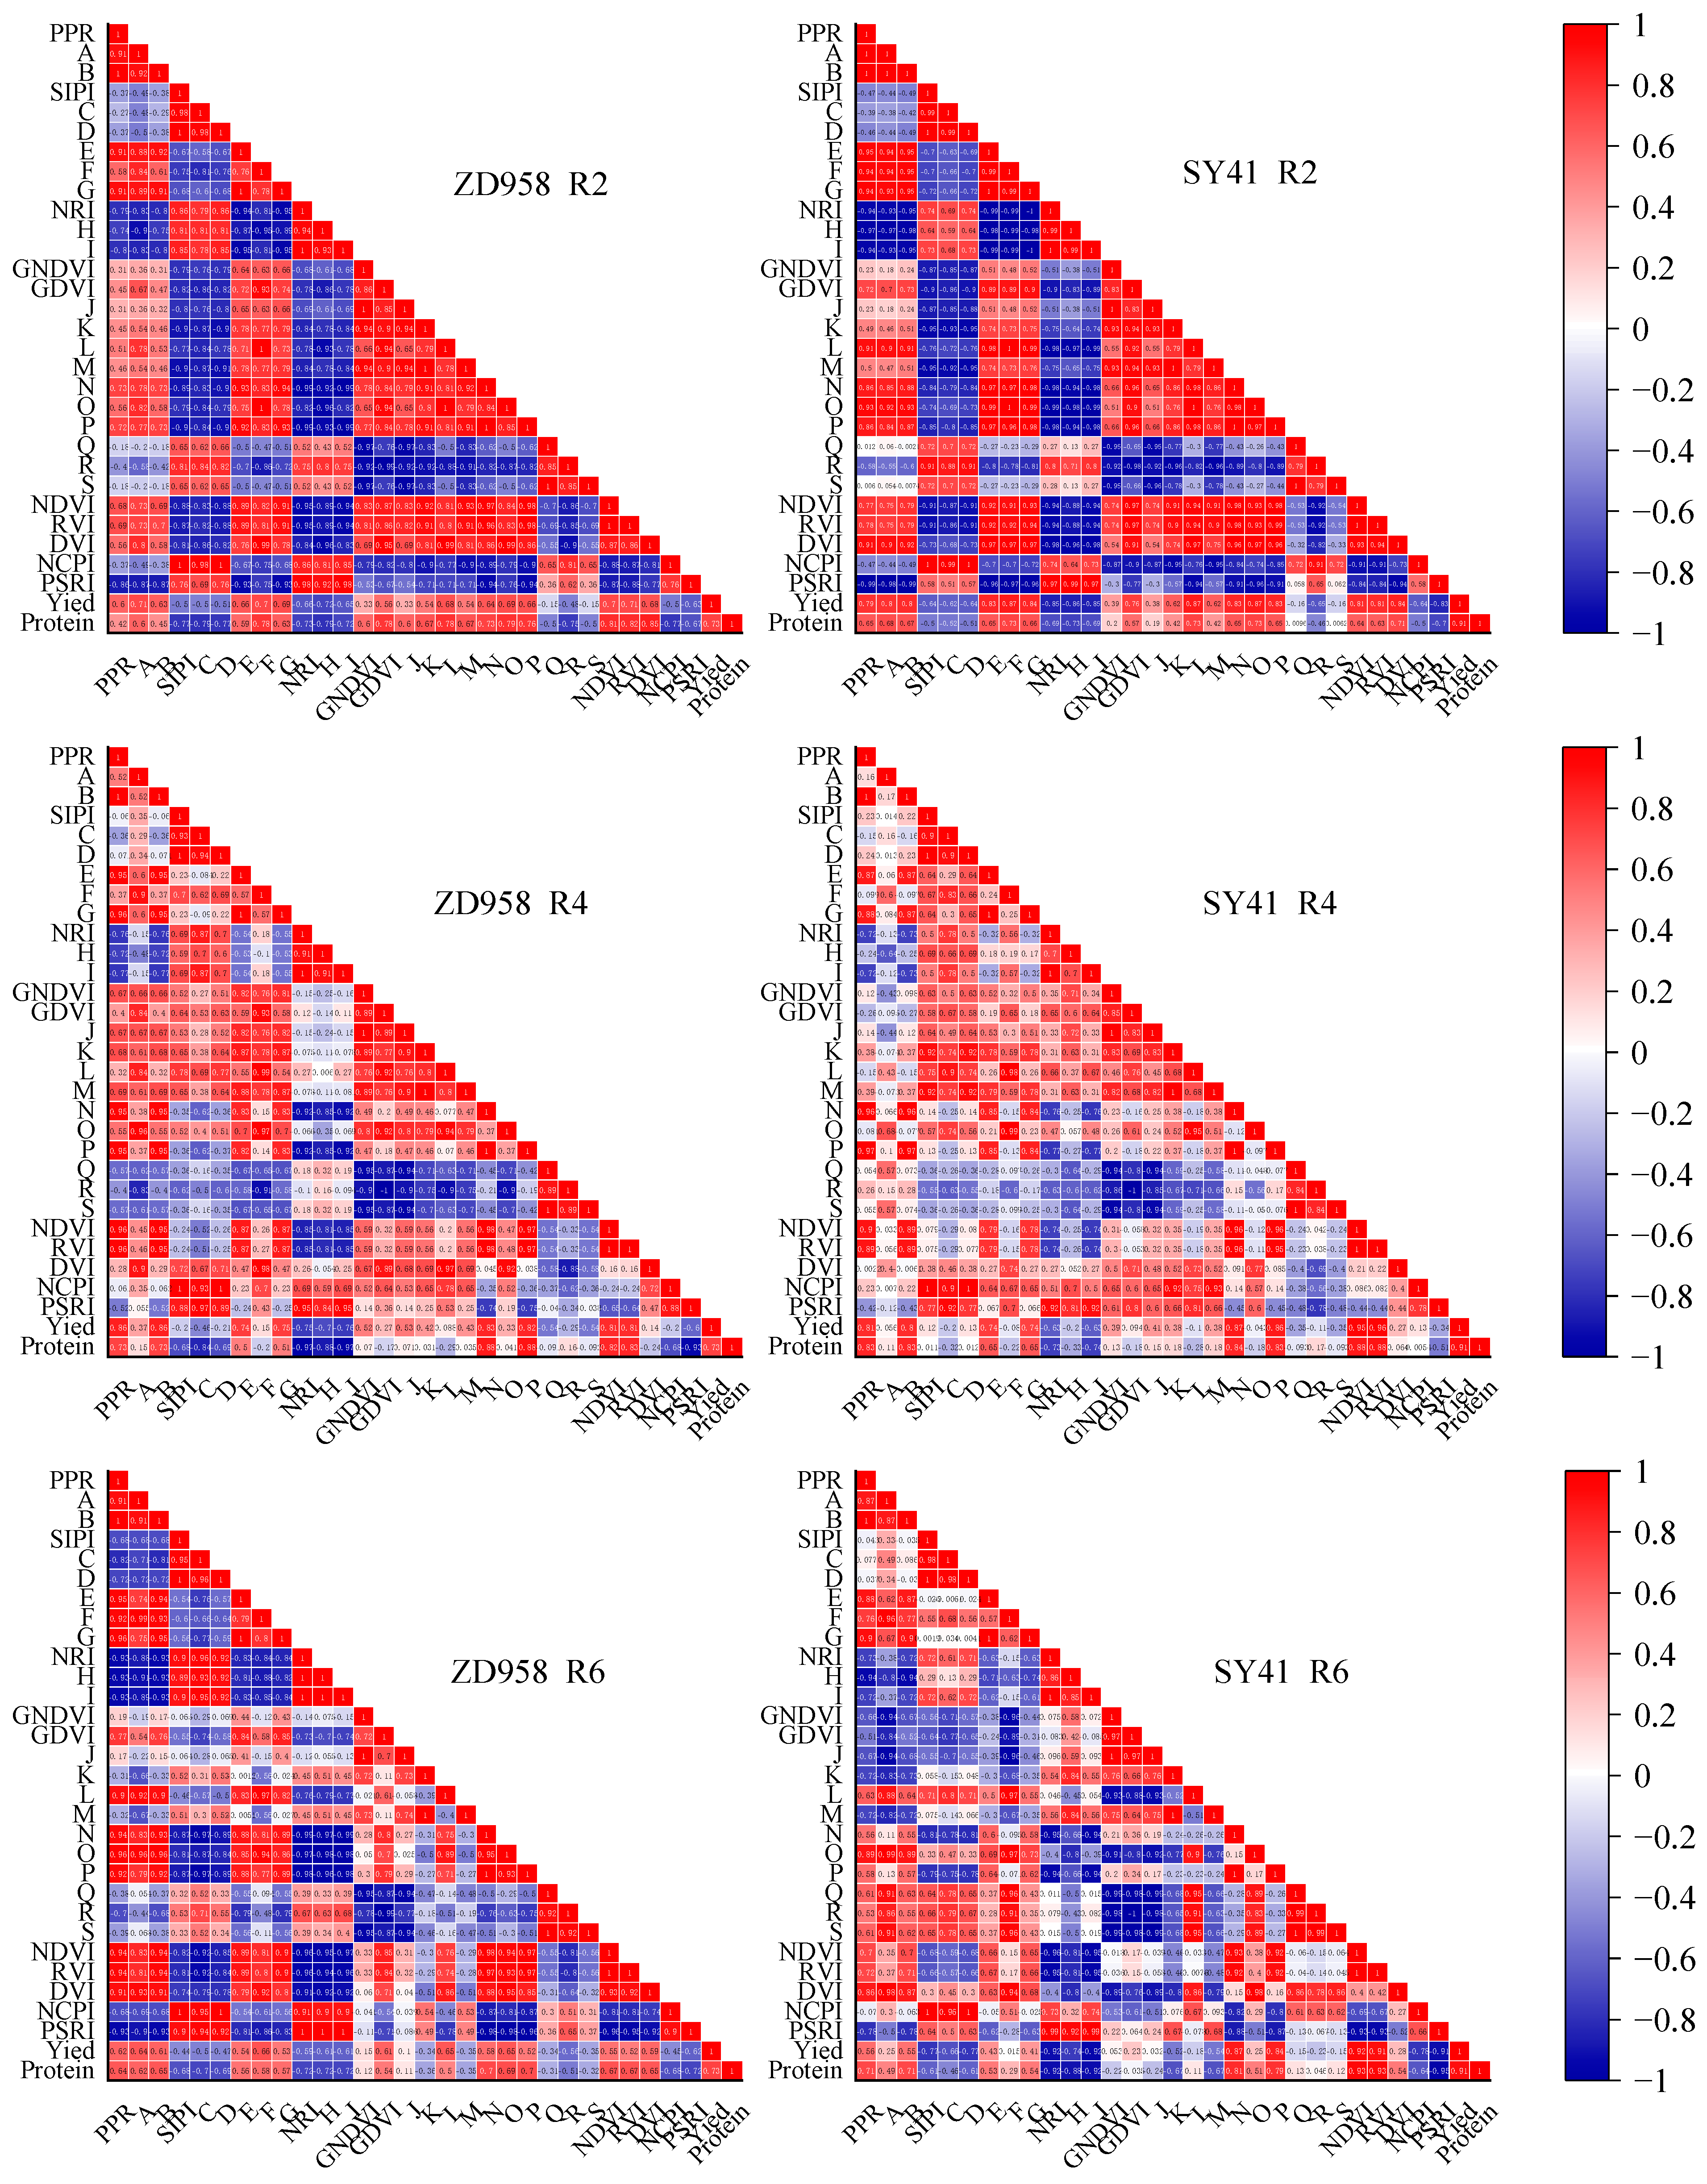
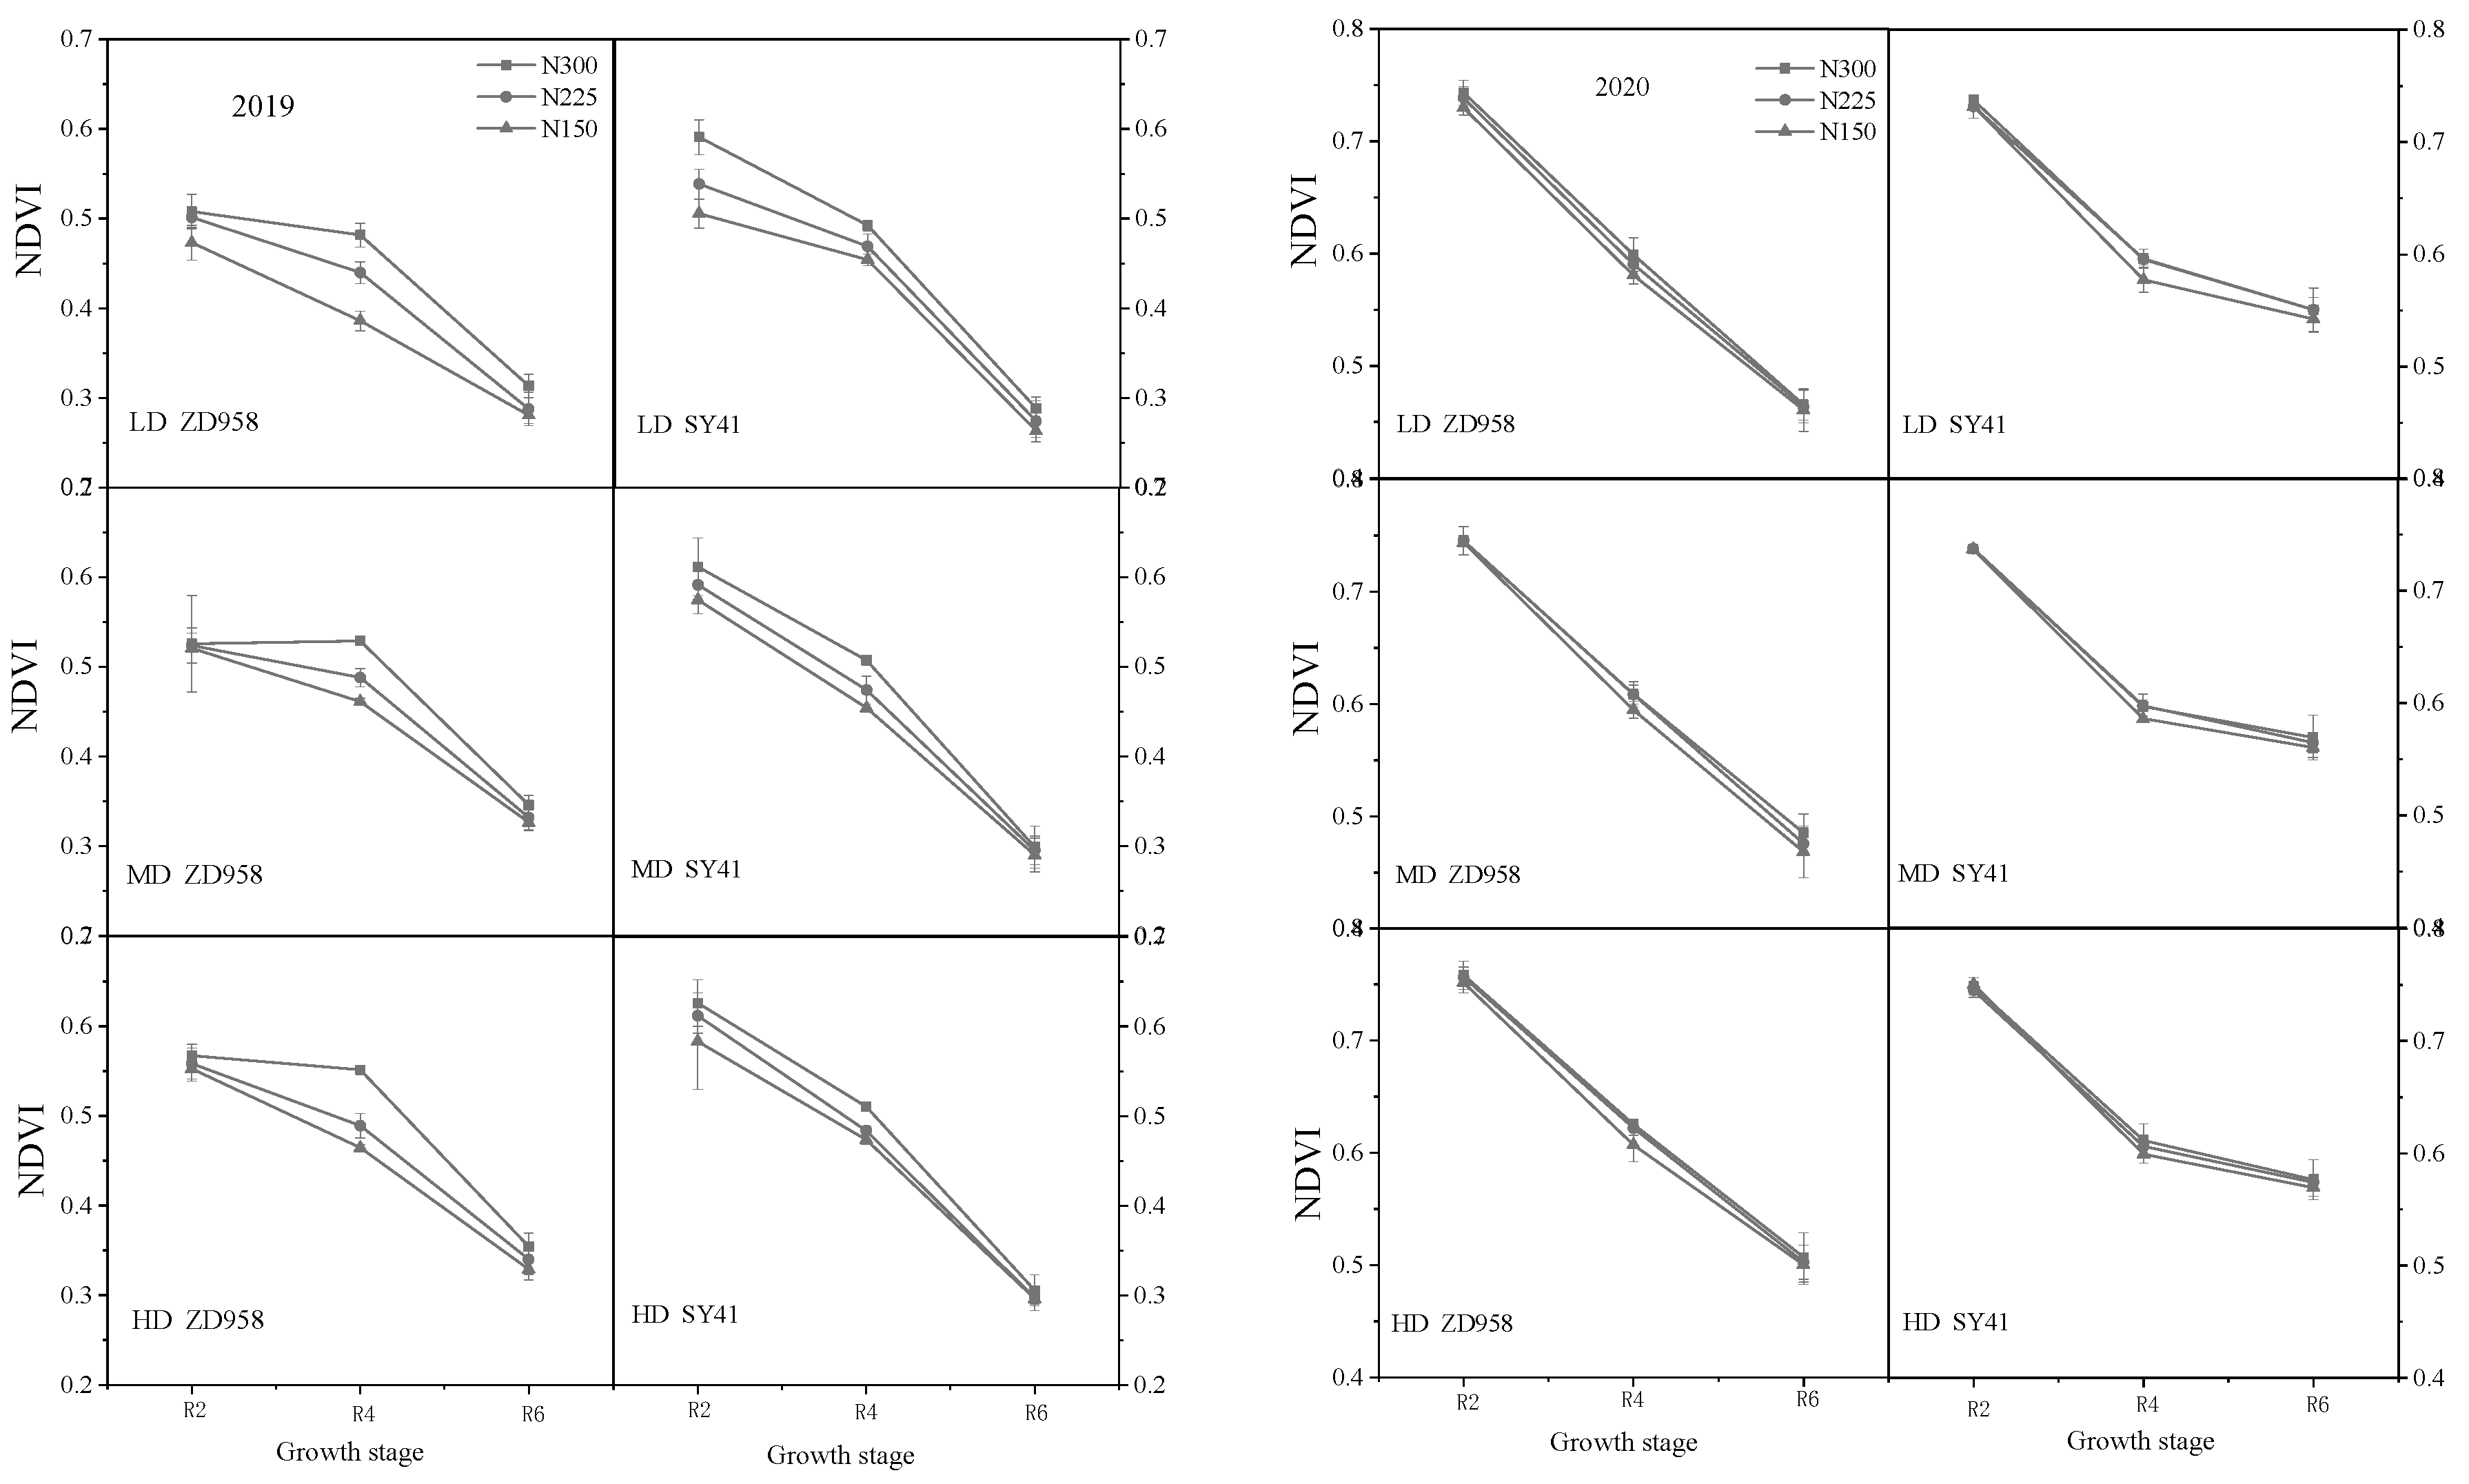
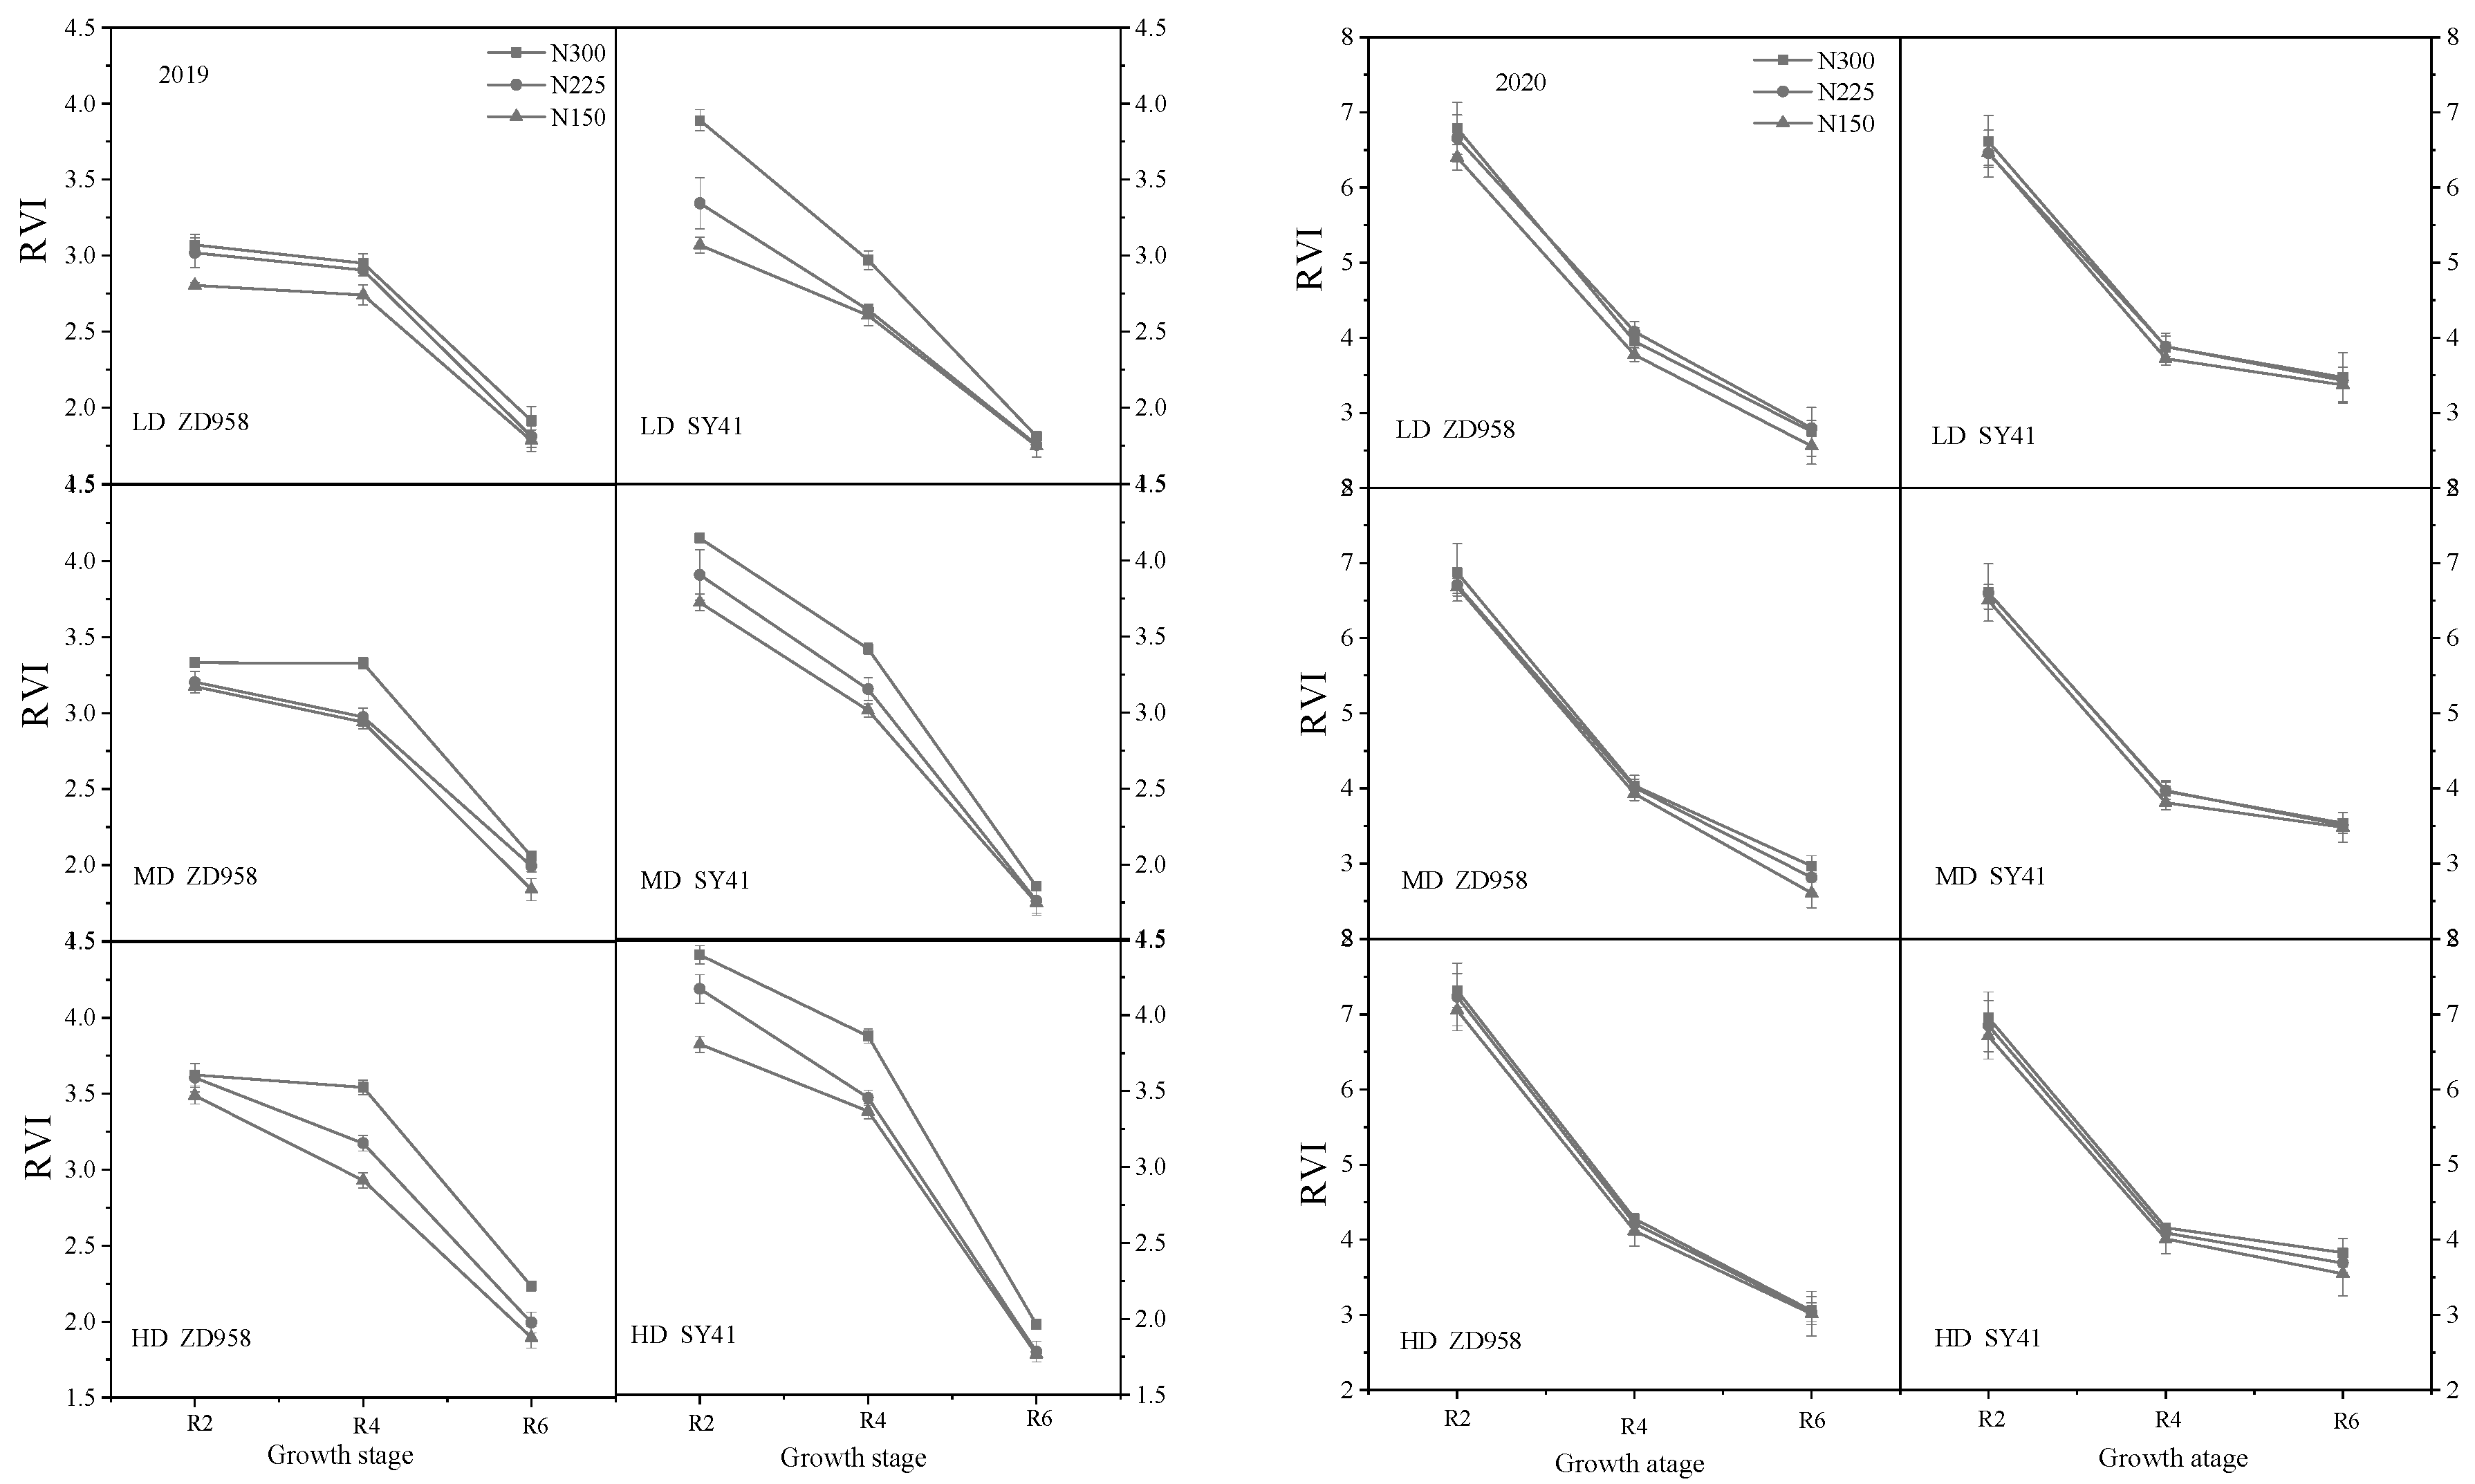
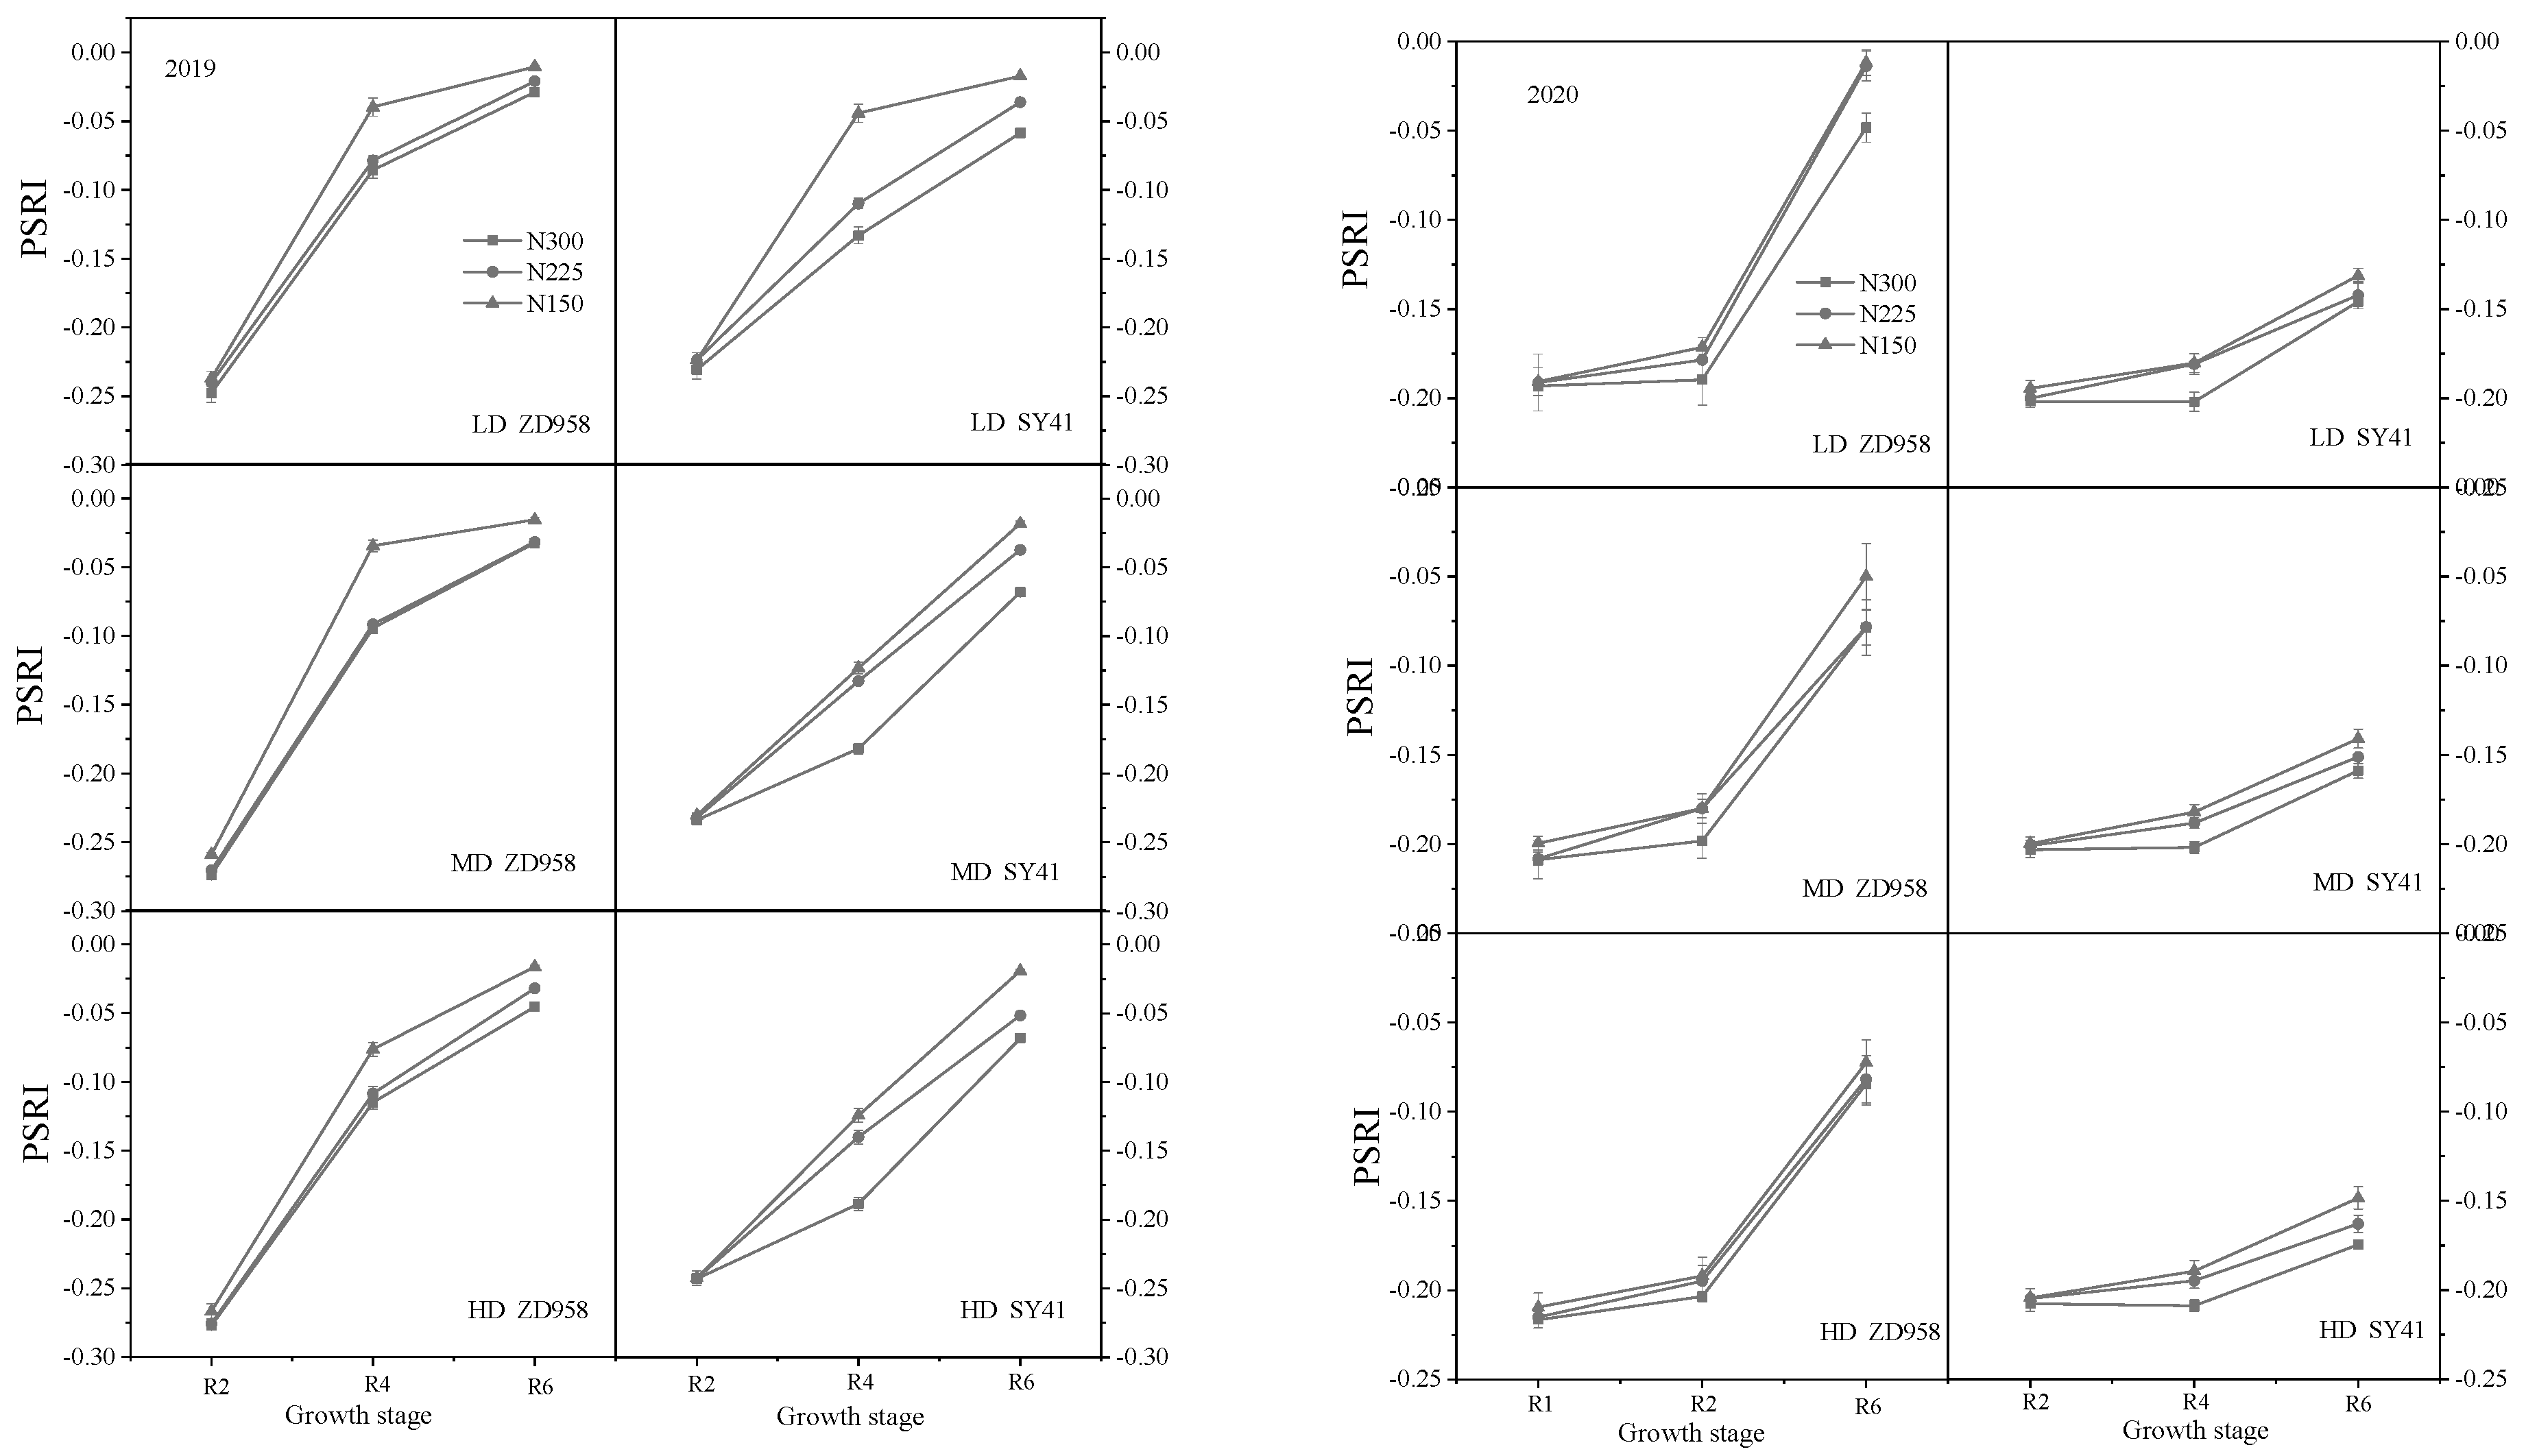
From 2019 to 2020, variety, density and N rate all had significant effects on NDVI, RVI and PSRI at different growth stages (Supplementary Tables S1 and S2). At the same time, NDVI, RVI and PSRI also showed a high correlation with yield and total protein content (Figure 2 and Figure 3). Under different densities, the NDVI and RVI of the two varieties decreased with the decrease in N rate. NDVI and RVI increased with the increase in density under the same N rate. The trend of PSRI with nitrogen dose and density was opposite to that of NDVI and DVI (Figure 4, Figure 5 and Figure 6). Take the example of the change in NDVI, RVI and PSRI of Zhengdan 958 in the R2 period in 2019. At a low density, the NDVI and RVI of Zhengdan 958 decreased by 1.3% and 1.7%, respectively, and the PSRI increased by 3.0%, when the N rate was decreased by 25%. The NDVI and RVI decreased by 6.8% and 8.7%, respectively, and the PSRI increased 4.3%, when the N rate was decreased by 50%. At a medium density, the NDVI and RVI decreased by 0.33% and 0.62%, respectively, and the PSRI increased by 1.3%, when the N application was decreased by 25%. The NDVI and RVI decreased by 3.1% and 1.5%, respectively, and the PSRI increased by 5.5%, when the N rate was reduced by 50%. At a high density, when the N rate was decreased by 25%, the NDVI and RVI decreased by 1.6% and 0.46%, respectively, and the PSRI increased by 0.58%. When the N rate was decreased by 50%, the NDVI and RVI decreased by 2.6% and 3.8%, respectively, and the PSRI increased by 3.8%.
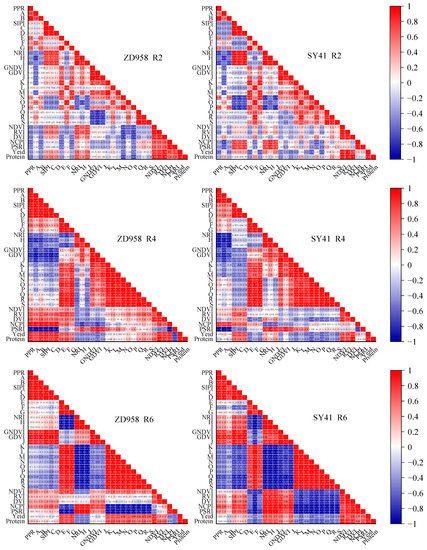
Figure 2.
The correlation matrix between all parameters at different growth stages in 2019.
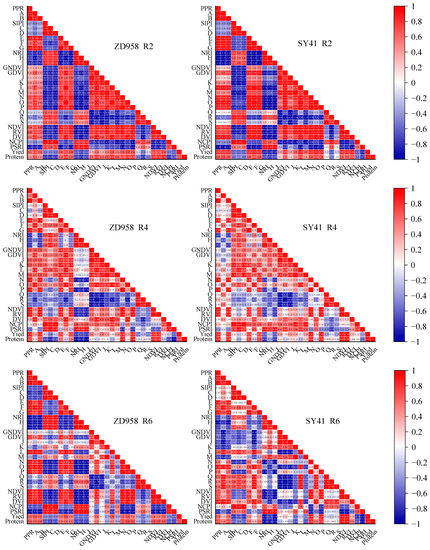
Figure 3.
The correlation matrix between all parameters at different growth stages in 2020.
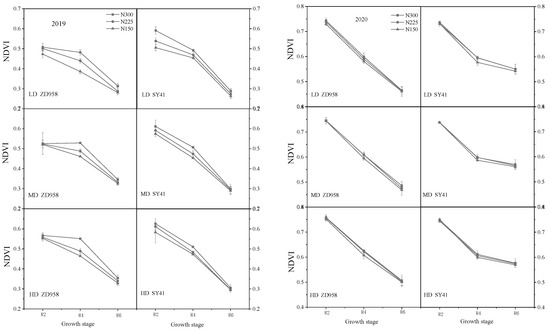
Figure 4.
Effects of decreasing N rates under different planting densities on NDVI in 2019 and 2020. Note: LD: 60,000 plants·ha−1; MD: 75,000 plants·ha−1; HD: 90,000 plants·ha−1; N300:300 kg·ha−1; N225:225 kg·ha−1; N150:150 kg·ha−1, the same as below.
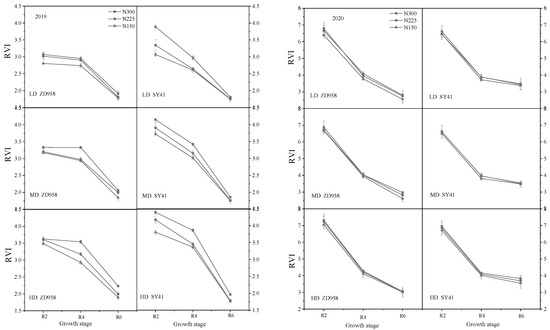
Figure 5.
Effects of decreasing N rates under different planting densities on RVI in 2019 and 2020.
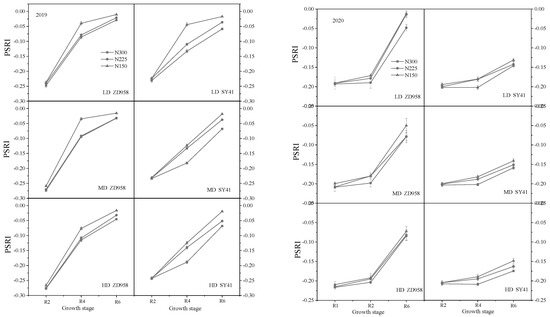
Figure 6.
Effects of decreasing N rates under different planting densities on PSRI in 2019 and 2020.
3.2. PCA of Vegetation Index of Different Treatments of Reduced Nitrogen Application at Different Densities
In order to eliminate the factors with less influence and greater interference and improve the accuracy of measurement data analysis, the single index introduced above was converted into a smaller number of more effective indicators [32]. Therefore, in the experiments in 2019 and 2020, a total of 87 vegetation indexes were used for PCA based on three periods. Taking the PCA of Suyu 41 in 2019 as an example, the contribution ratio and eigenvalue of the first principal component were the largest, at 35.8% and 31.1, respectively (Table 3). The vegetation indexes that made greater contributions to the first principal component were NDVI, RVI, DVI and other vegetation indexes closely related to coverage (Supplementary Table S3). Similarly, the contribution ratios of the second, third and fourth principal components with higher eigenvalues were 19.4%, 17.5% and 12.9%, respectively. The cumulative contribution of the total variation of the first to fourth principal components is 85.7%, which is enough to represent a large part of the original indicator information. Therefore, we can objectively analyze the growth of maize with reduced nitrogen application under different densities through four independent comprehensive indicators.

Table 3.
Eigenvalue and contribution of each comprehensive index.
3.3. Comprehensive Score of Different Treatments of Reduced Nitrogen Application at Different Densities
Based on the PCA results, the scores of comprehensive indicators were obtained and then used for the analysis of subordinate functions. Taking the comprehensive index Cl (1) of Suyu 41 in 2019 as an example, the maximum comprehensive index was 8.091 for the conventional N rate (N300 kg·ha−1) at a high density, while the minimum was −9.507 when the N rate was decreased by 50% at a low density (Table 4). This shows that when only Cl (1) is considered, the conventional N rate at a high density showed the best maize growth, while at a low density with the N rate decreased by 50%, the maize growth was the worst. Combined with subordinate function values, u(X), we calculated the index weight (Wj) of each comprehensive indicator, which was 41.8%, 22.7%, 20.4% and 15.1% for the first, second, third and fourth principal components, respectively. Further, the comprehensive score (D) was calculated for the treatments with different N rates at different densities. The D values of the high-density treatments were higher, indicating that maize showed good growth under these conditions. On the contrary, the D value was low at lower densities, indicating that maize showed poor growth under this treatment (Table 4 and Table 5). A correlation analysis between the comprehensive score obtained from each treatment and the yield and protein content (Table 6) was carried out to obtain a higher correlation coefficient, which supported the credibility of the comprehensive score.

Table 4.
Comprehensive index value (Cl), subordinate function value u(X), comprehensive evaluation value (D) and correlation analysis in 2019.

Table 5.
Comprehensive index value (Cl), subordinate function value u(X), comprehensive evaluation value (D) and correlation analysis in 2020.

Table 6.
Effects of densities and decreasing nitrogen rates on yield and protein content of summer maize in 2019 and 2020.
3.4. Correlation and Model Construction between Vegetation Index and Grain Yield and Protein Content
From 2019 to 2020, the vegetation indexes of Zhengdan 958 and Suyu 41 were significantly correlated with the final GY (Figure 2 and Figure 3). The GY-prediction model was constructed using regression analysis. During modeling, two-thirds of all data were randomly selected as the training set and the remaining one-third comprised the test set. Comparing the determination coefficients of the regression equations, it was found that the higher the correlation between the vegetation index and GY, the better the GY-prediction model constructed with the vegetation index (Table 7). Comparing the predictive effect and accuracy of the models, it was found that the GY-prediction model constructed with the vegetation index during the R6 period of the two varieties had a higher R2 and lower mean relative error (MRE), and therefore a good predictive effect during the two-year experiment. The precision of the yield-prediction model for Suyu 41 was better than that for Zhengdan 958.

Table 7.
Construction of GY model for different growth periods of summer maize in 2019 and 2020.
There was a high correlation between RVI, DVI and protein content per unit area in 2019 (Figure 3). The correlation between NDVI and PSRI and the protein content per unit area was high in 2020 (Figure 4). This difference is related to different weather conditions between years. A protein-content-prediction model was established using stepwise regression analysis. By analyzing the R2 of the regression equations, it was found that the protein-content-prediction model oforf Zhengdan 958 established using the vegetation index was more accurate than that for Suyu 41 (Table 8). Through the regression analysis, it was found that the protein-content-prediction model constructed with the vegetation index during the R4 period of the two varieties had a good predictive effect during the two-year experiment. Compared with the predictive model established for 2020, the predictive model in 2019 had a higher accuracy.

Table 8.
Construction of protein-content-prediction model for different growth stages of Zhengdan 958 in 2019 and 2020.
4. Discussion
Maize yield and total protein content are closely related to its growth. In the past, destructive sampling was used with high investment and low efficiency. Previous studies have shown that due to the growth and development of crops, the spectral characteristics of images of the field will change, which indirectly reflects the growth and development process of crops [33]. Crop-growth monitoring has had good progress, but most methods focus on the quantitative relationship between remote-sensing parameters and agronomic indicators in a single period [34,35]. In this study, we analyzed the changes in the NDVI, RVI and PSRI of summer maize in the R2, R4 and R6 periods under different treatment conditions. The NDVI [36], RVI [37] and PSRI [38], which have been verified by predecessors and can be used to monitor plant growth, were selected for the detection of plant growth. Under different densities, NDVI and RVI decreased with the decrease in the nitrogen application rate, while PSRI increased with the decrease in the nitrogen application rate. Therefore, we can infer that the vegetation index represented by NDVI, RVI and PSRI will change regularly with the change in treatment conditions under different treatments.
The value of the vegetation index is closely related to crop growth, but it is easily affected by weather and other external environments. Therefore, when weather conditions change, the performance of the same vegetation index is different. As a result, it is difficult to accurately reflect the growth of crops with a single vegetation index. Multiple vegetation indexes are used to comprehensively evaluate the growth of crops with reduced nitrogen application under different densities. However, there is a certain correlation between some vegetation indexes, which makes the crop growth information reflected by them cross and overlap when nitrogen is reduced at different densities, and the importance of comprehensive evaluation of each indicator is also different. Previous studies have also used principal component analysis to transform multiple indicators into a few unrelated comprehensive indicators [39] when evaluating the deep-sowing tolerance [40], drought resistance [41] and cold tolerance [42] of crops. On this basis, the subordinate function method was used for comprehensive evaluation, and the results are more scientific and reliable [43]. Hence, in this study, the original multiple vegetation indexes were converted into several independent comprehensive indexes using principal component analysis. On this basis, the corresponding subordinate function value is obtained by using the comprehensive index value to obtain the comprehensive score of reduced nitrogen application at different densities. According to the comprehensive score, it can be seen that at different densities, the growth of crops will be poor with the reduction in nitrogen application. The comprehensive score of each treatment was highly correlated with its yield and protein content. Therefore, by scoring, we can infer that summer maize can maintain a good yield and protein content while reducing N rate by 25% at a high density, which is also consistent with our final measured value. For these reasons, we infer that we can directly use the comprehensive scores of vegetation index under different treatments to compare the yield and quality of maize under different treatments, providing a basis for field management.
The canopy structure of summer maize varied among growth periods, and the different spectral information obtained with the UAV resulted in the precision of predictive models changing a lot. The formation of maize yield and total protein content is a long-term accumulation process. Although the yield and protein content can be estimated using the vegetation index of a single key growth period or a single vegetation index [44,45], multiple vegetation indexes of multiple growth periods in the maize growing season can more fully reflect the formation process of yield and total protein content [46]. Therefore, based on the above research, we selected vegetation indicators highly related to yield and protein content for further analysis in the R2, R4 and R6 periods. It was found that the yield-prediction model established in the R6 period and the protein-content-prediction model established in the R4 period can achieve a better prediction. In addition, compared with the predictive model of yield and protein content established by predecessors, the determination coefficient of the model is significantly improved [47,48]. The predictive model obtained in this study is greatly affected by weather changes, and the interval between periods is long, so it still has great limitations. In the future, the detection interval should be shortened, and many years of experiments should be carried out to reduce the impact of weather on the prediction results, so as to make the predictive effect more accurate.
The research methods proposed in this study can be realized under different treatments of different crops. The main advantage of this program is that it uses different vegetation indexes as comprehensive indicators for analysis, which improves the application scope and accuracy of UAVs in monitoring crop growth in the field. The predictive model of yield and protein content was established in different periods, which improves the accuracy of the model by defining the best modeling period. It provides an opportunity to monitor the land, and supports the management of agricultural systems and decision-making actions.
5. Conclusions
According to the results of this study, the vegetation index will change regularly with the change in treatment. NDVI, RVI and PSRI are important vegetation indexes for monitoring crop growth. Moreover, the comprehensive score of each treatment can directly reflect the yield and protein content of maize under different treatments. Furthermore, the NDVI, RVI and DVI obtained at R6 can be used to predict production (R2 > 0.734 **). The NDVI and RVI acquired at R4 were valuable for predicting kernel protein content (R2 > 0.769 **). However, the predictive model is easily affected by weather conditions and the cycle interval is long, resulting in significant differences in the accuracy of the predictive model during the experimental years.
Supplementary Materials
The following supporting information can be downloaded at: https://www.mdpi.com/article/10.3390/agronomy13020421/s1, Table S1: Effects of densities and decreasing N rates on vegetation index in 2019; Table S2: Densities and decreasing N rates on vegetation index in 2020; Table S3: Loading matrix of each comprehensive index in 2019 and 2020.
Author Contributions
Conceptualization, S.W. and Y.J.; validation, S.W., Y.J., S.H. and X.Y.; formal analysis, Y.J. and S.H.; investigation, H.W.; resources, S.W.; data curation, Y.J. and H.W.; writing—original draft preparation, Y.J.; writing—review and editing, S.W. and D.J.; project administration, S.W. and D.J. All authors have read and agreed to the published version of the manuscript.
Funding
This work was supported by the Natural Science Foundation of China (grant number 31801302), the Fundamental Research Funds for the Central Universities (grant number KYGL2022029) the 111 Project (grant number B16026) and the Collaborative Innovation Center for Modern Crop Production cosponsored by the Province and Ministry (CIC-MCP).
Institutional Review Board Statement
Not applicable.
Informed Consent Statement
Not applicable.
Data Availability Statement
The data related to this study are all in the article.
Conflicts of Interest
The authors declare no conflict of interest.
References
- Guo, P.H. Analysis on the development of China’s maize processing industry. Chin. Rural Econ. 2007, 7, 16–22. [Google Scholar]
- Hua, H.L.; Bian, Y.L.; Li, G.S.; Liu, D.L. Effects of density and nitrogen application on Yield and quality of Silage Maize. J. Shanghai Agric. 2014, 30, 81–84. [Google Scholar]
- Mann, C. Crop Scientists Seek a New Revolution. Science 1999, 283, 310. [Google Scholar] [CrossRef]
- Chen, G.P.; Liu, J.G.; Li, C.H.; Dong, S.T.; Li, S.K.; Yang, Q.F.; Liu, Y.H.; Wang, L.C.; Xue, J.Q.; Liu, J.G.; et al. Distribution, yield composition and key technologies of super high yield maize fields in China in recent years. Crop J. 2012, 38, 80–85. [Google Scholar]
- Testa, G.; Reyneri, A.; Cardinale, F.; Blandino, M. Grain Yield Enhancement through Fungicide Application on Maize Hybrids with Different Susceptibility to Northern Maize Leaf Blight. Cereal Resal Res Com. 2015, 43, 415–425. [Google Scholar] [CrossRef]
- Wang, B.J. Analysis and Study on the impact of the development of agricultural chemical fertilizer industry on ecological environment. J. Environ. Sci. Manag. 2020, 45, 177–180. [Google Scholar]
- Xue, Z.C.; Gao, H.Y.; Peng, T.; Yao, G. Application of spectral analysis in plant physiological and ecological research. Plant Physiol. J. 2011, 47, 313–320. [Google Scholar]
- Xu, X.G.; Zhao, C.J.; Wang, J.H.; Huang, W.J.; Li, C.J.; Liu, H.J. Study on the relationship between characteristic parameters of new spectral curve and chlorophyll content of rice. Spectr. Spectr. Analys. 2011, 31, 188–191. [Google Scholar]
- Wang, Y.D.; Zhao, M.Q.; Fu, B.; Yue, H. Identification of flue-cured tobacco varieties based on visible-near infrared spectroscopy. Shandong Agric. Sci. 2016, 48, 119–124. [Google Scholar]
- Lu, N.; Wang, W.H.; Zhang, Q.F.; Li, D.; Yao, X.; Tian, Y.C.; Zhu, Y.; Cao, W.; Baret, R.; Liu, S.Y. Estimation of Nitrogen Nutrition Status in Winter Wheat From Unmanned Aerial Vehicle Based Multi-Angular Multispectral Imagery. Front. Plant Sci. 2019, 10, 1601. [Google Scholar] [CrossRef]
- Xu, R.; Li, C.Y.; Paterson, A.H. Multispectral imaging and unmanned aerial systems for cotton plant phenotyping. PLoS ONE 2019, 14, 11–17. [Google Scholar] [CrossRef]
- Duan, B. Rice Growth Parameters Extraction and Yield Estimation Based on UAV Multispectral Images; WuHan University: Wuhan, China, 2021. [Google Scholar]
- Wang, D.; Wang, K.; Wu, J.Z.; Han, P. Research progress in nondestructive rapid measurement of seed quality based on spectrum and imaging technology. Spectr. Spectr. Analys. 2021, 41, 52–59. [Google Scholar]
- Royoc Aparicio, N.; Villegas, D.; Casadesus, J.; Monneveux, P.; Araus, J.L. Usefulness of spectral reflectance indices as durum wheat yield predictors under contrasting Mediterranean conditions. Int. J. Remote Sens. 2003, 24, 4403–4419. [Google Scholar]
- Jing, Y.H.; Guo, Y.; Zhang, H.F.; Rong, Y.S.; Zhang, S.H.; Feng, W.; Wang, L.G.; He, J.; Liu, H.J.; Zheng, G.Q. Effect of UAV flying height on prediction model of nitrogen accumulation in winter wheat plants. Henan Agric. Sci. 2022, 51, 147–158. [Google Scholar]
- Mao, Z.H.; Deng, L.; Sun, J.; Zhang, A.W.; Chen, X.Y.; Zhao, Y. Application of UAV multispectral remote sensing in chlorophyll prediction of Maize Canopy. Spectr. Spectr. Analys. 2018, 38, 2923–2931. [Google Scholar]
- Qi, B.; Zhang, N.; Zhao, T.J.; Xing, G.N.; Zhao, J.M.; Gai, J.Y. Estimation of leaf area index of soybean breeding materials by Hyperspectral technique. Crop J. 2015, 41, 1073–1085. [Google Scholar]
- Xue, L.H.; Cao, W.X.; Luo, W.H. Rice yield prediction model based on canopy reflectance spectrum. J. Remote Sens. 2005, 1, 100–105. [Google Scholar]
- Tang, Y.L.; Huang, J.F.; Wang, R.C. Estimation of crude protein and starch content in rice by hyperspectral method. Chin. Agric. Sci. 2004, 9, 1282–1287. [Google Scholar]
- Liu, L.Y.; Wang, J.H.; Huang, W.J. The new spectral index was used to improve the precision of winter wheat yield estimation. J. Agric. Eng. 2004, 20, 172–175. [Google Scholar]
- Chang, X.Y.; Chang, Q.R.; Wang, X.F.; Chu, D.; Guo, R.X. Estimation of Chlorophyll Content in Maize Based on UAV Hyperspectral Image. Agric. Res. Arid Areas. 2019, 37, 66–73. [Google Scholar]
- Cao, X.R.; Zhou, Y.L.; Duan, X.Y.; Cheng, D.F. Hyperspectral remote sensing was used to estimate the effect of powdery mildew on wheat yield and protein content. J. Plant Prot. 2009, 36, 32–36. [Google Scholar]
- Reyniers, M.; Vrindts, E.; De Baerdemaeker, J. Comparison of an aerial based system and an on the ground continuous measuring device to predict yield of winter wheat. Eur. Agric. Sci. 2006, 24, 87–94. [Google Scholar] [CrossRef]
- Wang, Z.J.; Wang, J.H.; Liu, L.Y.; Huang, W.J.; Zhao, C.J.; Wang, C.Z. Prediction of grain protein content in winter wheat using plant pigment ratio (PPR). Field Crop Res. 2004, 90, 311–321. [Google Scholar] [CrossRef]
- Liu, L.Y.; Wang, J.J.; Bao, Y.S.; Huang, W.J.; Ma, Z.H.; Zhao, C.J. Predicting winter wheat condition, grain yield and protein content using multi-temporal EnviSat-ASAR and Landsat TM satellite images. Intern. J. Remote Sens. 2006, 27, 737–753. [Google Scholar] [CrossRef]
- Ci, D.W.; Jiang, D.; Dai, T.B.; Jing, Q.; Cao, W.X. Variation in cadmium tolerance and accumulation and their relationship in wheat recombinant inbred lines at seedling stage. Biol. Trace Elem. Res. 2011, 142–143. [Google Scholar] [CrossRef]
- Gao, Y.; Wang, X.; Gao, S.R.; Zhai, H.Y.; Wu, S.Y.; Sun, P.; Zhang, X.L.; Liu, H.Y. Analysis of Drought Resistance of 80 Maize Inbred Lines at Germination Stage Based on the Method of subordinate function. Mol. Plant Breed. 2022, 1–9. [Google Scholar]
- Zhou, G.S.; Mei, F.Z.; Zhou, Z.Q.; Zhu, X.T. Comprehensive Evaluation and Prediction of Physiological Indexes of Moisture Tolerance in Different Wheat Cultivars. Chin. Agric. Sci. 2003, 1378–1382. [Google Scholar]
- Lu, Z.; Luo, M.; Tan, C.W.; Xu, F.F.; Liang, S.; Yang, X. Dynamic Monitoring of Winter Wheat Growth Based on the Analysis of Vegetation Index Variation of Remote Sensing Images. J. Wheat Crops. 2020, 40, 1257–1264. [Google Scholar]
- Niu, F.X.; Hua, X.X.; Guo, X.X.; Wu, J.Y.; Li, H.M.; Ding, C.W. Preliminary study on physiological indexes and comprehensive evaluation of drought resistance of potato varieties. J. Crops 1996, 4, 392–398. [Google Scholar]
- Xie, Z.J. Fuzzy Mathematics Method in Agricultural Mathematics; Huazhong University of Technology Press: Wuhan, China, 1983; pp. 99–193. [Google Scholar]
- Liu, C.J.; Gong, X.W.; Wang, H.L.; Dang, K.; Deng, X.P.; Feng, B.L. Low-nitrogen tolerance comprehensive evaluation and physiological response to nitrogen stress in broom maize millet (Panicum miliaceum L.) seedling. Plant Physiol. Bioch. 2020, 151, 233–242. [Google Scholar] [CrossRef]
- Li, S.Y. Dynamic Monitoring of Maize Growth Parameters under Drought Stress Based on UAV Remote Sensing; Ningxia University: Yinchuan, China, 2022. [Google Scholar]
- Tan, C.W.; Yang, X.; Luo, M.; Ma, C.; Yan, X.; Chen, T.T. Quantitative inversion of key seedling parameters of winter wheat at booting stage based on HJ-CCD image. Agric. Sci. Chin. 2015, 48, 2518–2527. [Google Scholar]
- Tan, C.W.; Huang, W.J.; Jin, X.L.; Wang, J.C.; Tong, L.; Wang, J.H.; Guo, W.S. Monitoring chlorophyll fluorescence parameter F of compact maize by hyperspectral vegetation index Fv/Fm. Spectr. Spectr. Analys. 2012, 32, 1287–1291. [Google Scholar]
- Du, G. Research and Application of Vegetation Index Monitoring Model Based on EOS/MODIS; Huazhong University of Science and Technology: Wuhan, China, 2005. [Google Scholar]
- An, Q.; Chen, S.B.; Sun, S.B. Study on remote estimation of maize based on MODIS-RVI. Geosp. Inf. 2018, 16, 14–16. [Google Scholar]
- Zhang, X.Y.; Hou, X.H.; Wang, M.; Wang, L.L.; Liu, F. Study on the relationship between photosynthetic rate and spectral index under wheat stripe rust stress. Spectr. Spectr. Analys. 2022, 42, 940–946. [Google Scholar]
- Ma, L.P. Transformation from multiple indicators to a few comprehensive indicators principal component analysis. Beijing Stat. 2000, 8, 35–37. [Google Scholar]
- Zhou, Y.; Huang, J.; Wu, Y.; Zhang, Y.Q.; Xi, J.; Zhang, X.C.; Li, Z.B. Comprehensive evaluation of sorghum varieties’ tolerance to deep sowing based on principal component and membership function analysis. Agric. Res. Arid Areas. 2020, 38, 214–220. [Google Scholar]
- Zhang, Z.M.; Wan, S.B.; Dai, L.X.; Song, W.W.; Chen, J.; Shi, Y.Q. Screening and evaluation of peanut drought resistance identification indicators. J. Plant Ecol. 2011, 35, 100–109. [Google Scholar] [CrossRef]
- Liu, X.H.; He, X.Y.; Su, D.M.; Wei, L.; Yuan, D.Y.; Wang, J.F. Construction and application of a comprehensive evaluation system for cold-resistance of winged pod provenance. Forestry Sci. 2007, 10, 45–50. [Google Scholar]
- Tian, Z.G.; Wang, F.; Zhang, W.E.; Zhao, X.M. Application of multivariate statistical analysis method in drought resistance evaluation of marigold varieties. J. Appl. Ecol. 2011, 22, 3315–3320. [Google Scholar]
- Liu, K.L.; Hu, H.W.; Hu, Z.H.; Li, D.M.; Zhou, L.J.; Huang, Q.H.; Yu, X.C.; Ye, H.C.; Xu, X.L.; Wang, S.L. Prediction of sesame yield after combined application of dicyandiamide based on canopy normalized vegetation index. Chin. J. Oil Crops. 2016, 38, 467–472. [Google Scholar]
- Huang, N.; Wang, Q.; Wang, P.; Zhang, G.Q.; Liu, L.F. Research on corn yield prediction using normalized vegetation index. Heilongjiang Agric. Sci. 2014, 236, 130–132. [Google Scholar]
- Han, W.T.; Peng, X.S.; Zhang, Y.L.; Niu, Y.X. Summer Maize Yield Estimation Based on Vegetation Index Derived from Multi- Temporal UAV Remote Sensing. Trans. Chin. Soc. Agricl. Mach. 2020, 1, 148–155. [Google Scholar]
- Ma, G.N.; Ding, C.Y. Prediction of maize yield based on vegetation index and optimal phenological period. Agric. Technol. 2017, 37, 17–18–25. [Google Scholar]
- Lin, B.W. Research on the Quality Monitoring and Prediction Model of Summer Maize Based on Near-Ground Hyperspectral Remote Sensing; Hubei University: Wuhan, China, 2020. [Google Scholar]
Disclaimer/Publisher’s Note: The statements, opinions and data contained in all publications are solely those of the individual author(s) and contributor(s) and not of MDPI and/or the editor(s). MDPI and/or the editor(s) disclaim responsibility for any injury to people or property resulting from any ideas, methods, instructions or products referred to in the content. |
© 2023 by the authors. Licensee MDPI, Basel, Switzerland. This article is an open access article distributed under the terms and conditions of the Creative Commons Attribution (CC BY) license (https://creativecommons.org/licenses/by/4.0/).

