Article

Assessment of CSM–CERES–Rice as a Decision Support Tool in the Identification of High-Yielding Drought-Tolerant Upland Rice Genotypes

1
Laboratory of Plant Breeding and Climate Resilient Agriculture, Agricultural Innovation and Management Division, Faculty of Natural Resources, Prince of Songkla University, Hat Yai, Songkhla 90112, Thailand
2
Oil Palm Agronomical Research Center, Faculty of Natural Resources, Prince of Songkla University, Hat Yai, Songkhla 90110, Thailand
3
Graduate School of Agricultural and Life Sciences, The University of Tokyo, 1–1–1 Yayoi, Bunkyo, Tokyo 113-8654, Japan
4
Department of Agriculture, Environment and Bioenergy, Università Degli Studi di Milano, via Celoria 2, 20133 Milano, Italy
*
Authors to whom correspondence should be addressed.
Agronomy 2023, 13(2), 432; https://doi.org/10.3390/agronomy13020432
Submission received: 23 December 2022 / Revised: 23 January 2023 / Accepted: 29 January 2023 / Published: 31 January 2023
(This article belongs to the Section Farming Sustainability)

Abstract

:
Drought is considered as one of the critical abiotic stresses affecting the growth and productivity of upland rice. Advanced and rapid identification of drought-tolerant high-yielding genotypes in comparison to conventional rice breeding trials and assessments can play a decisive role in tackling climate-change-associated drought events. This study has endeavored to explore the potential of the CERES–Rice model as a decision support tool (DST) in the identification of drought-tolerant high-yielding upland rice genotypes. Two experiments mentioned as potential experiment (1) for model calibration under optimum conditions and an experiment for yield assessment (2) with three irrigation treatments, (i) a control (100% field capacity [FC]), (ii) moderate stress (70% FC), and (iii) severe stress (50 % FC), were conducted. The results from the yield assessment experiment indicated that the grain yield of the studied genotypes decreased by 24–62% under moderate stress and by 43–78% under severe stress as compared to the control. The values for the drought susceptibility index (DSI) ranged 0.54–1.38 for moderate stress and 0.68–1.23 for severe stress treatment. Based on the DSI and relative yield, genotypes Khao/Sai, Dawk Kham, Dawk Pa–yawm, Goo Meuang Luang, and Mai Tahk under moderate stress and Dawk Kha, Khao/Sai, Nual Hawm, Dawk Pa–yawm, and Bow Leb Nahag under severe stress were among the top five drought-tolerant genotypes as well as high-yielding genotypes. The model accurately simulated grain yield under different irrigation treatments with normalized root mean square error < 10%. An inverse relationship between simulated drought stress indices and grain yield was observed in the regression analysis. Simulated stress indices and water use efficiency (WUE) under different irrigation treatments revealed that the identified drought-tolerant high-yielding genotypes had lower values for stress indices and an increasing trend in their WUE indicating that the model was able to aid in decision support for identifying drought-tolerant genotypes. Simulating the drought stress indices could assist in predicting the response of a genotype under drought stress and the final yield at harvest. The results support the idea that the model could be used as a DST in the identification of drought-tolerant high-yielding genotypes in stressed as well as non-stressed conditions, thus assisting in the genotypic selection process in rice crop breeding programs.

1. Introduction

Rice (Oryza sativa L.) is the staple food for more than half of the world’s inhabitants. However, drought stress is a serious threat to global rice production as rice is extremely sensitive to drought stress [1]. Climate change has further triggered seasonal variations in rainfall patterns leading to extreme weather events and increased drought stress intervals. Drought occurrence is forecasted to be more severe in the future as stated in numerous studies [2]. Rice genotypes exhibit unique physiological and yield responses to drought stress depending on its duration and intensity [3], and the stability of a genotype is determined by its performance and sustaining productivity under stress [4]. Therefore, screening drought-tolerant rice genotypes for their performance under various drought stress levels is required to ensure the productivity of upland rice cropping systems.
Rice is considered highly sensitive to drought stress particularly when drought occurs at reproductive stages [5]. Breeding upland rice for drought tolerance to avoid abiotic stresses is one of the important factors to increase the efficiency of rice production systems. Hundreds of some crops and even thousands of genotypes for some species are present and every year many cultivars are added to each crop [6] causing pressure on genotypic evaluation and the selection process of suitable and resistant cultivars to sustain production. Conventional breeding has been met with little success for drought tolerance in rice [7]. Various methods and processes are adopted for the assessment of drought stress tolerance in rice [8,9]. Drought scoring has been used in assessing and selecting tolerant genotypes [10], whereas various stress indices have been used [11,12,13] to figure out the statistical relationship of yield production under optimal and stressed conditions in different crops including rice. These indices provide the comparison of yield loss under optimal and stress conditions, and relative yield is considered as the yield of a particular genotype in comparison to other evaluated genotypes under similar stress where the intensity of yield reduction is considered as the susceptibility of that specific genotype. Some of these stress indices include the drought susceptibility index [14], geometric mean productivity [15], harmonic mean index [16], mean productivity index [17], yield stability index [18], and the tolerance index [19]. The performance of these indices has been evaluated in numerous studies, and positive or negative correlations and their significant differences with yield have been reported [5,20]. However, these stress indices fail to explain the plant physiological mechanisms regulating rice productivity as they only take yield into consideration under different growing conditions whereas information of each contributing trait is important to enhance the efficiency of the genotypic selection process [21]. The existing selection approaches are ineffective for rapid assessment and screening of high-yielding drought-tolerant genotypes due to the time, resources, and cost involved in yield trails under diverse agro-climatic and management conditions. Consequently, rapid and cost-effective approaches are imperative for assessing and screening high-yielding tolerant drought-tolerant rice genotypes.
Crop growth models have been widely used at plant, farm, and regional levels for crop management decision-making worldwide [22,23]. These models have the potential to evaluate genotypic performances under different soils, moisture, and climatic conditions in a rapid and cost-effective manner. Moreover, the crop growth models also explain the underlying physiological mechanisms of the studied genotypes. The decision support system for agro–technology transfer (DSSAT) is one of the widely used crop models which is being utilized in various aspects of agriculture such as in climate risk assessment for rainfed rice productivity [24], in simulating phenology, development, and yield [25,26], identification of the relative performance of different capable lines of rice at various locations, variability in genotypic response to the atmosphere [27], climate change impacts on rice yield performance and production [28,29,30] and in the assessment of irrigation scheduling [31,32]. CERES (Crop Environment Resource Synthesis)–Rice was developed to facilitate better crop production, land-use management, and decision-making in rice field research. CSM–CERES–Rice is a physiologically based model which simulates daily photosynthesis, growth, respiration, biomass partitioning, and plant development as a function of input information such as soil characteristics, management scenarios, cultivar parameters, and prevailing daily weather conditions [33]. Model performance for various crop management strategies in number of agro-environments and in climate impact assessments has also been evaluated [24,25,26,28,29,30,34,35]. The drought stress index which is one of valuable outputs of CERES–Rice that could be utilized in predicting a genotypic yield response under a diverse range of management strategies and could lead to decision support in various management options including yield forecast and genotype recommendation. CERES–Rice has been used to explore the impact of drought stress on crop yields by simulating drought stress under stress conditions [31]. Considering drought stress, in CERES–Rice, a comparison between potential water demand and root water uptake is conducted. It is known that the conductivity of soil is decreased when soil dries either due to evaporation or transpiration resulting in decreased root water uptake. If the ratio between potential root water uptake and potential evapotranspiration is lower than 1.5, drought stress for leaf growth and stem growth is started while drought stress for photosynthesis and biomass is initiated when the ratio is less than 1 [36]. To simulate soil and plant water dynamics, CERES–Rice utilizes two approaches including the Priestley–Taylor evapotranspiration (PT) method [37] and the daily FAO-56 Penman–Monteith (PM) model [38]. In the DSSAT modelling system, the PT approach is used by default as fewer parameters for weather data are required compared to the FAO-56 model in which additional weather input including wind speed and relative humidity of air is required [39]. Detailed processes related to evapotranspiration in the CERES modules can be studied in Sau et al. [40]. Water use efficiency (WUE) is an important physiological attribute [41,42] which is generally decreased due to higher rates of transpiration under drought stress and genotypes failing to produce optimum yields. In addition to the drought stress index, WUE can be calculated from simulated grain yield and simulated evapotranspiration by CERES–Rice. Thus, understanding the WUE of genotypes under different water levels can help to select genotypes with improved physiological mechanisms.
Keeping in view the importance of the information mentioned above, this study hypothesized that the model-assisted approach has the potential to curtail the constraints of conventional breeding approaches that require time, resources, and costs due to field trials under diverse agro-climatic and management conditions for assessment and screening of high-yielding drought-tolerant genotypes. So far, according to the authors’ knowledge, no specific studies have been conducted focusing on the application of CSM–CERES–Rice in explanation of genotypic yield response to drought stress and WUE for genotypic selection processes in rice breeding. Thus, the objective of this study was to explore the potential of the CSM–CERES–Rice model for its use as a DST in the identification of high-yielding drought-tolerant genotypes in the selection processes rice crop breeding programs.

2. Materials and Methods

2.1. Plant Materials and Experimental Details

Sixteen upland rice genotypes (labeled as G1 to G16) including Hawm Mali Doi (G1), Jao Khao Pichit (G2), Jao Daeng (G3), Sahm Deuan (G4), Ma–led–nai–fai (G5), Dawk Kha (G6), Hawm Jet Ban (G7), Khao/Sai (G8), Khao/Ruang (G9), Nual Hawm (G10), Dawk Kham (G11), Dawk Pa–yawm (G12), Goo Meung Lung (G13), Hua Bon (G14), Bow Leb Nahag (G15), and Mai Tahk (G16) were assessed in this study. Genotypes G1–G5 were short-duration genotypes whereas G5–G16 were long-duration genotypes. A description of the genotypes and the sites of collection are presented in Table S1. Two experiments interpreted as a potential experiment (1) and an experiment for yield assessment (2) were conducted in sheds located at the research area at the Faculty of Natural Resources, Prince of Songkla University, Hat Yai, Thailand. The experimental location lies between 7.0063° N and 100.4986° E. Topsoil was collected from the upper 60 cm layer of the cultivated field located near to the experimental site. The soil was first air-dried and then sieved with 2 mm mesh. A composite soil sample was taken before filling the soil into containers to determine the soil physicochemical properties, i.e., field capacity (FC), nutrient status, and fertilizer requirements. The soil class was sandy clay loam and the texture was coarse containing 66.03, 11.27, and 22.70% of sand, silt, and clay, respectively. The FC was 37.5% while the total nitrogen (N) and available phosphorus (P) were 0.07 and 10.37%, respectively, in the soil which indicated the need for optimum fertilizer management. The optimum rate of fertilizer based on field recommendations at the rate of 75 kg ha–1 N, 45 kg ha–1 P, and 45 kg ha–1 K+ was applied in three splits in both experiments.
The potential experiment (1) was conducted to obtain the grain yield of all of the genotypes used in the study under optimal conditions (Figure 1a) for model calibration. A completely randomized design in a factorial arrangement with three repetitions was used to layout the experiment. Seeds were planted at a 5 cm soil depth with a direct seeding method maintaining 16 plants m–2 at 30 × 20 cm row and plant spacing. The plants were irrigated by over-draining to keep the plants under non-stressed conditions from planting until maturity.
The second experiment for the yield assessment (2) was conducted to observe the yield response of all of the genotypes under three irrigation treatments including control (100% FC), moderate stress (70% FC), and severe stress (50% FC) treatments (Figure 1b). A strip plot design with three repetitions was used to layout this experiment. The genotypes in this experiment were divided into two groups to record the soil moisture contents, apply irrigation, and observe plant development as the genotypes were different in their growth and maturity duration, considering, genotypes G1–G5 in group A and G6–G16 in group B. The seeds were planted at a 5 cm soil depth with a direct seeding method maintaining 20 plants m–2 at 25 × 20 cm row and plant spacing. The plants were irrigated by over-draining until 60 days after planting (DAP) to keep the plants under non-stressed conditions for all of the treatments following which irrigation was applied as 100%, 70%, and 50% FC. Irrigation was withheld ahead of anthesis at the 68th DAP in group A and the 76th DAP in group B to induce additional water stress to observe temporary wilting in each genotypic group for the moderate stress and severe stress treatments, whereas the control treatment was continued to irrigate with 100% FC until maturity. Following stress induction which lasted for six consecutive days and observation of temporary wilting, irrigation for the moderate and severe stress treatments was resumed at the 74th DAP in group A and the 82nd DAP in group B, respectively, to keep the plants at 70% and 50% FC, respectively, until maturity (Figure 1b). The moisture contents to calculate the irrigation amount during the treatment application period were recorded by using a W.E.T sensor (Delta–T Devices) [32] on a daily basis at a 0–15 cm soil depth by taking an average of the moisture contents recorded from three random units in each treatment of both genotypic groups. The moisture contents for the control, moderate stress and severe stress treatments were calculated as 37.5%, 26.25% and 16.75% of FC, respectively. Irrigation was applied to maintain FC levels, when moisture contents were decreased from their respective values in each treatment due to water loss and evapotranspiration.
Phenology, grain yield, and biomass were recorded at harvest maturity. Three plants were selected and were taken as a sample to record the grain yield and biomass after oven-drying the plants and grain samples at 70 °C until no change in weight was observed. The grain yield and biomass data in kg ha–1 were then calculated by multiplying the respective weight per plant and plant population.

2.2. Drought Susceptibility Index (DSI)

Mean grain yield at harvest maturity was used to calculate the measure of yield stability, the drought susceptibility index (DSI), and the relative yield (RY) for all of the genotypes in the yield assessment experiment only. The formulae for DSI [14] was as follows:
DSI = (1–Yd/Yw)/D
where Yd = mean yield under applied drought stress, Yw = mean yield under non–stressed or optimum conditions, and D = environmental stress intensity which is 1– (mean yield of all genotypes under applied drought conditions/mean yield of all genotypes under non–stressed or optimum conditions). The RY under each treatment was calculated as the yield of a particular genotype under the applied respective treatment divided by that of the highest yielded genotype in the studied specific population [5].

2.3. Model Calibration

The CSM–CERES–Rice module present in DSSAT modeling system software was the base model in this study. The model requires minimum data sets [43] to calculate daily vegetative and reproductive growth components as a function of daily growth stage, photosynthesis, and nitrogen and water stresses. Prior to application of the models, cultivar coefficients must be calibrated to obtain the observed yield and biomass under optimum growing conditions [44,45]. For calibrating CSM–CERES–Rice, it needs a set of cultivar-specific parameters known as phenology and growth coefficients in addition to phyllochron interval coefficient (PHINT) [25]. The cultivar coefficients used in this study were derived from our previous study, but for attaining simulation accuracy, the model was readjusted with phenology and the yield data recorded from the potential experiment (1). PHINT, which controls the timing of the first appearance of leaves as well as the yield, was used as a constant for all of the studied genotypes, whereas the remaining eight phenology and growth coefficients were calibrated [25]. Weather data for model input including the daily maximum (Tmax.) and minimum temperature (Tmin.) (°C) were recorded using a data logger (UA–002 HOBO Economic Data Logger for Temp/Light) and daily solar radiations (MJ m–2 day–1) were calculated using the weatherman tool in DSSAT software for the growth period of both experiments. To calibrate the model, variables for which iterations were performed included days to 50% anthesis, days to 50% physiological maturity, grain yield (kg ha–1), aboveground biomass (kg ha–1), and harvest index (%).

2.4. Model Application and Decision Support in Genotypic Identification

Following model calibration, the data recorded from the yield assessment experiment (2) were used to test the accuracy of simulation of CSM–CERES–Rice to estimate the yield under different applied irrigation treatments. Model evaluation for the yield assessment experiment was completed by comparing the observed results with the simulated days to 50% anthesis, days to 50% physiological maturity, and grain yield (kg ha–1). The genotypes selected from the yield response which was evaluated by DSI and RY under water stress treatments were further explored using CSM–CERES–Rice to study the effect of drought stress on genotypic yield and to find out the relationship between grain yield, drought stress, and WUE for a better understanding and decision support in the selection of genotypes. Considering the drought stress indices simulated by CSM–CERES–Rice, there are two types of stress indices, one for photosynthesis (ph) and a second for the growth expansion (ex). These stresses are calculated on a daily basis and the stress range is between 0 to 1 which means no drought stress at 0 and full stress at 1 [36]. Both stresses taken as an average stress during the growing season were used to observe the effect of drought severity on each genotypic response. The Priestley–Taylor evapotranspiration (PT) method [37] and the daily FAO-56 Penman–Monteith (PM) model [38] are used in CSM–CERES–Rice for determining potential evapotranspiration while simulating soil and plant water dynamics as stated earlier. To estimate the drought stress index under the applied drought stress treatments in this study, the PT method was used in the model. The simulated WUE was then calculated as the ratio between simulated grain yield and simulated evapotranspiration for all of the genotypes.

2.5. Statistics

Data collected from the yield assessment experiment (2) were analyzed using statistical package Statistix 8.1 (Analytical software, Tallahassee, FL, USA) [46,47] to confirm the significance of the results from the analysis of variance (ANOVA). Model performance evaluation was presented by root mean square error normalized (RMSEn) (3) [48] and the index of agreement (d) (4) [49]. RMSEn was calculated by using the equation for RMSE (2). These statistical indicators are tools for testing the goodness of simulation models. The RMSE (2) between the simulated and observed values for a data set with n measured values and the RMSEn (3) is defined as:
RMSE = i = 1 n ( S i O i ) 2 n
RMSE n = RMSE   × 100 O ¯
where Si = simulated value, Oi = observed field value, n = number of observations, and Ō = the overall mean of observed field values. The d–index (4) was calculated by the following equation:
d = 1 i = 1 n ( S i O i ) 2 i = 1 n ( S i + O i ) 2
where Si = simulated value, Oi = observed field value, and n = number of observations, Sʹi = SiŌ and Oʹi = OiŌ. The values of RMSEn computed and the d-value defined the degree of agreement between the simulated values; with respect to the observed values, a low RMSEn value and a d-value approaching unity is desired. Lower values from 10% for RMSEn specify strong agreement between simulated and observed results. The simulation results are considered excellent if the RMSEn values are less than 10%, good if the RMSEn values are greater than 10% and less than 20%, fair if the RMSEn values are greater than 20% and less than 30%, and poor if the the RMSEn values are greater than 30% [48].

3. Results

3.1. Weather Conditions and Soil Moisture Contents

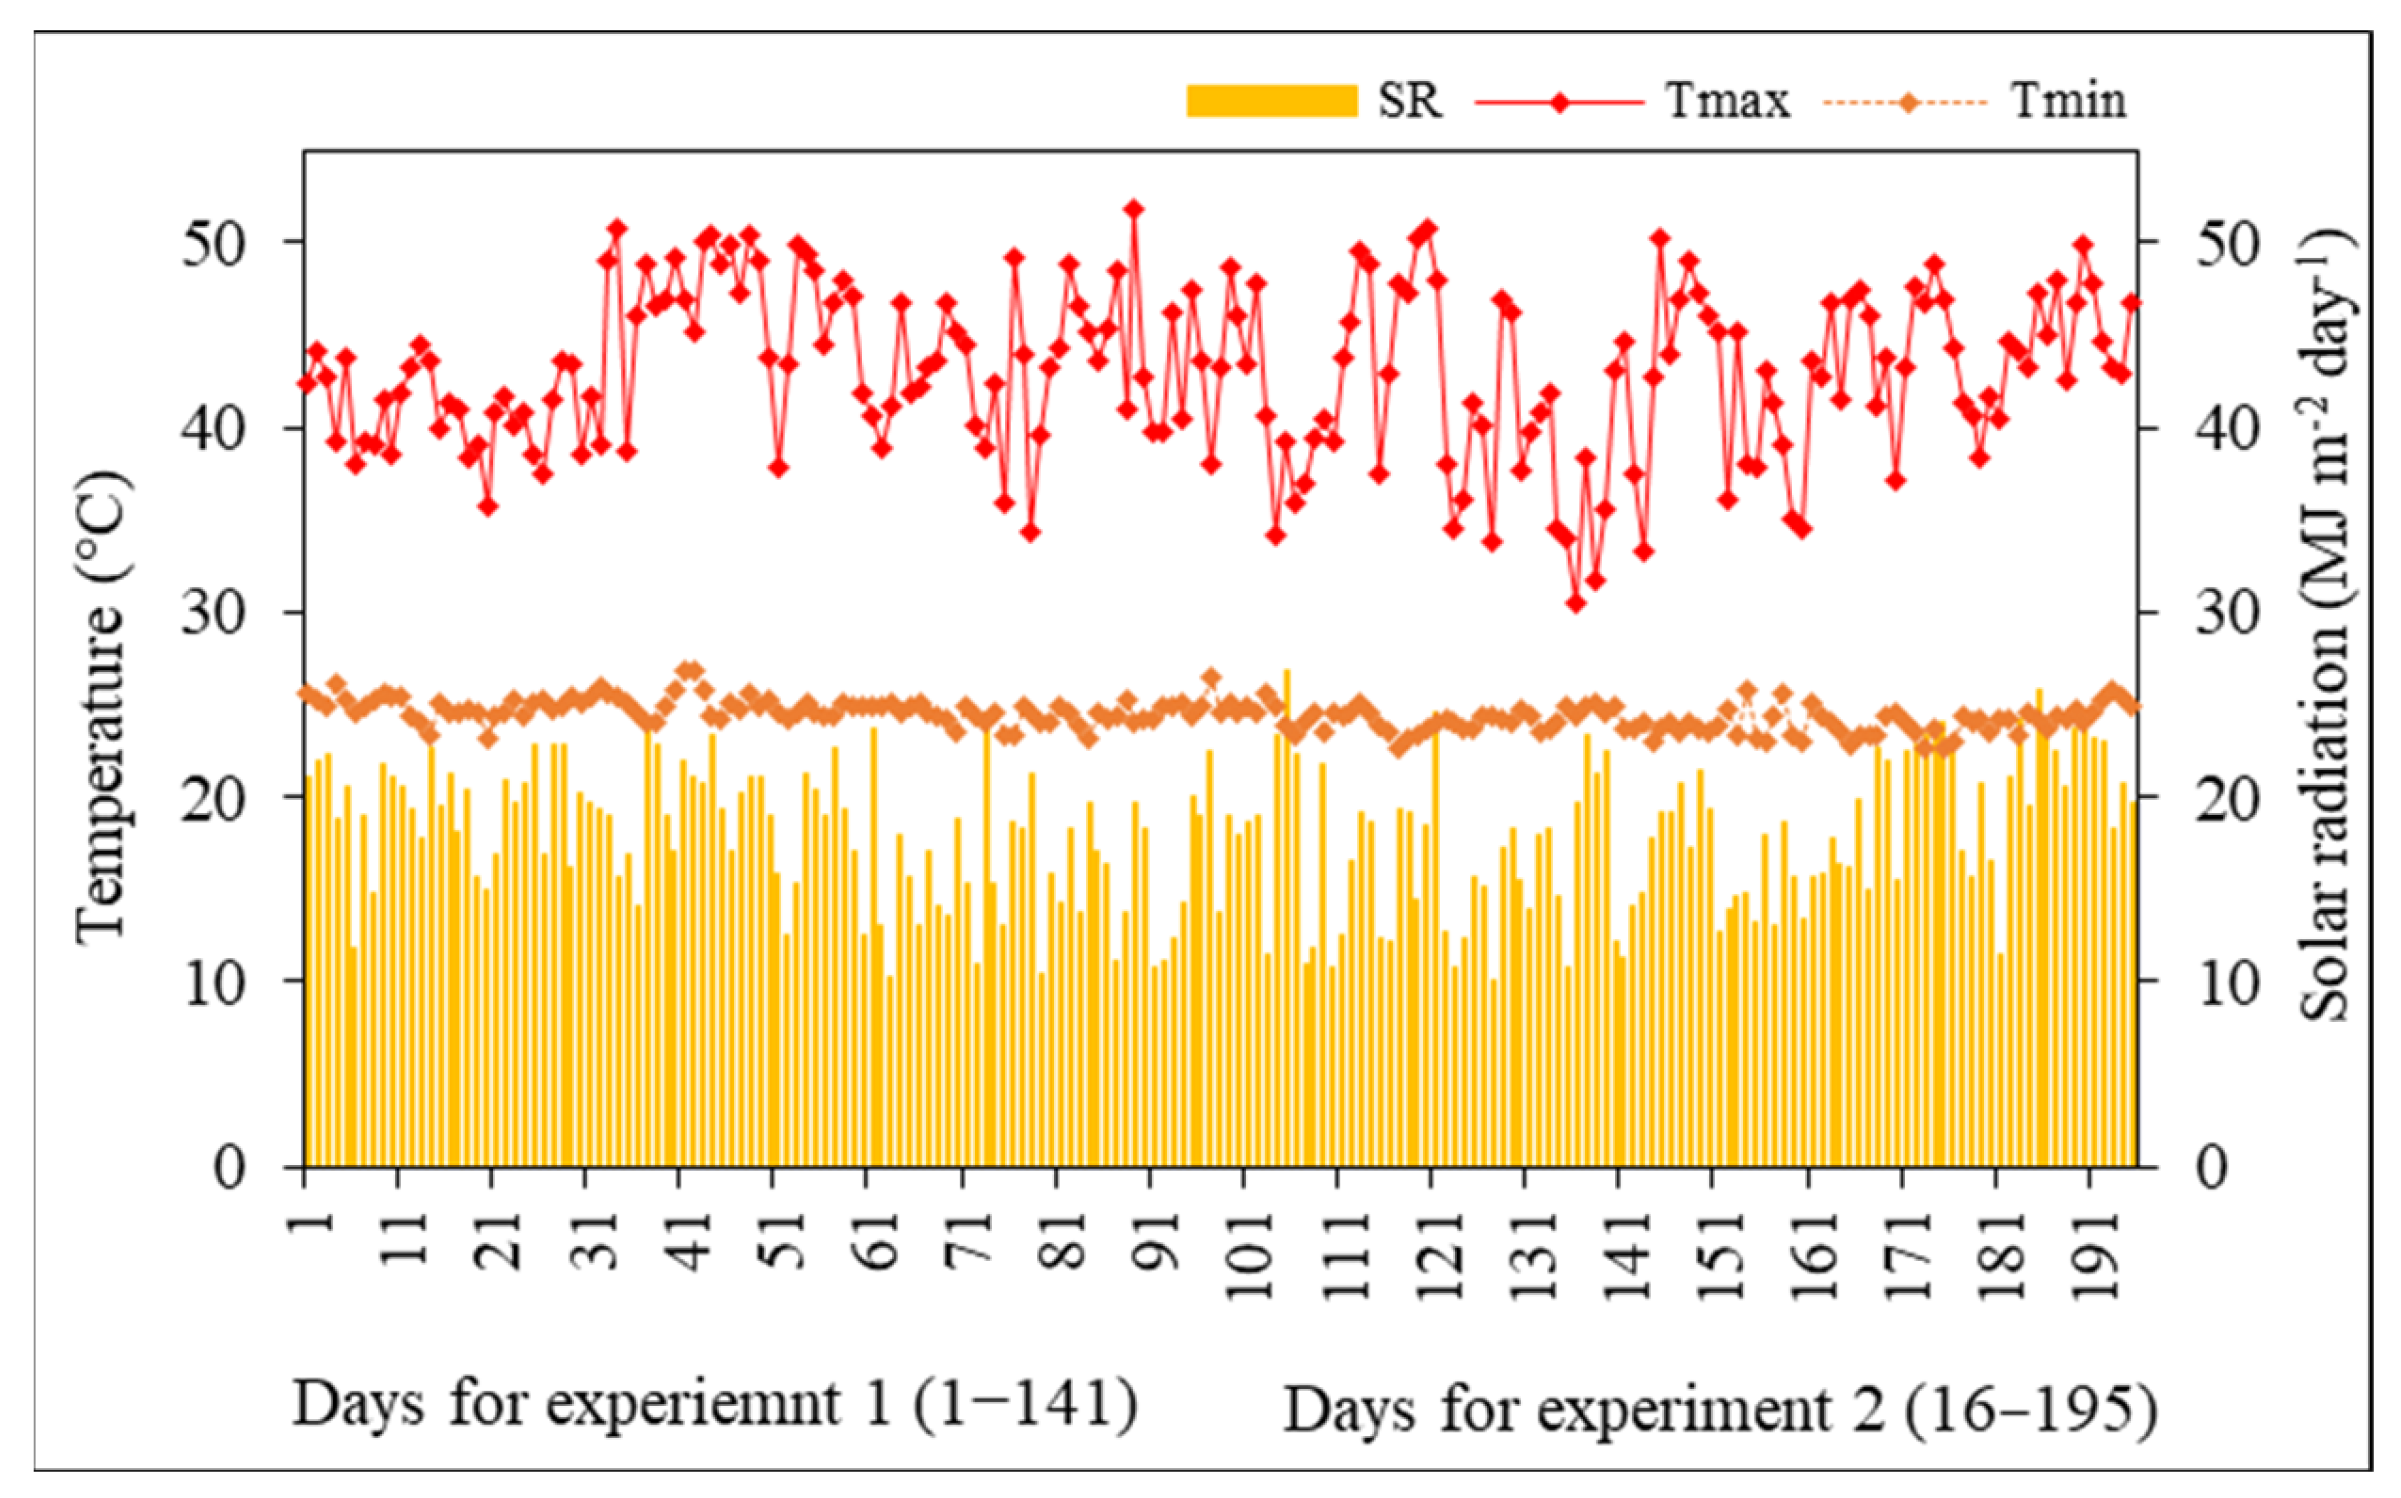
The daily maximum and minimum temperatures that prevailed during the growth period of the potential experiment ranged from 30 to 43 °C and 23 to 25 °C with an average of 43 °C and 25 °C, respectively. The daily maximum and minimum temperatures for the yield assessment of the experiment ranged from 30 to 43 °C and 23 to 24 °C with an average of 43 and 24 °C, respectively (Figure 2). The solar radiation calculated by the Weatherman tool present in the DSSAT modeling system for both experiments ranged from 10 to 18 MJ m–2 day–1 with an average of 18 MJ m–2 day–1 (Figure 2). The moisture contents observed for group A genotypes (Figure 3a) ranged between 23.4 to 33%, 5.7 to 28.4%, and 4.1 to 25.2% for the control, moderate stress, and severe stress treatments, respectively. The moisture contents observed for group B genotypes (Figure 3b) for the control, moderate stress, and severe stress treatments ranged 21.7 to 32.8%, 14.4 to 28.9%, and 9.3 to 24.1%, respectively. Lower moisture content values in the range for moderate stress and severe stress treatments indicated a decline in soil moisture contents during stress induction for six consecutive days. Following that, irrigation resumed, and soil moisture contents were increased in each genotypic group (Figure 3).

3.2. Drought Susceptibility Index (DSI) and Grain Yield (GY)

Statistical analysis indicated that grain yield was highly significantly different for the genotypes, treatments, and their interaction (Table S2). The grain yield of the studied genotypes decreased by 24–62% under moderate stress and by 43–78% under severe stress as compared to the control. DSI values ranged from 0.54 to 1.38 for moderate stress treatment (Table 1). Genotypes G8, G11, G12, G13, and G16 were among the top five comparatively drought-resistant genotypes (DSI values < 1) while genotypes G3, G4, G5, G6, G7, G10, G14, and G15 were drought-susceptible (DSI > 1) under moderate stress treatment. The DSI values for the severe stress treatment ranged from 0.68 to 1.23 (Table 1). Genotypes G6, G8, G10, G12, and G15 were among the top five comparatively drought-resistant genotypes (DSI values < 1), while genotypes G1, G3, G5, G7, G13, and G14 were drought-susceptible (DSI > 1) under severe stress treatment. The observed mean of relative GY values under non-stressed treatment, the control, and imposed water stress under moderate and severe stress treatments were 0.72, 0.61, and 0.75, respectively (Table 1). The mean of the RY under water stress was less as compared to the control with moderate stress while it was higher with the severe stress treatment. The drought-resistant genotypes (DSI values < 1) G8, G11, G12, G13, and G16 under moderate stress treatment and G6, G8, G10, G12, and G15 under severe stress treatment were also among the top five comparatively high-yielding genotypes (RY > mean RY) (Table 1).

3.3. Model Calibration

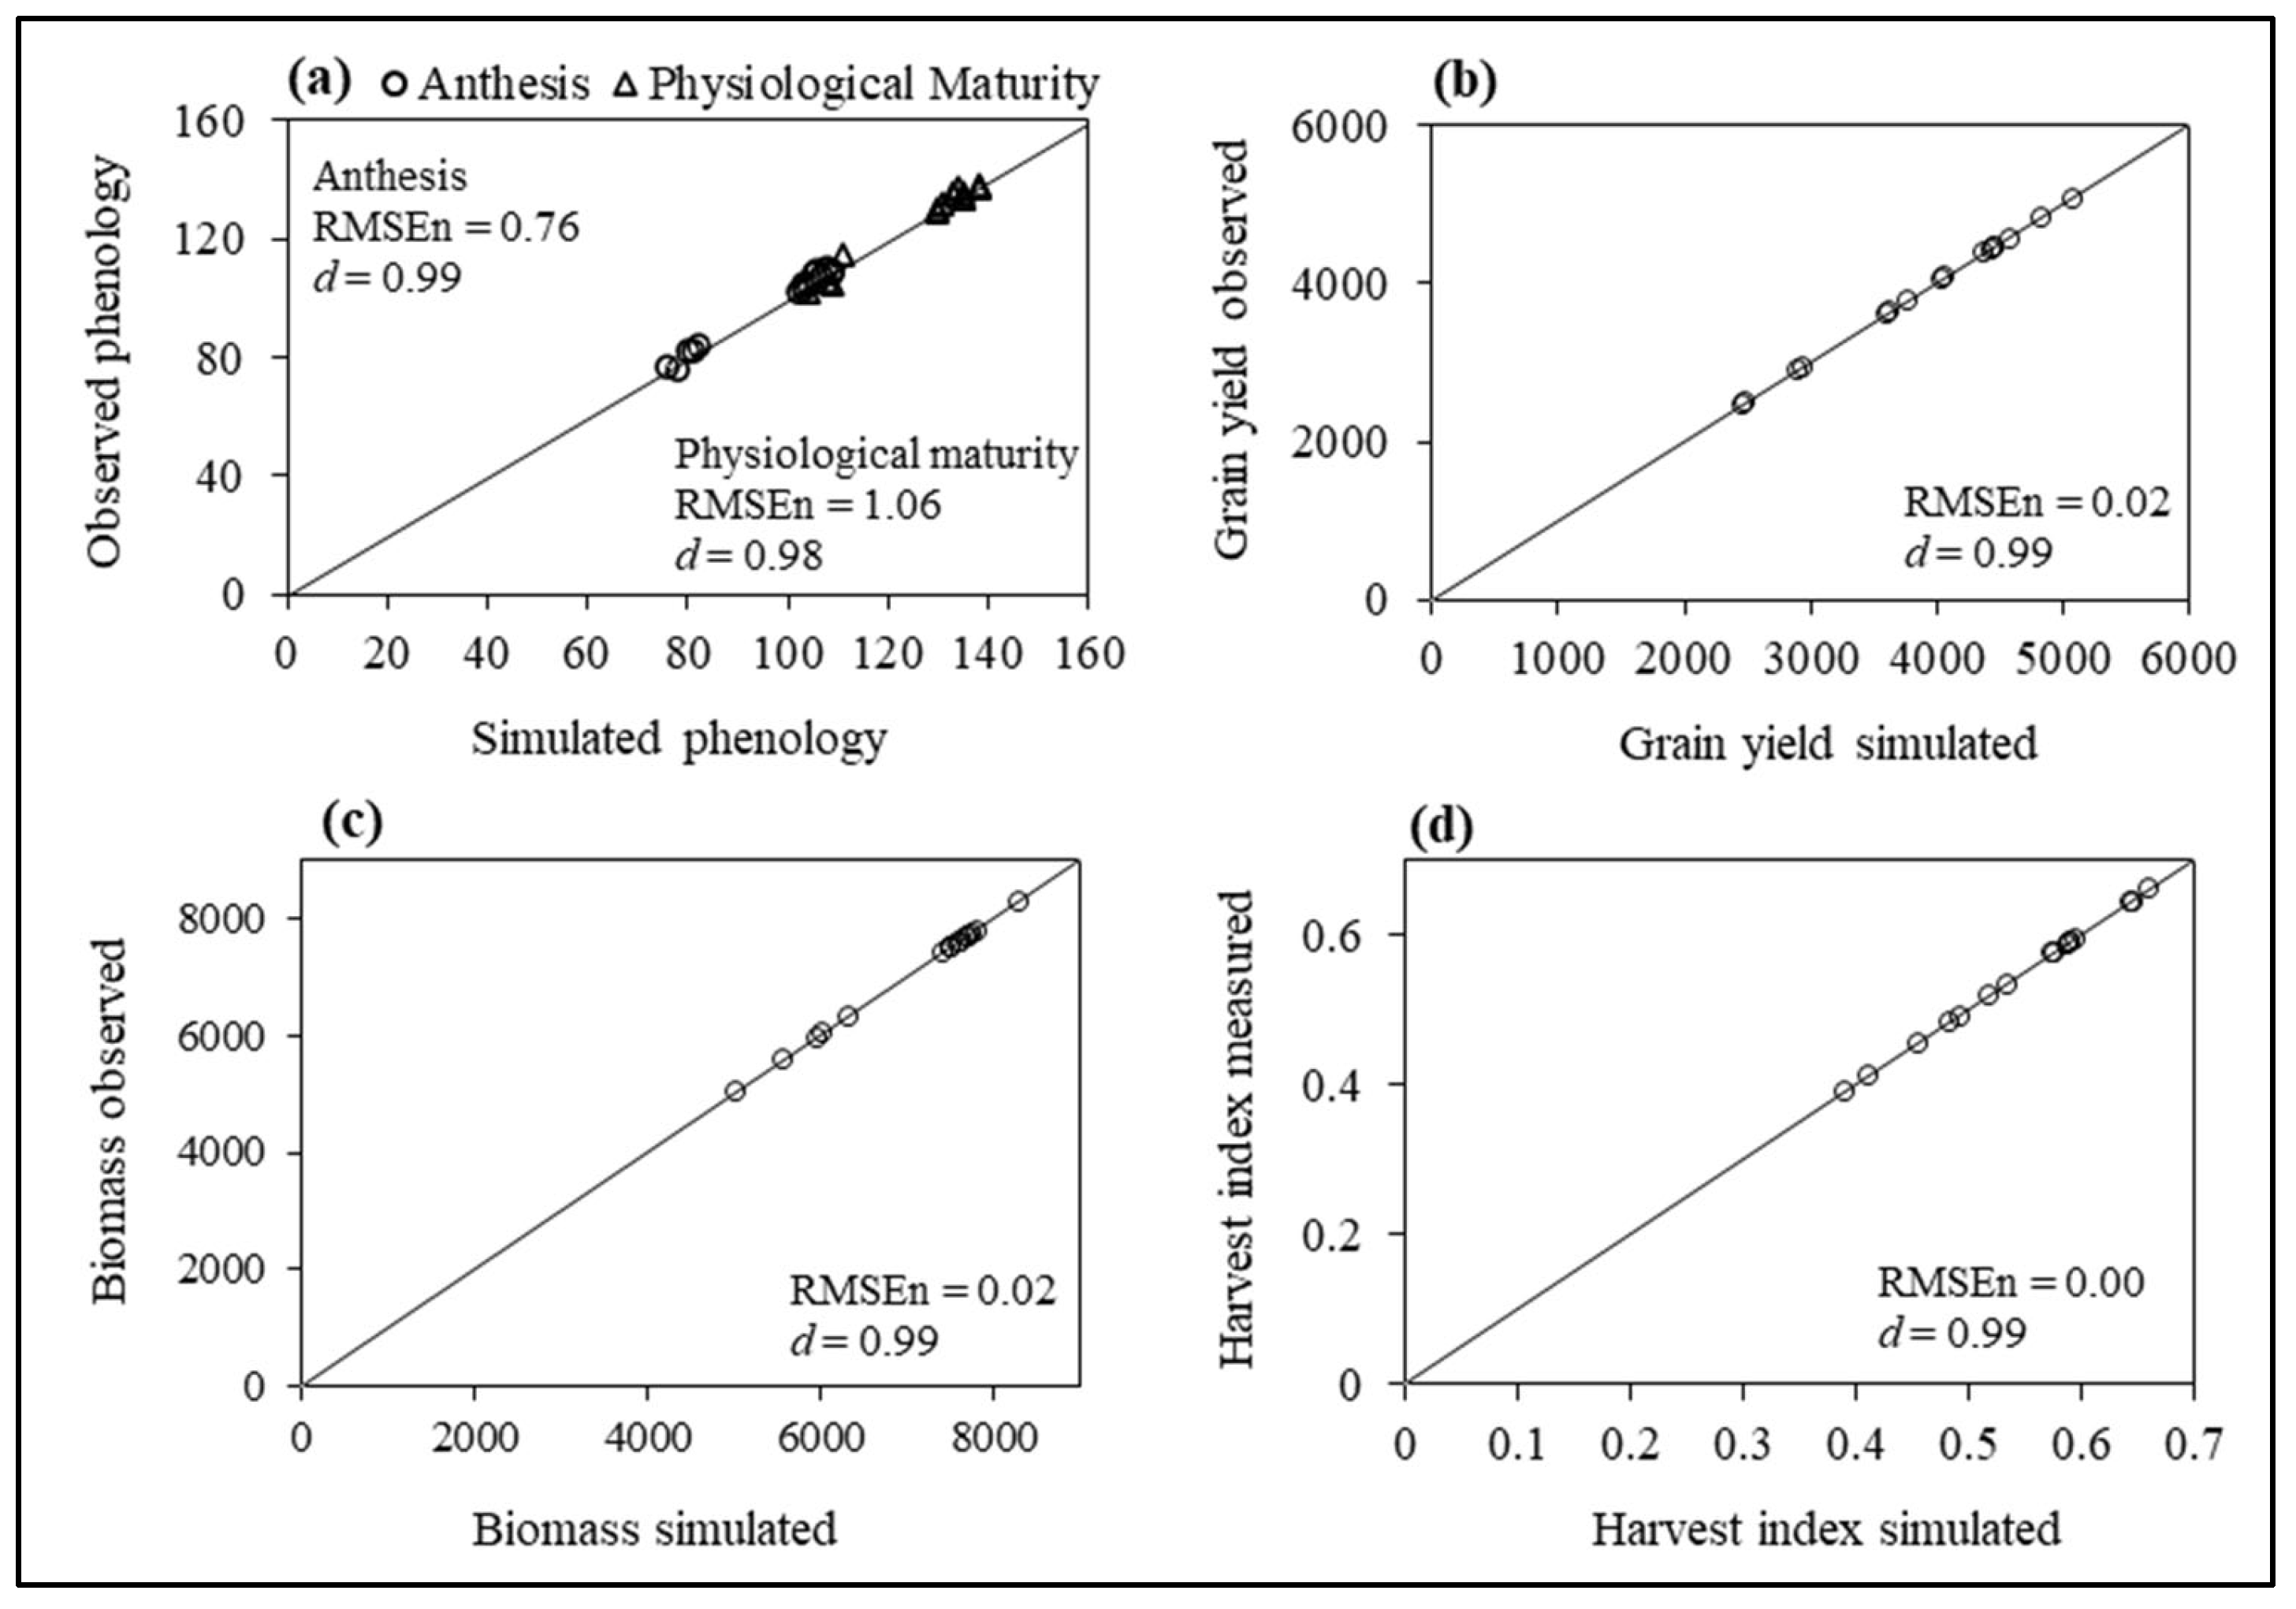
Calibration of a model is an important step for the adjustment of crop growth and yield parameters to ensure that simulations can be well compared with observations. Data collected from the potential experiment (1) conducted under optimal management were used to calibrate the model. Simulations exhibited superior performance and there was a strong agreement between the simulated and observed values for the phenology and yield parameters. RMSEn values of 0.76 and 1.06 and a d-index value of 0.99 and 0.98 were observed for days to flowering and maturity (Figure 4a). The model simulated excellent results for grain yield with RMSEn of 0.02 and a d-index value of 0.99 (Figure 4b). Aboveground biomass (Figure 4c) and harvest index (Figure 4d) were also very well simulated with 0.02 and 0.00 RMSEn and 0.99 for the d–index, respectively. Estimated cultivar coefficients explained the unique phenological and yield attributes of upland rice genotypes well, whereas the genetic coefficients for group A genotypes were lower in value as compared to the group B genotypes.

3.4. Simulated Phenology and Grain Yield for Yield Assessment Experiment

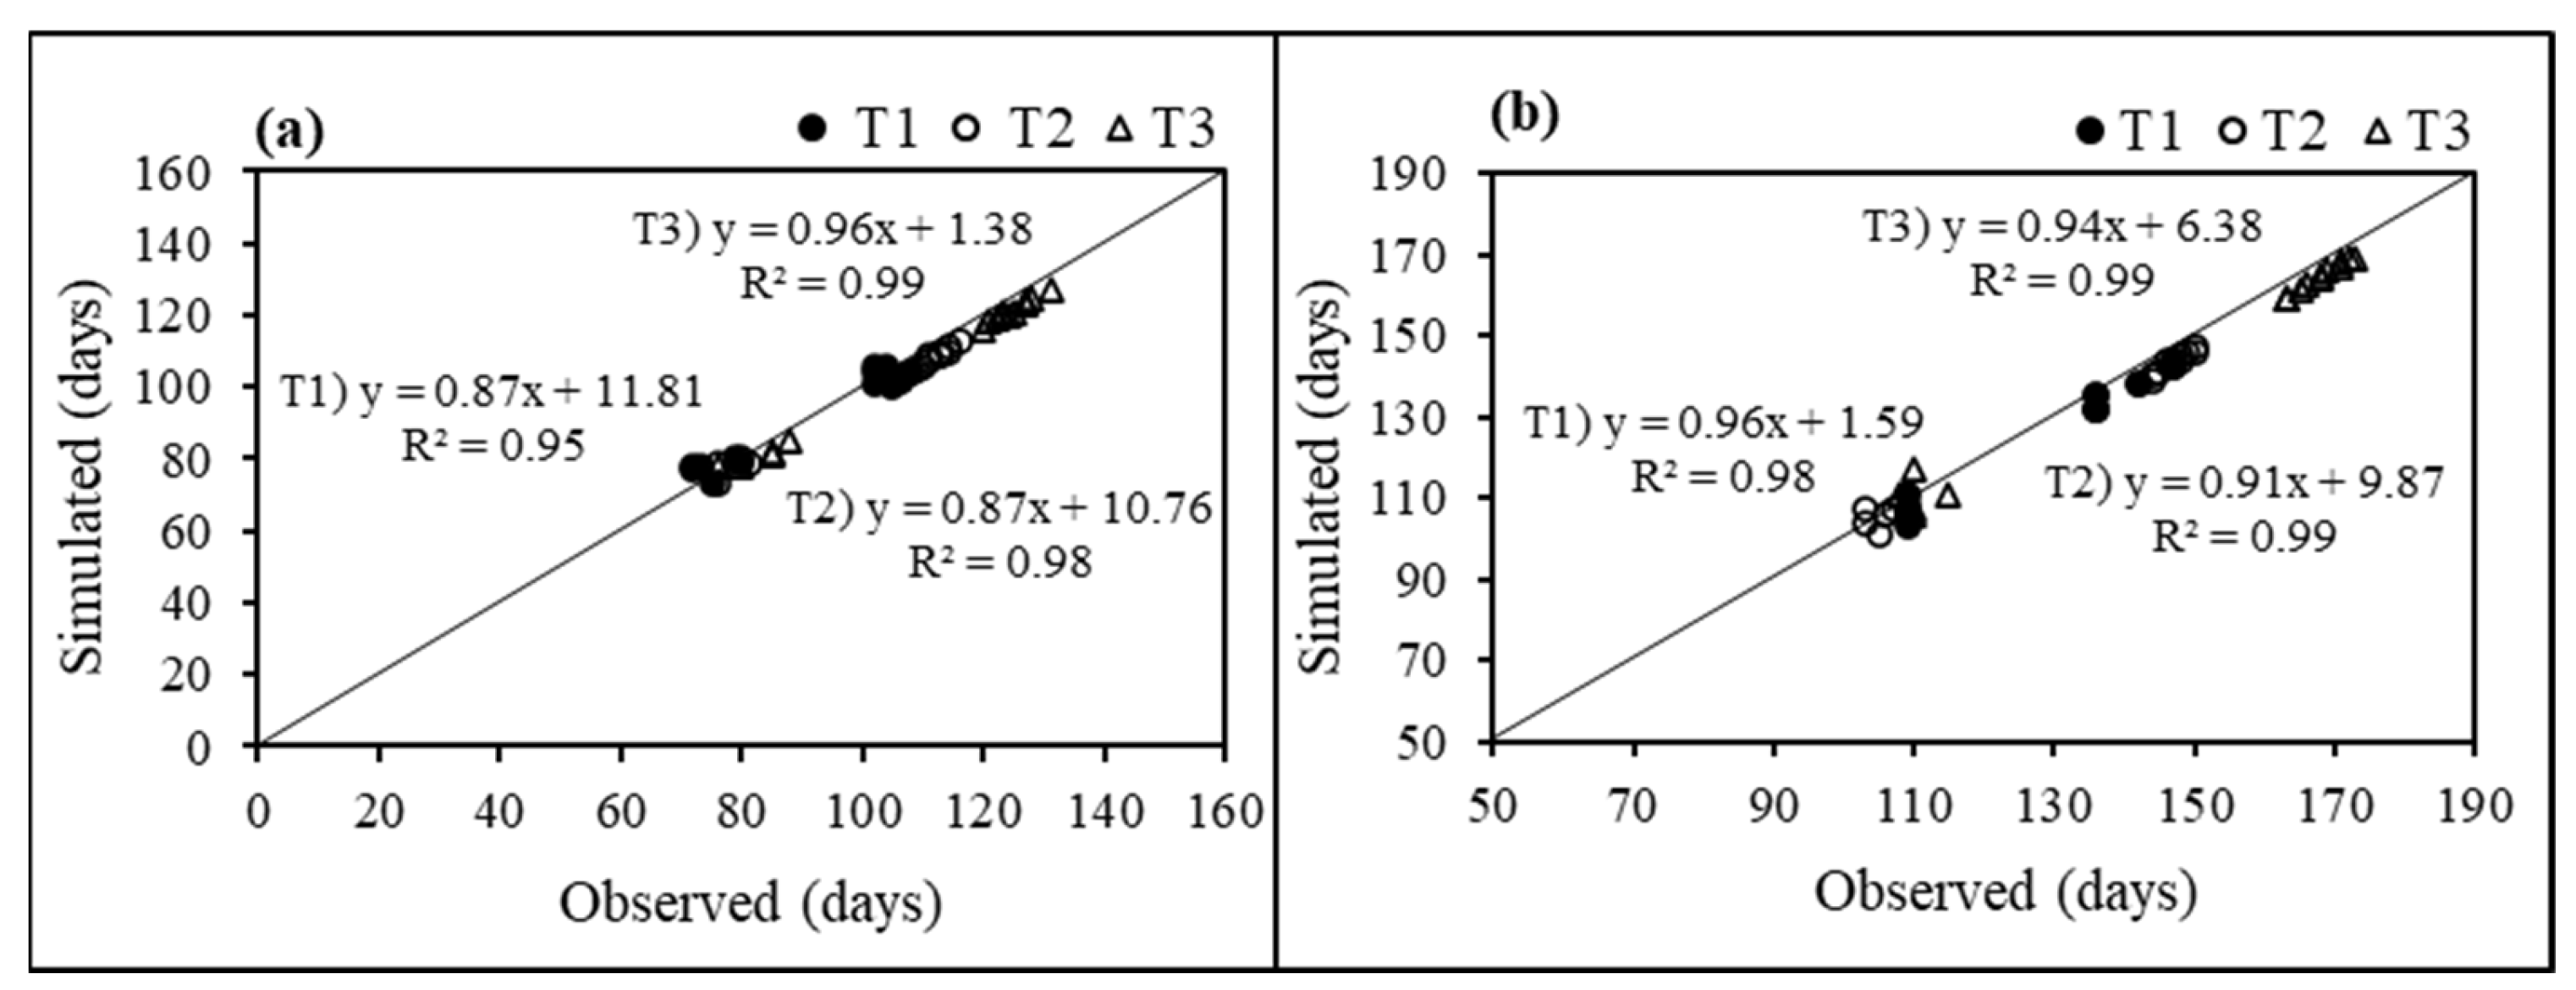
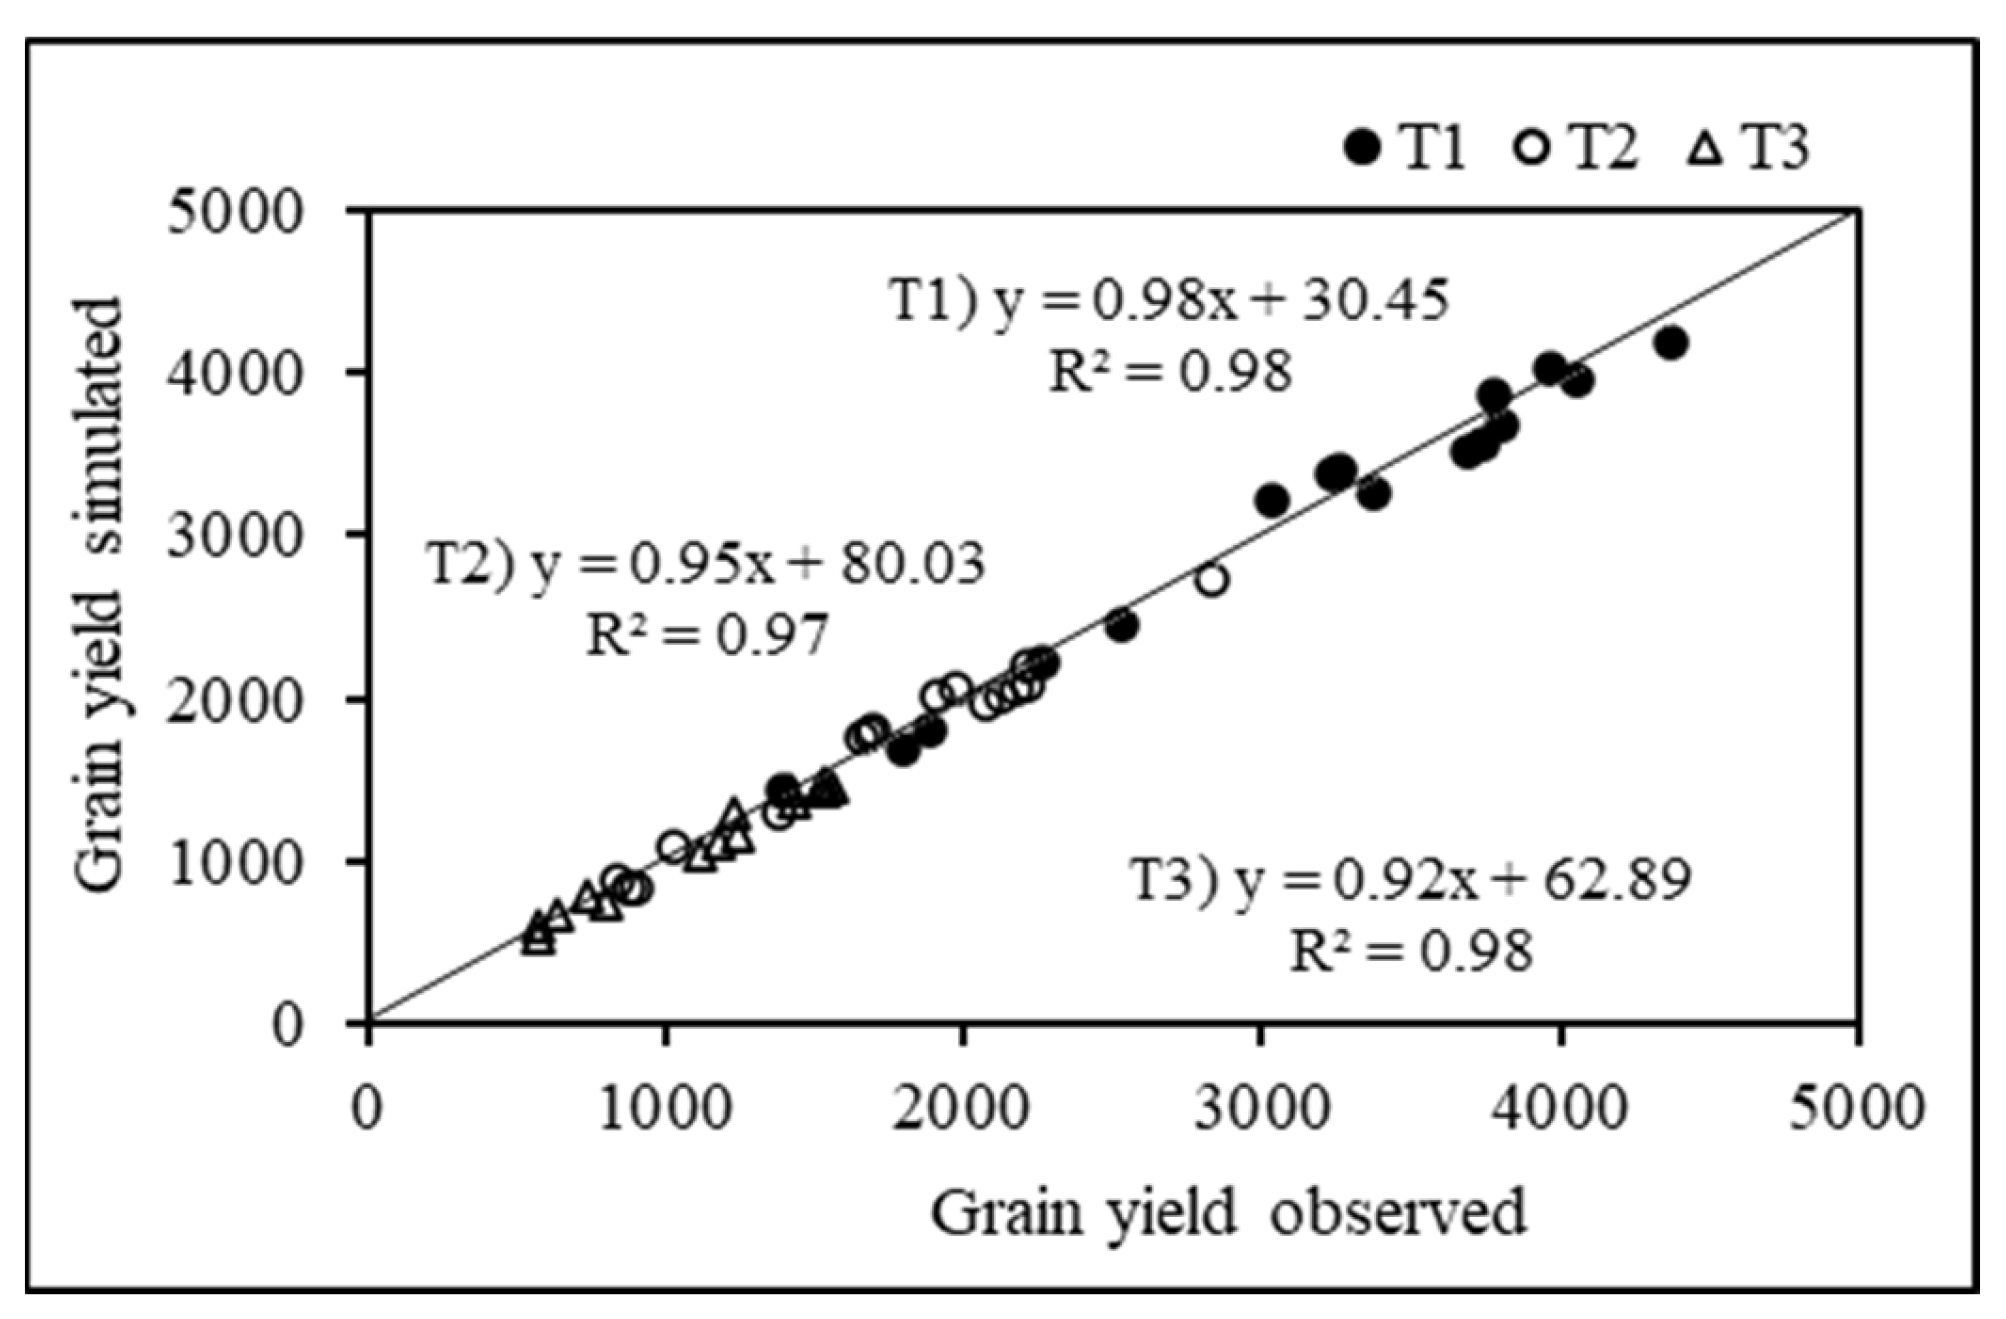
Statistical analysis indicated that days to anthesis and days to maturity were highly significantly different for the genotypes, treatments, and their interaction (Table S2). For analyzing the capability of CSM–CERES–Rice to predict phenology and grain yield under different water regimes and applied stresses, simulated and observed values were compared. Phenology was compared with the difference in the number of days for each genotype. Differences in simulated and observed days to anthesis and maturity ranged from +5 to –4 and +2 to –6 for T1, +6 to –4 and +4 to –5 for T2 and +2 to –4 and +3 to –4 for T3 for all of the genotypes. A 1:1 line graph also indicated a good agreement between the simulated and observed days to anthesis (Figure 5a) and the days to maturity (Figure 5b) for all of the genotypes in each treatment. RMSEn was used to compare between the simulated and observed grain yield for the control, moderate stress, and the severe stress treatments, and their values ranged from 0.92 to 3.82 for the control, 0.37 to 3.78 for moderate stress, and 0.61 to 3.93 for the severe stress treatments (Table 2). The 1:1 line graph also showed a good agreement between the simulated and observed grain yield for all of the genotypes in each treatment (Figure 6).

3.5. Simulated Drought Stress Indices

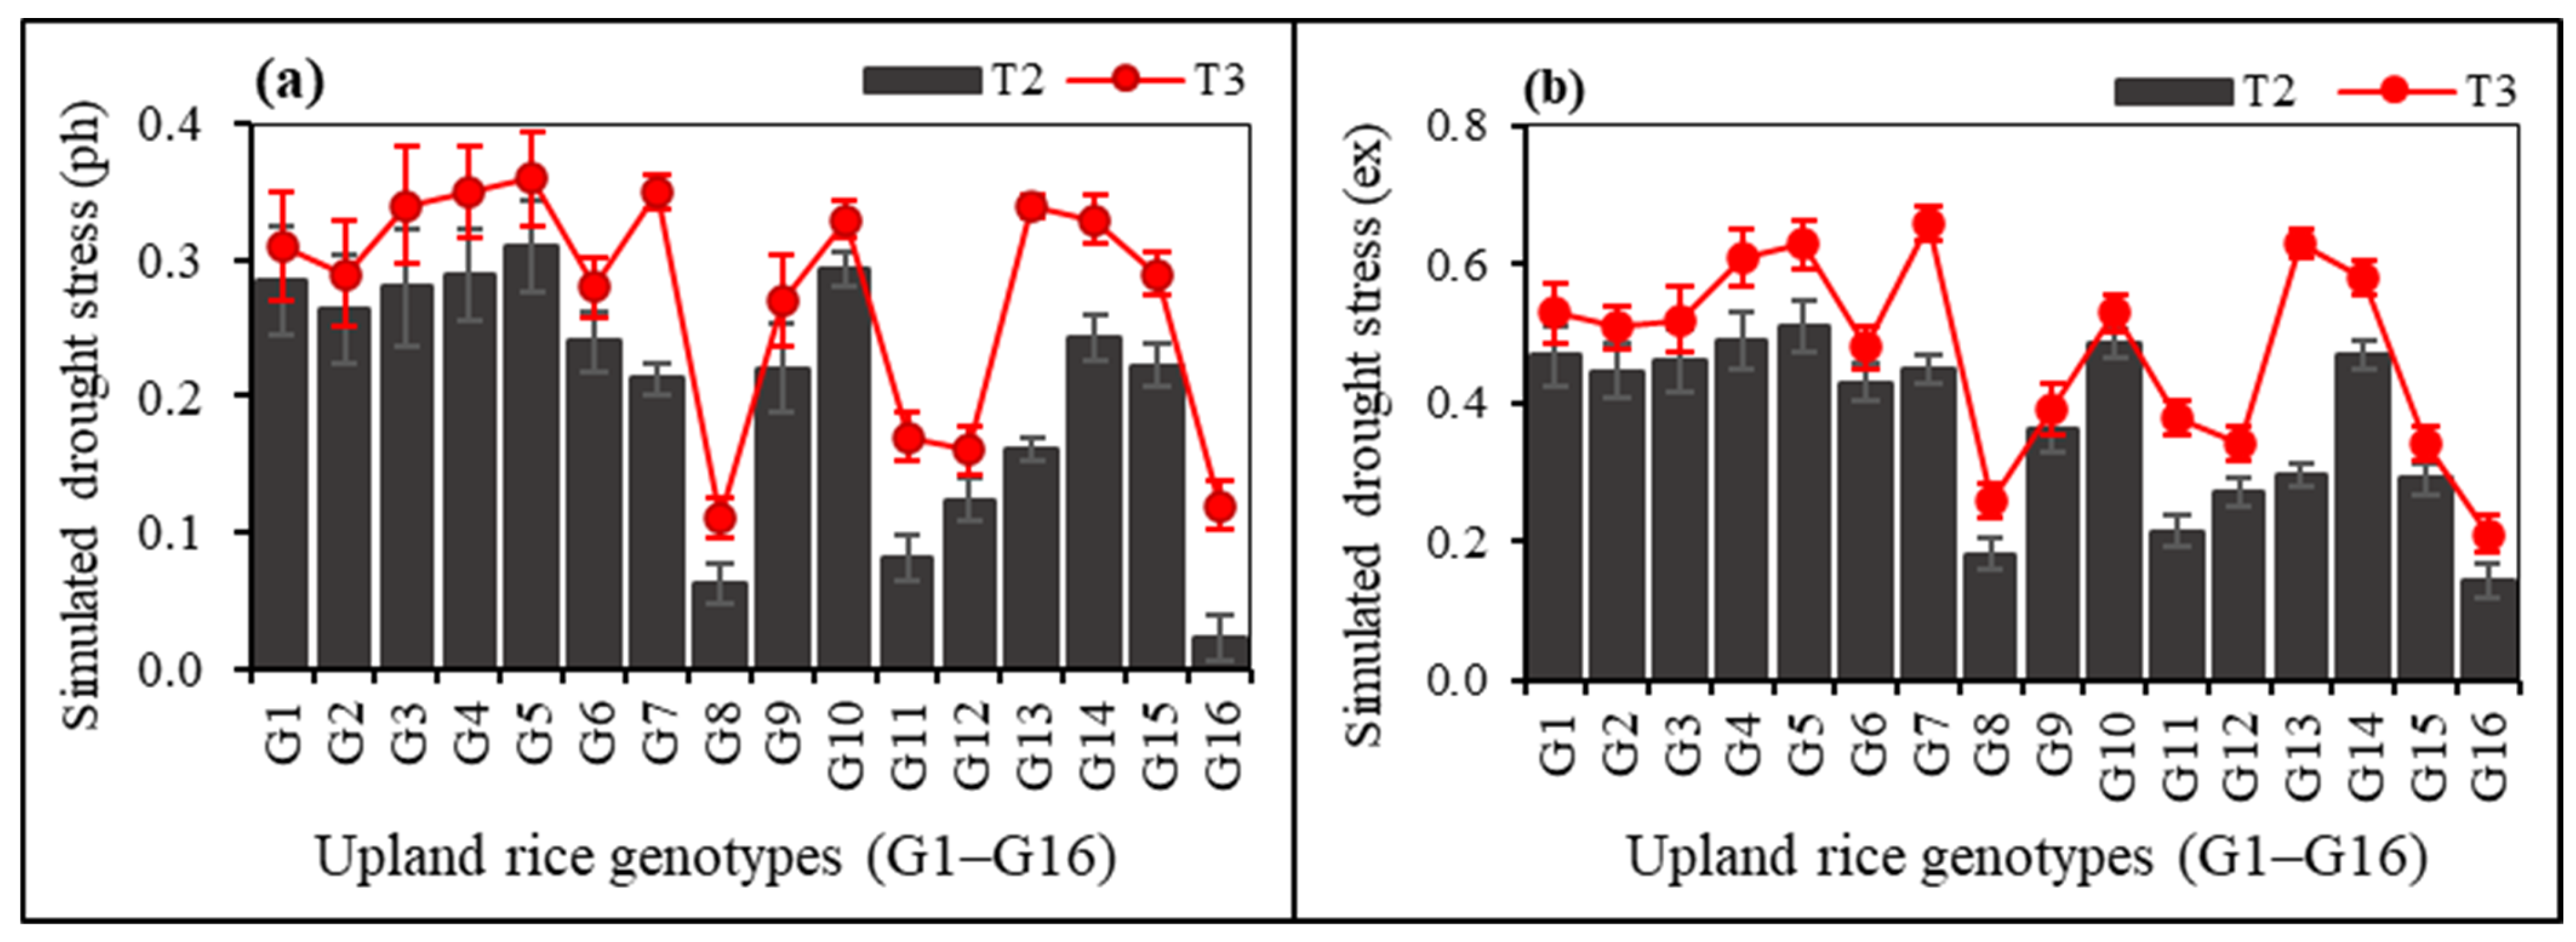
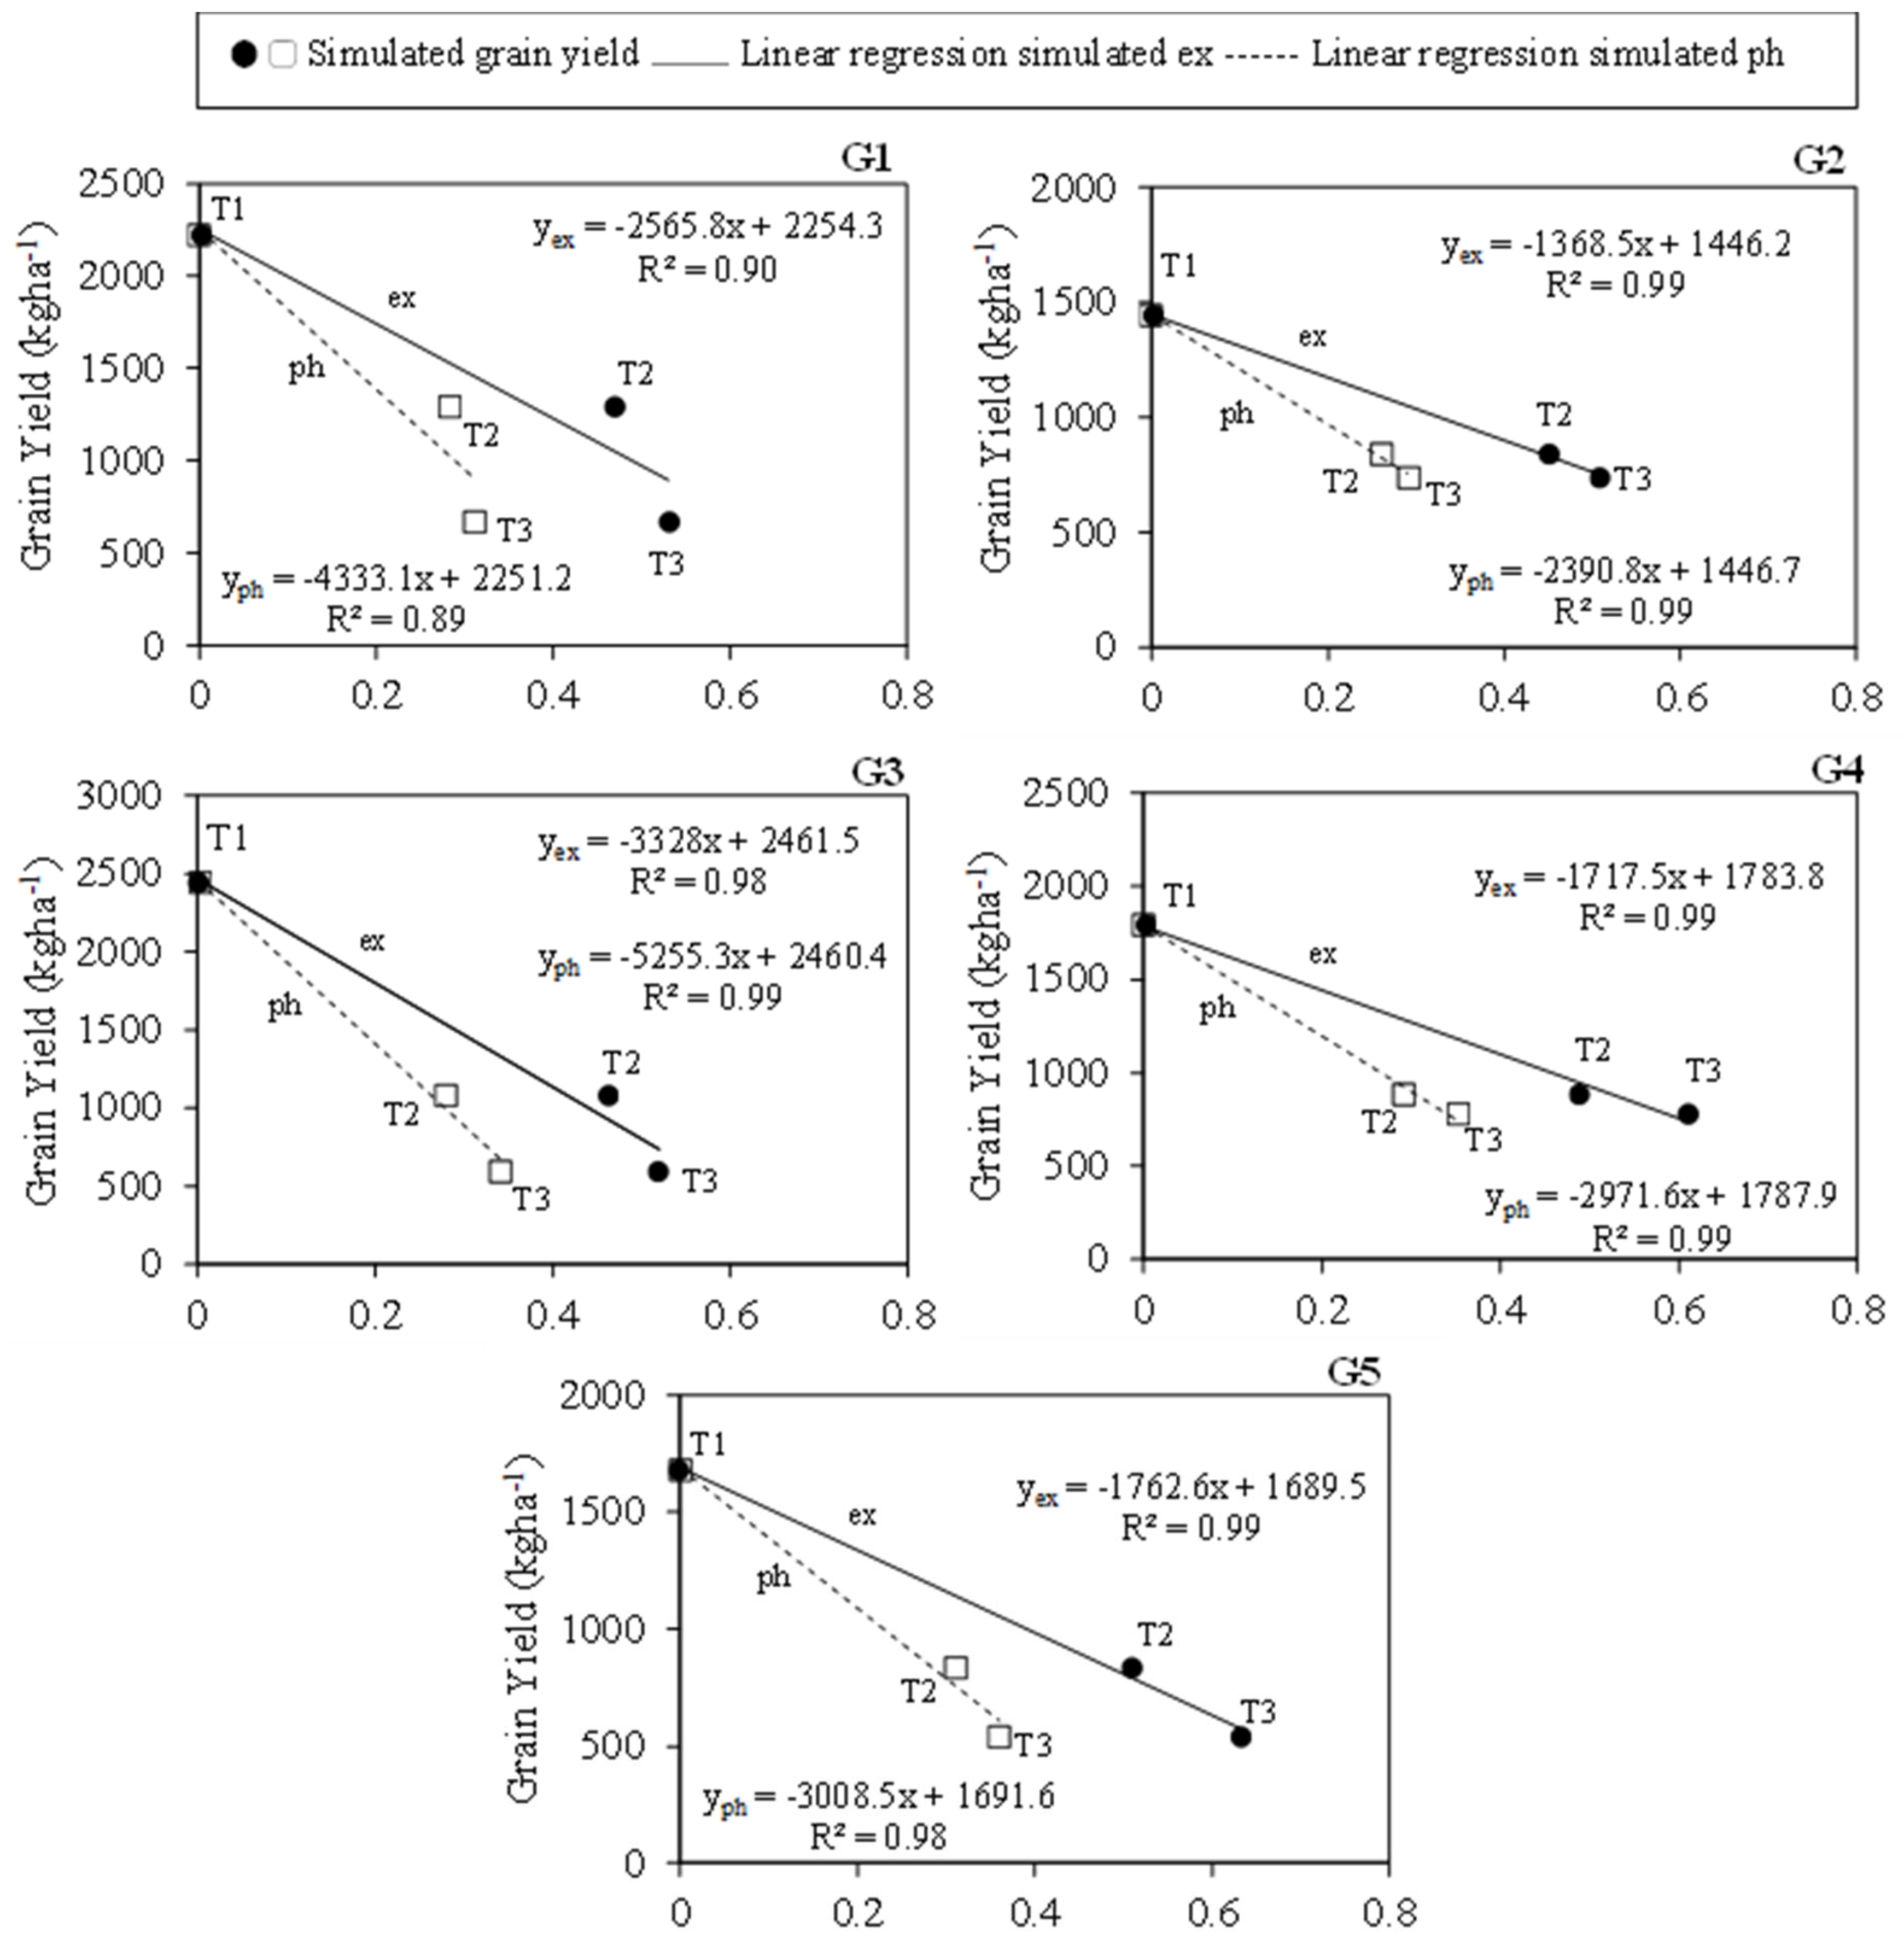
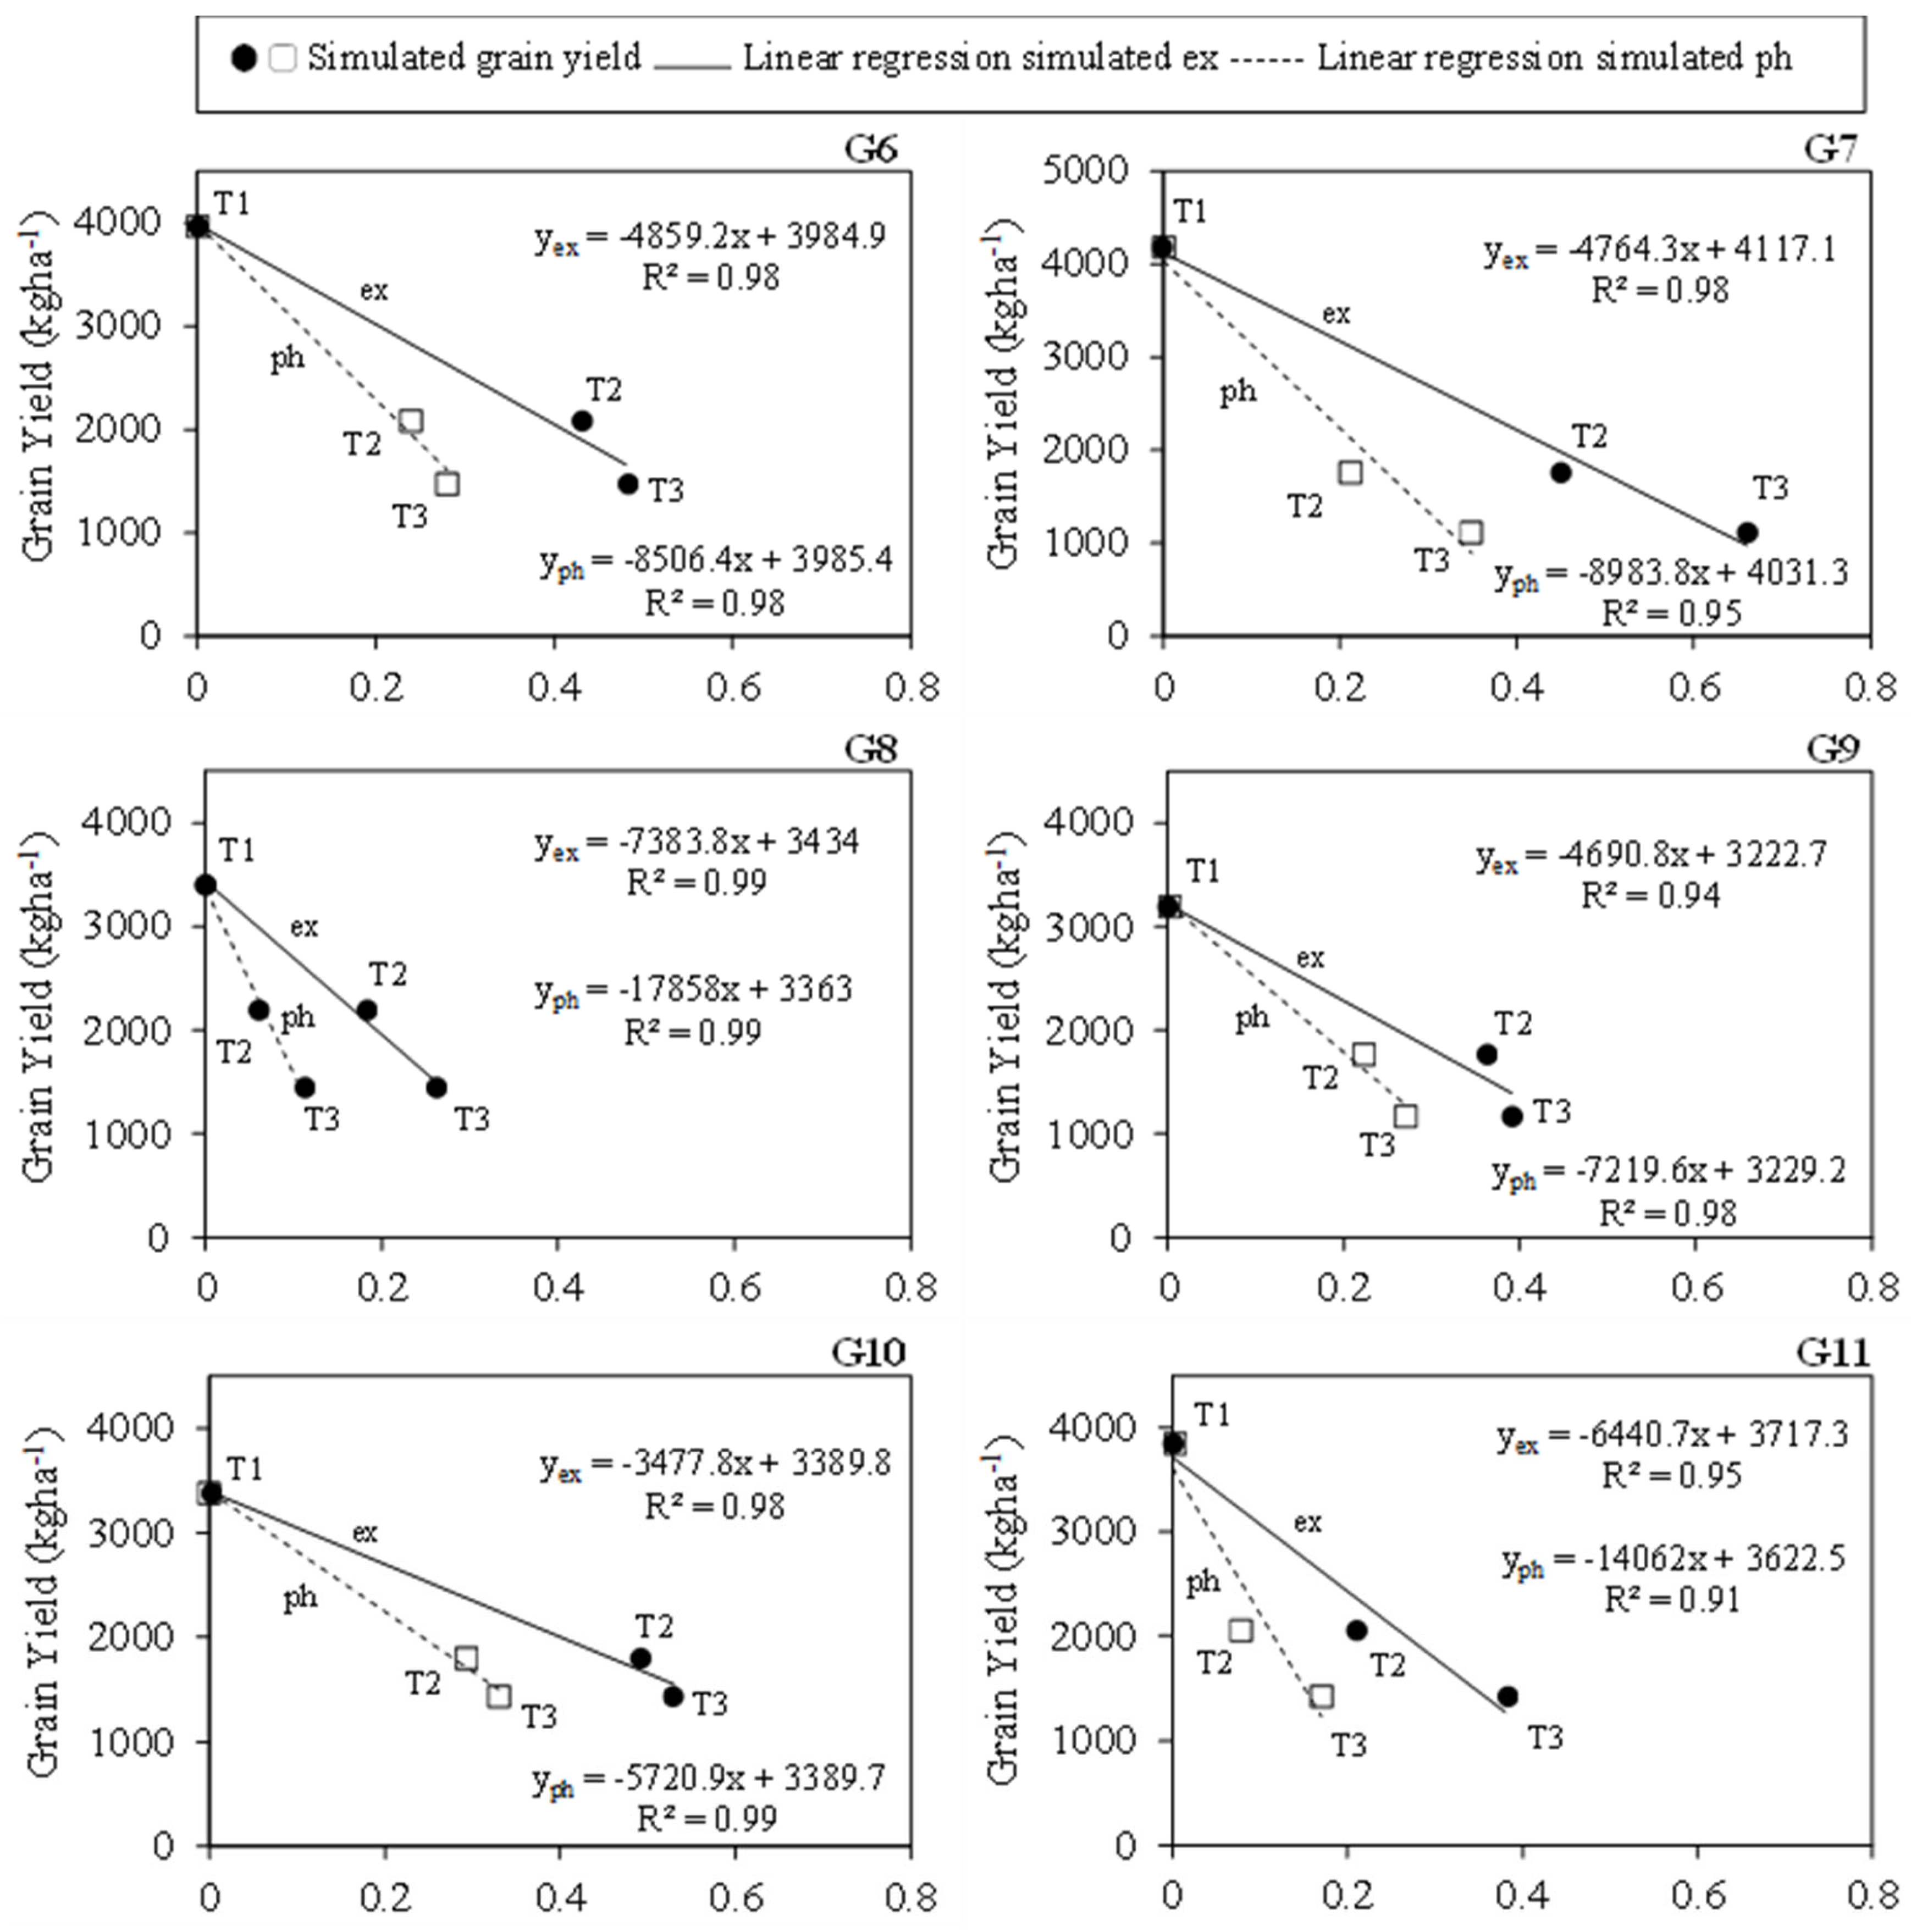
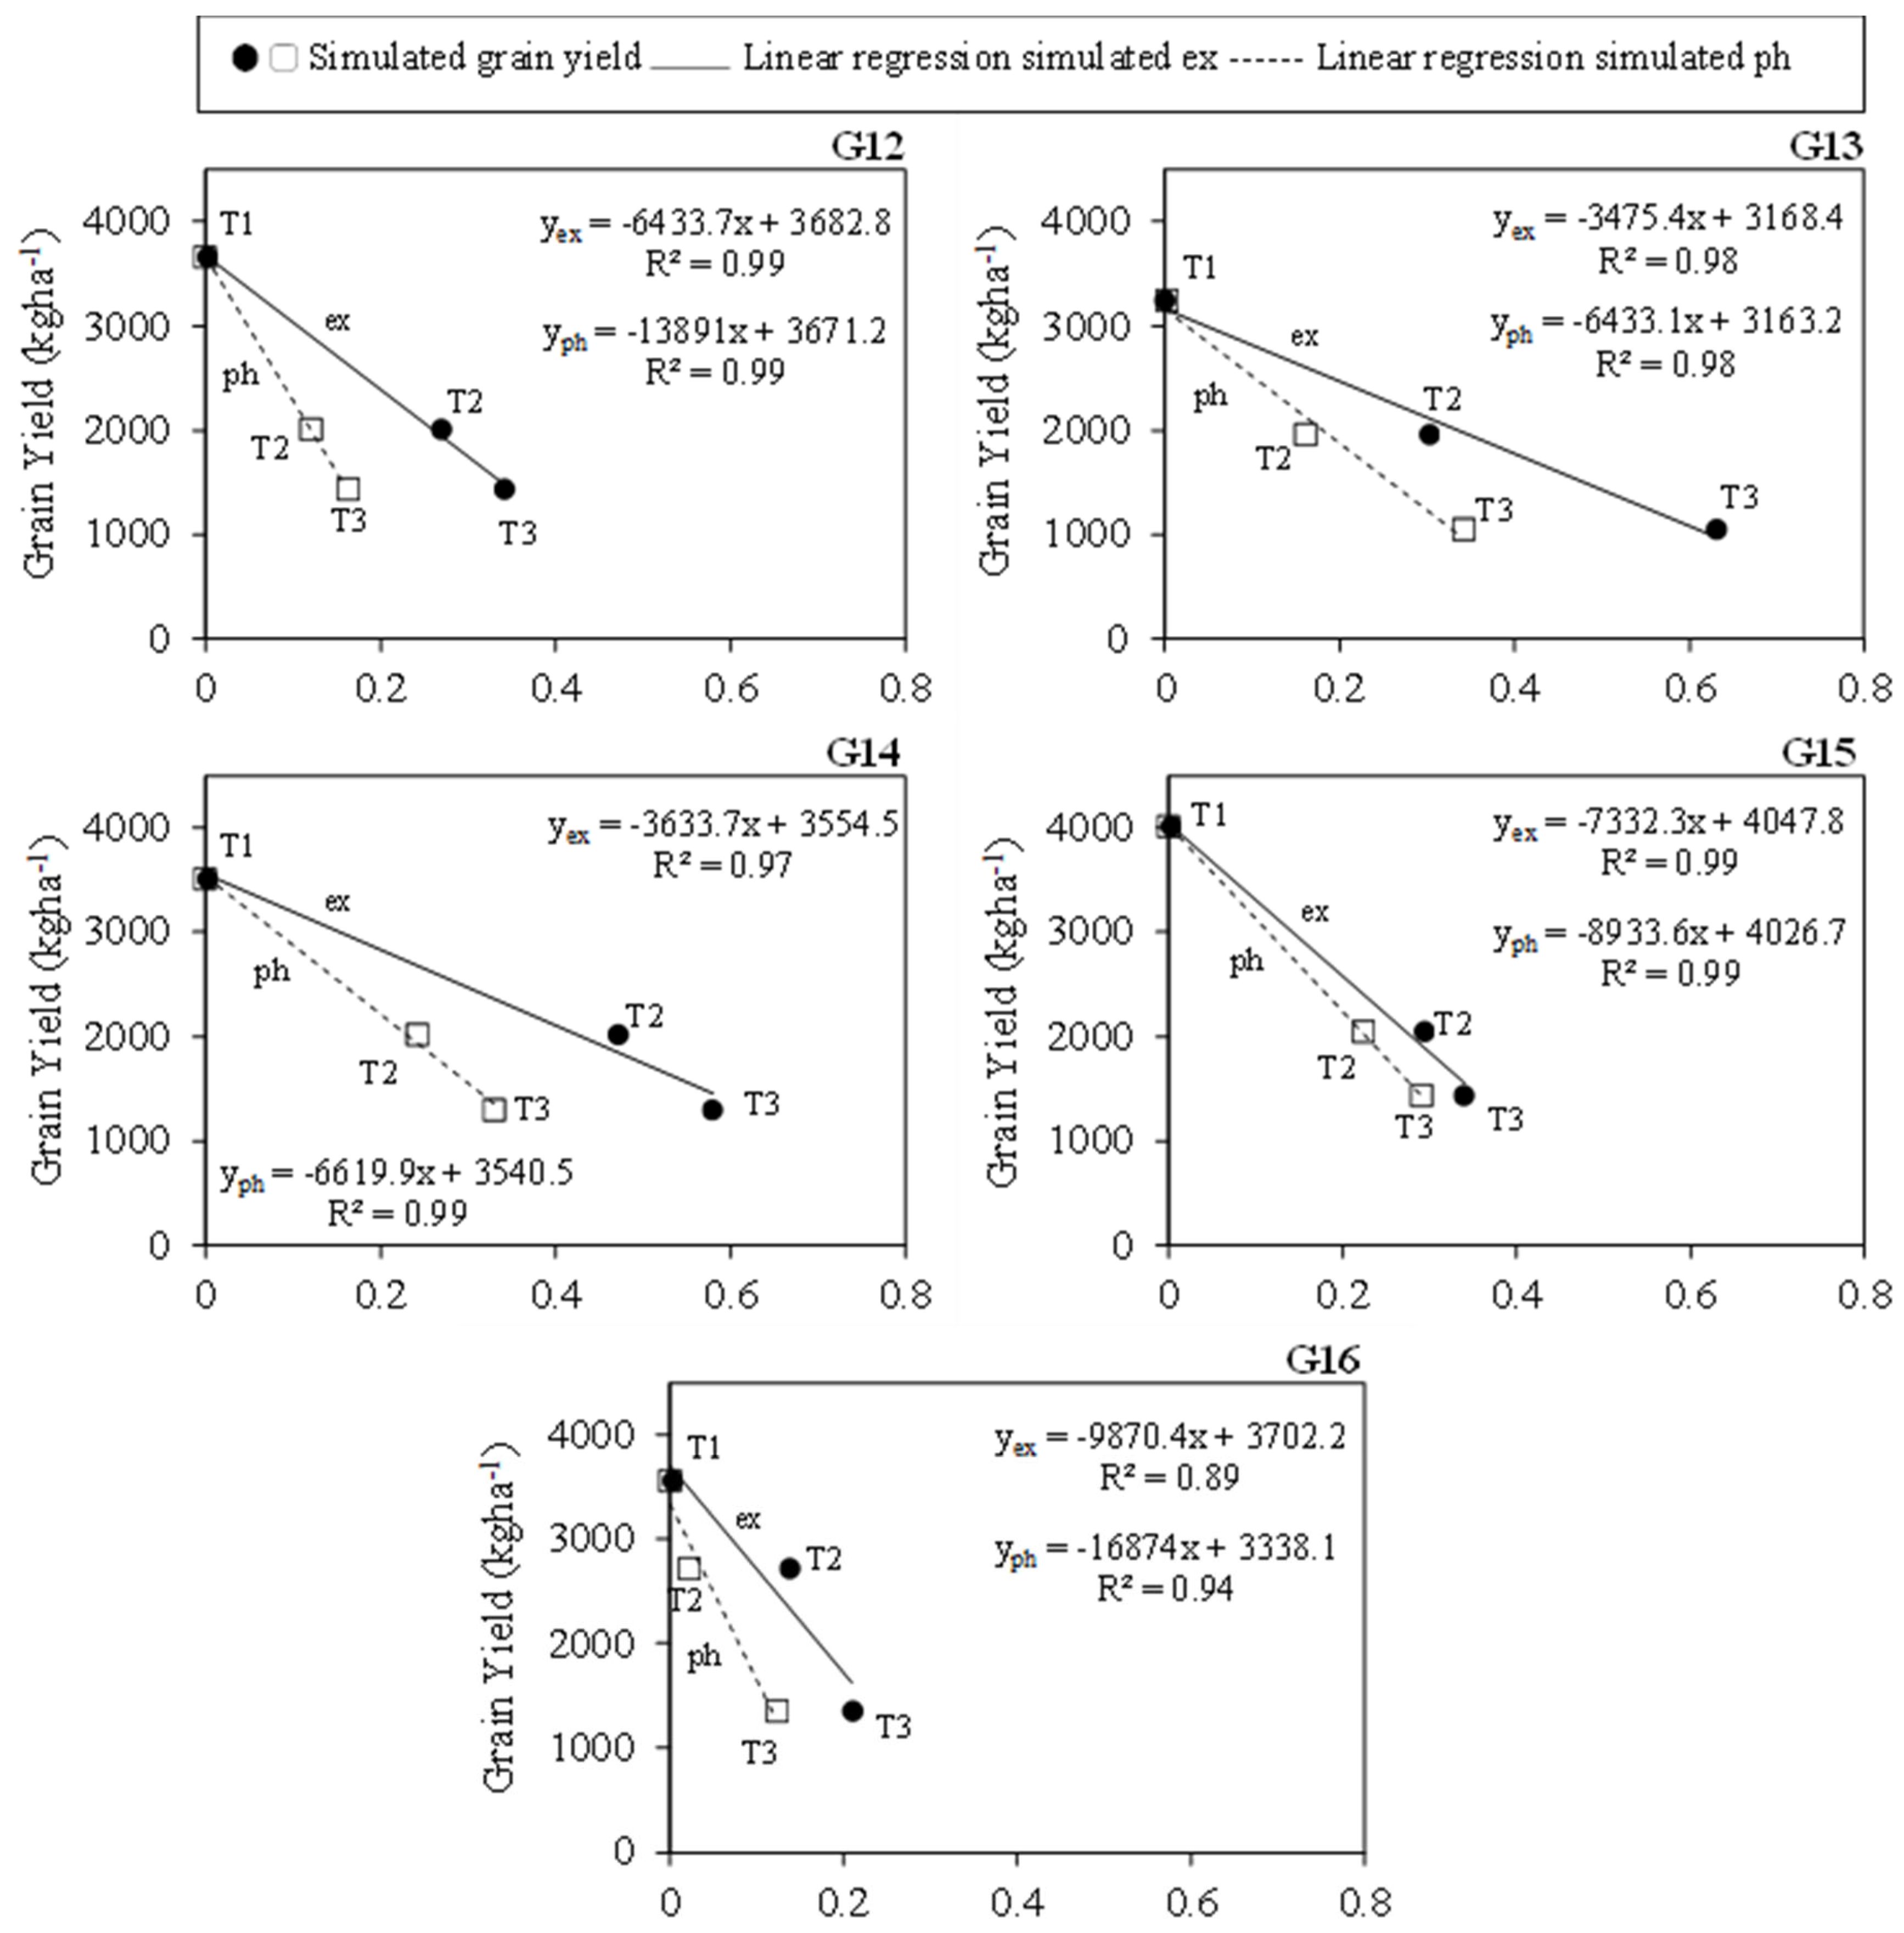
Drought stress indices including the stress index for photosynthesis (ph) (Figure 7a) and the stress index for growth expansion (ex) (Figure 7b) were simulated for each genotype. Simulations indicated that under controlled conditions, the genotypes were not exposed to drought stress as the rice genotypes received an adequate water supply during the growing season, and all of the genotypes produced maximum grain yields at no stress in the control treatment. Under moderate stress treatment, the average stress values for photosynthesis and expansive growth ranged from 0.02 to 0.31 and 0.14 to 0.51, respectively, for the studied genotypes. The intensity of stress was increased under severe stress treatment and the genotypes faced drought stress ranging from 0.11 to 0.36 and 0.21 to 0.66 for stress for photosynthesis and growth expansion, respectively. Drought stress for growth expansion had more severity than the stress for photosynthesis in all of the genotypes (Figure 7, Figure 8, Figure 9 and Figure 10). Increased drought stress in both treatments significantly decreased the grain yield and a highly significant inverse relationship was observed between the simulated grain yield and simulated drought stress indices for photosynthesis and growth expansion in the regression analysis (Figure 8, Figure 9 and Figure 10). The relationship between the drought stress index and the rice grain yield varied among the genotypes due to their genetic tolerance or susceptibility to drought stress. Simulating drought stress indices for photosynthesis and growth expansion during crop growth is a useful strategy to estimate the stress and yield response of genotypes. Drought-tolerant genotypes can be evaluated as they are able to adapt to drought conditions as compared to drought-susceptible genotypes. It was found that drought-resistant genotypes G8, G11, G12, G13, and G16 under moderate stress and genotypes G6, G8, G9, G10, G11, G12, G15, and G16 under severe stress selected using DSI had lower values for stress indices (Figure 7). It was also found that an increase in drought stress near the flowering stage caused a decline in the grain yield of all of the genotypes. Genotypes exhibiting lower values for stress indices showed that these genotypes attained early drought recovery because of their physiological mechanism assuring that the top five selected drought-resistant genotypes G8, G11, G12, G13, and G16 under moderate stress and genotypes G6, G8, G10, G12, and G15 under severe stress were also superior in their physiological response to drought.

3.6. Simulated Water Use Efficiency (WUE)

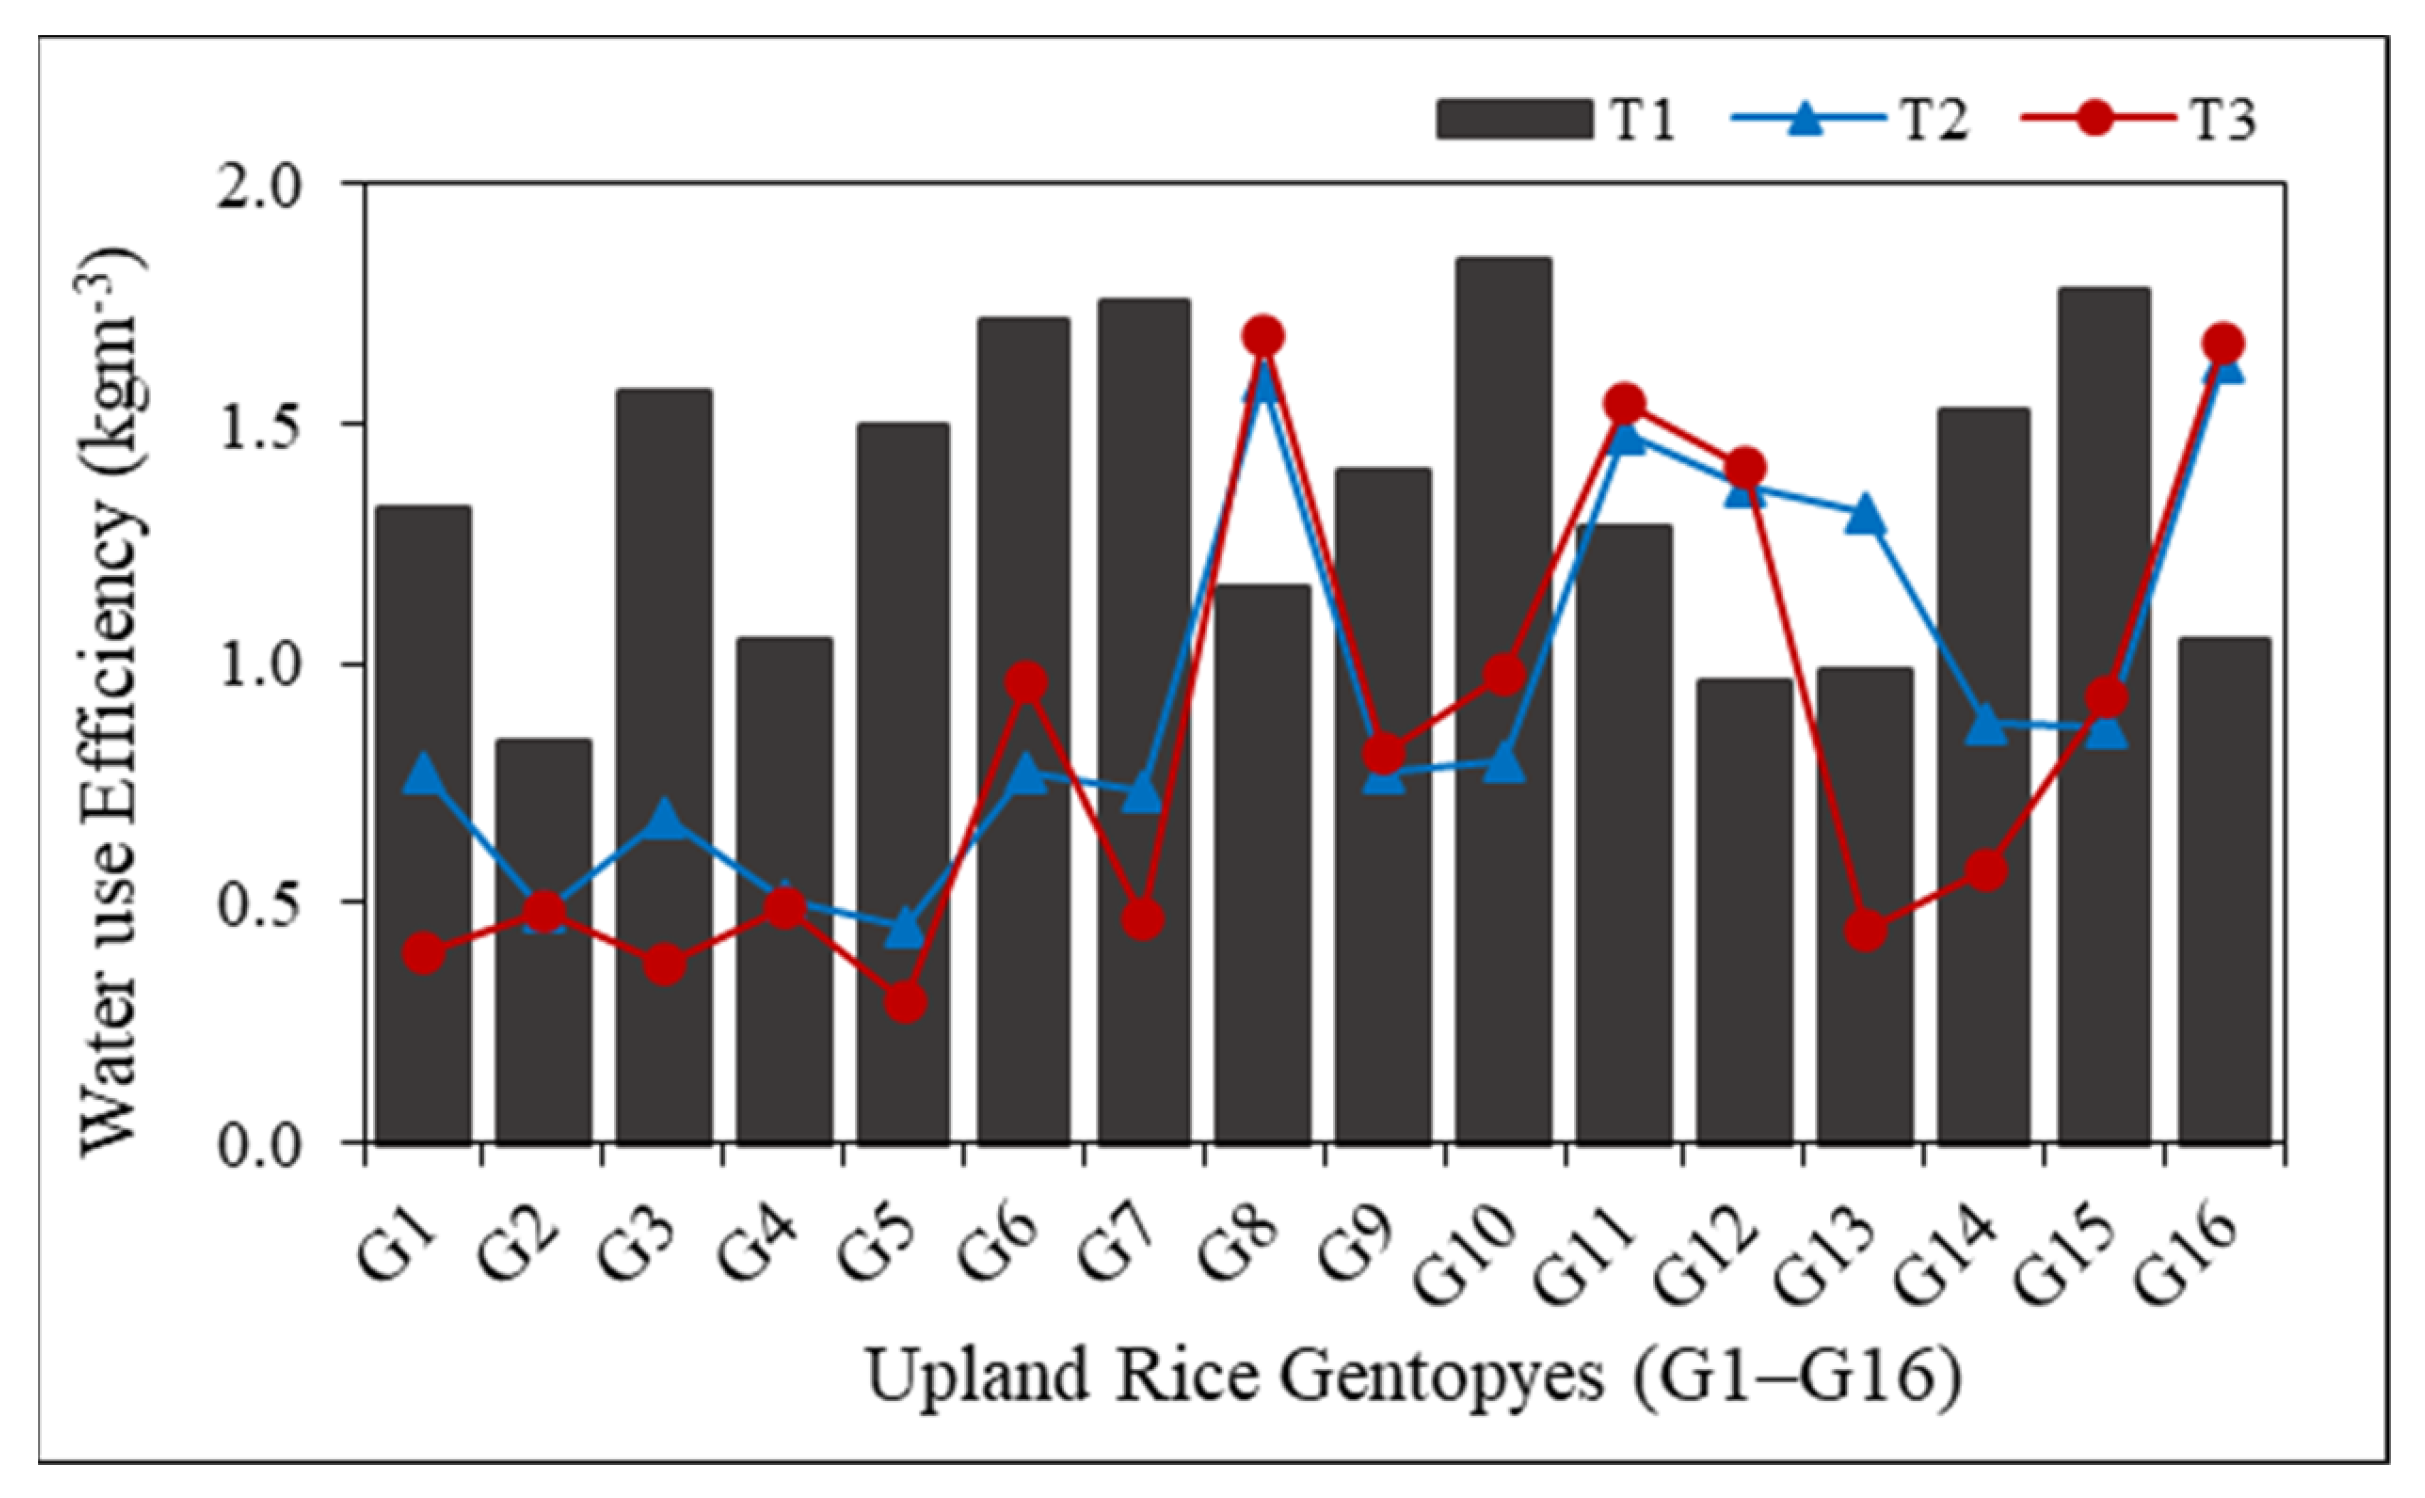
Most of the genotypes had their maximum WUE in the control treatment due to non-stressed conditions and their WUE was decreased with an increase in water deficit (Figure 11). Genotypes G1, G2, G3, G4, G5, G6, G7, G9, G10, G14, and G15 had their maximum WUE under the control treatment and their WUE was declined in moderate stress treatment. Genotypes G8, G11, G12, G13, and G16 under moderate stress and genotypes G6, G8, G9, G10, G11, G12, G15, and G16 under severe stress had an increasing trend in their WUE. An increase in the WUE of genotypes G8, G11, G12, G13, and G16 under moderate stress treatment and genotypes G6, G8, G9, G10, G11, G12, G15, and G16 in severe stress treatment under water stress conditions occurred possibly because of their physiological behavior under water deficit which showed their drought-resistant characteristics.

4. Discussion

Climate change has increased variability in seasonal rainfalls which has triggered the occurrence of drought incidences [50,51,52,53] impacting on crop productivity and posing a threat to global food security [54]. Various genotypes exhibit a range of yield responses under different soil moisture statuses. Therefore, the exploration of genotypic diversity for desired traits [55], i.e., grain yield, is a critical component of sustainable production. Evaluating genotypic responses helps to identify suitable and stable genotypes. However, this evaluation is not simple due to large numbers of genotypes being added every year and their assessment under a range of stresses requires high input costs to conduct trials. Observation of various crop physiological mechanisms also requires high-priced instrumentation and skilled manpower. Hence, yield prediction along with simulated crop physiological responses will help to speed up breeding trials by not only providing additional genotypic response data but also explaining the chances of genotypic suitability or sensitivity under prevailing or predicted environments. Therefore, we evaluated the yield performance of sixteen upland rice genotypes and employed CSM–CERES–Rice to assess the capability of the model in yield prediction and decision support based on simulated drought stress indices in the genotypic selection process.
In our study, average daily maximum and minimum temperatures for the potential experiment were recorded as 43 °C and 25 °C whereas they were 43 °C and 24 °C for the yield assessment experiment. The optimum temperature required for rice growth ranged from 25 to 35 °C [56] and according to Buddhaboon et al. [57], the optimum temperature for rice growth is 27 °C, while the temperature that prevailed during the growth period of both experiments was higher than the optimum range. The average maximum and minimum temperatures were almost similar for both experiments. Temperature might have a significant influence on crop growth and yield response of upland rice as differences in temperature impact crop growth and regulate the crop life cycle. Fluctuations in temperatures affect plant developmental processes [58]. According to Yoshida [56], crop duration is generally decreased with an increase in temperature and vice versa. In our study, higher temperatures might have influenced crop duration, and rice might have produced lower yields as compared to the optimal temperature. The higher temperatures might influenced soil moisture depletion due to increased evaporation as it was observed that temporary wilting occurred in both genotypic groups within six days (Figure 3). Soon after the stress induction, soil moisture was decreased in moderate stress and severe stress treatments possibly due to the impact of higher temperatures on evapotranspiration.
Drought stress applied in moderate stress and severe stress treatments impacted rice phenology. Days to anthesis and maturity were increased for the rice genotypes under stress. Delayed flowering under drought stress in rice is well documented in numerous studies [5,32,59,60]. A positive and strong correlation was also observed between days to anthesis and maturity in our previous study [5]. According to Pantuwan et al. [61] and Zhao et al. [62], delayed anthesis is a common impact of drought stress occurrence at late rice crop stages. Rice yield is significantly affected under late-stage drought stress, and it was observed that the grain yield of all of the genotypes was decreased under increased drought stress. The yield reduction of rice under a range of stress levels is also well documented [32,60,61,63,64]. Grain yield was considered to compute drought susceptibility index values and the relative yield for all of the genotypes under moderate and severe stress treatments. Genotypes were divided into stress tolerance and stress susceptibility based on obtained stress index values. According to Bruckner and Frohberg [65], genotypes with low DSI values (less than 1) could be considered as drought-resistant genotypes as they showed smaller reductions in yield under drought stress conditions when compared with non-stressed situations. Though a genotype may or may not be considered as drought-resistant, lower DSI values may not essentially provide a noble indication of drought resistance. Lower values of DSI for a genotype might be obtained due to a lack of production under non–stressed conditions rather than its capability to tolerate drought stress. Clarke et al. [66] described that the duration of drought stress in correspondence to the development of different genotypes may cause variation in DSI. DSI represents the measure of yield potential of a genotype under drought stress conditions [65]. However, according to Clarke et al. [67], the yield potential of different genotypes could not be differentiated by DSI. Consequently, a drought-tolerant genotype that is defined by the DSI essentially does not have a higher yield potential, for that relative yield can be taken into consideration as RY gives the measure of relatively lower or higher yield under stress conditions. Therefore, the relative yield was considered to identify drought-tolerant as well as relatively high-yielding genotypes.
Simulation results indicated that the model provided useful information for the studied genotypes. The model was effectively able to predict the yield of all of the genotypes under the applied treatments. The results are supported by the findings of Cheyglinted et al. [68], Hussain et al. [32], and Nasir et al. [35] in that the model was able to able to simulate the yield. Vilayvong et al. [69] also found that CSM–CERES–Rice adequately accounted for predicting yields and it could be used to define suitable management practices for improved rice production. Alejo [30] found that CSM–CERES–Rice was useful in simulating aerobic rice production under different planting windows. CSM–CERES–Rice also exhibited superiority over the ORYZA model in simulating the growth duration and yield responses of rice [26]. Ansari et al. [29] reported that CSM–CERES–Rice was successfully calibrated and validated over historical data and the model was suitable to the future prediction of rice genotypes under changing climatic conditions. Our results for simulating rice phenology and yield are in line with the findings of the abovementioned research.
In addition to the prediction of rice yield, determining drought stress for growth expansion and photosynthesis could be useful applications in rice breeding as they describe the stress duration and genotypic response to drought stress. In this study, the drought stress index was simulated and the model used the Priestley–Taylor evapotranspiration (PT) method [37]. The model indicated that under controlled conditions, the genotypes were not exposed to drought stress as rice genotypes received an adequate water supply during the growing season and all of the genotypes produced maximum grain yields at no stress in the control treatment. Similar findings were reported by Anothai et al. [70] who found that CSM–CERES–Maize did not simulate drought stress using either the PT or the FAO-56 approach under full crop water irrigation. It was observed that simulated drought stress for growth expansion was higher in value as compared to drought stress for photosynthesis for all of the genotypes (Figure 7, Figure 8, Figure 9 and Figure 10). Tojo Soler et al. [31] also found that the simulated drought stress index for photosynthesis was smaller in value than the stress index growth expansion in a study of scheduling irrigation and simulating the relationship between the drought stress and yield of peanuts using CSM–CROPGRO model. Higher values for the stress index for growth expansion for different genotypes indicated that these genotypes were exposed to drought stress for longer durations. Simulating drought stress indices for photosynthesis and growth expansion during crop growth is a useful strategy to assess the stress and yield of genotypes. Drought-tolerant genotypes can be evaluated as they are able to adapt to drought conditions as compared to drought-susceptible genotypes. Group A genotypes confronted more stress as compared to genotypes in group B which possibly occurred because of the short duration between the stress period and the maturity of the group A genotypes. Secondly, group A genotypes had a shorter time for drought recovery while group B genotypes received water for a comparatively longer period than the group A genotypes after stress induction showing that all of the drought-resistant genotypes belonged to long-duration group B genotypes. Verkulkar et al. [71] stated that rice yield was significantly reduced even with medium stress at the reproductive stage and rice yield reduction under a range of stresses is well documented and our results are in line with the reported results [5,32,63,64,72].
Water use efficiency (WUE) is an important indicator that exhibits the response of a specific genotype under different soil moisture levels. Generally, the WUE of plants decreases under water deficit and vice versa, but plants maintaining their physiology and rescheduling their water use are specified for their anti-drought behavior. The WUE of a genotype must not necessarily mean that it is reduced under water stress. Hu et al. [73] also found that the WUE of two wheat genotypes was increased under water deficit at middle-level stress as compared to non-stressed conditions which provided the clue for water saving. Higher WUE is mainly a characteristic of reduced water use under water stress than net production [74]. Monclus et al. [75] suggested that producing a high level of drought tolerance required the ability of a genotype to increase WUE. Genotypes exhibiting higher WUE in relation to water use are useful for acquiring drought-tolerant traits. However, WUE alone cannot be considered as an indicator for drought tolerance as drought tolerance is a complex mechanism in which plant root water uptake and other physiochemical processes are involved. Thus, WUE provides a preliminary option to select genotypes for the further screening process. Our study indicated that the WUE of some upland rice genotypes decreased under stress treatments; however, it was found that the genotypes which exhibited smaller reductions in their yield had an increasing trend of their WUE under stress conditions which indicated their drought-tolerant capability. DSI (Table 1) which is a measure of yield stability and relative yield (Table 1) which explains the lower or higher difference in yield under drought stress conditions as compared to the control also exhibited that genotypes G8, G11, G12, G13, and G16 were drought-resistant and relatively high-yielding under moderate stress while genotypes G6, G8, G10, G12, and G15 were among the five best comparatively drought-resistant and high-yielding genotypes under severe stress treatment. The relationship between DSI, RY, and WUE indicated a similar trend of yield response of genotypes under stress conditions. The top five genotypes from the moderate stress and severe stress treatments (Table 1) exhibiting an increasing trend in their WUE under water deficit and having lower stress values for simulated drought stress indices for photosynthesis and growth expansion were finally identified as drought-tolerant genotypes.

5. Conclusions

Drought stress impacted on the grain yield of all of the genotypes and an inverse relationship between the drought stress index and grain yield was observed. The grain yield of the studied genotypes decreased by 24–62% under moderate stress and by 43–78% under severe stress as compared to the control. The genotypes Khao/Sai (G8), Dawk Kham (G11), Dawk Pa–yawm (G12), Goo Meung Lung (G13), and Mai Tahk (G16) under moderate stress treatment while genotypes Dawk Kha (G6), Khao/Sai (G8), Nual Hawm (G10), Dawk Pa–yawm (G12) and Bow Leb Nahag (G15) under severe stress treatment were among the top five drought-resistant and comparatively high-yielding genotypes under drought stress producing DSI values < 1 and RY > mean RY. These genotypes also exhibited lower values for stress indices for photosynthesis and growth expansion and an increasing trend in their water use efficiency under drought stress. Hence these genotypes are recommended for acquiring drought-resistant traits. Simulations indicated that the CSM–CERES–Rice model was excellently able to estimate the growth and yield of upland rice genotypes under different irrigation treatments as RMSEn less than 10% for grain yield was observed. Drought stress indices simulated by CSM–CERES–Rice well defined that grain yield was reduced in each genotype under water deficit and genotypes exhibiting lower stress values had the capability to combat drought by early drought recovery assuring smaller reduction in their yield under drought stress. Simulated drought stress indices and water use efficiency were also useful in explaining the initial findings from DSI and RY for each genotype which ultimately helped in the final selection of genotypes for drought tolerance. It was concluded that simulating drought stress indices is a useful strategy to explain the physiological response of a genotype to drought stress and predict harvestable yield under various levels of drought stress. The findings of the study support the idea that CSM–CERES–Rice explaining the physiological aspects of genotypes has the potential for its useful application as a DST for the selection of genotypes, particularly under water-limited conditions. Moreover, the authors stress the need for further experimentation on yield assessment of rice genotypes, assessment of various stress indices and validation of CSM–CERES–Rice over a large scale.

Supplementary Materials

The following supporting information can be downloaded at: https://www.mdpi.com/article/10.3390/agronomy13020432/s1. Table S1: Description of genotypes used in the study and sites of seed collection. Table S2: Mean squares of analysis of variance of days to anthesis, days to maturity, and grain yield of sixteen upland rice genotypes.

Author Contributions

Conceptualization, J.A. and T.H.; methodology, T.H. and J.A.; data analysis, T.H.; data curation, T.H. and J.A.; writing—original draft preparation, T.H.; writing—review and editing, T.H., J.A., C.N., A.A., S.D., N.H. and S.T.A.-U.-K.; resources, J.A. and C.N.; funding acquisition, T.H. All authors have read and agreed to the published version of the manuscript.

Funding

The research was supported by a postdoctoral fellowship from Prince of Songkla University and the Faculty of Natural Resources, Prince of Songkla University, Thailand.

Data Availability Statement

The data presented in the study are available in this article and the data not already included in the article that support the findings of this study are available on request from the first author (T.H.).

Acknowledgments

The authors acknowledge the Research and Development Office (RDO), Prince of Songkla University, Thailand, for providing a postdoctoral research fellowship and the Faculty of Natural Resources, Prince of Songkla University, for providing the research facilities.

Conflicts of Interest

The authors declare no conflict of interest.

References

  1. Agarwal, P.; Parida, S.K.; Raghuvanshi, S.; Kapoor, S.; Khurana, P.; Khurana, J.P.; Tyagi, A.K. Rice Improvement Through Genome-Based Functional Analysis and Molecular Breeding in India. Rice 2016, 9, 1–17. [Google Scholar] [CrossRef] [PubMed] [Green Version]
  2. Campozano, L.; Ballari, D.; Montenegro, M.; Avilés, A. Future Meteorological Droughts in Ecuador: Decreasing Trends and Associated Spatio-Temporal Features Derived From CMIP5 Models. Front. Earth Sci. 2020, 8. [Google Scholar] [CrossRef]
  3. Chutia, J.; Borah, S.P. Water Stress Effects on Leaf Growth and Chlorophyll Content but Not the Grain Yield in Traditional Rice (Oryza sativa Linn.) Genotypes of Assam, India II. Protein and Proline Status in Seedlings under PEG Induced Water Stress. Am. J. Plant Sci. 2012, 3, 971–980. [Google Scholar] [CrossRef] [Green Version]
  4. Kandel, B.P.; Joshi, L.P.; Sharma, S.; Adhikari, P.; Koirala, B.; Shrestha, K. Drought tolerance screening of rice genotypes in mid-hills of Nepal using various drought indices. Acta Agric. Scand. Sect. B: Soil Plant Sci. 2022, 72, 744–750. [Google Scholar] [CrossRef]
  5. Hussain, T.; Hussain, N.; Ahmed, M.; Nualsri, C.; Duangpan, S. Responses of lowland rice genotypes under terminal water stress and identification of drought tolerance to stabilize rice productivity in southern thailand. Plants 2021, 10, 2565. [Google Scholar] [CrossRef]
  6. Smartt, J.; Stalker, H.T. Speciation and Cytogenetics in Arachis; AGRIS: Rome, Italy, 1982. [Google Scholar]
  7. Fukai, S.; Cooper, M. Development of drought-resistant cultivars using physiomorphological traits in rice. Field Crops Res. 1995, 40, 67–86. [Google Scholar] [CrossRef]
  8. Singh, B.; Reddy, K.R.; Redoña, E.D.; Walker, T. Screening of Rice Cultivars for Morpho-Physiological Responses to Early-Season Soil Moisture Stress. Rice Sci. 2017, 24, 322–335. [Google Scholar] [CrossRef]
  9. Hussain, N.; Ahmed, M.; Duangpan, S.; Hussain, T.; Taweekun, J. Potential impacts of water stress on rice biomass composition and feedstock availability for bioenergy production. Sustainability 2021, 13, 10449. [Google Scholar] [CrossRef]
  10. IRRI. Standard Evaluation System for Rice, 5th ed.International Rice Research Institute: Los Banos, PI, USA, 2014. [Google Scholar]
  11. Mansour, E.; Desoky, E.S.M.; Ali, M.M.A.; Abdul-Hamid, M.I.; Ullah, H.; Attia, A.; Datta, A. Identifying drought-tolerant genotypes of faba bean and their agro-physiological responses to different water regimes in an arid Mediterranean environment. Agric. Water Manag. 2021, 247, 106754. [Google Scholar] [CrossRef]
  12. Wasae, A. Evaluation of Drought Stress Tolerance Based on Selection Indices in Haricot Bean Varieties Exposed to Stress at Different Growth Stages. Int. J. Agron. 2021, 2021, 6617874. [Google Scholar] [CrossRef]
  13. Ahmad, A.; Aslam, Z.; Naz, M.; Hussain, S.; Javed, T.; Aslam, S.; Raza, A.; Ali, H.M.; Siddiqui, M.H.; Salem, M.Z.M.; et al. Exogenous salicylic acid-induced drought stress tolerance in wheat (Triticum aestivum L.) grown under hydroponic culture. PLoS ONE 2021, 16, 1–17. [Google Scholar] [CrossRef]
  14. Fischer, R.A.; Maurer, R. Drought resistance in spring wheat cultivars. I. Grain yield responses. Aust. J. Agric. Res. 1978, 29, 897–912. [Google Scholar] [CrossRef]
  15. Fernandez, G.C. Effective selection criteria for assessing plant stress tolerance. In Proceedings of the International Symposium on Adaptation of Vegetables and other Food Crops in Temperature and Water Stress, Shanhua, Taiwan, 13–16 August 1992; pp. 257–270. [Google Scholar]
  16. Schneider, K.A.; Rosales-serna, R.; Ibarra-perez, F.; Cazares-enriquez, B.; Acosta-gallegos, J.A.; Ramirez-vallejo, P.; Wassimi, N.; Kelly, J.D. Improving common bean performance under drought stress. Crop Sci. 1997, 37, 43–50. [Google Scholar] [CrossRef]
  17. Hossain, A.B.S.; Sears, R.G.; Cox, T.S.; Paulsen, G.M. Desiccation tolerance and its relationship to assimilate partitioning in winter wheat. Crop Sci. 1990, 30, 622–627. [Google Scholar] [CrossRef]
  18. Bouslama, M.; Schapaugh, W.T. Stress tolerance in soybeans. I. Evaluation of three screening techniques for heat and drought tolerance. Crop Sci. 1984, 24, 933–937. [Google Scholar] [CrossRef]
  19. Rosielle, A.A.; Hamblin, J. Theoretical aspects of selection for yield in stress and non-stress environments. Crop Sci. 1981, 21, 943–946. [Google Scholar] [CrossRef]
  20. Arif, A.; Parveen, N.; Waheed, M.Q.; Atif, R.M.; Waqar, I.; Shah, T.M. A Comparative Study for Assessing the Drought-Tolerance of Chickpea Under Varying Natural Growth Environments. Front. Plant Sci. 2021, 11. [Google Scholar] [CrossRef]
  21. Ata-Ul-Karim, S.T.; Begum, H.; Lopena, V.; Borromeo, T.; Virk, P.; Hernandez, J.E.; Gregorio, G.B.; Collard, B.C.Y.; Kato, Y. Genotypic variation of yield-related traits in an irrigated rice breeding program for tropical Asia. Crop Environ. 2022, 1, 173–181. [Google Scholar] [CrossRef]
  22. Boote, K.J.; Jones, J.W.; Pickering, N.B. Potential uses and limitations of crop models. Agron. J. 1996, 88, 704–716. [Google Scholar] [CrossRef]
  23. Hoogenboom, G. Contribution of agrometeorology to the simulation of crop production and its applications. Agric. For. Meteorol. 2000, 103, 137–157. [Google Scholar] [CrossRef]
  24. Park, S.; Ahn, J.; Kim, D.; Sitthikone, M. Climate risk management for the rainfed rice yield in Lao PDR using APCC MME seasonal forecasts. Agric. Water Manag. 2022, 274, 107976. [Google Scholar] [CrossRef]
  25. Kumar, P.; Ines, A.V.M.; Han, E.; Cruz, R.; Prasad, P.V.V. A comparison of multiple calibration and ensembling methods for estimating genetic coefficients of CERES-Rice to simulate phenology and yields. Field Crops Res. 2022, 284, 108560. [Google Scholar] [CrossRef]
  26. Li, S.; Fleisher, D.; Timlin, D.; Reddy, R.V.; Wang, Z.; McClung, A. Evaluation of Different Crop Models for Simulating Rice Development and Yield in the U.S. Mississippi Delta. Agronomy 2020, 10, 1905. [Google Scholar] [CrossRef]
  27. Putto, C.; Patanothai, A.; Jogloy, S.; Pannangpetch, K.; Boote, K.J.; Hoogenboom, G. Determination of efficient test sites for evaluation of peanut breeding lines using the CSM-CROPGRO-peanut model. Field Crops Res. 2009, 110, 272–281. [Google Scholar] [CrossRef]
  28. Nicolas, F.; Migliaccio, K.W.; Hoogenboom, G.; Rathinasabapathi, B.R.; Eisenstadt, W.R. Assessing the potential impact of climate change on rice yield in the Artibonite valley of Haiti unsing the CSM-CERES-Rice model. Am. Soc. Agric. Biol. Eng. 2020, 63, 1385–1400. [Google Scholar] [CrossRef]
  29. Ansari, A.; Lin, Y.-P.; Lur, H.-S. Evaluating and Adapting Climate Change Impacts on Rice Production in Indonesia: A Case Study of the Keduang Subwatershed, Central Java. Environments 2021, 8, 117. [Google Scholar] [CrossRef]
  30. Alejo, L.A. Assessing the impacts of climate change on aerobic rice production using the DSSAT-CERES-Rice model Lanie A. Alejo. J. Water Clim. Chang. 2021, 12, 696–708. [Google Scholar] [CrossRef]
  31. Tojo Soler, C.M.; Suleiman, A.; Anothai, J.; Flitcroft, I.; Hoogenboom, G. Scheduling irrigation with a dynamic crop growth model and determining the relation between simulated drought stress and yield for peanut. Irrig. Sci. 2013, 31, 889–901. [Google Scholar]
  32. Hussain, T.; Anothai, J.; Nualsri, C.; Soonsuwon, W. Application of CSM-CERES-Rice in scheduling irrigation and simulating effect of drought stress on upland rice yield. Indian J. Agric. Res. 2018, 52, 140–145. [Google Scholar] [CrossRef] [Green Version]
  33. Jones, J.W.; Hoogenboom, G.; Porter, C.H.; Boote, K.J.; Batchelor, W.D.; Hunt, L.A.; Wilkens, P.W.; Singh, U.; Gijsman, A.J.; Ritchie, J.T. The DSSAT cropping system model. Eur. J. Agron. 2003, 18, 235–265. [Google Scholar] [CrossRef]
  34. Sun, Q.; Zhao, Y.; Zhang, Y.; Che, X.; Yang, Z.; Song, Y.; Zheng, X. Improvement of the CERES-Rice model using controlled experiments and a Meta-analysis. Theor. Appl. Clim. 2020, 141, 1271–1284. [Google Scholar] [CrossRef]
  35. Nasir, I.R.; Rasul, F. Climate change impacts and adaptations for fine, coarse, and hybrid rice using CERES-Rice. Environ. Sci. Pollut. Res. 2020, 27, 9454–9464. [Google Scholar] [CrossRef]
  36. Ritchie, J.T. Soil water balance and plant water stress. In Understanding Options for Agricultural Production; Springer: Berlin/Heidelberg, Germany, 1998; pp. 41–54. [Google Scholar]
  37. Priestley, C.H.B.; Taylor, R.J. On the assessment of surface heat flux and evaporation using large-scale parameters. Mon. Weather. Rev. 1972, 100, 81–92. [Google Scholar] [CrossRef]
  38. Allen, R.G.; Pereira, L.S.; Raes, D.; Smith, M. Crop evapotranspiration-Guidelines for computing crop water requirements-FAO Irrigation and drainage paper 56. Fao Rome 1998, 300, D05109. [Google Scholar]
  39. Boote, K.J.; Sau, F.; Hoogenboom, G.; Jones, J.W. Experience with water balance, evapotranspiration, and predictions of water stress effects in the CROPGRO model. Response Crops Ltd. Water Underst. Model. Water Stress Eff. Plant Growth Process 2008, 1, 59–103. [Google Scholar]
  40. Sau, F.; Boote, K.J.; McNair Bostick, W.; Jones, J.W.; Ines Minguez, M. Testing and improving evapotranspiration and soil water balance of the DSSAT crop models. Agron. J. 2004, 96, 1243–1257. [Google Scholar] [CrossRef]
  41. Ali, M.F.; Ali, U.; Bilal, S.; Zulfiqar, U.; Sohail, S.; Hussain, T. Response of sorghum and millet to poultry and farmyard manure–based biochar treatments. Arab. J. Geosci. 2022, 15, 1592. [Google Scholar] [CrossRef]
  42. Wu, B.; Lin, X.; Ali, M.F.; Wang, D. Development of an irrigation regime for winter wheat to save water resources by avoiding irrigation at anthesis stage. J. Agron. Crop Sci. 2022, 209, 188–203. [Google Scholar] [CrossRef]
  43. Hunt, L.A.; Boote, K.J. Data for model operation, calibration, and evaluation. In Understanding Options for Agricultural Production; Springer: Berlin/Heidelberg, Germany, 1998; pp. 9–39. [Google Scholar]
  44. Boote, K.J. Concepts for calibrating crop growth models. DSSAT Version 1999, 3, 179–199. [Google Scholar]
  45. Liu, H.L.; Yang, J.Y.; Drury, C.F.a.; Reynolds, W.D.; Tan, C.S.; Bai, Y.L.; He, P.; Jin, J.; Hoogenboom, G. Using the DSSAT-CERES-Maize model to simulate crop yield and nitrogen cycling in fields under long-term continuous maize production. Nutr. Cycl. Agroecosystems 2011, 89, 313–328. [Google Scholar] [CrossRef]
  46. Duangpan, S.; Tongchu, Y.; Hussain, T.; Eksomtramage, T.; Onthong, J. Beneficial Effects of Silicon Fertilizer on Growth and Physiological Responses in Oil Palm. Agronomy 2022, 12, 413. [Google Scholar] [CrossRef]
  47. Hussain, T.; Hussain, N.; Tahir, M.; Raina, A.; Ikram, S.; Maqbool, S.; Ali, M.F.; Duangpan, S. Impacts of Drought Stress on Water Use Efficiency and Grain Productivity of Rice and Utilization of Genotypic Variability to Combat Climate Change. Agronomy 2022, 12, 2518. [Google Scholar] [CrossRef]
  48. Loague, K.; Green, R.E. Statistical and graphical methods for evaluating solute transport models: Overview and application. J. Contam. Hydrol. 1991, 7, 51–73. [Google Scholar] [CrossRef]
  49. Willmott, C.J.; Ackleson, S.G.; Davis, R.E.; Feddema, J.J.; Klink, K.M.; Legates, D.R.; O’donnell, J.; Rowe, C.M. Statistics for the evaluation and comparison of models. J. Geophys. Res. Ocean. 1985, 90, 8995–9005. [Google Scholar] [CrossRef] [Green Version]
  50. Balbaa, M.G.; Osman, H.T.; Kandil, E.E.; Javed, T.; Lamlom, S.F.; Ali, H.M.; Kalaji, H.M.; Wróbel, J.; Telesiñski, A.; Brysiewicz, A.; et al. Determination of morpho-physiological and yield traits of maize inbred lines (Zea mays L.) under optimal and drought stress conditions. Front. Plant Sci. 2022, 13, 1–17. [Google Scholar] [CrossRef] [PubMed]
  51. Chowdhury, M.K.; Hasan, M.A.; Bahadur, M.M.; Islam, M.R.; Hakim, M.A.; Iqbal, M.A.; Javed, T.; Raza, A.; Shabbir, R.; Sorour, S.; et al. Evaluation of drought tolerance of some wheat (Triticum aestivum L.) genotypes through phenology, growth, and physiological indices. Agronomy 2021, 11, 1792. [Google Scholar] [CrossRef]
  52. Singhal, R.K.; Fahad, S.; Kumar, P.; Choyal, P.; Javed, T.; Jinger, D.; Singh, P.; Saha, D.; Md, P.; Bose, B.; et al. Beneficial elements: New Players in improving nutrient use efficiency and abiotic stress tolerance. Plant Growth Regul. 2022, 1–29. [Google Scholar] [CrossRef]
  53. Shabbir, R.; Javed, T.; Hussain, S.; Ahmar, S.; Naz, M.; Zafar, H.; Pandey, S.; Chauhan, J.; Siddiqui, M.H.; Pinghua, C. Calcium homeostasis and potential roles to combat environmental stresses in plants. South Afr. J. Bot. 2022, 148, 683–693. [Google Scholar] [CrossRef]
  54. Ali, A.; Altaf, M.T.; Nadeem, M.A.; SHAH, A.N.; Azeem, H.; Baloch, F.S.; Karaköy, T.; Hussain, T.; Duangpan, S.; AASIM, M. Recent Advancement in OMICS approaches to enhance abiotic stress tolerance in Legumes. Front. Plant Sci. 2022, 13, 3222. [Google Scholar] [CrossRef]
  55. Haldhar, S.M.; Kumar, R.; Corrado, G.; Berwal, M.K.; Gora, J.S.; Thaochan, N.; Samadia, D.K.; Hussain, T.; Rouphael, Y. A Field Screening of a Pomegranate (Punica granatum) Ex-Situ Germplasm Collection for Resistance against the False Spider Mite (Tenuipalpus punicae). Agriculture 2022, 12, 1686. [Google Scholar] [CrossRef]
  56. Yoshida, S. Effects of temperature on growth of the rice plant (oryza sativa l.) in a controlled environment. Soil Sci. Plant Nutr. 1973, 19, 299–310. [Google Scholar] [CrossRef]
  57. Buddhaboon, C.; Jintrawet, A.; Hoogenboom, G. Effects of planting date and variety on flooded rice production in the deepwater area of Thailand. Field Crops Res. 2011, 124, 270–277. [Google Scholar] [CrossRef]
  58. Aslam, M.A.; Ahmed, M.; Hassan, F.-U.; Afzal, O.; Mehmood, M.Z.; Qadir, G.; Asif, M.; Komal, S.; Hussain, T. Impact of temperature fluctuations on plant morphological and physiological traits. In Building Climate Resilience in Agriculture; Springer: Cham, Switzerland, 2022; pp. 25–52. [Google Scholar]
  59. Davatgar, N.; Neishabouri, M.R.; Sepaskhah, A.R.; Soltani, A. Physiological and morphological responses of rice (Oryza sativa L.) to varying water stress management strategies. Int. J. Plant Prod. 2009, 3, 19–32. [Google Scholar] [CrossRef]
  60. Saikumar, S.; Varma, C.M.K.; Saiharini, A.; Kalmeshwer, G.P.; Nagendra, K.; Lavanya, K.; Ayyappa, D. Grain yield responses to varied level of moisture stress at reproductive stage in an interspecific population derived from Swarna/O. glaberrima introgression line. NJAS Wagening. J. Life Sci. 2016, 78, 111–122. [Google Scholar] [CrossRef]
  61. Pantuwan, G.; Fukai, S.; Cooper, M.; Rajatasereekul, S.; O’Toole, J.C. Yield response of rice (Oryza sativa L.) genotypes to drought under rainfed lowland 3. Plant factors contributing to drought resistance. Field Crops Res. 2002, 73, 181–200. [Google Scholar] [CrossRef]
  62. Zhao, D.L.; Atlin, G.N.; Amante, M.; Cruz, M.T.S.; Kumar, A. Developing aerobic rice cultivars for water-short irrigated and drought-prone rainfed areas in the tropics. Crop Sci. 2010, 50, 2268–2276. [Google Scholar] [CrossRef]
  63. Kumar, A.; Verulkar, S.; Dixit, S.; Chauhan, B.; Bernier, J.; Venuprasad, R.; Zhao, D.; Shrivastava, M.N. Yield and yield-attributing traits of rice (Oryza sativa L.) under lowland drought and suitability of early vigor as a selection criterion. Field Crops Res. 2009, 114, 99–107. [Google Scholar] [CrossRef]
  64. Torres, R.O.; McNally, K.L.; Cruz, C.V.; Serraj, R.; Henry, A. Screening of rice Genebank germplasm for yield and selection of new drought tolerance donors. Field Crops Res. 2013, 147, 12–22. [Google Scholar] [CrossRef]
  65. Bruckner, P.L.; Frohberg, R.C. Stress Tolerance and Adaptation in Spring Wheat 1. Crop Sci. 1987, 27, 31–36. [Google Scholar] [CrossRef]
  66. Clarke, J.M.; Townley-Smith, F.; McCaig, T.N.; Green, D.G. Growth analysis of spring wheat cultivars of varying drought resistance. Crop Sci. 1984, 24, 537–541. [Google Scholar] [CrossRef]
  67. Clarke, J.M.; DePauw, R.M.; Townley-Smith, T.F. Evaluation of methods for quantification of drought tolerance in wheat. Crop Sci. 1992, 32, 723–728. [Google Scholar] [CrossRef]
  68. Cheyglinted, S.; Ranamukhaarachchi, S.L.; Singh, G. Assessment of the CERES-Rice model for rice production in the Central Plain of Thailand. J. Agric. Sci. 2001, 137, 289–298. [Google Scholar] [CrossRef]
  69. Vilayvong, S.; Banterng, P.; Patanothai, A.; Pannangpetch, K. CSM-CERES-Rice model to determine management strategies for lowland rice production. Sci. Agric. 2015, 72, 229–236. [Google Scholar] [CrossRef] [Green Version]
  70. Anothai, J.; Soler, C.M.T.; Green, A.; Trout, T.J.; Hoogenboom, G. Evaluation of two evapotranspiration approaches simulated with the CSM-CERES-Maize model under different irrigation strategies and the impact on maize growth, development and soil moisture content for semi-arid conditions. Agric. For. Meteorol. 2013, 176, 64–76. [Google Scholar] [CrossRef]
  71. Verulkar, S.B.; Mandal, N.P.; Dwivedi, J.L.; Singh, B.N.; Sinha, P.K.; Mahato, R.N.; Dongre, P.; Singh, O.N.; Bose, L.K.; Swain, P.; et al. Breeding resilient and productive genotypes adapted to drought-prone rainfed ecosystem of India. Field Crops Res. 2010, 117, 197–208. [Google Scholar] [CrossRef]
  72. Pantuwan, G.; Fukai, S.; Cooper, M.; Rajatasereekul, S.; O’Toole, J.C.; Basnayake, J. Yield response of rice (Oryza sativa L.) genotypes to drought under rainfed lowlands 4. Vegetative stage screening in the dry season. Field Crop. Res. 2004, 89, 281–297. [Google Scholar] [CrossRef]
  73. Hu, Y.C.; Shao, H.B.; Chu, L.Y.; Gang, W. Relationship between water use efficiency (WUE) and production of different wheat genotypes at soil water deficit. Colloids Surf. B Biointerfaces 2006, 53, 271–277. [Google Scholar] [CrossRef]
  74. Blum, A. Drought resistance, water-use efficiency, and yield potential—Are they compatible, dissonant, or mutually exclusive? Aust. J. Agric. Res. 2005, 56, 1159–1168. [Google Scholar] [CrossRef] [Green Version]
  75. Monclus, R.; Dreyer, E.; Villar, M.; Delmotte, F.M.; Delay, D.; Petit, J.M.; Barbaroux, C.; Le Thiec, D.; Bréchet, C.; Brignolas, F. Impact of drought on productivity and water use efficiency in 29 genotypes of Populus deltoides x Populus nigra. New Phytol. 2006, 169, 765–777. [Google Scholar] [CrossRef]
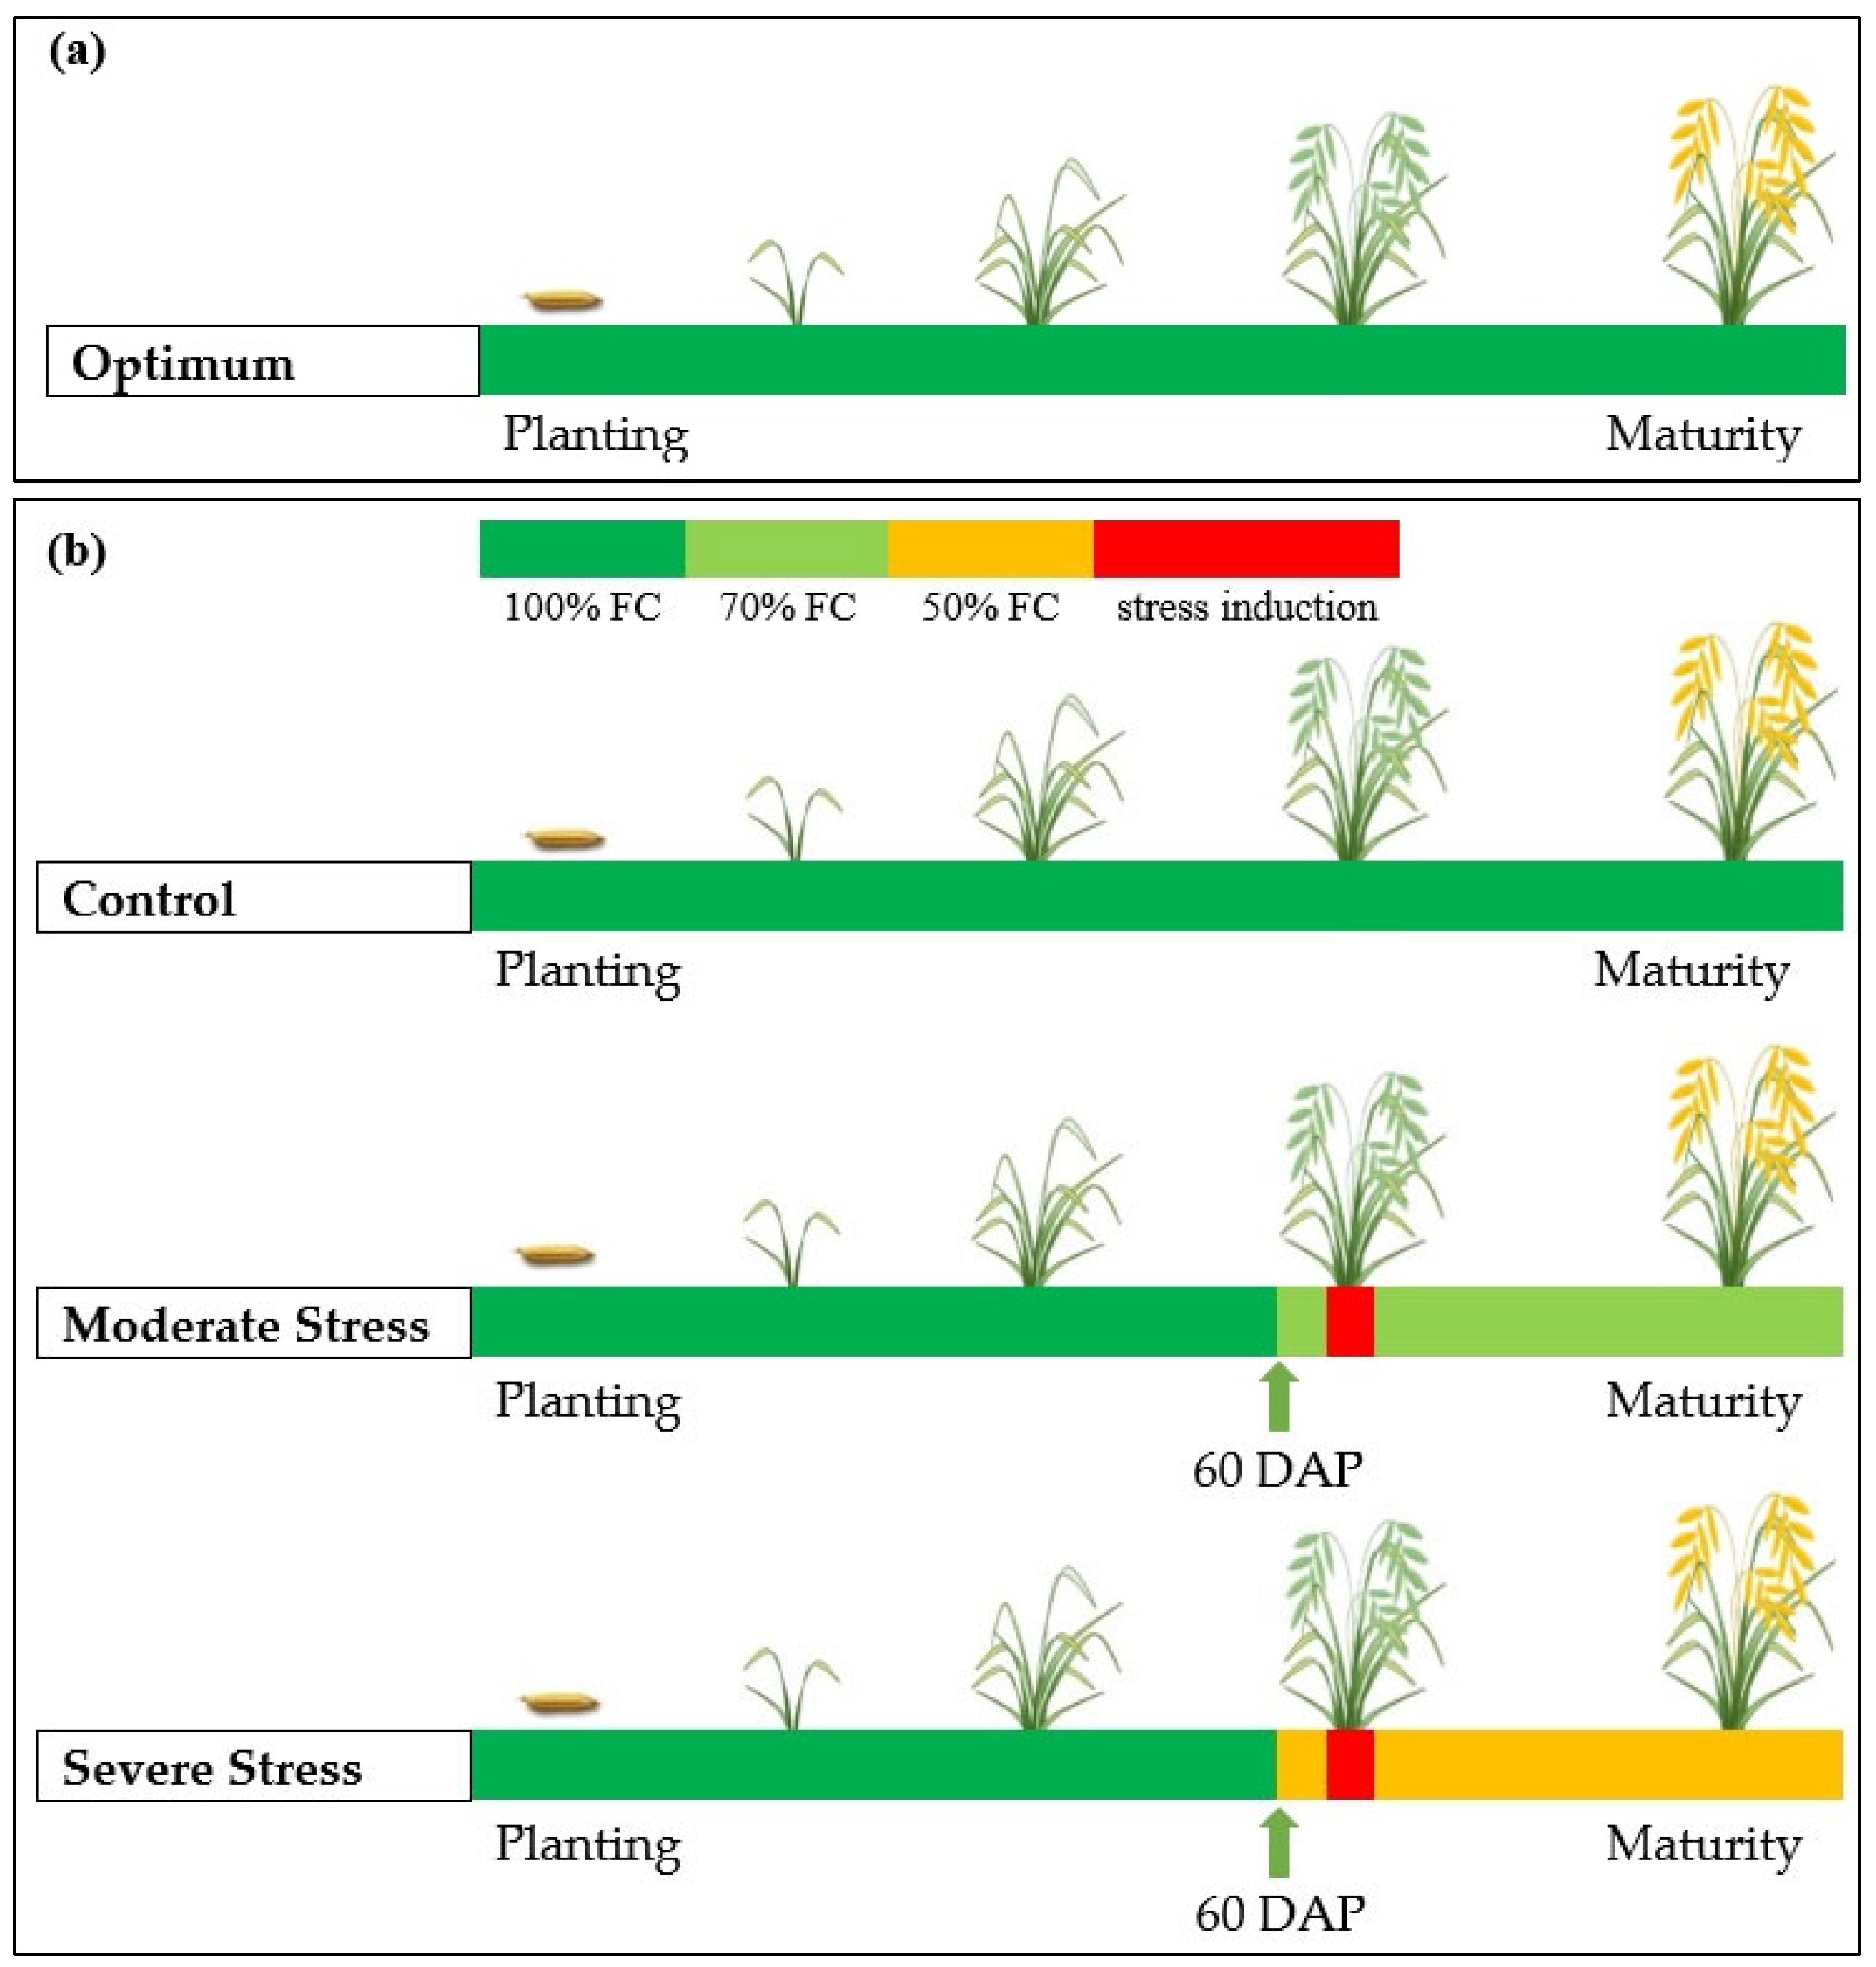
Figure 1. Schematic diagram of experimental setup indicating the potential experiment (1) under optimal conditions (a) and the yield assessment experiment (2) with three irrigation treatments (b). The dark green color indicates optimum and non-water stressed conditions. The light green and orange color indicate the irrigation at 70% of field capacity (FC) and 50% of FC after 60 days of planting (DAP) for moderate stress and severe stress treatments, respectively, whereas, the red color indicates the stress induction duration for moderate stress and severe stress treatments in the yield assessment experiment.
Agronomy 13 00432 g001
Figure 2. Mean daily maximum and minimum temperatures (°C) and solar radiation (MJ m–2 day−1) for the potential experiment (1) and the yield assessment experiment (2).
Agronomy 13 00432 g002
Figure 3. Soil moisture contents observed at 0–15 cm soil depth under applied treatments to genotypes in group A (a) and group B (b) in the yield assessment experiment (2). Vertical bars indicate ± standard errors for means of soil moisture contents observed from three replications. T1: control (100% FC), T2: moderate stress (70% FC), T3: severe stress (50% FC).
Agronomy 13 00432 g003
Figure 4. Simulated and observed anthesis (days) and physiological maturity [days] (a), grain yield (kgha–1) as dry matter (b), aboveground biomass (kg ha–1) as dry matter (c) and harvest index [%], and (d) for model calibration with data collected from the potential experiment conducted under optimum conditions.
Agronomy 13 00432 g004
Figure 5. Simulated versus observed days to anthesis (a) and days to maturity (b) for sixteen upland rice genotypes under T1: control (100% FC), T2: moderate stress (70% FC), and T3: severe stress (50% FC) treatments in the yield assessment experiment.
Agronomy 13 00432 g005
Figure 6. Comparison of the simulated versus observed grain yield (kg ha–1) for sixteen upland rice genotypes under T1: control (100% FC), T2: moderate stress (70% FC), and T3: severe stress (50% FC) treatments in the yield assessment experiment.
Agronomy 13 00432 g006
Figure 7. Simulated average drought stress for photosynthesis [ph] (a), and growth expansion [ex] (b) for sixteen upland rice genotypes under T1: control (100% FC), T2: moderate stress (70% FC) and T3: severe stress (50% FC) treatments in yield assessment experiment. Vertical bars indicate ± standard errors of average values of drought stresses, simulated for treatment duration.
Agronomy 13 00432 g007
Figure 8. Linear regression relationship between the simulated grain yield and the average drought stress for photosynthesis (ph) and between the simulated grain yield and average drought stress for growth expansion (ex) for genotypes in group A under T1: control (100% FC), T2: moderate stress (70% FC), and T3: severe stress (50% FC) treatments in the yield assessment experiment.
Agronomy 13 00432 g008
Figure 9. Linear regression relationship between simulated grain yield and average drought stress for photosynthesis (ph), and between simulated grain yield and average drought stress for growth expansion (ex) for genotypes G6–G11 in group B under T1: control (100% FC), T2: moderate stress (70% FC) and T3: severe stress (50% FC) treatments in yield assessment experiment.
Agronomy 13 00432 g009
Figure 10. Linear regression relationship between the simulated grain yield and average drought stress for photosynthesis (ph) and between the simulated grain yield and average drought stress for growth expansion (ex) for genotypes G12–G16 in group B under T1: control (100% FC), T2: moderate stress (70% FC), and T3: severe stress (50% FC) treatments in the yield assessment experiment.
Agronomy 13 00432 g010
Figure 11. Simulated water use efficiency for sixteen upland rice genotypes under T1: control (100% FC), T2: moderate stress (70% FC), and T3: severe stress (50% FC) treatments in yield assessment experiment.
Agronomy 13 00432 g011
Table 1. Drought susceptibility index and relative yield of sixteen upland rice genotypes under the control, moderate stress, and severe stressed treatments.
GenotypeControl (100% FC)Moderate Stress (70% FC)Severe Stress (50% FC)
GY ± SERYWGY ± SEDSIRYSGY ± SEDSIRYS
G12267 ± 2770.521387 ± 2070.860.49633 ± 1791.140.41
G21393 ± 790.32900 ± 1400.790.32793 ± 410.680.51
G32533 ± 4190.581020 ± 1301.330.36567 ± 1331.230.36
G41880 ± 1220.43833 ± 291.240.29740 ± 00.960.48
G51800 ± 3130.41880 ± 641.130.31573 ± 971.080.37
G64053 ± 6180.932213 ± 1551.010.781526 ± 2380.990.98
G74373 ± 3111.001660 ± 1551.380.591180 ± 2081.160.76
G83260 ± 1170.752213 ± 2540.710.781553 ± 2250.831.00
G93040 ± 4190.701680 ± 920.990.591240 ± 1400.940.80
G103233 ± 2670.741700 ± 2141.050.601520 ± 1060.840.98
G113780 ± 10240.862180 ± 200.940.771420 ± 1600.990.91
G123800 ± 8680.872120 ± 3250.980.751513 ± 2080.960.97
G133380 ± 5770.772080 ± 3560.850.731120 ± 701.060.72
G143693 ± 7460.841913 ± 1641.070.681233 ± 3941.060.79
G153967 ± 11780.911973 ± 3451.120.701527 ± 2050.980.98
G163747 ± 840.862833 ± 1810.541.001433 ± 2100.980.92
Mean31370.7217240.6111610.75
GY = Mean grain yield (kg ha–1), ±SE = standard error, DSI = drought stress index, RYW = relative yield under control, RYS = relative yield under water stress condition.
Table 2. RMSEn computed for the grain yield of sixteen upland rice genotypes under T1: control (100% FC), T2: moderate stress (70% FC), and T3: severe stress (50% FC) treatments.
GenotypesG1G2G3G4G5G6G7G8G9G10G11G12G13G14G15G16
RMSEn (T1)1.022.162.032.613.821.252.52.573.112.641.081.992.152.690.922.76
RMSEn (T2)3.673.783.513.602.953.293.580.373.333.463.022.913.113.322.432.18
RMSEn (T3)3.653.933.053.283.021.703.133.873.313.080.612.713.403.323.252.98
Disclaimer/Publisher’s Note: The statements, opinions and data contained in all publications are solely those of the individual author(s) and contributor(s) and not of MDPI and/or the editor(s). MDPI and/or the editor(s) disclaim responsibility for any injury to people or property resulting from any ideas, methods, instructions or products referred to in the content.