Article

Simulation Effect of Water and Nitrogen Transport under Wide Ridge and Furrow Irrigation in Winter Wheat Using HYDRUS-2D

1
School of Water Conservancy, North China University of Water Resources and Electric Power, Zhengzhou 450046, China
2
Collaborative Innovation Center for Efficient Utilization of Water Resources, Zhengzhou 450046, China
*
Author to whom correspondence should be addressed.
Agronomy 2023, 13(2), 457; https://doi.org/10.3390/agronomy13020457
Submission received: 8 December 2022 / Revised: 28 January 2023 / Accepted: 1 February 2023 / Published: 3 February 2023
(This article belongs to the Section Water Use and Irrigation)

Abstract

:
An experiment was conducted to create a science-based program of irrigation and fertilizer application for two-year winter wheat under wide ridge and furrow irrigation in the Yellow River irrigation area. The study was performed in a test field located in Zhengzhou, Henan Province, China. A numerical model of soil water and nitrogen transport for winter wheat under wide ridge and furrow irrigation was created using HYDRUS-2D. The behavior of soil water and nitrogen was predicted for different irrigation water and nitrogen treatments and analyzed to identify pathways of nitrogen transport and transformation. The nitrogen balance was calculated for the different water and nitrogen treatments. The coefficients of determination for measured and predicted values of soil water content, nitrate nitrogen, and ammonium nitrogen in both horizontal and vertical directions were all >0.68; the mean absolute error was <0.06; and the root mean square error was <0.1. These values indicate the feasibility of using a numerical model of nitrogen transport for wide ridge and furrow irrigation. The correlation coefficient R2 between simulated values of nitrogen uptake and measured values of total crop nitrogen content was 0.88, the RMSE value was 10.58 kg/ha, and the MAE value was 5.9 kg/ha. Nitrogen loss was primarily caused by denitrification, and the quantity of gaseous nitrogen loss was 7.05–38.2% of the nitrogen form. The total quantity of ammonium nitrogen absorbed by winter wheat plant roots in each treatment was 7.6–15.1% of the total amount of nitrate nitrogen absorbed. The maximum nitrogen uptake was 155.53 kg/ha with a yield of 6888.67 kg/ha at a nitrogen application rate of 220 kg/ha and irrigating to 70% field capacity. The UE of the 220 kg/ha and irrigating to 70% field capacity treatment was relatively high, the PFP of the 120 kg/ha and irrigating to 80% field capacity treatment was relatively high, and the nitrogen use efficiency of the 320 kg/ha and irrigating to 60% field capacity treatment was the lowest overall. This study provides a basis for investigating soil water and nitrogen transport mechanisms of winter wheat under wide ridge and furrow irrigation in the Yellow River irrigation area.

1. Introduction

Water and nitrogen are critical plant growth factors that can be controlled to influence crop development [1]. Excessive irrigation and chemical fertilizer application to obtain high yield have become the norm in agricultural production and have resulted in non-point source pollution that has deteriorated water and soil environments [2] and led to groundwater nitrate concentrations that exceed standards [3]. Much research has been conducted into water and nitrogen transport using indoor soil containers with different irrigation methods in conjunction with numerical models [4,5,6,7,8,9] in order to accurately simulate water and nitrogen transport and to develop efficient water and fertilizer application systems. Similar field-based research into water and fertilizer application has also been conducted [10,11]. Although an indoor experiment can reveal the regularities and mechanisms of soil water and fertilizer movement, it necessarily excludes key crop growth and weather factors and, therefore, any model built depending on it has defects. A field experiment will provide realistic experimental data, but it is extremely time and energy-consuming to conduct such experiments, and experimental conclusions often lack generality. Li et al. optimized water and nitrogen management measures for winter wheat and studied the effects of controlled-release fertilizers with different release periods and their water and fertilizer dosages on the yield of winter wheat [12]. Gu et al. investigated the effects of different bed sizes and fertilizer application timings on the distribution pattern of soil nitrate-N and on the yield of winter wheat [13]. Li et al. used summer maize-winter wheat crop rotation in North China as a study object to explore irrigation and fertilization methods that can reduce nitrous oxide emissions while ensuring the grain yield [14].
Present research is mainly directed towards combining experimentally measured data with a numerical model to create an appropriate numerical model [15,16,17,18]. However, the paradigm for most current field water transport models is one-dimensional vertical infiltration, and there has been little research into the development of water and nitrogen transport models for two-dimensional ridge and furrow irrigation of winter wheat. Differences in water and fertilizer application methods result in differences in the soil distribution of water and nitrogen, thus changing the physical and chemical environment of the root zone and influencing the nitrification, mineralization, and denitrification occurring in the soil and ultimately causing differences in the total nitrogen absorption of the crop. The crop modeled in this study is winter wheat [19]. More needs to be reported on the high-accuracy model of two-dimensional water movement, nitrogen transport and transformation, and nitrogen uptake and utilization of winter wheat in the Yellow River irrigation area. In order to develop a suitable water and fertilizer application treatment that takes account of local conditions, it is necessary to build a water and nitrogen transport model for winter wheat growth that will predict the distribution of water and nitrogen in the soil and the nitrogen uptake and accumulation of plants in response to water and fertilizer treatments.
The objectives of the current study were as follows. Comparative field experiments were conducted on two-year winter wheat under wide ridge and furrow irrigation. Field-measured data were used in creating a water and nitrogen transport model for winter wheat under wide ridge and furrow irrigation. The case was used to predict the synergistic response of plants to different water and nitrogen distributions in the soil and the total nitrogen accumulation of plants in response to different experimental treatments. The water and fertilizer treatment that produced the greatest nitrogen accumulation in plants was identified, and the nitrogen use efficiencies of different treatments were compared. This study provides scientific support for water and chemical fertilizer management that will reduce agricultural non-point source pollution during the growth period of winter wheat in the middle and lower reaches of the Yellow River.

2. Materials and Methods

2.1. Soil Conditions and Experiment Design

2.1.1. Overview of the Study Area and Soil Characteristics

The experiment was conducted in the experimental field of the Agricultural High Efficiency Water Use Test Field of North China University of Water Resources and Hydropower in Zhengzhou from October 2020 to June 2022. The ditch length in a single test area was 50 m, the ridge width was 0.7 m, and the total ditch width on each side of the ridge was 0.8 m. The geographical coordinates of the field are 34°50′ N, 113°48′ E. During the experiment, average temperature in the area was 13.56 °C, and average daily sunshine was 4.82 h. The location of the test area is shown in Figure 1. In the winter wheat growth period, the temperature during the overwintering period was <0 °C, and the soil was subjected to freeze–thaw cycles. During this period, soil water did not flow, but the HYDRUS-2D case does not accommodate freeze–thaw cycles, so the soil moisture and solute transport process module did not model water and nitrogen treatment in the early stage of winter wheat growth. Therefore, this paper simulates the changes in soil water content, ammonium nitrogen concentration, and nitrate nitrogen concentration from 1 March to 25 May 2021 and 24 February to 20 May 2022. Before the test, the particle size distribution of the test soil at different depths was determined by a BT-9300ST laser particle size analyzer, and the basic physical and chemical properties of the soil were determined. The basic physical properties and physicochemical parameters of the soil in the test site are shown in Table 1.

2.1.2. Experiment Design

The experimental variety of winter wheat was Jimai 22, which were sown on 12 October 2020 and 15 October 2021, and harvested on 25 May 2021 and 20 May 2022. The irrigation method was wide ridge and furrow irrigation [20]; irrigation timing depended on the lower limit of soil moisture content. According to local planting practices in Henan Province, and in conjunction with the goals of this study, the nitrogen application range for winter wheat was determined based on existing research results [21,22]. We combined three nitrogen application rates (120 kg/ha (F1), 220 kg/ha (F2), and 320 kg/ha (F3)) and three soil moisture controls (irrigation to the lower limits of 60% field water capacity (W1), 70% field water capacity (W2), and 80% field water capacity (W3)) to give nine experimental water and nitrogen application treatments. Fertilizer application timing, irrigation water, fertilizer amount, and upper and lower limits of irrigation for the nine treatments are detailed in Table 2. Rainfall after the regreening period is shown in Figure 2. The field was plowed immediately after base fertilizer (compound fertilizer of potassium sulfate, N/15%, P/15%, and K/15%) application. The top dressing was incorporated with water and fertilizer (urea, N/46.3%) and applied by irrigation.

2.2. Determination Items and Methods

2.2.1. Soil Moisture Measurement

Soil moisture content was measured by a Trime-PICO-IPH (time domain reflectometry) every 2–3 d during the wheat growth period. Before wheat planting, after harvest, and during the key growth period, a 0–100 cm soil depth probe was drilled into the soil; every 20 cm was considered to be a layer. Soil moisture content was measured by drying to calibrate the soil moisture content measured by the Trime-PICO-IPH.

2.2.2. Determination of Soil Nitrogen Content

Before winter wheat planting, after harvest and during key growth periods, and 5 d after fertilization treatment, soil samples were taken with a soil auger, treating every 20 cm as a distinct soil layer for a total of 5 layers. The soil samples were extracted by a KCl solution, and the contents of ammonium nitrogen and nitrate nitrogen in the solution were measured by ultraviolet spectrophotometry. In order to model the soil nitrogen transformation process accurately, the dry soil nitrogen content was converted into concentration in a soil solution.
C w = C s ρ 1000 θ
where: Cw is the soil nitrogen content in soil solution, mg/cm3; Cs is the dry soil nitrogen content, mg/kg; ρ is soil bulk density, g/cm3; and θ is the soil volumetric water content, cm3/cm3.

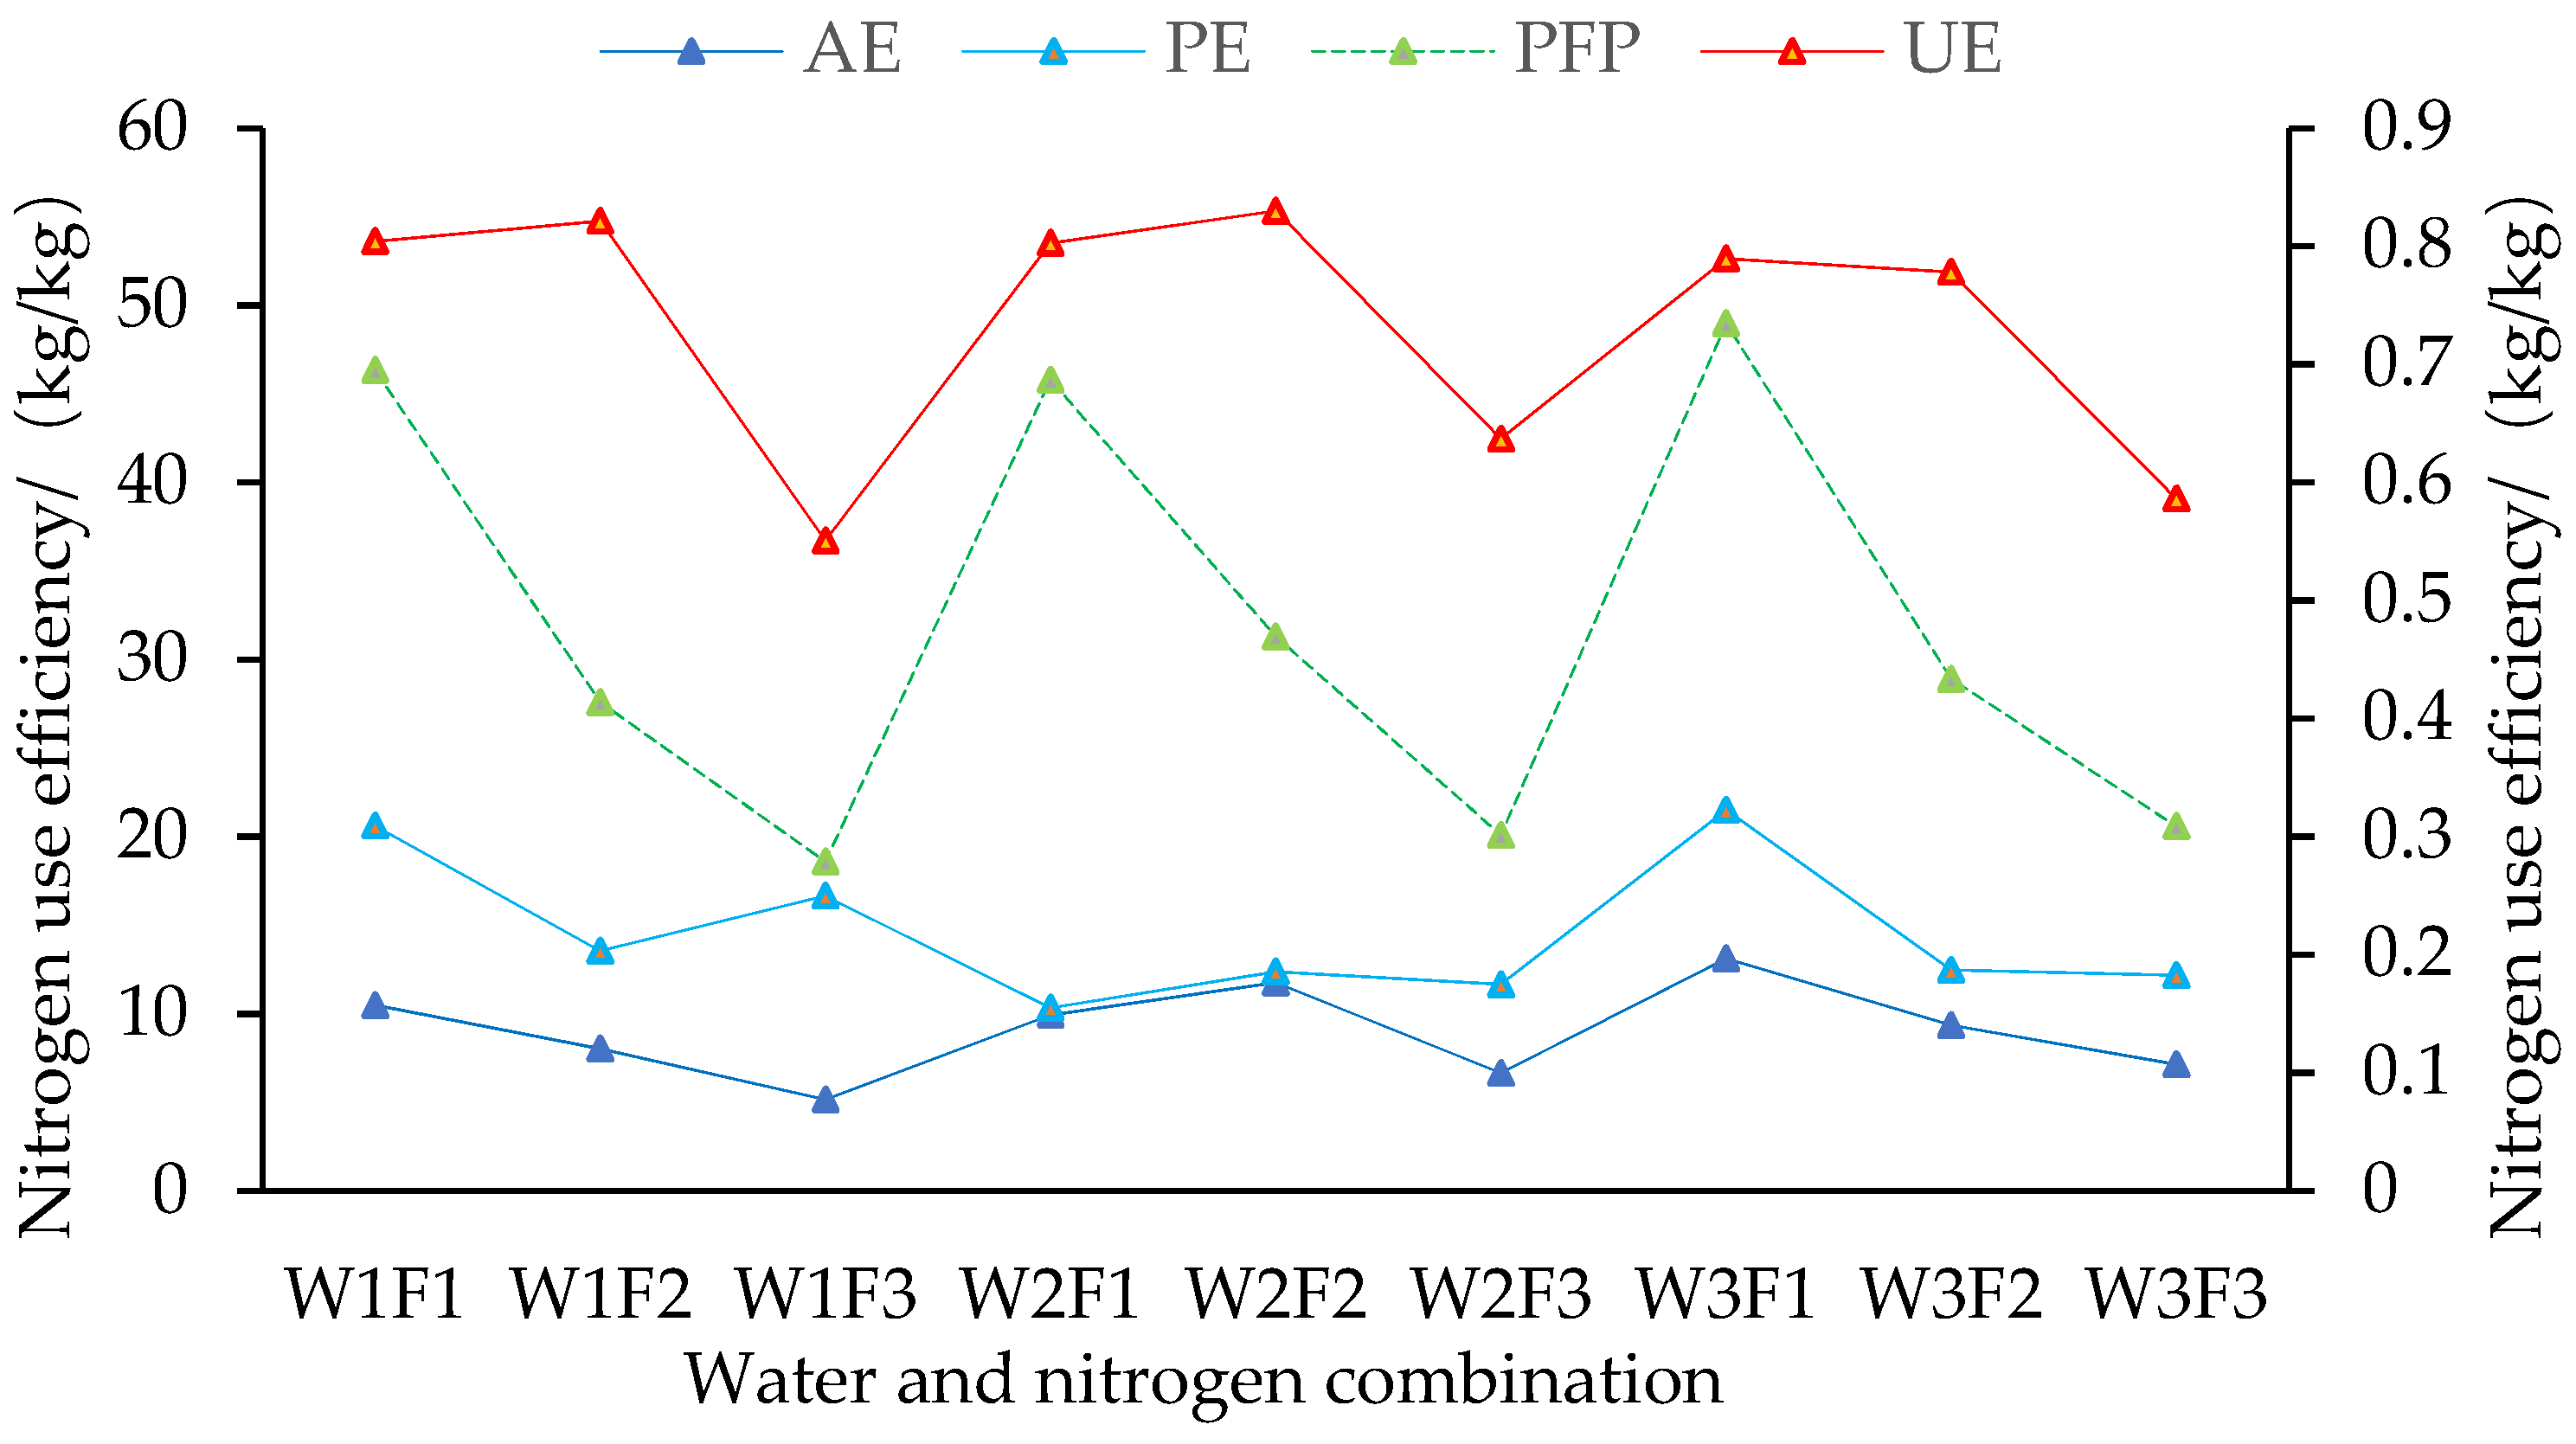
2.2.3. Fertilizer Agronomic Efficiency, Fertilizer Physiological Efficiency, Fertilizer Utilization Efficiency, and Partial Factor Productivity of Fertilizer

Fertilizer agronomic efficiency (AE, kg/kg):
A E = Y N Y C K T N
where: YN is the yield of winter wheat, kg/hm2; YCK is the yield of the control, kg/hm2; and TN is the amount of nitrogen applied, kg/hm2.
N fertilizer physiological efficiency (PE, kg/kg):
P E = Y N Y C K U N U C K
where: UN is the amount of nitrogen absorbed by the crop, kg/hm2; and UCK is the amount of nitrogen absorbed by the control crop, kg/hm2.
N fertilizer utilization efficiency (UE, kg/kg):
U E = U N U C K T N
Partial factor productivity of fertilizer (PFP, kg/kg):
P F P = Y N T N

2.3. Mathematical Model

The mean absolute error (MAE), root mean square error (RMSE) and coefficient of determination (R2) were used to evaluate the accuracy of the model.

2.3.1. Water Movement Equation

The basic equation of unsaturated soil water movement [23] and the Van Genuchten–Mualem (VG-M) model were used to calculate K(θ):
θ t = x [ D ( θ ) θ x ] + z [ D ( θ ) θ z ] + K ( θ ) z S ( x , z , h )
K ( θ ) = { K s S e l [ 1 ( 1 S e 1 / m ) m ] 2 h < 0 K s h 0
S e = { θ θ r θ s θ r = l ( 1 + | α h | n ) m h < 0 1 h 0
where: θ is the soil volumetric water content, cm3/cm3; t is the infiltration time, min; r and z are the spatial coordinates, with z downward as the positive direction, cm; K(θ) is the soil unsaturated hydraulic conductivity, cm3/min; D(θ) is the moisture diffusivity, cm3/min; S(x,z,h) is the crop root water uptake; Se is the relative soil saturation; Ks is the soil saturated hydraulic conductivity, cm/min; α is the reciprocal of the air-entry suction value, cm−1; m and n are the shape coefficients, with m = 1 − 1/n; and l is the soil hydraulic characteristic curve fitting coefficient, 0.5.

2.3.2. Solute Transport Equation

The convection–dispersion governing partial differential equations for unsaturated nitrogen transport and transformation in winter wheat [24] are:
Urea nitrogen:
( θ · C u r e a ) t = x ( θ D x x C u r e a x x + θ D x z C u r e a z ) + 1 x ( θ D x x C u r e a x x + θ D x z C u r e a z ) + z ( θ D x x C u r e a x x + θ D x z C u r e a z ) ( q x C u r e a x + q x C u r e a x + q z C u r e a z ) μ w , u r e a θ C u r e a  
Ammonium nitrogen (volatilization, nitrification, mineralization, and biological immobilization):
( θ C N H 4 + ) t + ρ s N H 4 + t = x ( θ D x x C N H 4 + x + θ D x z C N H 4 + z ) + 1 x ( θ D x x C N H 4 + x + θ D x z C N H 4 + z ) + z ( θ D z z C N H 4 + x + θ D x z C N H 4 + z ) ( q C N H 4 + x + q C N H 4 + x + q C N H 4 + z ) + μ w , u r e a θ C u r e a ( μ w , N H 4 + θ C N H 4 + + μ s , N H 4 + ρ S N H 4 + ) μ w , N H 4 + θ C N H 4 + + γ w , N H 4 + θ + γ s , N H 4 + ρ S C N H 4 +
Nitrate nitrogen (denitrification and biological fixation):
( θ C N O 3 ) t = x i ( θ D x x C N O 3 x + θ D x z C N O 3 z ) + 1 x ( θ D x x C N O 3 x + θ D x z C N O 3 z ) + z ( θ D x x C N O 3 x + θ D x z C N O 3 z ) ( q C N O 3 x + q C N O 3 x + q C N O 3 z ) + ( μ w , N H 4 + θ C N H 4 + + μ s , N H 4 + ρ S N H 4 + ) - ( μ w , N O 3 + μ s , N O 3 ) θ C N O 3 S C N O 3
Altogether:
θ D x x = D L q x 2 | q | + D T q z 2 | q | + θ D w τ
θ D z z = D L q z 2 | q | + D T q x 2 | q | + θ D w τ
θ D x z = ( D L D T ) q x q z | q |
τ = θ 7 / 3 / θ s 2
where C u r e a is urea liquid concentration, C N H 4 + is ammonium nitrogen liquid concentration, S N H 4 + is ammonium nitrogen solid concentration, and C N O 3 is nitrate nitrogen liquid concentration, all in mg/cm3; q i is water flow rate, cm/min; D i j is the liquid dispersion coefficient, cm2/min; μ w , u r e a is the first-order kinetic reaction coefficient for urea hydrolysis,/day; μ w , N H 4 + is the liquid phase first-order kinetic reaction coefficient for ammonium nitrogen,/day; μ w , N H 4 + and μ s , N H 4 + are, respectively, the second-order kinetic reaction coefficients of ammonium nitrogen liquid and solid phases involved in nitrogen nitrification,/day; γ w , N H 4 + , γ s , N H 4 + are, respectively, the zero-order kinetic reaction coefficients of nitrogen transformation (mineralization and biological immobilization),/day; and μ w , N O 3 and μ s , N O 3 are, respectively, the denitrification reaction coefficients of liquid and solid nitrate nitrogen (a first-order reaction).
Assuming that ammonium ions are adsorbed by soil in a solid phase, the isothermal adsorption relationship between liquid ammonium ions and solid ammonium ions is described by the linear equation:
S N H 4 + = K d C N H 4 +
where Kd is the adsorption constant of ammonium nitrogen, 0.0035 cm3/mg [25].

2.3.3. Root Water Absorption Equation and Root Growth

Winter wheat roots were mainly distributed in the 0–60 cm soil depth. The water absorption equation for wheat roots uses the Feddes generalized root water absorption model in HYDRUS-2D software, and the user can quantitatively specify the water consumption of the roots as volume per unit time. The equation for root water absorption using the HYDRUS-2D, specific parameters are detailed in Table 3, built-in wheat parameters is:
S ( x , z , h ) = α ( x , z , h ) b ( x , z ) T P L
where α(x,z,h) is the dimensionless water stress response function of root water uptake; b(x,z) is the root water uptake distribution function (L/day); TP is the crop potential transpiration rate, cm/day; and L is the maximum width of root zone distribution with a field-measured value of 3 cm.
The actual transpiration rate of winter wheat is calculated by the equation:
E T a = L R S ( h , z , t ) d z = T p ( t ) L R α ( h ) β ( z , t ) d z
The root distribution area is described by the root growth model of HYDRUS-2D:
L R ( t ) = L m f r ( t )
where: Lm is the maximum root depth, cm; and fr(t) is the dimensionless root growth coefficient, estimated by the Verhulst–Pearl logistic growth function.
f r ( t ) = L 0 L 0 + ( L m L 0 ) e r t
where: r is the root growth rate, day−1; the Lm of each treatment was measured by destructive sampling in the range of 40–80 cm during the critical fertility period of winter wheat and varied with the water and nitrogen regulation deficit; 𝐿0 is the initial value of root length in the simulation stage of winter wheat, cm.

2.3.4. Crop Transpiration Rate

Bell’s law divides the actual transpiration of winter wheat into soil surface evaporation and plant evapotranspiration:
E v a p = E T a ( 1 S C F )
T r a n s p = E T a × S C F
S C F = 1 exp ( r E x t i n c t × L A I )
where: LAI is the wheat leaf area index for the growth period, which is determined by data fitting using the winter wheat leaf area index–time equation; SCF is the crop light transmission coefficient; ETa is the actual evapotranspiration of winter wheat and rExtinct is obtained using a plant canopy analyzer and the supporting analysis system:
r E x t i n c t = ln ( T P A R P A R ) L A I
where: TPAR is instantaneous photosynthetically active radiation below the canopy, µmol/m2/s; and PAR is instantaneous photosynthetically active radiation above the canopy, µmol/m2/s.

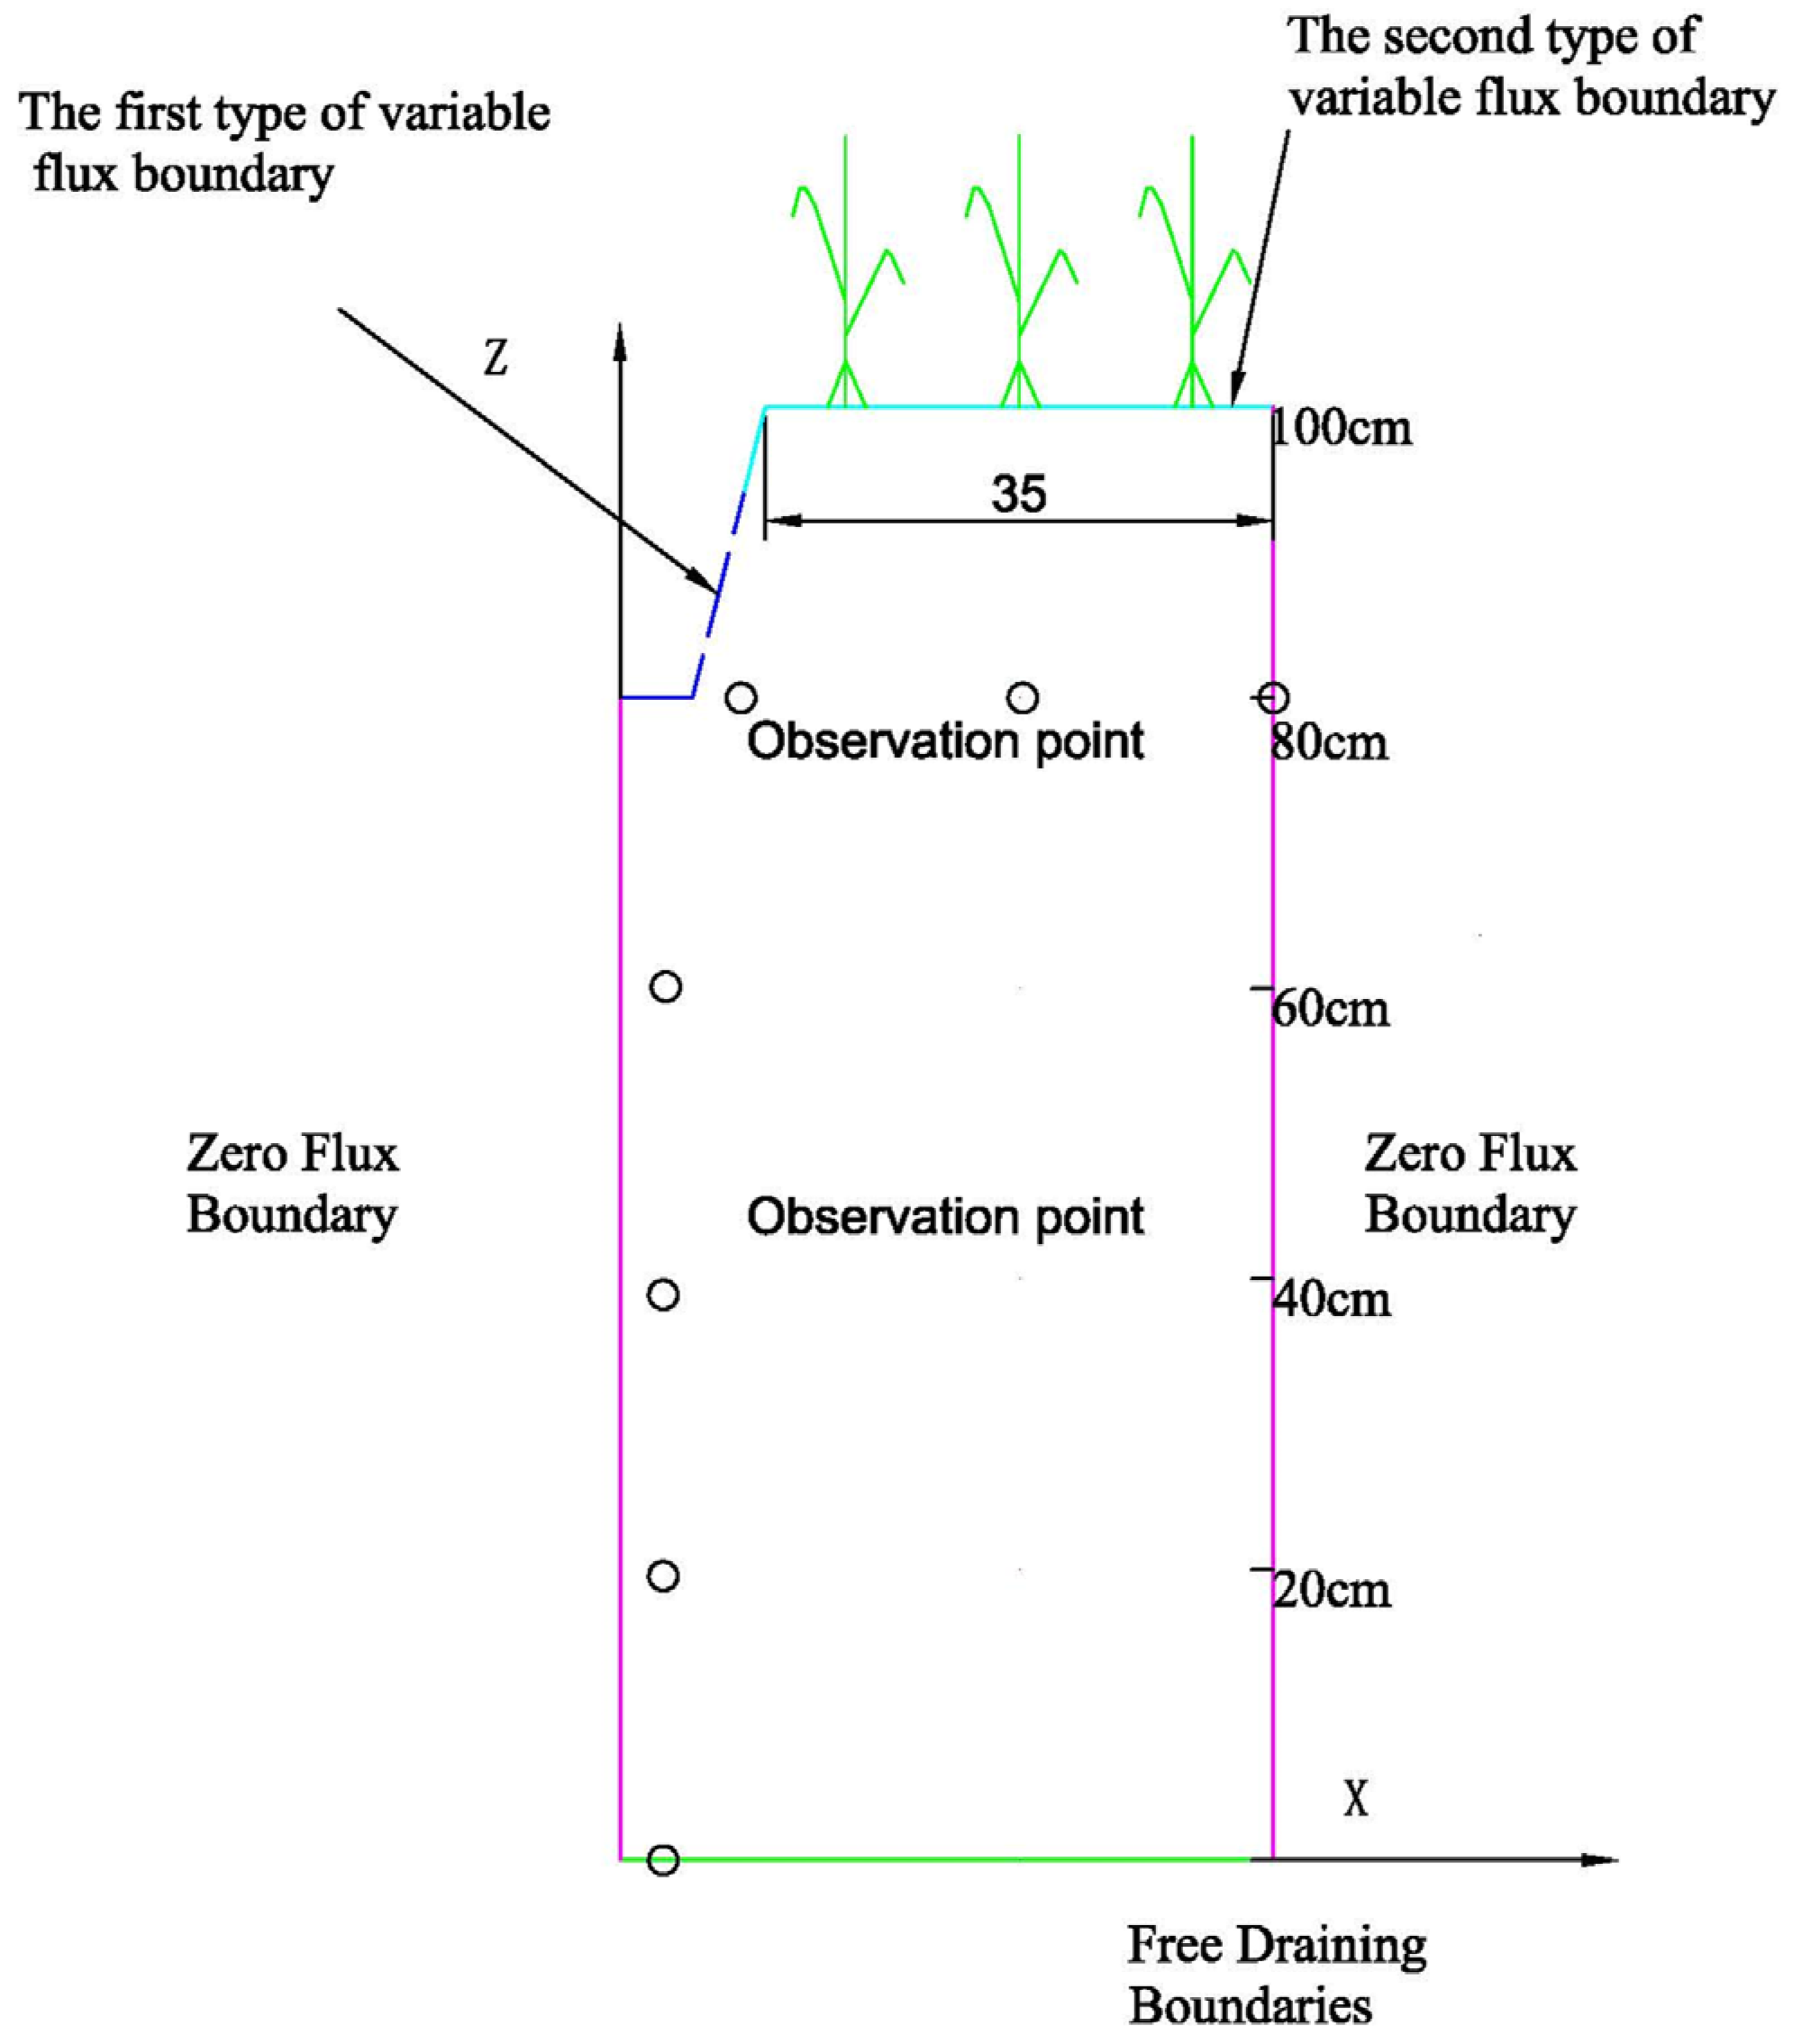
2.4. Boundary Conditions

Initial conditions:
The measured values from the field experiment of the moisture content of each soil layer and the soil ammonium nitrogen and nitrate nitrogen contents were input into the HYDRUS-2D case as initial conditions. The model assumption is that the initial soil water and nitrogen contents of each layer are evenly distributed in the horizontal and vertical directions:
{ θ i ( x , z ) = θ 0 i ( 0 x X , z i d z z i u , t = 0 ) c i ( x , z ) = c 0 i ( 0 x X , z i d z z i u , t = 0 )
where i is the number of the soil layer; θi is the soil moisture content of layer i; c i is the mass concentration of soil N H 4 + N or N O 3 N for layer i, mg/cm3; θ 0 i is the initial value of θ i ; c 0 i is the initial value of c i ; z i u represents the vertical coordinates of the upper boundary of soil layer i, cm; and z i d represents the vertical coordinates of the upper boundary of soil layer i, cm.
A constant flow boundary was used for the irrigation ditch; change in the width of the saturated zone over time during an irrigation event was ignored due to the long simulation period. It was assumed that the horizontal width of the saturated zone was fixed with value w, and the value taken for the field experiment was the value at 15 cm from the center of the ditch. The saturated zone was treated as a constant flow boundary that did not change with time during irrigation events and an atmospheric flux boundary at other times. The remainder of the upper boundary was the atmospheric boundary. The flow and solute concentration boundary conditions in the saturation region were:
{ K ( h ) h z K ( h ) = σ ( t ) ( 0 x w , z = 80 , 0 < t < T ) ( θ D x x c 1 x + θ D x z c 1 x ) + q x c 1 = q x c a ( 0 x w , z = 80 , 0 < t < T ) ( θ D z z c 1 z + θ D x z c 1 x ) + q z c 1 = q x c a ( 0 x w , z = 80 , 0 < t < T )
where Ca is the urea nitrogen mass concentration of the fertilizer solution, mg/m3, T is the time of water flow recession in the furrow, h; σ(t) is the constant flow boundary flux at irrigation points during irrigation, 3 cm/day. The left and right sides of the model area were zero flux boundaries, and the lower part of the model was the free drainage boundary, as shown in Figure 3.

2.5. Parameter Inversion and Model Calibration

The parameters of the Van Genuchten–Mualem (VG-M) were inverted by the measured water content from the field experiment using the built-in HYDRUS-2D inversion module, and the parameters of solute transport and transformation were calibrated using the ammonium nitrogen and nitrate nitrogen concentrations. The sensitivity of the 5 parameters of the V-G model was analyzed using HYDRUS-2D. We found that residual water content θr had the least influence on the results [26]. Based on existing laboratory research [27], θr was given the fixed value 0.0324 cm3/cm3. The experimentally measured diffusion coefficients of nitrate nitrogen and ammonium nitrogen were 1.64 cm2/day and 1.52 cm2/day. Based on references [28,29,30], the solute longitudinal dispersion (DL) of nitrogen transport was taken to be 10 cm, equal to 10% of the simulation area. Transverse dispersion (DT) was taken to be 5% of longitudinal dispersion. After parameter inversion, the parameters for volumetric water content, nitrate nitrogen content, and ammonium nitrogen content in different soil depths for treatments W2F1, W2F2, and W3F3 were determined for the regreening stage to the mature stage in 2021. The results are shown in Table 4 and Table 5.

3. Results

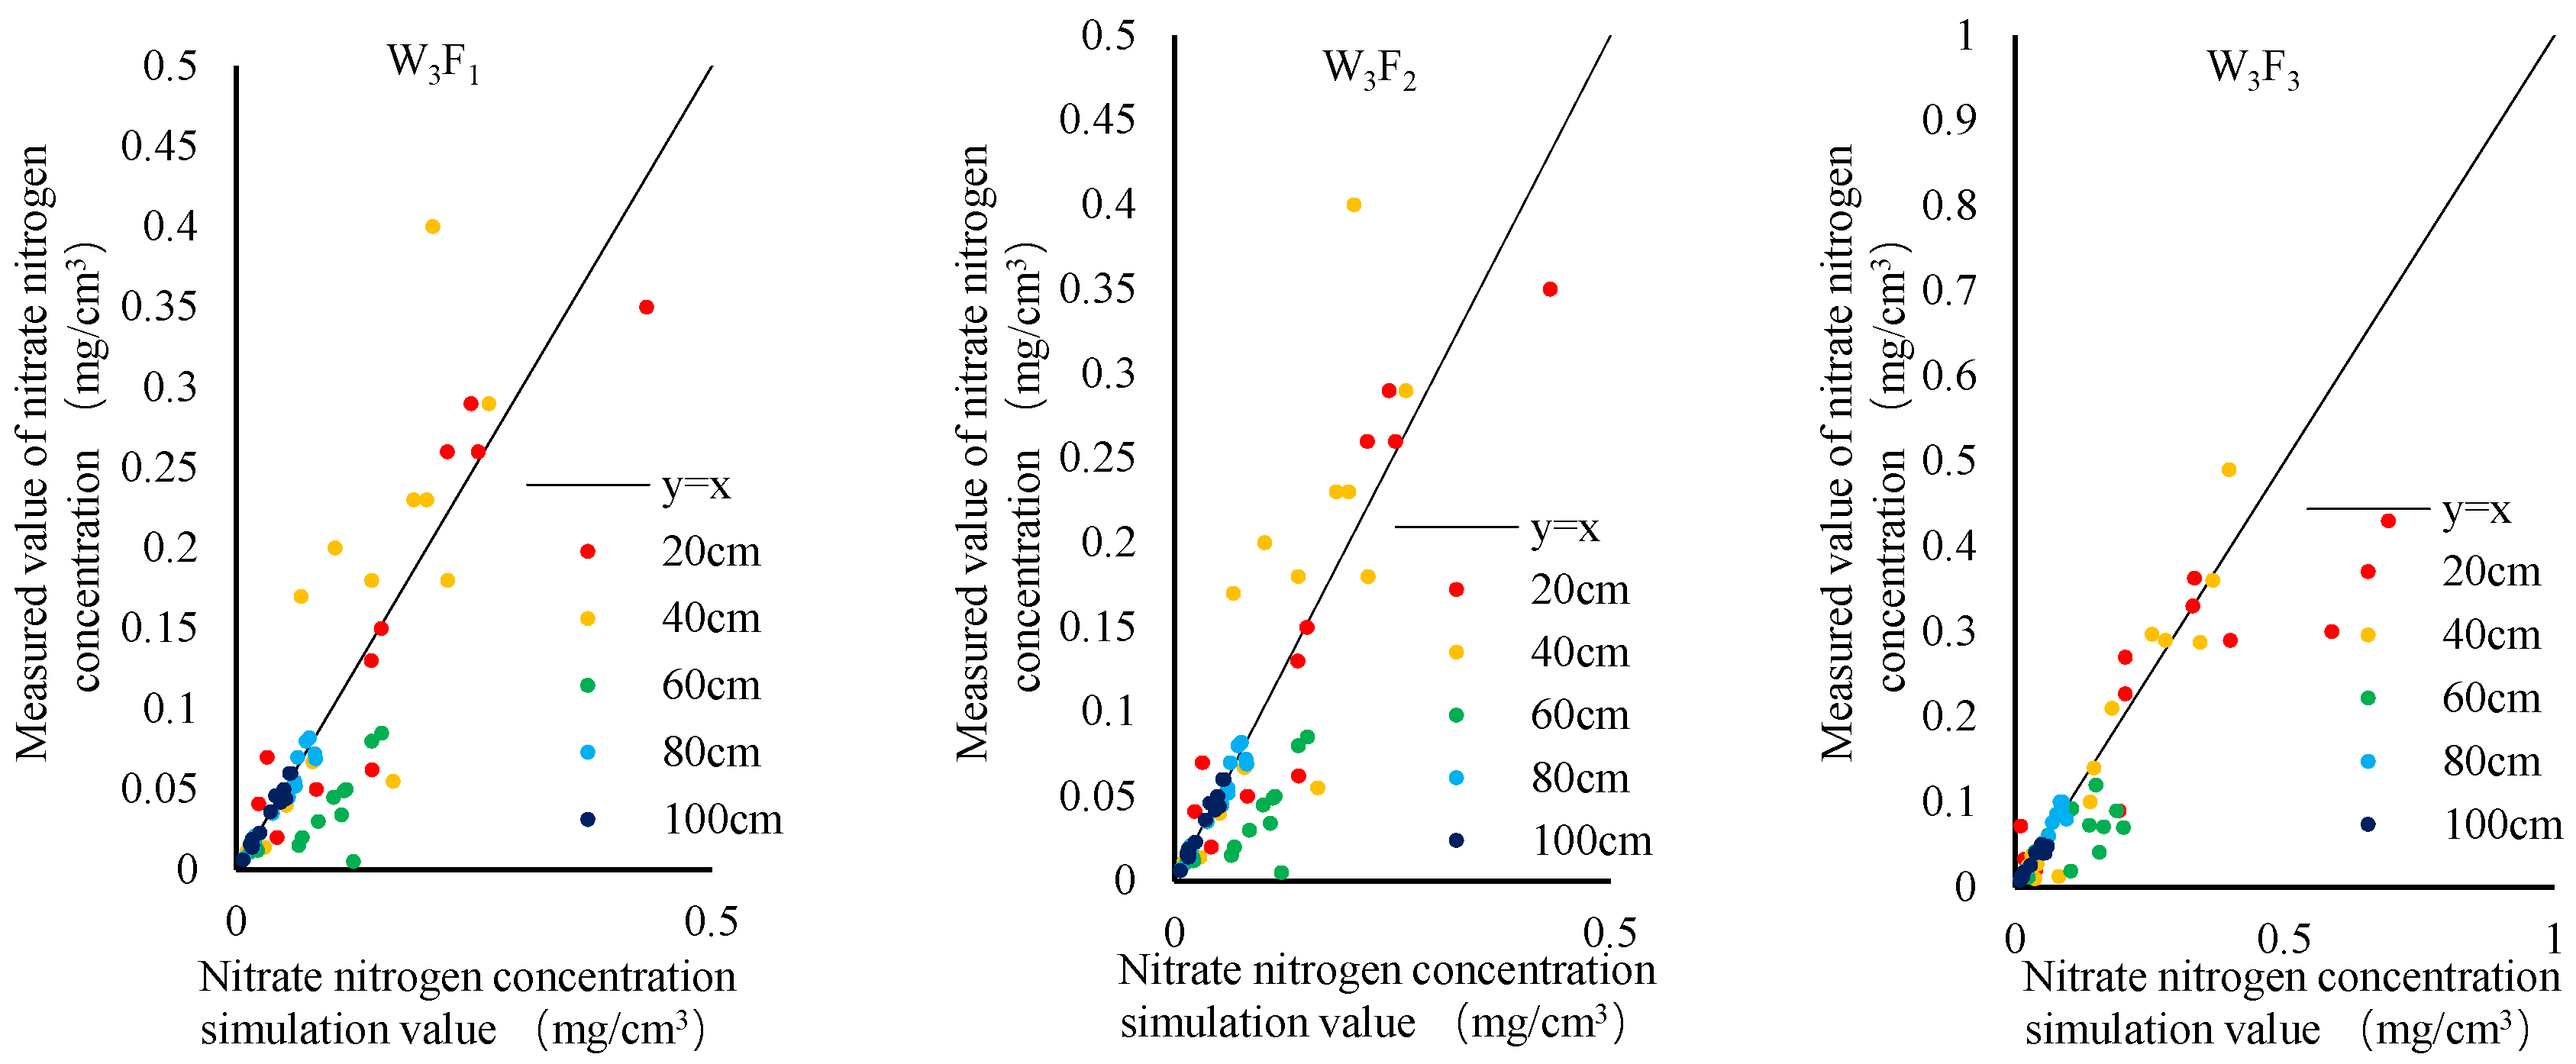
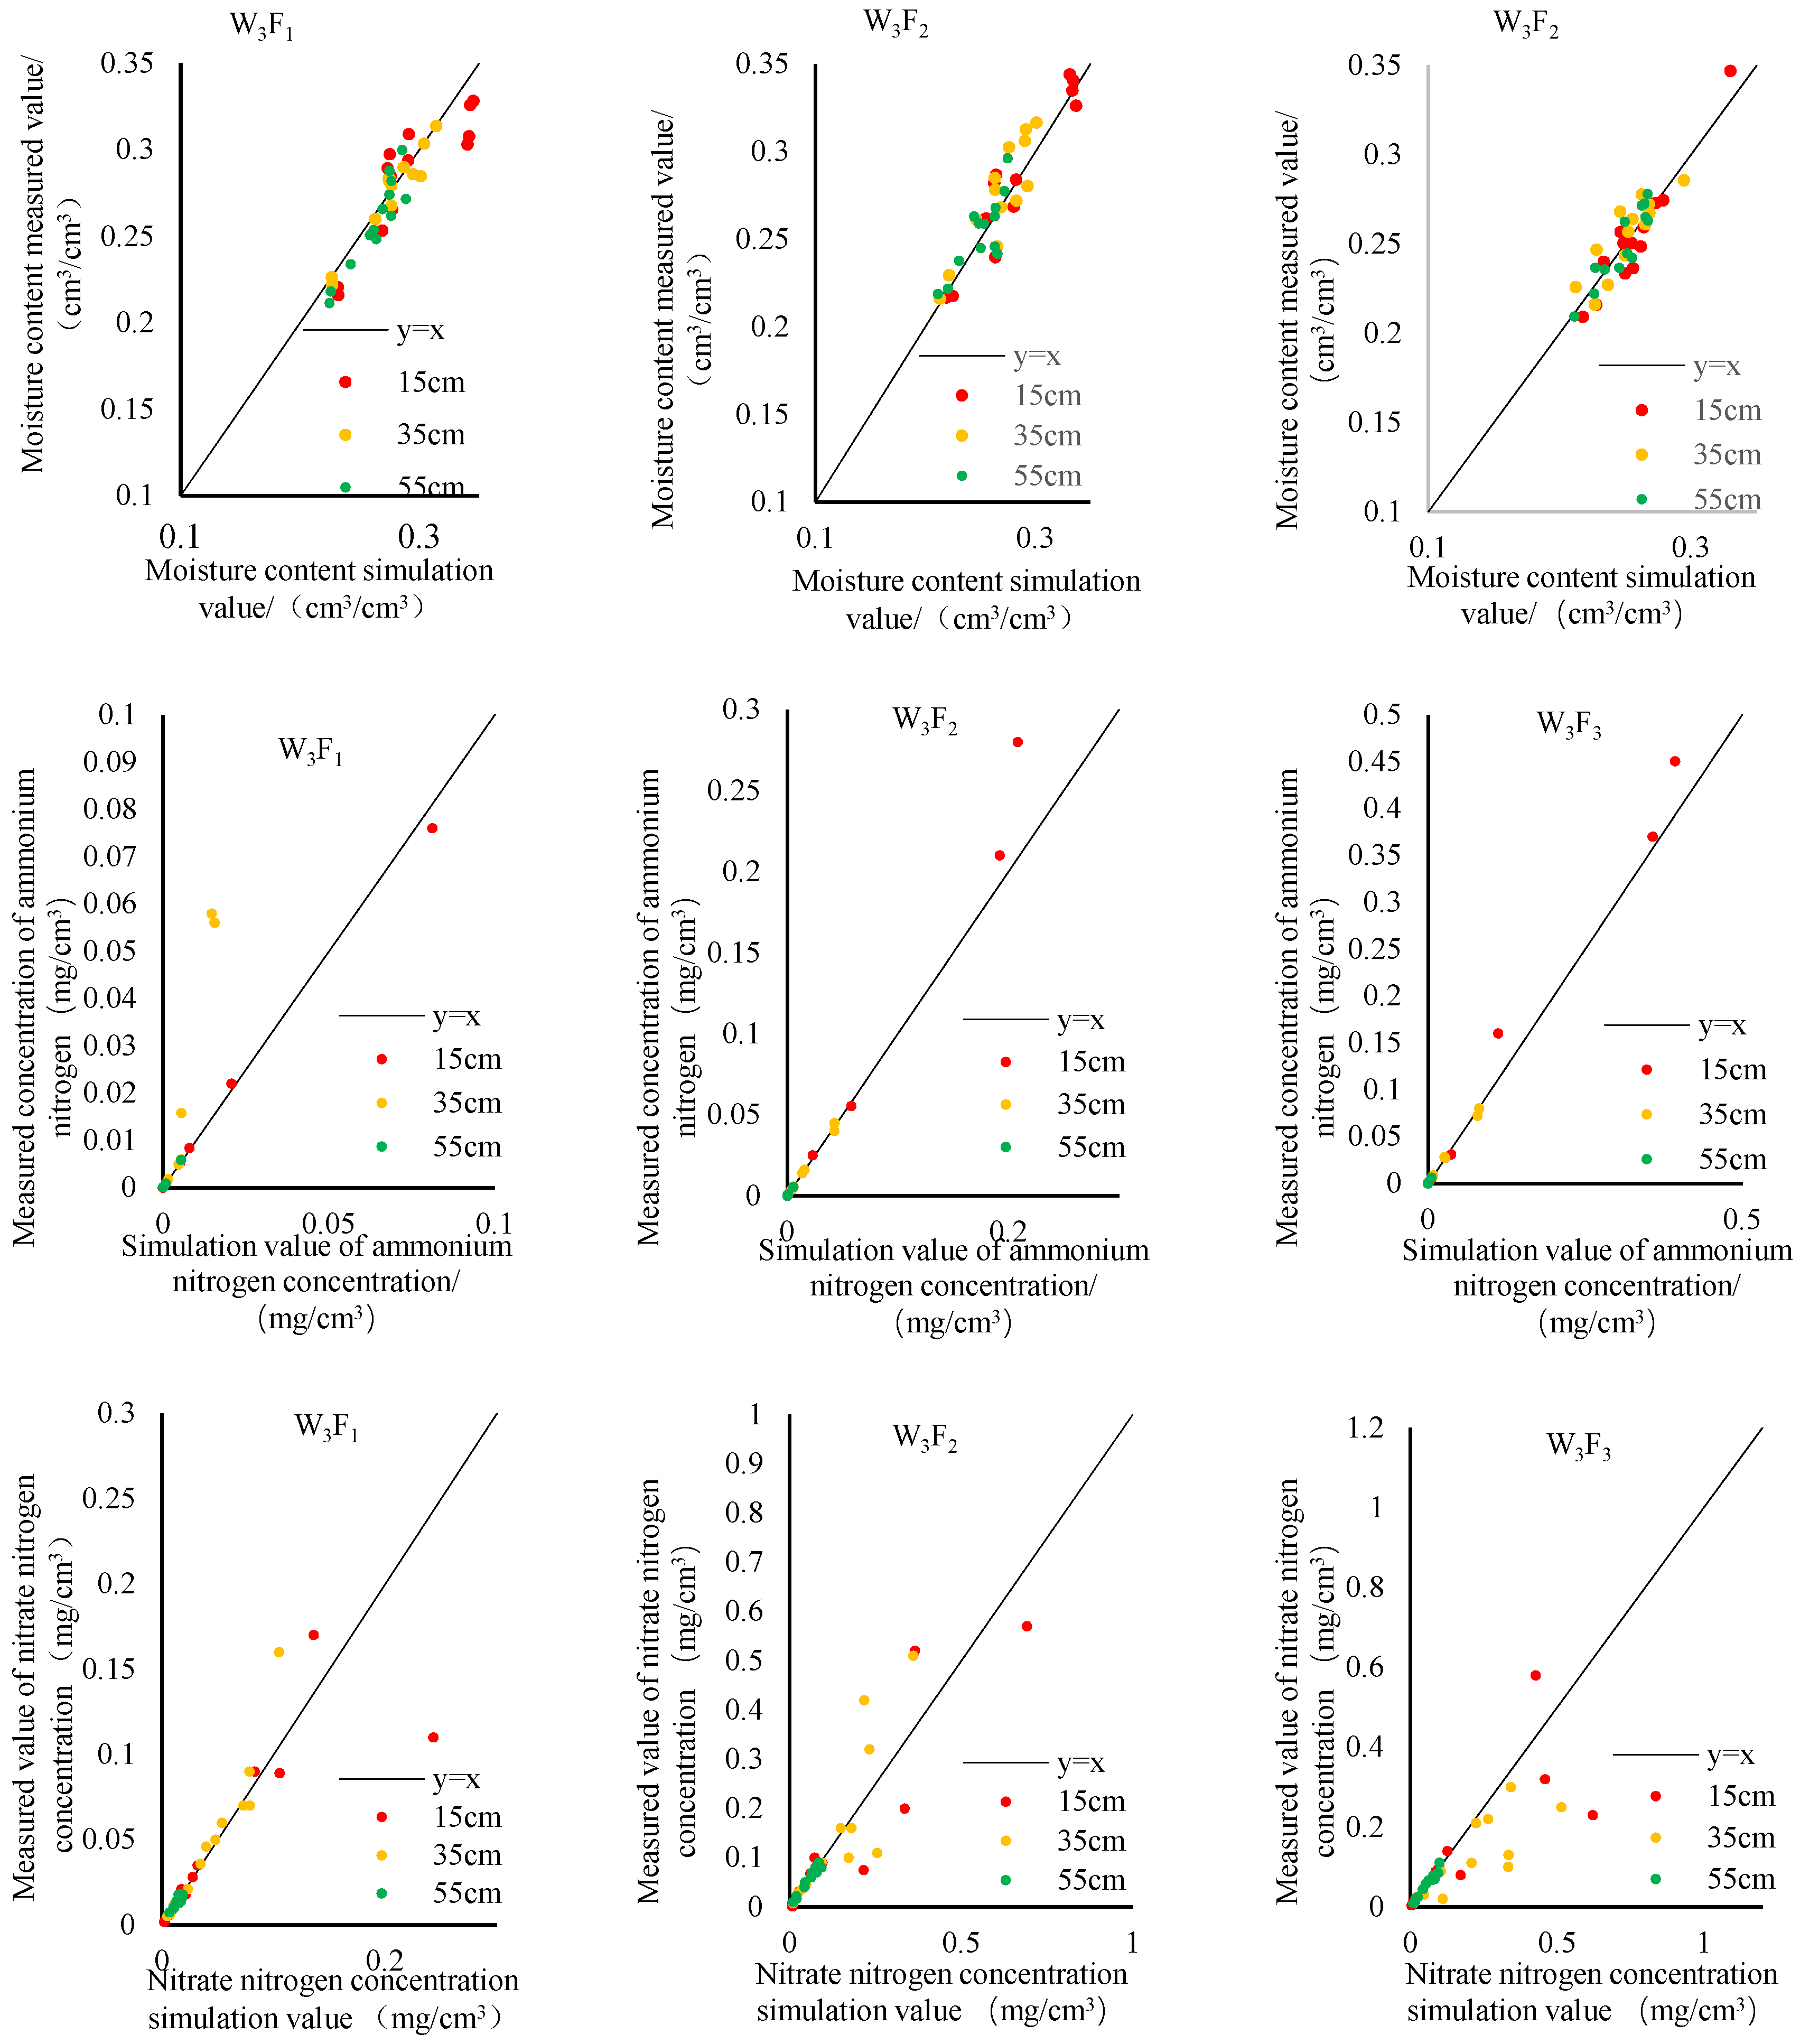
3.1. Model Verification

In 2022, model calculations were carried out for field experiment treatments W3F1, W3F2, and W3F3 in the field experiment in order to verify the modified soil hydraulic characteristic parameters (Table 4) and solute transport and transformation parameters (Table 5). Figure 4 and Figure 5 show for comparison the measured and predicted values of soil moisture content, ammonium nitrogen, and nitrate nitrogen in the vertical and horizontal directions in different periods from the regreening stage to the maturity stage of winter wheat. It can be seen that the modified soil hydraulic parameters and solute transport and transformation parameters were highly accurate. The specific error values are shown in Table 6. Model accuracy was greatest for soil volumetric water content, with R2 in the horizontal direction > 0.83 and R2 in the vertical direction > 0.81. The MAE for predicted ammonium nitrogen compared with the measured value was 0.007–0.021 in the horizontal direction and 0.003–0.008 in the vertical direction. The RMSE was 0.025–0.049 in the horizontal direction and 0.003–0.023 in the vertical direction. However, R2 was >0.68 due to the low concentration of ammonium nitrogen; only the ammonium nitrogen content had changed in surface samples, and the number of samples was small. The MAE for nitrate nitrogen content ranged from 0.008 to 0.06 in the horizontal direction and from 0.011 to 0.052 in the vertical direction. The RMSE ranged from 0.018 to 0.097 in the horizontal direction.

3.2. Model of Soil Nitrogen Balance

In order to study the nitrogen balance of winter wheat planting soil under wide ridge and furrow irrigation, the nitrogen balance of winter wheat planting soil in 2022 was calculated based on the HYDRUS-2D case. Table 7 shows accumulated nitrogen balances predicted by the HYDRUS-2D case for winter wheat after the overwintering period. Ammonium nitrogen produced by mineralization reactions and biological immobilization decreased as the field nitrogen concentration increased. Ammonia volatilization ranged from 0.83 to 6.39 kg/ha and increased as urea application increased. An increase in nitrogen application did not significantly increase crop absorption and utilization of nitrogen. In the medium water–medium fertilizer treatment W2F2, the maximum total nitrogen absorption by crops was 155.53 kg/ha. The total quantity of ammonium nitrogen absorbed by winter wheat roots in each treatment was only 7.6–15.1% of the total quantity of nitrate nitrogen absorbed. When the nitrogen application rate and irrigation quantity increased, the nitrification of ammonium nitrogen significantly increased, and the nitrate nitrogen content significantly increased to 89.75–217.1 kg/ha. The rate of denitrification of nitrate nitrogen increased, and the generated N2 and N2O were diffused into the air as gases. The denitrification quantity for each treatment accounted for 7.01–38.2% of the nitrification quantity.
Analysis of the nitrogen uptake of winter wheat from HYDRUS simulations with the measured values of total nitrogen was conducted. The correlation coefficient R2 was 0.88, the RMSE value was 10.58 kg/hm2, and the MAE value was 5.9 kg/hm2, indicating that the model simulation was effective. The results of the nitrogen use efficiency calculation using the total nitrogen uptake of winter wheat (Table 7) and the measured values of winter wheat yield are shown in Figure 6. The UE of the W2F2 treatment was relatively high, the PFP of the W3F1 treatment was relatively high, and the nitrogen use efficiency of the W1F3 treatment was the lowest overall.

4. Discussion

4.1. Inversion of Water Transport Parameters and Physicochemical Solute Parameters

Based on the experimental data of 2021, the numerical simulation of water and nitrogen transport in winter wheat in 2022 was constructed using HYDRUS-2D. The coefficients of determination for model verification of soil moisture content, nitrate nitrogen, and ammonium nitrogen were, respectively, >0.81, >0.73, and >0.68. Previous studies have found that the error between predicted and measured soil water content was <10% [31], and the error between predicted and measured nitrogen content was <25% [32,33]. This is because environmental conditions have a great influence on nitrate nitrogen and ammonium nitrogen content. Moisture content, temperature, and soil oxygen content change soil nitrogen distribution in different ways. In the 0–60 cm soil depth, the soil water movement parameters θs, n, and K showed an increasing trend as the concentration of fertilizer in solution increased, but a showed a decreasing trend.
In the 60–100 cm soil depth, soil water movement parameters did not change significantly; this result is consistent with existing research [34]. The principal reason was that the irrigation amount of 30 mm during irrigation and fertilization was inadequate to transport urea to deeper soil, and urea nitrogen was rapidly converted into ammonium nitrogen. Ammonium nitrogen is strongly adsorbent [25] and adsorbs with anions on the surfaces of soil colloids. Soil colloids gradually agglomerate to form soil aggregates because of the attraction between positive and negative charges. Aggregate formation changes soil surface structure, increases soil porosity, and changes soil water conductivity. However, water does not easily transport ammonium nitrogen because of the strong adsorption to soil particles, and so ammonium nitrogen affects pore structure in the 0–20 cm soil layer. However, nitrate nitrogen produced by the nitrification of ammonium nitrogen is readily transported by water, and so many pores become closed as water infiltrates. This explanation shows that fertilizer–irrigation affects the physical and chemical properties of the soil only in the 0–60 cm layer.

4.2. Nitrogen Balance

Variations in fertilizer application will cause differences in root growth, alter soil pore structure, and change soil water storage capacity [35]. Different water and fertilizer treatments, therefore, have different effects on the crop and will affect the total nitrogen accumulation of wheat. Certain levels of water and fertilizer will promote wheat growth, but levels above some thresholds will adversely affect wheat growth [22,36]. The total nitrogen uptake for the low water–high fertilizer treatment (W1F3) decreased by 26.69% and for the high water–high fertilizer treatment (W3F3) decreased by 10.24% when compared with the medium water–high fertilizer treatment W2F3; obvious nitrogen stress was observed. Excessive nitrogen application led to poor root growth and did not supply the required nutrients and water to the aboveground part of the plants. Nitrogen uptake and accumulation by wheat in high water treatments was greater than in wheat in low fertilizer treatments because frequent irrigation resulted in water infiltrating easily transportable nitrate nitrogen into deep soil [37], which reduced soil nitrogen content in the wheat root zone.
In the low and medium fertilizer treatments, overirrigation or underirrigation does not promote increased nitrogen accumulation in wheat. Underirrigation causes drought effects, which constrain crop root growth and cause crop roots to wither easily [38]. Overirrigation greatly decreases soil air and reduces the activity of aerobic soil microorganisms, and resultant root damage reduces root growth and absorption [39]. We found that ammonium nitrogen absorption by winter wheat roots accounted for 8–13% of the total root nitrogen absorption. In a paddy field experiment [40], ammonium nitrogen absorption accounted for 60% of total root nitrogen absorption due to the high soil water content in the paddy field. In a plastic film mulch with a hole irrigation experiment [41], ammonium nitrogen absorption accounted for >47% of total root nitrogen absorption. The plastic mulch was in contact with the soil surface and inhibited oxygen in the air from entering the soil. In turn, less oxygen in the soil inhibits the nitrification of ammonium nitrogen. Wide ridge furrow irrigation, as used in our experiment, is a form of furrow irrigation in which the ridge soil layer is loose, and atmospheric oxygen can, therefore, easily enter the soil. In low water treatments, an appropriate nitrogen application quantity promotes wheat root growth, increases root area available for absorption, fosters root activity, reduces damage to cell membranes, and alleviates the adverse effects of water deficit. We found that excessive nitrogen application slightly affected drought resistance, and it has been found to have negative effects [42,43].

5. Conclusions

(1) The coefficients of determination for model verification of soil moisture content, ammonium nitrogen, and nitrate nitrogen were, respectively, >0.81, >0.68, and >0.73. The calibrated HYDRUS-2D model can be used to accurately simulate soil water and nitrogen transport. Parameter accuracy met the study requirements, and the model calibration and verification results were acceptable.
(2) The rate-determined HYDRUS case can better simulate the nitrogen balance of winter wheat during the whole reproductive period. Analysis of nitrogen balance showed that denitrification was the main pathway of nitrogen loss in winter wheat; gaseous loss for each treatment accounted for 7.01–38.2% of its nitrogen form. The total amount of ammonium nitrogen absorbed by winter wheat roots for each treatment was only 7.6–15.1% of the total amount of nitrate nitrogen absorbed. The maximum nitrogen uptake was 155.53 kg/ha with a yield of 6888.67 kg/ha in the medium water–fertilizer treatment W2F2. Both water and N application and the interaction between them had highly significant effects on AE, PE, UE, and PFP in winter wheat. The UE of the W2F2 treatment was relatively high, the PFP of the W3F1 treatment was relatively high, and the nitrogen use efficiency of the W1F3 treatment was the lowest overall.

Author Contributions

S.W. wrote and revised the manuscript; T.L. analyzed the data; J.Y. revised the manuscript; C.W. oversaw data visualization; H.Z. collected and organized data. All authors have read and agreed to the published version of the manuscript.

Funding

This research was funded by the General Project of National Natural Science Foundation of China, No. 52079051, the Key Scientific Research Project of Colleges and Universities in Henan Province, China, No. 22A570004 and 23A570006, the Fund of Innovative Education Program for Graduate Students at North China University of Water Resources and Electric Power, China, No. YK-2021-34.

Data Availability Statement

The data presented in this study are available on request from the corresponding author.

Acknowledgments

We fully appreciate the editors and all anonymous reviewers for their constructive comments on this manuscript.

Conflicts of Interest

The authors declare no conflict of interest.

References

  1. Ines, A.V.M.; Gupta, A.D.; Loof, R. Application of GIS and crop growth models in estimating water productivity. Agric. Water Manag. 2002, 54, 205–225. [Google Scholar] [CrossRef]
  2. Xu, B.W.; Niu, Y.R.; Zhang, Y.N.; Chen, Z.F.; Zhang, L. China’s agricultural non-point source pollution and green growth: Interaction and spatial spillover. Environ. Sci. Pollut. Res. 2022, 29, 60278–60288. [Google Scholar] [CrossRef]
  3. Sebilo, M.; Mayer, B.; Nicolardot, B.; Mariotti, A. Long-term fate of nitrate fertilizer in agricultural soils. Proc. Natl. Acad. Sci. USA 2013, 110, 18185–18189. [Google Scholar] [CrossRef] [PubMed]
  4. Bai, J.; Ye, X.; Zhi, Y.; Gao, H.; Huang, L.; Xiao, R.; Shao, H. Nitrate–nitrogen transport in horizontal soil columns of the Yellow River Delta wetland, China. CLEAN Soil Air Water. 2012, 40, 1106–1110. [Google Scholar] [CrossRef]
  5. Fronczyk, J.; Sieczka, A.; Lech, M.; Radziemska, M.; Lechowicz, Z. Transport of nitrogen compounds through subsoils in agricultural areas: Column tests. Pol. J. Environ. Stud. 2016, 25, 1505–1514. [Google Scholar] [CrossRef]
  6. Pan, W.Y.; Huang, Q.Z.; Xu, Z.H.; Pang, G.B. Experimental investigation and simulation of nitrogen transport in a subsurface infiltration system under saturated and unsaturated conditions. J. Contam. Hydrol. 2020, 231, 103621. [Google Scholar] [CrossRef]
  7. Ali, A.; Bennett, J.M.; Biggs, A.A.J.; Marchuk, A.; Ghahramani, A. Assessing the hydraulic reduction performance of HYDRUS-1D for application of alkaline irrigation in variably-saturated soils: Validation of pH driven hydraulic reduction scaling factors. Agric. Water Manag. 2021, 256, 107101. [Google Scholar] [CrossRef]
  8. Mekala, C.; Nambi, I.M. Understanding the hydrologic control of N cycle: Effect of water filled pore space on heterotrophic nitrification, denitrification and dissimilatory nitrate reduction to ammonium mechanisms in unsaturated soils. J. Contam. Hydrol. 2017, 202, 11–22. [Google Scholar]
  9. Martin del Campo, M.A.; Esteller, M.V.; Morell, I.; Expósito, J.L.; Bandenay, G.L.; Morales-Casique, E. Effect of organic matter and hydrogel application on nitrate leaching in a turfgrass crop: A simulation study using Hydrus. J. Soils Sediments 2021, 21, 1190–1205. [Google Scholar] [CrossRef]
  10. Han, H.; Gao, R.; Cui, Y.; Gu, S. Transport and transformation of water and nitrogen under different irrigation modes and urea application regimes in paddy fields. Agric. Water Manag. 2021, 255, 107024. [Google Scholar] [CrossRef]
  11. Mehrabi, F.; Sepaskhah, A.R. Soil drainage water and nutrient leaching in winter wheat field lysimeters under different management practices. Int. J. Plant Prod. 2021, 15, 13–28. [Google Scholar] [CrossRef]
  12. Li, M.Y.; Hu, T.T.; Cui, X.L.; Luo, L.L.; Lu, J.S. Comprehensive effects of irrigation water and nitrogen levels for controlled release fertilizer with different release periods on winter wheat yield. Trans. Chin. Soc. Agric. Eng. 2020, 36, 153–161. [Google Scholar]
  13. Gu, S.W.; Gao, J.M.; Deng, Z.; Lv, M.C.; Liu, J.Y.; Zong, J.; Qin, J.T.; Fan, X.C. Effects of border irrigation and fertilization timing on soil nitrate nitrogen distribution and winter wheat yield. Trans. Chin. Soc. Agric. Eng. 2020, 36, 134–142. [Google Scholar]
  14. Li, H.R.; Hao, W.P.; Mei, X.R.; Guo, R. Effect of different irrigation and fertilization managements on N2O emissions and yeild in summer maize-winter wheat field. Trans. Chin. Soc. Agric. Eng. 2018, 34, 103–112. [Google Scholar]
  15. Karandish, F.; Šimůnek, J. A comparison of the HYDRUS (2D/3D) and SALTMED models to investigate the influence of various water-saving irrigation strategies on the maize water footprint. Agric. Water Manag. 2019, 213, 809–820. [Google Scholar] [CrossRef]
  16. Sharmiladevi, R.; Ravikumar, V. Simulation of nitrogen fertigation schedule for drip irrigated paddy. Agric. Water Manag. 2021, 252, 106841. [Google Scholar] [CrossRef]
  17. Jia, Y.; Gao, W.; Sun, X.; Feng, Y. Simulation of Soil Water and Salt Balance in Three Water-Saving Irrigation Technologies with HYDRUS-2D. Agronomy 2023, 13, 164. [Google Scholar] [CrossRef]
  18. Clément, C.C.; Cambouris, A.N.; Ziadi, N.; Zebarth, B.J.; Karam, A. Potato Yield Response and Seasonal Nitrate Leaching as Influenced by Nitrogen Management. Agronomy 2021, 11, 2055. [Google Scholar] [CrossRef]
  19. Wang, X.; Huang, G.; Yang, J.; Huang, Q.; Liu, H.; Yu, L. An assessment of irrigation practices: Sprinkler irrigation of winter wheat in the North China plain. Agric. Water Manag. 2015, 159, 197–208. [Google Scholar] [CrossRef]
  20. Wang, S.S. Research on the Specification Parameters and Crop Water Demand Characteristics of Integrated Ridge Farming and Furrow Irrigation. Ph.D. Thesis, Xi’an University of Technology, Xi’an, China, 2013. [Google Scholar]
  21. Noor, H.; Wang, Q.; Sun, M.; Fida, N. Effects of sowing methods and nitrogen rates on photosynthetic characteristics, yield and quality of winter wheat. Photosynthetica 2021, 59, 277–285. [Google Scholar] [CrossRef]
  22. Zhang, Y.; Wang, J.; Gong, S.; Xu, D.; Sui, J. Nitrogen fertigation effect on photosynthesis, grain yield and water use efficiency of winter wheat. Agric. Water Manag. 2017, 179, 277–287. [Google Scholar] [CrossRef]
  23. Richards, L.A. Capillary Conduction of liquids through porous mediums. Physics 1931, 1, 318–333. [Google Scholar] [CrossRef]
  24. Simunek, J.; Sejna, M.; Van Genuchten, M.T. HYDRUS-2D Simulating Water Flow, Heat, and Solute Transport in Two-Dimensional Variably Saturated Media; International Ground Water Modeling Center: Riverside, CA, USA, 1999. [Google Scholar]
  25. Hanson, B.R.; Šimůnek, J.; Hopmans, J.W. Evaluation of urea–ammonium–nitrate fertigation with drip irrigation using numerical modeling. Agric. Water Manag. 2006, 86, 102–113. [Google Scholar] [CrossRef]
  26. Biao, B.; Qian, Y.K.; Ai, X.F.; Zhao, T.N. Sensitivity analysis of VG model parameters under rainfall infiltration conditions based on HYDRUS-1D simulation. J. Yangtze River Acad. Sci. 2021, 38, 36–41. [Google Scholar]
  27. Li, B. Experiment and Simulation Study on Soil Water Movement and Nitrogen Transport in Wide Ridge and Furrow Irrigation. Master’s Thesis, North China University of Water Resources and Electric Power, Zhengzhou, China, 2019. [Google Scholar]
  28. Phogat, V.; Mahadevan, M.; Skewes, M.; Cox, J.W. Modelling soil water and salt dynamics under pulsed and continuous surface drip irrigation of almond and implications of system design. Irrig. Sci. 2012, 30, 315–333. [Google Scholar] [CrossRef]
  29. Siyal, A.A.; Bristow, K.L.; Šimůnek, J. Minimizing nitrogen leaching from furrow irrigation through novel fertilizer placement and soil surface management strategies. Agric. Water Manag. 2012, 115, 242–251. [Google Scholar] [CrossRef]
  30. Beven, K.J.; Henderson, D.E.; Reeves, A.D. Dispersion parameters for undisturbed partially saturated soil. J. Hydrol. 1993, 43, 9–43. [Google Scholar] [CrossRef]
  31. Feng, Z.Z.; Shi, H.B.; Miao, Q.F.; Sun, W.; Liu, M.H.; Dai, L.P. Analysis of water use of cultivated land in typical sand layers in Hetao Irrigation Area based on HYDRUS-1D model. Trans. Chin. Soc. Agric. Eng. 2021, 37, 90–99. [Google Scholar]
  32. Sun, X.Y.; Tong, J.X.; Liu, C.; Ma, Y.B. Using HYDRUS-2D model to simulate the water flow and nitrogen transport in a paddy field with traditional flooded irrigation. Environ. Sci. Pollut. Res. 2022, 29, 32894–32912. [Google Scholar] [CrossRef]
  33. Nie, S.Y. Simulation on Water and Nitrogen Transport of Saline-alkali Vadose Zone in Western of Jilin Province. Ph.D. Thesis, Jilin University, Changchun, China, 2018. [Google Scholar]
  34. Feng, C. Research of Soil Hydraulic Properties and Nitrogen Conversion Parameters under the Couple of Water-Temperature-Nitrogen. Master’s Thesis, Taiyuan University of Technology, Taiyuan, China, 2017. [Google Scholar]
  35. Wu, X.B.; Bai, M.J.; Li, Y.N.; Du, T.S.; Zhang, S.H.; Shi, Y. Effects of water and fertilizer coupling on root growth and soil water and nitrogen distribution of cabbage under drip irrigation under film. Trans. Chin. Soc. Agric. Eng. 2019, 35, 110–119. [Google Scholar]
  36. Si, Z.; Zain, M.; Mehmood, F.; Wang, G.; Gao, Y.; Duan, A. Effects of nitrogen application rate and irrigation regime on growth, yield, and water-nitrogen use efficiency of drip-irrigated winter wheat in the North China Plain. Agric. Water Manag. 2020, 231, 106002. [Google Scholar] [CrossRef]
  37. Wang, J.Y. Effects of Tillage and Fertilization on Soil Nitrogen Leaching and Root Growth in Rice-wheat Rotation Area. Master’s Thesis, Chinese Academy of Agricultural Sciences, Beijing, China, 2021. [Google Scholar]
  38. Loboda, T. Gas exchange and growth of triticale seedlings under different nitrogen supply and water stress. J. Plant Nutr. 2010, 33, 371–380. [Google Scholar] [CrossRef]
  39. Li, S.H. Effects of Different Moisture on Nitrogen Transformation, Functional Genes and Microorganisms in Black Soil. Master’s Thesis, Dalian Jiaotong University, Dalian, China, 2019. [Google Scholar]
  40. Tan, X.; Shao, D.; Liu, H.; Sun, C. Experiment and simulation of water and nitrogen balance in paddy fields under water-saving irrigation and controlled drainage conditions. Trans. Chin. Soc. Agric. Eng. 2011, 27, 193–198. [Google Scholar]
  41. Chen, L. Study on the Transport and Transformation Characteristics of Soil Water and Nitrogen and Crop Coupling Effect under Film-hole Irrigation. Ph.D. Thesis, Xi’an University of Technology, Xi’an, China, 2021. [Google Scholar]
  42. Cai, J.; Jiang, D.; Wollenweber, B.; Dai, T.; Cao, W. Effects of nitrogen application rate on dry matter redistribution, grain yield, nitrogen use efficiency and photosynthesis in malting barley. Acta Agric. Scand. Sect. B Soil Plant Sci. 2012, 62, 410–419. [Google Scholar] [CrossRef]
  43. Chen, Y.T.; Wei, Z.H.; Wan, H.; Zhang, J.R.; Liu, J.; Liu, F.L. CO2 Elevation and Nitrogen Supply Alter the Growth and Physiological Responses of Tomato and Barley Plants to Drought Stress. Agronomy 2022, 12, 1821. [Google Scholar] [CrossRef]
Figure 1. Location of the test area.
Agronomy 13 00457 g001
Figure 2. Post-reviving rainfall in 2021 and 2022.
Agronomy 13 00457 g002
Figure 3. Boundaries of soil water and nitrogen transport model.
Agronomy 13 00457 g003
Figure 4. Comparison between simulated and measured values of vertical water content, ammonium nitrogen, and nitrate nitrogen in 2022.
Agronomy 13 00457 g004aAgronomy 13 00457 g004b
Figure 5. Comparison between simulated and measured values of horizontal water content, ammonium nitrogen, and nitrate nitrogen in 2022.
Agronomy 13 00457 g005
Figure 6. The nitrogen use efficiency of winter wheat. Note: solid line readings are based on the primary vertical coordinate (left), dashed line readings are based on the secondary vertical coordinate (right).
Agronomy 13 00457 g006
Table 1. Basic physical properties and physicochemical parameters of soil.
Soil Depth (cm)Soil TypeSoil Characteristic ParametersParticle Size Composition (%)Physicochemical Parameters of the Tested Soil
Dry Bulk Density of Soil (g/cm3)Field
Capacity (%)
Soil
Organic Matter (%)
Average Total Nitrogen
Content (%)
<0.0020.002–0.020.02–2Ammonium Nitrogen (mg/kg)Nitrate Nitrogen (mg/kg)
0–20Loam1.45340.870.05743539.488.62
20–40Silty loam1.47320.860.05744498.244.67
40–60Silty loam1.48300.830.046454911.656.05
60–80Silty loam1.5290.780.04643517.744.81
80–100Silty loam1.46280.560.03212869.578.18
Note: water content in the table is by volume.
Table 2. Different water and fertilizer treatments for winter wheat.
TreatmentIrrigation Lower LimitIrrigation Water (mm)Number of Top
Dressing Applications
Nitrogen Application Rate (kg/ha)
Ground FertilizerJointing StageDate of Ear EmergenceGrand Total
W1F160% θfield9025532.532.5120
W1F282.582.5220
W1F3132.5132.5320
W2F170% θfield18032.532.5120
W2F282.582.5220
W2F3132.5132.5320
W3F180% θfield24032.532.5120
W3F282.582.5220
W3F3132.5132.5320
Note: water content in the table is by volume.
Table 3. Water absorption parameters of winter wheat roots.
Parameter NameP0 (cm)P0Pt (cm)P2H (cm/day)P2L (cm)P3 (cm)r2h (cm/day)r2L (cm/day)
Numerical value0−1−500−900−16,0000.50.1
Table 4. Parameters of the V-G model under the fertilizer (NH4NO3) infiltration.
θr (cm3/cm3)θs (cm3/cm3)α (cm−1)nKs (cm/day)R2
Initial valueTreatmentSoil depth0.03240.37850.02531.479333.20.92
0.38150.02461.437625.30.98
0.39270.02311.456329.40.97
0.37210.01581.523936.60.94
0.38650.01931.627125.40.93
Optimized valueW2F10–200.37850.01531.329336.20.95
20–400.38150.01461.237626.60.93
40–600.39270.01511.456330.70.94
60–800.37210.01581.323935.40.92
80–1000.38650.01631.227124.60.9
W2F20–200.38320.01431.353137.70.94
20–400.38950.01341.278629.80.92
40–600.40320.01391.495732.10.91
60–800.38370.01471.385433.90.9
80–1000.38430.01391.129523.20.9
W2F30–200.38910.01351.383539.70.92
20–400.39370.01271.314531.50.93
40–600.41540.01311.505433.80.93
60–800.37740.01491.306729.40.89
80–1000.38350.01581.217431.80.91
Table 5. Parameters of the V-G model with fertilizer (NH4NO3) infiltration.
TreatmentSoil Depth
(cm)
DL
(cm)
μ w , u r e a
(/day)
Kd
(cm3/mg)
μ w , N H 4 +
(/day)
μ w , N H 4 +
(/day)
μ s , N H 4 +
(/day)
μ w , N O 3
(/day)
μ s , N O 3
(/day)
γ w , N H 4 +
(mg/cm3/day)
γ s , N H 4 +
(mg/cm3/day)
Initial value20100.560.00320.020.20.20.040.043 × 10−53 × 10−5
40100.550.00350.0250.30.30.030.037 × 10−57 × 10−5
60100.540.00350.030.260.260.030.035 × 10−65 × 10−6
80100.580.00320.0280.270.270.040.044 × 10−64 × 10−6
100100.570.00370.370.360.360.050.053 × 10−63 × 10−6
Value ranges0–1000.3–0.80.003–0.0040.02–0.050.01–0.680.02–0.720.01–0.240.02–0.241 × 10⁻⁶–8 × 10−51 × 10−6–8 × 10⁻⁵
Optimized valueW2F10–200.470.00320.030.260.260.020.021 × 10−51 × 10−5
20–400.430.00350.0250.340.340.030.031 × 10−51 × 10−5
40–600.490.00360.0330.270.270.020.021 × 10−51 × 10−5
60–800.480.00360.0380.370.370.020.024 × 10−64 × 10−6
80–1000.470.00350.370.260.260.010.018 × 10−68 × 10−6
W2F20–200.560.00320.0230.250.250.040.047 × 10−67 × 10−6
2–400.550.00350.0270.330.330.050.056 × 10−66 × 10−6
40–600.540.00350.0350.360.360.030.032 × 10−62 × 10−6
60–800.580.00310.0380.260.260.010.011 × 10−61 × 10−6
80–1000.570.00320.0330.310.310.010.012 × 10−62 × 10−6
W2F30–200.580.00320.0260.240.240.050.053 × 10−63 × 10−6
20–400.600.00350.0290.320.320.070.072 × 10−62 × 10−6
40–600.62/0.00330.0310.30.30.040.041 × 10−61 × 10−6
60–800.580.00320.0290.280.280.020.021 × 10−51 × 10−6
80–1000.570.00370.0340.340.340.030.031 × 10−61 × 10−6
Table 6. Error analysis of the measured and predicted values of soil volumetric water content, ammonium nitrogen, and nitrate nitrogen.
DirectionTreatmentClassificationMAERMSER2
PerpendicularW3F1Moisture content0.0070.0070.811
Ammonium nitrogen0.0030.0030.7084
Nitrate nitrogen0.0110.0120.7577
W3F2Moisture content0.010.0090.8147
Ammonium nitrogen0.0070.0090.7245
Nitrate nitrogen0.0510.0540.744
W3F3Moisture content0.0060.0050.8377
Ammonium nitrogen0.0080.0230.6818
Nitrate nitrogen0.0520.0640.7718
LevelW3F1Moisture content0.0110.01060.832
Ammonium nitrogen0.0070.0250.6918
Nitrate nitrogen0.0080.0180.7353
W3F2Moisture content0.0120.0110.8681
Ammonium nitrogen0.0090.0340.7125
Nitrate nitrogen0.0350.0520.7871
W3F3Moisture content0.0080.0080.8377
Ammonium nitrogen0.0210.0490.6889
Nitrate nitrogen0.060.0970.7844
Table 7. HYDRUS-2D case predictions of nitrogen balance and measured yield.
Water–Fertilizer TreatmentW1F1W1F2W1F3W2F1W2F2W2F3W3F1W3F2W3F3
Ammonium nitrogen (kg/ha)
Nitrogen application rate65.00165.00265.0065.00165.00265.0065.00165.00265.00
Urea nitrogen hydrolysis43.03114.62209.6338.62124.72208.3542.74112.09207.59
Mineralization reaction and biological fixation59.4946.2713.2269.4162.6433.0566.1046.2733.05
Ammonia volatilization0.833.055.570.862.776.390.932.876.28
Nitration89.75134.31188.8193.25163.96217.10100.78136.78213.97
Root absorption amount8.9117.7015.0910.8413.6517.596.7816.2214.01
Soil accumulation3.035.8213.383.076.990.330.342.496.38
Nitrate nitrogen (kg/ha)
Denitrification reaction6.3315.6163.207.6920.4075.147.0726.2681.74
Root absorption amount81.59118.58107.6783.93141.88136.2292.59107.02127.07
Soil accumulation1.830.1317.941.641.675.741.123.505.16
Total nitrogen uptake90.50136.28122.7694.76155.53153.8099.37123.25141.08
Total nitrogen (g/ha)56.2101.2478.6266.93145.09128.5965.44116.8126.31
Yield (kg/ha)5860.676070.335953.006121.336888.676431.005876.676361.336590.00
Disclaimer/Publisher’s Note: The statements, opinions and data contained in all publications are solely those of the individual author(s) and contributor(s) and not of MDPI and/or the editor(s). MDPI and/or the editor(s) disclaim responsibility for any injury to people or property resulting from any ideas, methods, instructions or products referred to in the content.

