Article

Non-Thermal Plasma-Activated Water: A Cytogenotoxic Potential on Triticum aestivum

1
Department of Plant Science, “Ion Ionescu de la Brad” Iasi University of Life Sciences, 3 Mihail Sadoveanu Al., 700490 Iasi, Romania
2
Faculty of Electrical Engineering, “Gheorghe Asachi” Technical University of Iaşi, 67 D. Mangeron Bd., 700050 Iasi, Romania
3
Department of Horticultural Technologies, “Ion Ionescu de la Brad” Iasi University of Life Sciences, 3 Mihail Sadoveanu Al., 700490 Iasi, Romania
4
Department of Sciences, “Ion Ionescu de la Brad” Iasi University of Life Sciences, 3 Mihail Sadoveanu Al., 700490 Iasi, Romania
*
Authors to whom correspondence should be addressed.
Agronomy 2023, 13(2), 459; https://doi.org/10.3390/agronomy13020459
Submission received: 12 December 2022 / Revised: 26 January 2023 / Accepted: 31 January 2023 / Published: 3 February 2023

Abstract

:
Non-thermal plasma-activated water (PAW) is used in agriculture to decontaminate the seed/grains surface, with possible positive effects on physiological processes. In the present study, PAW was generated in ambient air at atmospheric pressure in eight variants with pH and different doses of reactive species (H2O2, NO3). We explored the indirect effect of PAW on wheat grains while focusing on genetic material by cytogenetic monitoring. All PAW variants caused clastogenic and aneugenic events of the genetic material, with different intensities, in a dose-dependent manner of reactive species in plasma composition. PAW with the highest doses of H2O2 (13–22 mg/L) and NO3 (49–68 mg/L) at pH 3.8–4.1 decreased the mitotic index the most and induced the most frequent genetic abnormalities, out of which chromosomal bridges and micronuclei were dominant. In correlation with this damage at the nucleus level, the germination rate and root and shoot length of wheat sprouts decreased significantly only in the variants with the highest doses of reactive species. PAW with the lowest doses of H2O2 (1–5 mg/L) and NO3 (8–15 mg/L) at pH 5.5–5.1 induced a much lower cytogenotoxic potential, maintained a germination rate comparable to the control and even significantly stimulated root and shoot length growth. Thus, the effects of PAW depend highly on the dose of reactive species and on pH.

1. Introduction

The non-thermal plasma technology has been proven to have a multitude of applications in agriculture, food processing, medicine and many others. The plasma-activated water (PAW) has been proven to increase the bioactive compounds in Triticum aestivum wheat sprouts [1].
From a physical–chemical point of view, plasma is a partially ionised gas containing various reactive species such as electrons, positive and negative ions, free radicals, gas atoms and chemical reactive molecules. Based on the thermodynamic equilibrium of the constituents’ temperature, plasma can be thermal or hot plasma (TP) and non-thermal (NTP) or cold plasma. Non-thermal plasmas are characterized by the fact that the temperature of heavy species (neutral particles and ions) is close to room temperature (25–100 °C). The NTP used to generate plasma-activated water (PAW) for applications in agriculture is produced in environmental conditions (atmospheric pressure) by a pulsed electrical discharge in reactors with very different geometries. The NTP in contact with water sprayed into the plasma zone generates electrochemical reactive species in water droples. The PAW has a wide application in the above-mentioned fields. In this case, PAW is applied by sprinkling on seeds/grains or on other surfaces immediately after its production, as direct treatment [2]. PAW can be applied on seeds/grains a few hours after generation and can be stored in glass containers as indirect treatment. In this case, the PAW reaches the surface or the root of the plants by means of an intermediate tool (pipette, glass) [3].
PAW properties focus on reactive oxydative species (ROS) and nitrogen reactive species (RNS), pH change, redox potential and conductivity [4]. The non-thermal plasma is generated by electrical discharges in a gas–water mixture, inducing a series of neutral and charged reactive species. The main reactive species produced in PAW are dominated by reactive hydrogen peroxide (H2O2) species responsible for antimicrobial properties and RNS which can act as a nitrogen supply for the wheat sprouts [4,5,6,7]. It has been shown that the bacterial inactivation rate is higher with direct PAW treatments compared to indirect treatments [5]. Reactive nitrogen species in the PAW solution are most often found to be nitrite (NO3) and nitrate (NO2) ions, which, in combination with H2O2, contribute to the bactericidal capacity of PAW treatments [8]. According to Traylor [9], nitrates persist in the PAW solution and would be responsible for the extensive biological effects of PAW. In certain combinations with water, reactive oxygen and nitrogen species in PAW can significantly influence plant growth [10,11]. An important parameter of PAW is the pH, which is usually acidic and decreases the more the treatment time increases due to the formation of strong acids [12]. The source of acidification of the PAW solution is nitric acid formed from reactive nitrogen species [13]. In principle, the pH values of PAW depend on the reactor and the nature of the gas used for plasma generation.
The multiple experimental configurations of the plasma generator reactor allow for the development of a wide range of cold plasma production techniques. The most widely used techniques in the production of non-thermal plasma for agriculture are atmospheric pressure plasma sources (jets, dielectric barrier discharges, corona and spark discharges) [14,15,16].
Non-thermal plasma in contact with various liquid media is an increasingly studied subject in the field of plasma technology due to the generation of reactive oxygen species (ROS) and nitrogen (RNS) [17], which are widely used in applications such as medicine [18], the environment [19,20] and the agriculture or food industry [21]. The use of PAW in agriculture has shaped an interdisciplinary microfield—plasma agriculture, which is gaining more and more interest lately [22,23]. PAW applications in agriculture mainly focus on seed treatment, leading to increased pathogen resistance, more efficient germination and a better seedling growth [14]. Most of the research on PAW applications in agriculture reports only positive results. Given the errors in optimizing PAW treatment conditions, it is encouraged that negative results are also published to know what does not work when performing PAW treatments, to move towards standardization and to clarify fundamental, molecular-level aspects of PAW interaction with biological material [24]. Some research has reported DNA damage in non-thermal plasma-treated plants, mainly caused by reactive hydrogen peroxide species, which readily penetrate the cell membrane and reach the DNA, causing fatal damage [25]. ROS are also factors that alter gene expression. For example, following the exposure of Arabidopsis seeds to low-pressure oxygen radio frequency plasma irradiation, a decrease in the amount of gene expression was observed in certain DNA regions where methylation occurred due to active oxygen species generated in the oxygen plasma [26]. Other authors have reported that, under certain conditions of the treatment of barley grains with non-thermal plasma, DNA damage occurs, with consequences on grain germination and seedling growth [27]. Other similar cases will be extensively mentioned in the “Discussion” section of this paper.
Despite reports of DNA damage in plant cells treated with non-thermal plasma, there are few studies that extensively address the direct or indirect effects of plasma on plant DNA. Of these, those related to the indirect effects of plasma on plant DNA are even scarcer. In contrast, there are sufficient studies on the damaging effect of non-thermal plasma on bacterial DNA.
In this context, we considered it necessary to conduct specific research focused on the indirect consequences of non-thermal plasma (PAW) on the genetic material of treated plants.
Therefore, the aim of the present study was to investigate the genotoxic effects induced by non-thermal plasma-activated water (PAW) produced by an atmospheric pressure reactor on Triticum aestivum. The objectives of this study included:
(a)
the cytotoxic and genotoxic potential of PAW treatments on wheat sprouts in correlation with the number of reactive species (H2O2, NO3) and the amount of pH in the plasma;
(b)
the germination rate and the length of the embryonic roots and the shoot of wheat sprouts after treatment with PAW;
(c)
the correlation between the genotoxic and cytotoxic potential of PAW and the germination rate, the length of the embryonic root and the length of the shoot of wheat sprouts treated with PAW.

2. Materials and Methods

2.1. Plasma Device and PAW Generation

In this paper, a T-shaped point-to-point NTP reactor was used to obtain plasma-activated water as a source of non-thermal plasma generated in ambient air at atmospheric pressure [28]. The reactor has two ports for water, a gas inlet and a port for the PAW outlet. The point-to-point electrical discharge that generates non-thermal plasma evolves between the electrodes E1 and E2, which are, at the same time, the inlet port for the gas and the outlet port for PAW, respectively. The reactor used to initiate electrochemical reactions in distilled water consists of three cylindrical stainless steel pipe electrodes with an internal diameter of 1 mm, positioned 3 mm apart, as can be observed in Figure 1. The HV electrode E1 and the grounded electrode E2 are connected to a pulse high-voltage power supply (HVPS) consisting of an induction coil controlled by a pulse generator. The water–gas mixture is injected by pump P perpendicularly into the reactor chamber through the third port. The water in the gas flow is atomized; therefore, the interaction between the plasma and the water is enhanced. The PAW is collected at the end of the exit port of the reactor (E2) in an Erlenmeyer vessel.
To obtain different concentrations of NO3 and H2O2, the electrical parameters as well as the water and gas flow rates were varied. The high-voltage source consisted of an induction coil controlled by a rectangular pulse generator that was set at 60, 150 and 250 Hz for a pulse width of 1.5 and 2 ms. The air flow rate (Q air) used to maintain the non-thermal plasma character of the discharge was set at 1 and 2.5 L/min using a flow rate regulator. A digital pump, P, is used to supply distilled water into the reactor under consideration, injecting the liquid at variable flow rates (Q water) of 3, 4, 10, 20, 25 and 85 mL/min, as presented in Table 1.
A digital oscilloscope was used to measure the current and voltage waveforms, using a resistor, RSH, of 100 Ω and a high-voltage probe, HVP, respectively. The H2O2 concentration generated in PAW was assessed through a spectrophotometer method, from a mixture of PAW and titanyl sulfate (TiOSO4) as a reagent. The resulting yellow solution of different intensities indicated the presence of H2O2 in PAW, and the absorbance of the solution was measured at 410 nm by UV-Vis spectrophotometry. The H2O2 measurements’ accuracy was assessed by means of a standard deviation method for tests performed under the same conditions, resulting in a value below 5%. The nitrate concentration was assessed using a PF-3 photometer from a mixture of 5 mL of PAW and 5 drops of NO3 (Visocolor Eco test kit), which were poured into a 10 mL glass test tube. The PAW was applied on the biological material 2 h after the concentrations of NO3 and H2O2 became stabilized. Experimentally, it was concluded that, after 2 h, the NO3 and H2O2 concentrations in PAW do not vary significantly in time.

2.2. Biological Material

In our experiment, we used wheat grains of the Izvor variety, harvested from the Iaşi University of Life Sciences, Romania, as the biological material. We chose wheat grains because Triticum aestivum is an essentially strategic crop, and, on the other hand, it is an excellent plant for testing the influence of various environmental factors.

2.3. Experiment Design

Dry wheat grains were spread on 108 glass Petri dishes, 10 cm in diameter, on sterile filter paper of 78 gm−1. One hundred grains were used per Petri dish. Out of the 108 Petri dishes containing grains, 12 dishes represented the control (C), another 12 represented the experimental variant V1, another 12 represented V2 and so on up to V8. Within each experimental variant, as well as for the control, the 12 Petri dishes were divided into groups of 3 (representing three biological replicates), thus resulting in 4 groups of grain/variant Petri dishes. Thus, each group consisted of 27 grain Petri dishes. Each group of wheat grain Petri dishes included: three dishes for control, three dishes for V1, three dishes for V2, three dishes for V3, three dishes for V4, three dishes for V5, three dishes for V6, three dishes for V7 and three dishes for V8. The four groups of Petri dishes containing wheat grains were needed for different dynamic determinations performed for four time intervals for more than 120 h.
The grains in each Petri dish were watered on the first day with 10 mL of distilled water for the control and 10 mL of PAW for each experimental variant, respectively, using the PAW variants listed in Table 1. Thus, the non-thermal plasma treatments for all experimental variants (V1-V8) were indirect. It should be noted that the PAW samples were kept in bottles at room temperature for 2 h after their production in the reactor. This is consistent with some researchers [29] who recommend that PAW samples should be kept for 1 h to 24 h at room temperature to reduce the concentrations of short-lived reactive oxygen species and reactive nitrogen species prior to seed/grain treatment. Long-lived reactive nitrogen and oxygen species in PAW are reported to be effective for plant growth [29]. According to Shelar [30], indirect plasma treatments (PAW) are weaker and require longer exposure times to achieve results similar to those of direct plasma treatments.For the application of PAW to the wheat grains in the Petri dishes, we used one graduated syringe for each PAW sample and one syringe for distilled water. All Petri dishes with the prepared grains were incubated for 120 h in a plant growth chamber—Sanyo MLR 351H—at 25 °C ± 2 °C and 95% ± 2% humidity, under controlled dark conditions. These climatic conditions were maintained for the first 48 h and then set at 20 °C ± 2 °C and 95% ± 2% humidity, with 16 h of white light with an intensity of 4780 lux alternating with 8 h of darkness/day. These climatic parameters were maintained for the next 72 h. After the first 24 h of culture, the PAW remaining in the dish was removed, and 7 mL/dish of PAW with the same plasma characteristics was added. This operation was repeated every 24 h for 120 h. The amount of PAW required for each round of treatment was prepared daily before use under laboratory conditions. Subsequent determinations were carried out on wheat sprouts for four time intervals, i.e., after 48 h, 72 h, 96 h and 120 h of culture.

2.4. Cytogenetic Parameters

Cytogenetic investigations were performed on meristematic cells from the embryonic tips of 48 h-old wheat root tips. For this purpose, we randomly harvested 50 embryonic roots from 50 sprouts/replicate and from 150 sprouts/variant, respectively, after previously determining the germination rate of the grains as well as the length of the embryonic root and shoot.
For the cytogenetic study, we applied the standard protocol for the detection of genetic material at the nucleus/chromosome level while using the Feulgen squash technique [31,32,33]. For this purpose, 15–17 mm-long embryonic wheat roots of sprouted wheat were fixed in Carnoy’s solution (3:1 v/v, ethanol-glacial acetic acid) for 24 h at 4 °C, hydrolysed for 15 min in 1N HCl at 60 °C to soften the tissue andthen stained with carbol–fuchsin solution (Carr’s reagent) for 24 h at 4 °C. The well-stained tips were removed from the processed embryonic roots and immersed (3–4 tips/slide) in a drop of 45% acetic acid on a slide; then, they were squashed under a cover glass.
For each replication of each experimental variant, we prepared 15 slides, i.e., 45 slides/variant, respectively. At least 500 cells were observed/slide, so approximately 7500 cells were observed/replicate and approximately 22,500 cells/variant, respectively, were counted in different stages of the mitotic division and in the interphase. Each slide was carefully examined on optical microscopes—Oxion and Leica ICC50 (1000× magnification), each of them equipped with a digital camera for image capture (digital photomicrographs).
The mitotic index (MI), the frequency of mitotic phases and the frequency of genetic abnormalities in metaphases, in anaphases + telophases and in interphases were determined. Different types of genetic abnormalities were photographed using the digital camera of the microscope.
To calculate the mitotic index (MI), the formula presented in [34] was applied:
MI (%) = number of dividing cells/total cells (dividing and nondividing) × 100.
A more detailed assessment of the mitotic division under the influence of PAW treatments required the calculation of percentages for each of the four mitotic phases (prophase, metaphase, anaphase, telophase), while using the following formulae:
cells in prophase (%) = number of prophase cells/total cells (dividing and nondividing) × 100;
cells in metaphase (%) = number of metaphase cells/total cells (dividing and nondividing) × 100;
cells in anaphase (%) = number of anaphase cells/total cells (dividing and nondividing) × 100;
cells in telophase (%) = number of telophase cells/total cells (dividing and nondividing) × 100.
The identification of cells affected by genetic abnormalities allowed us to calculate frequencies for: aberrant metaphases, aberrant ana-telophases (A-T) and aberrant interphases by applying the formulae:
cells with chromosomal aberrations in metaphases (%) = number of cells in aberrant metaphases/total cells (dividing and nondividing) × 100;
cells with chromosomal aberrations in A-T (%) = number of cells in aberrant A-T/total cells (dividing and nondividing) × 100;
cells with aberrant interphases (%) = number of cells with aberrant interphases/total cells (dividing and nondividing) × 100.
The genotoxic index (GI) (%) resulted when using the formula:
GI (%) = cells with aberrant metaphases (%) + cells with aberrant A-T (%) + cells with aberrant interphases (%).
The percentage of each type of genetic abnormality detected in aberrant metaphases, aberrant A-T or aberrant interphases was also calculated in relation to the number of cells in the mitotic cycle as follows:
The type of genetic abnormality (%) = number of any kind of genetic abnormality observed/total cells observed ×100.
The experimental data on cytogenetic parameters are presented as the mean ± standard deviation (SD)/replicate/variant.

2.5. Measuring the Germination Rate

The germination rate of wheat grains was determined dynamically every 24 h for four days, i.e., after 48 h, 72 h, 96 h and 120 h of culture. More precisely, the germination rate was determined for each of the three replicates/variant every 24 h. The germination rate was defined as the ratio between the number of germinated seeds and the total number of seeds multiplied by 100 [35].
The formula used to calculate the germination rate for wheat grains is as follows:
Germination rate (%) = germinated grains/total grains × 100
The wheat grain germination rate data were expressed as the mean/replicate/variant ± SD for each time interval of the culture.

2.6. Measurement of the Length of theEmbryonic Root and the Shoot

The length of the embryonic roots and shoots was determined dynamically at the same time intervals as for the determination of germination dynamics, i.e., after 48 h, 72 h, 96 h and 120 h of culture. As the wheat germination process starts with three embryonic roots/grain, we decided to measure the length of the longest root for each wheat sprout. The shoot was measured from the embryonic root base upwards. The root and shoot were measured simultaneously for the same wheat sprout. The embryonic root and shoot lengths were expressed in mm. Biometric measurement data represent the mean/replicate/variant ± SD for each time interval of the culture.

2.7. Correlations between Cytogenetic Parameters and Biometric Parameters

Cytogenetic parameters, i.e., MI and GI, were correlated with biometric parameters, i.e., the germination rate, embryonic root length and embryonic shoot length of wheat sprouts for each time point monitored: after 48 h, 72 h, 96 h and 120 h of the culture. To establish these correlations, the correlation coefficient R2 was calculated. The correlation coefficients were established by using Microsoft Excel from Microsoft Office 2019 Professional Plus.

2.8. Statistical Analysis

The results in triplicate were statistically analyzed by means of IBM SPSS Statistics 21 software, using one-way ANOVA and the Duncan posthoc multiple comparison test (significance level 0.05), and were expressed as the means ± standard deviation. Microsoft Excel was used for the graphic representations.

3. Results

3.1. Cytogenetic Parameters

3.1.1. Mitotic Index and Distribution of Mitotic Phases

A decrease in the mitotic index was observed in PAW treatments with high doses of H2O2 and NO3 and a low pH. Thus, the lowest MI values were recorded at V4 (10.31%), V6 (10.11%) and V8 (12.26%). On the contrary, in PAW treatments with the lowest doses of reactive species and a higher pH, the MI was close to that of the control.
V7 had the highest statistically assured MI (17.70%), but it did not exceed that of the control (Table 2). Of the four mitotic stages, prophase cells were the most abundant in both the control (7.95%) and all the experimental variants (3.50–7.34%).
The most statistically assured metaphases were recorded for the control (4.16%), V7 (4.28%), V3 (4.12%) and V1 (3.53%).
The fewest cells in metaphase were recorded for V4 (1.91%), V2 (2.22%) and V8 (2.33%). The highest statistically assured percentage of cells in anaphase was observed in V7 (3.37%), which exceeded that of the control (2.54%), while V2 (1.16%) had the lowest percentage of anaphase.
The highest number of telophases was recorded for the control (4.34%) and V7 (3.93%) (Table 2).

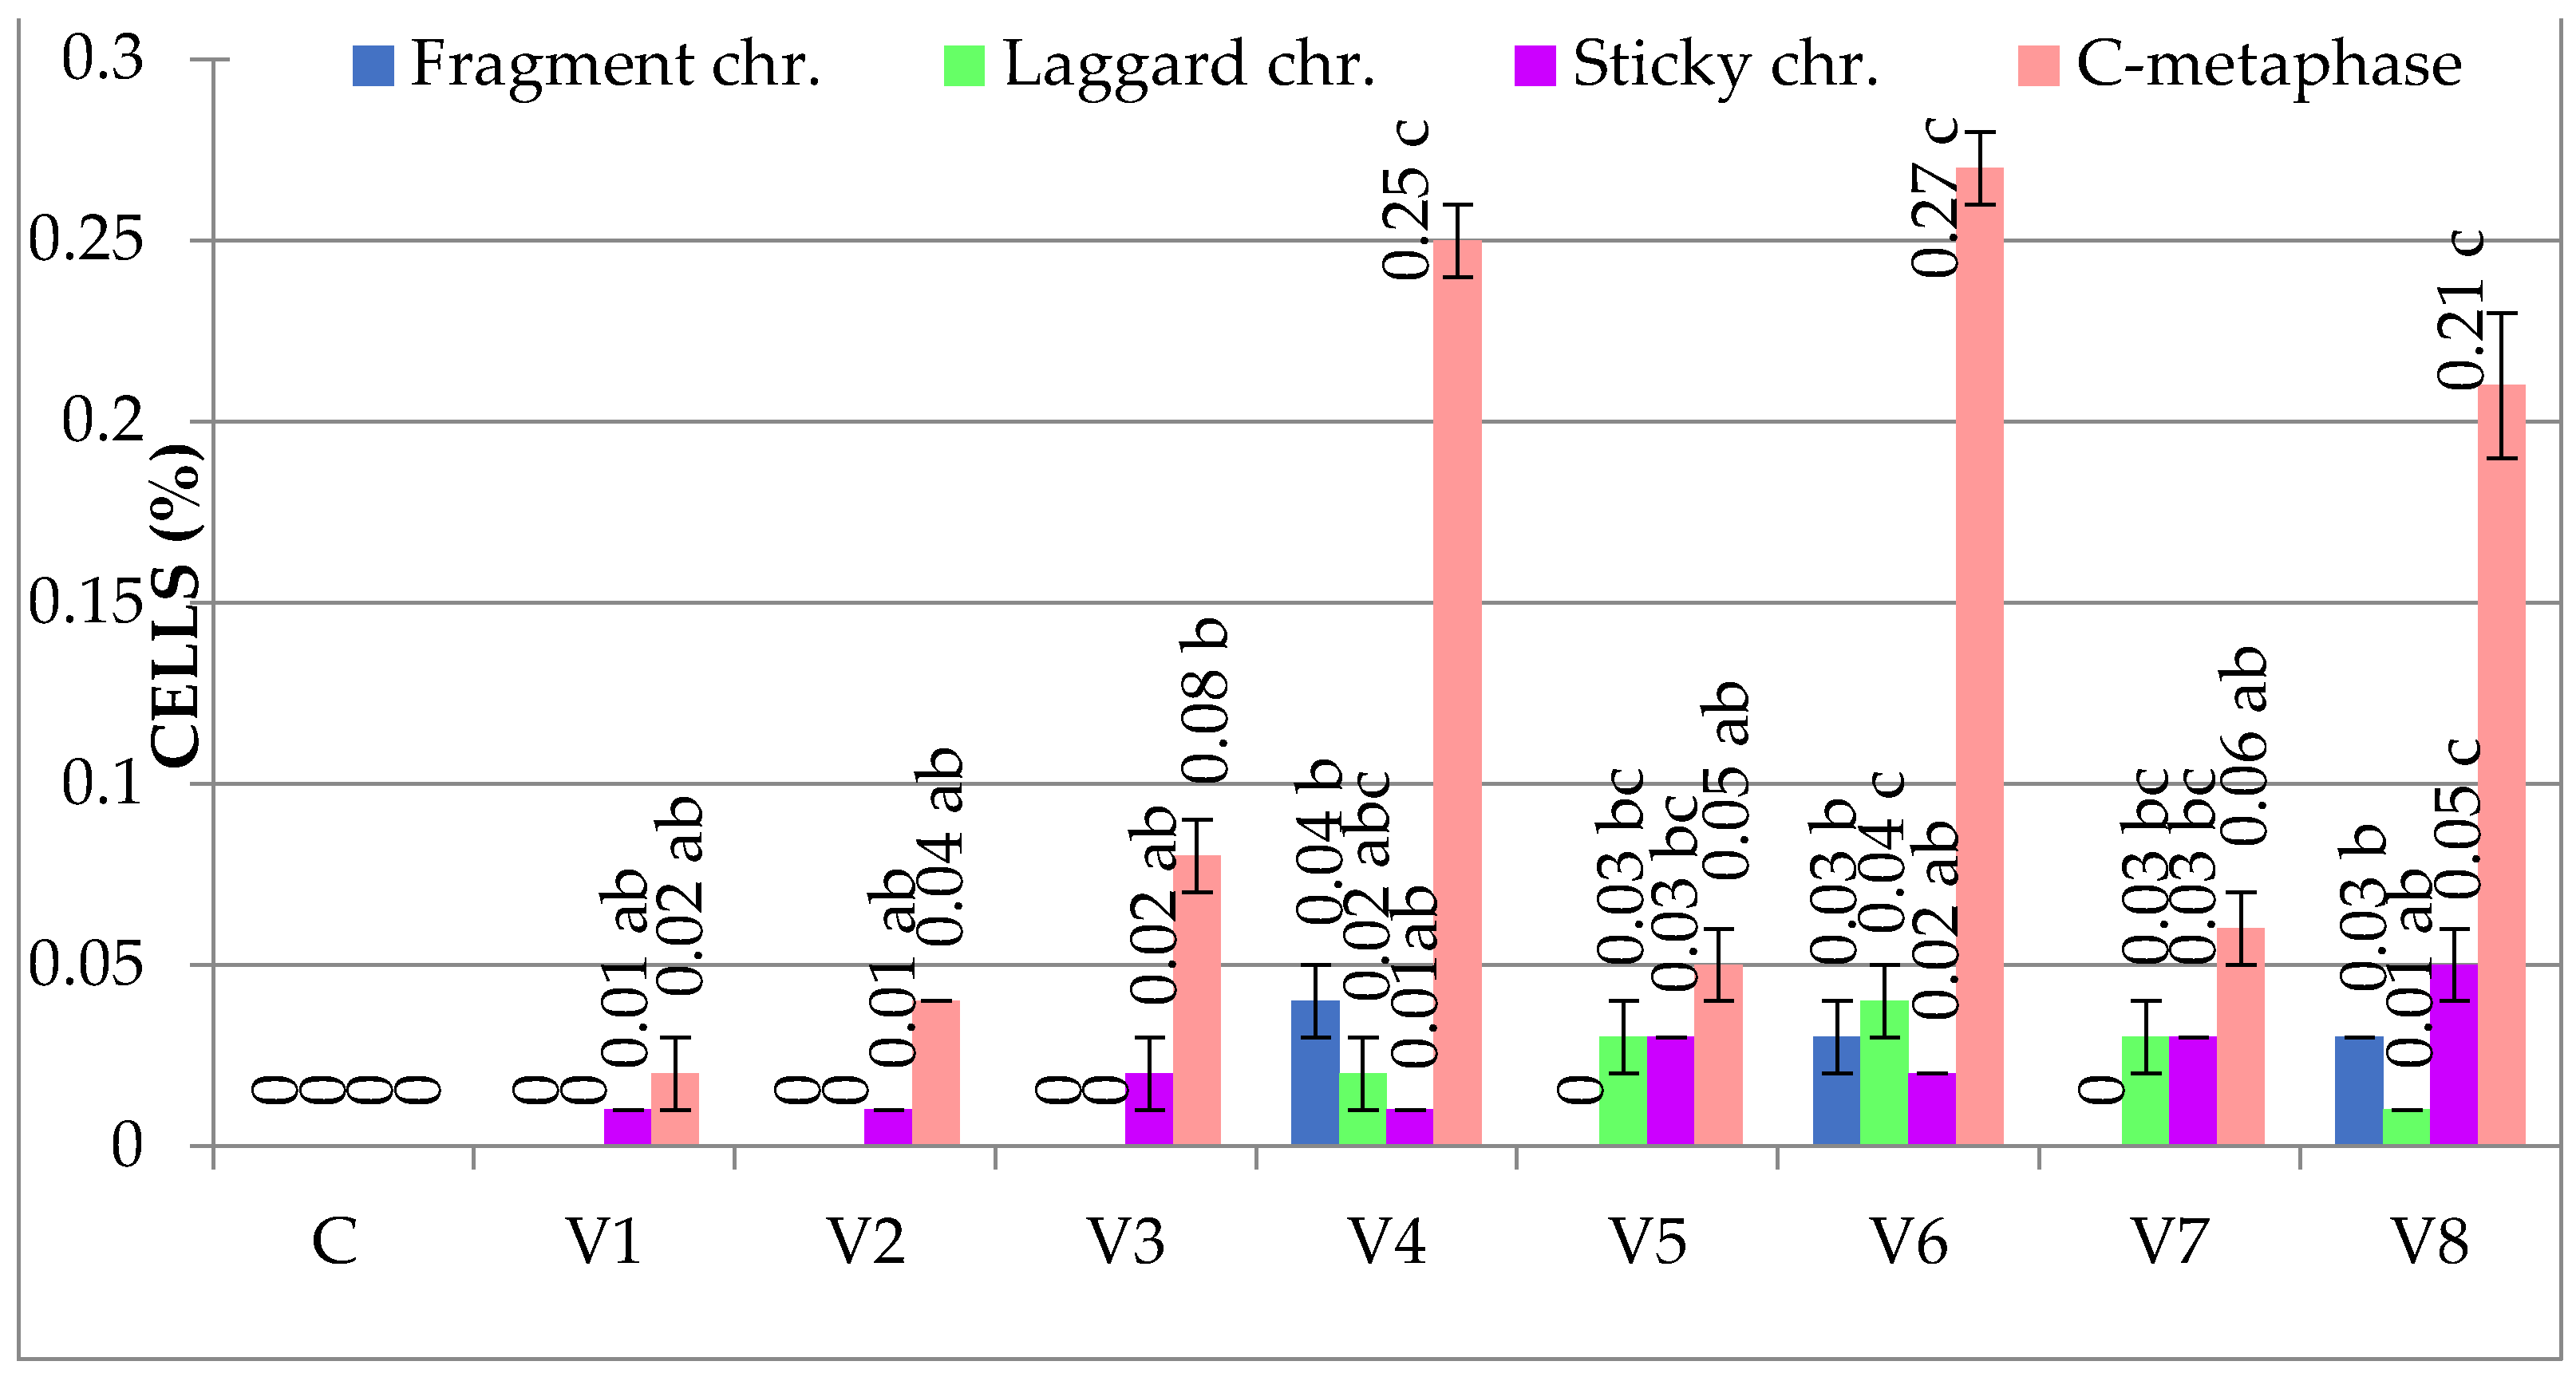
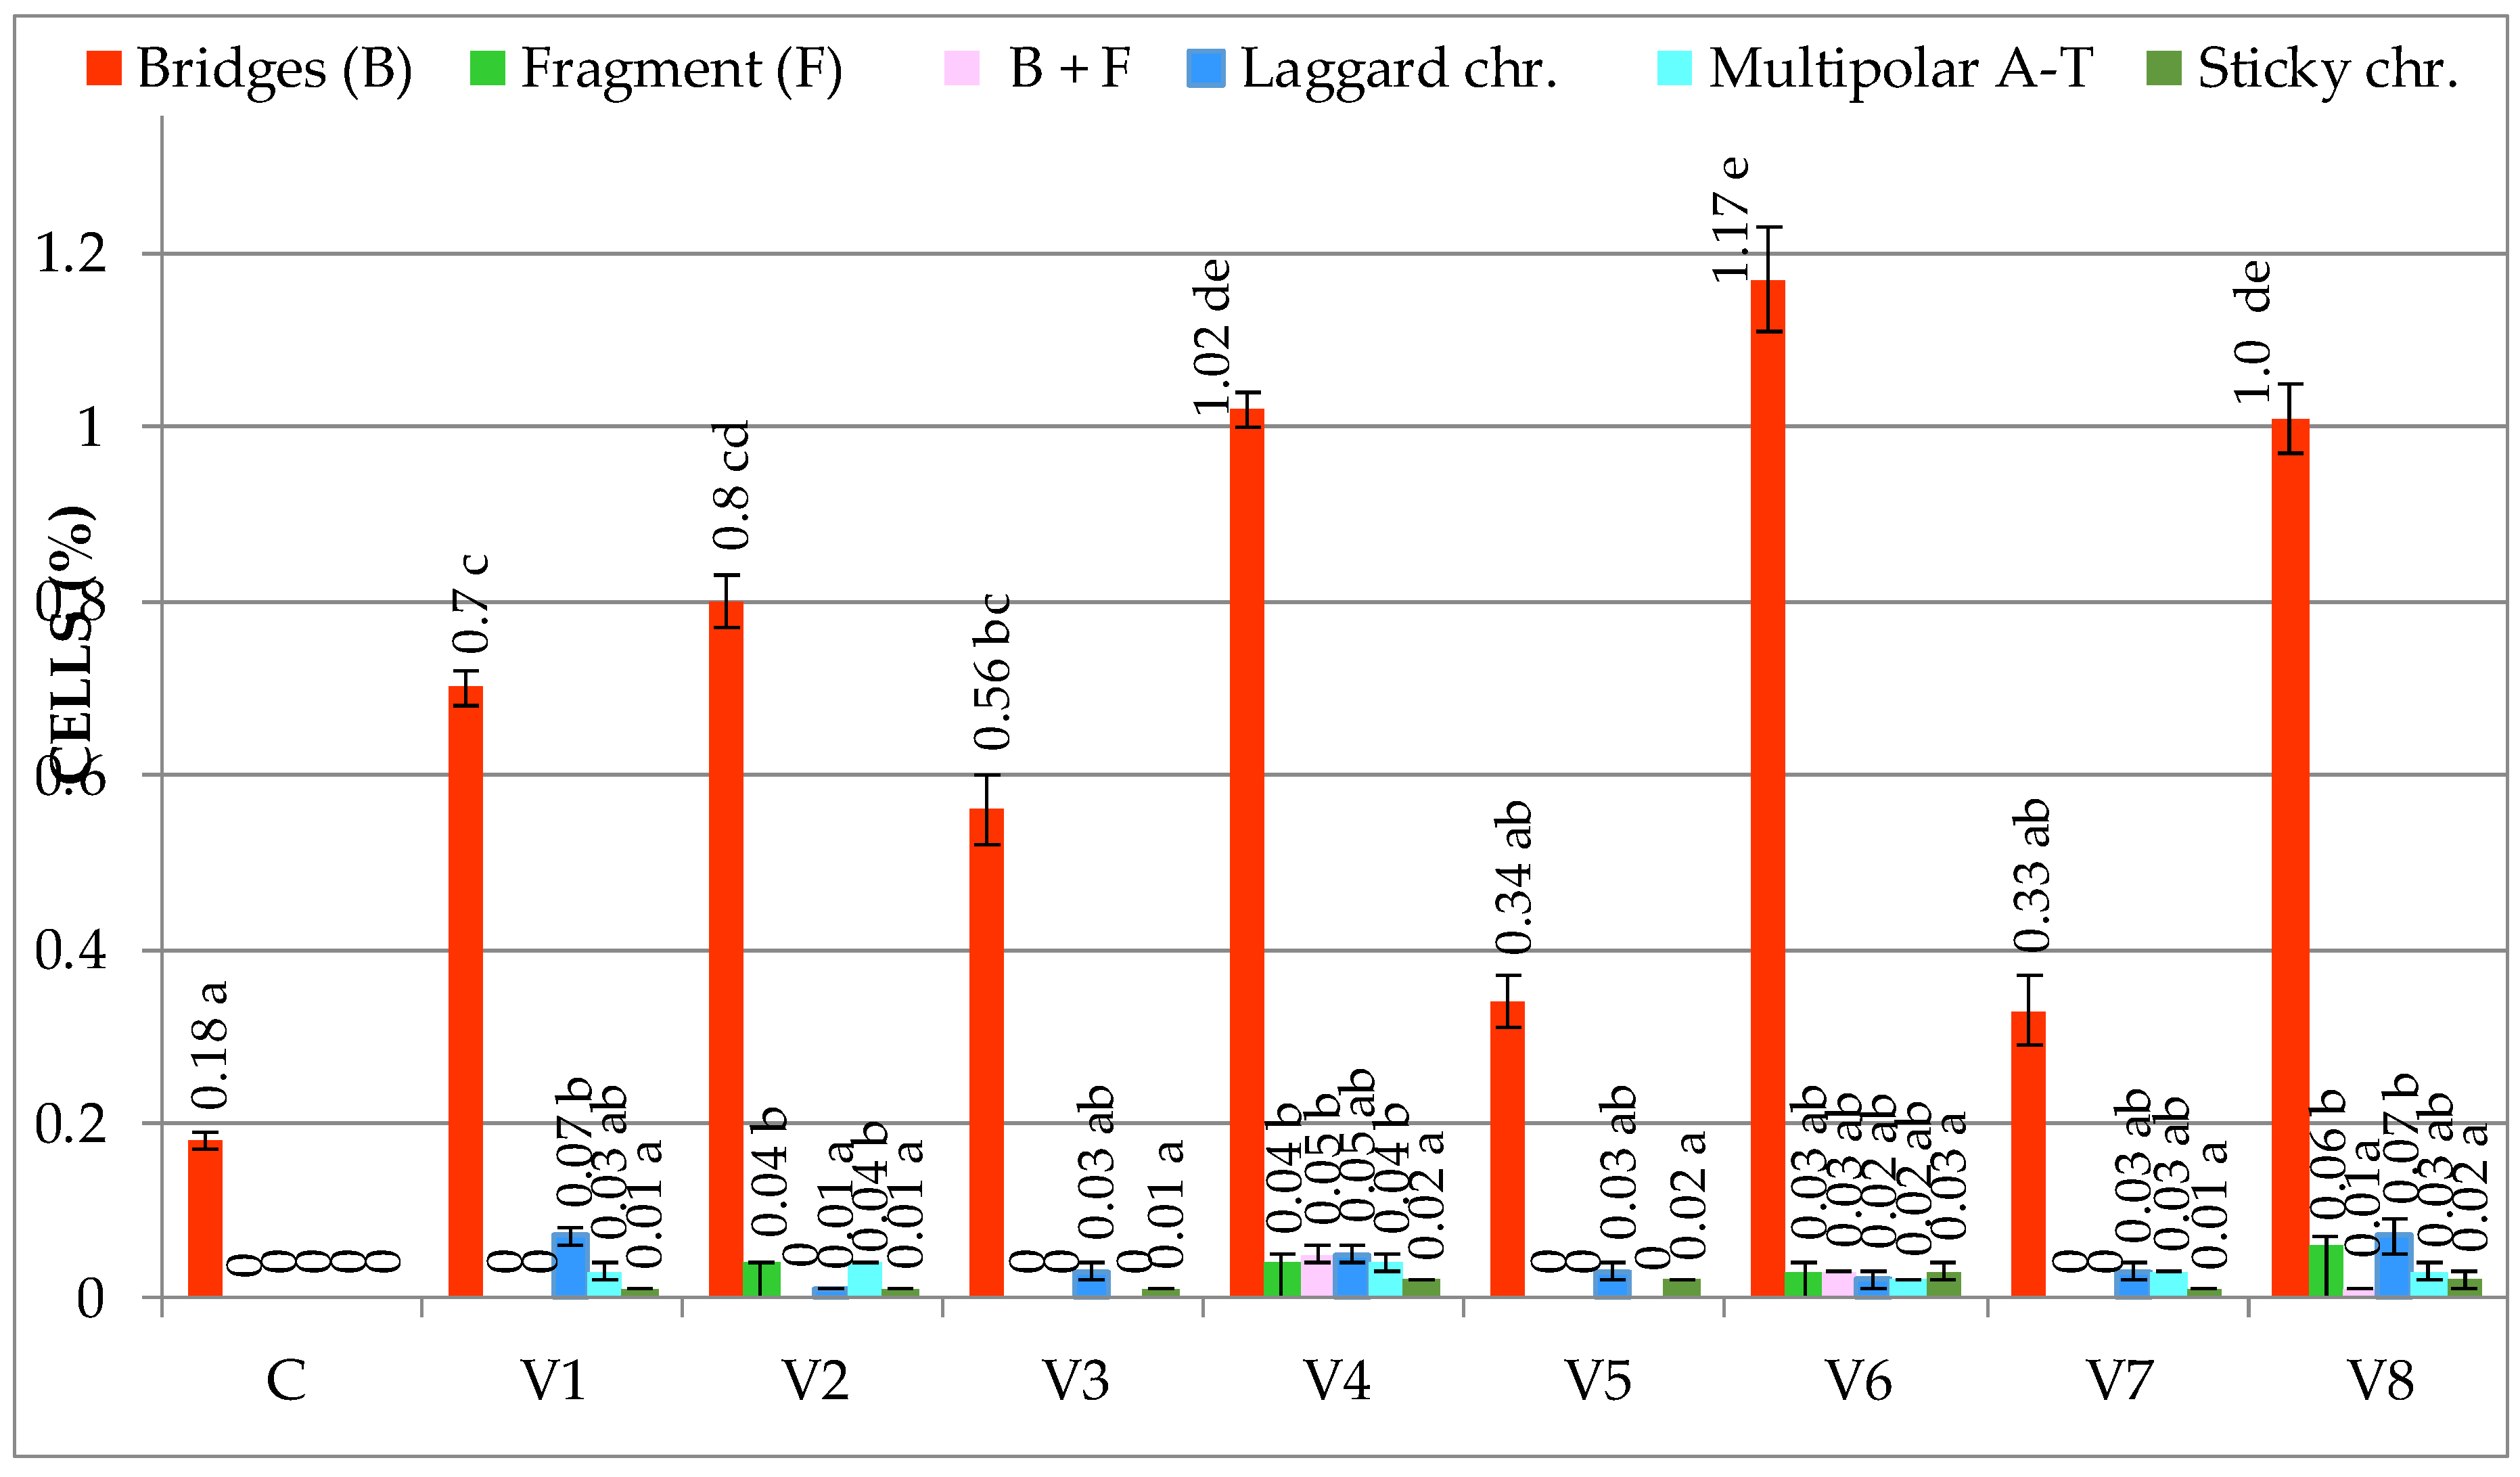
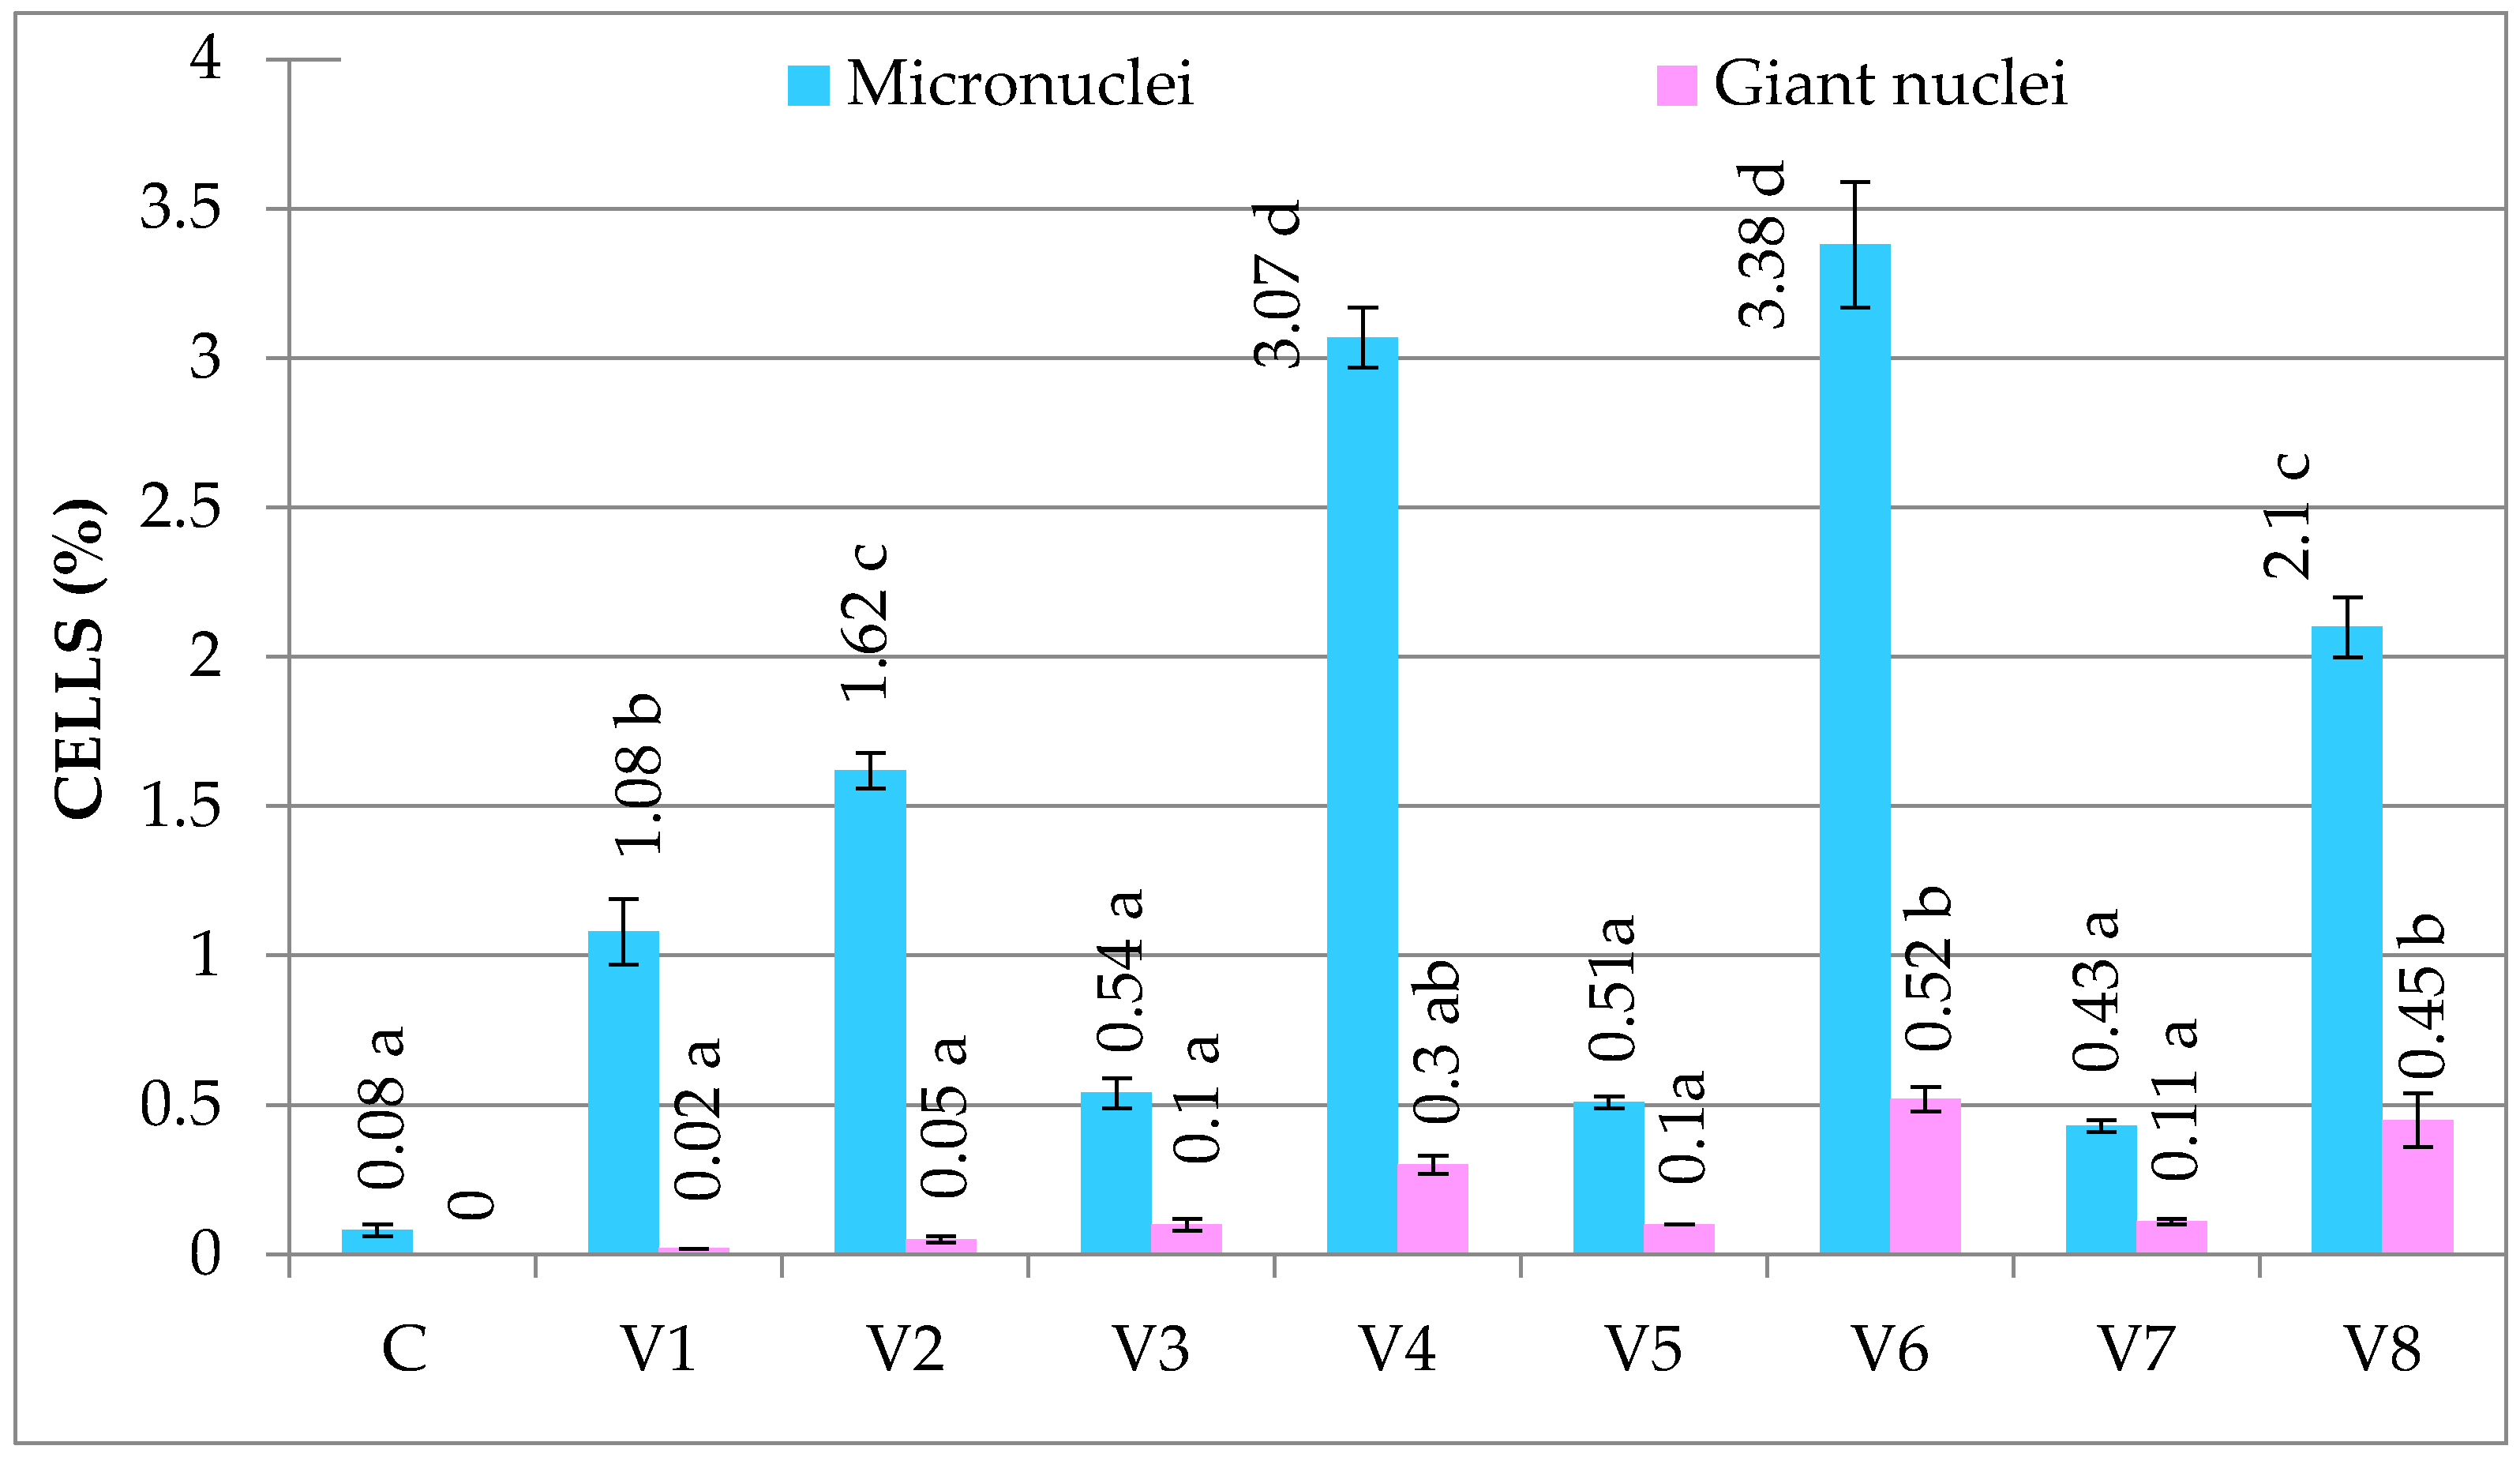
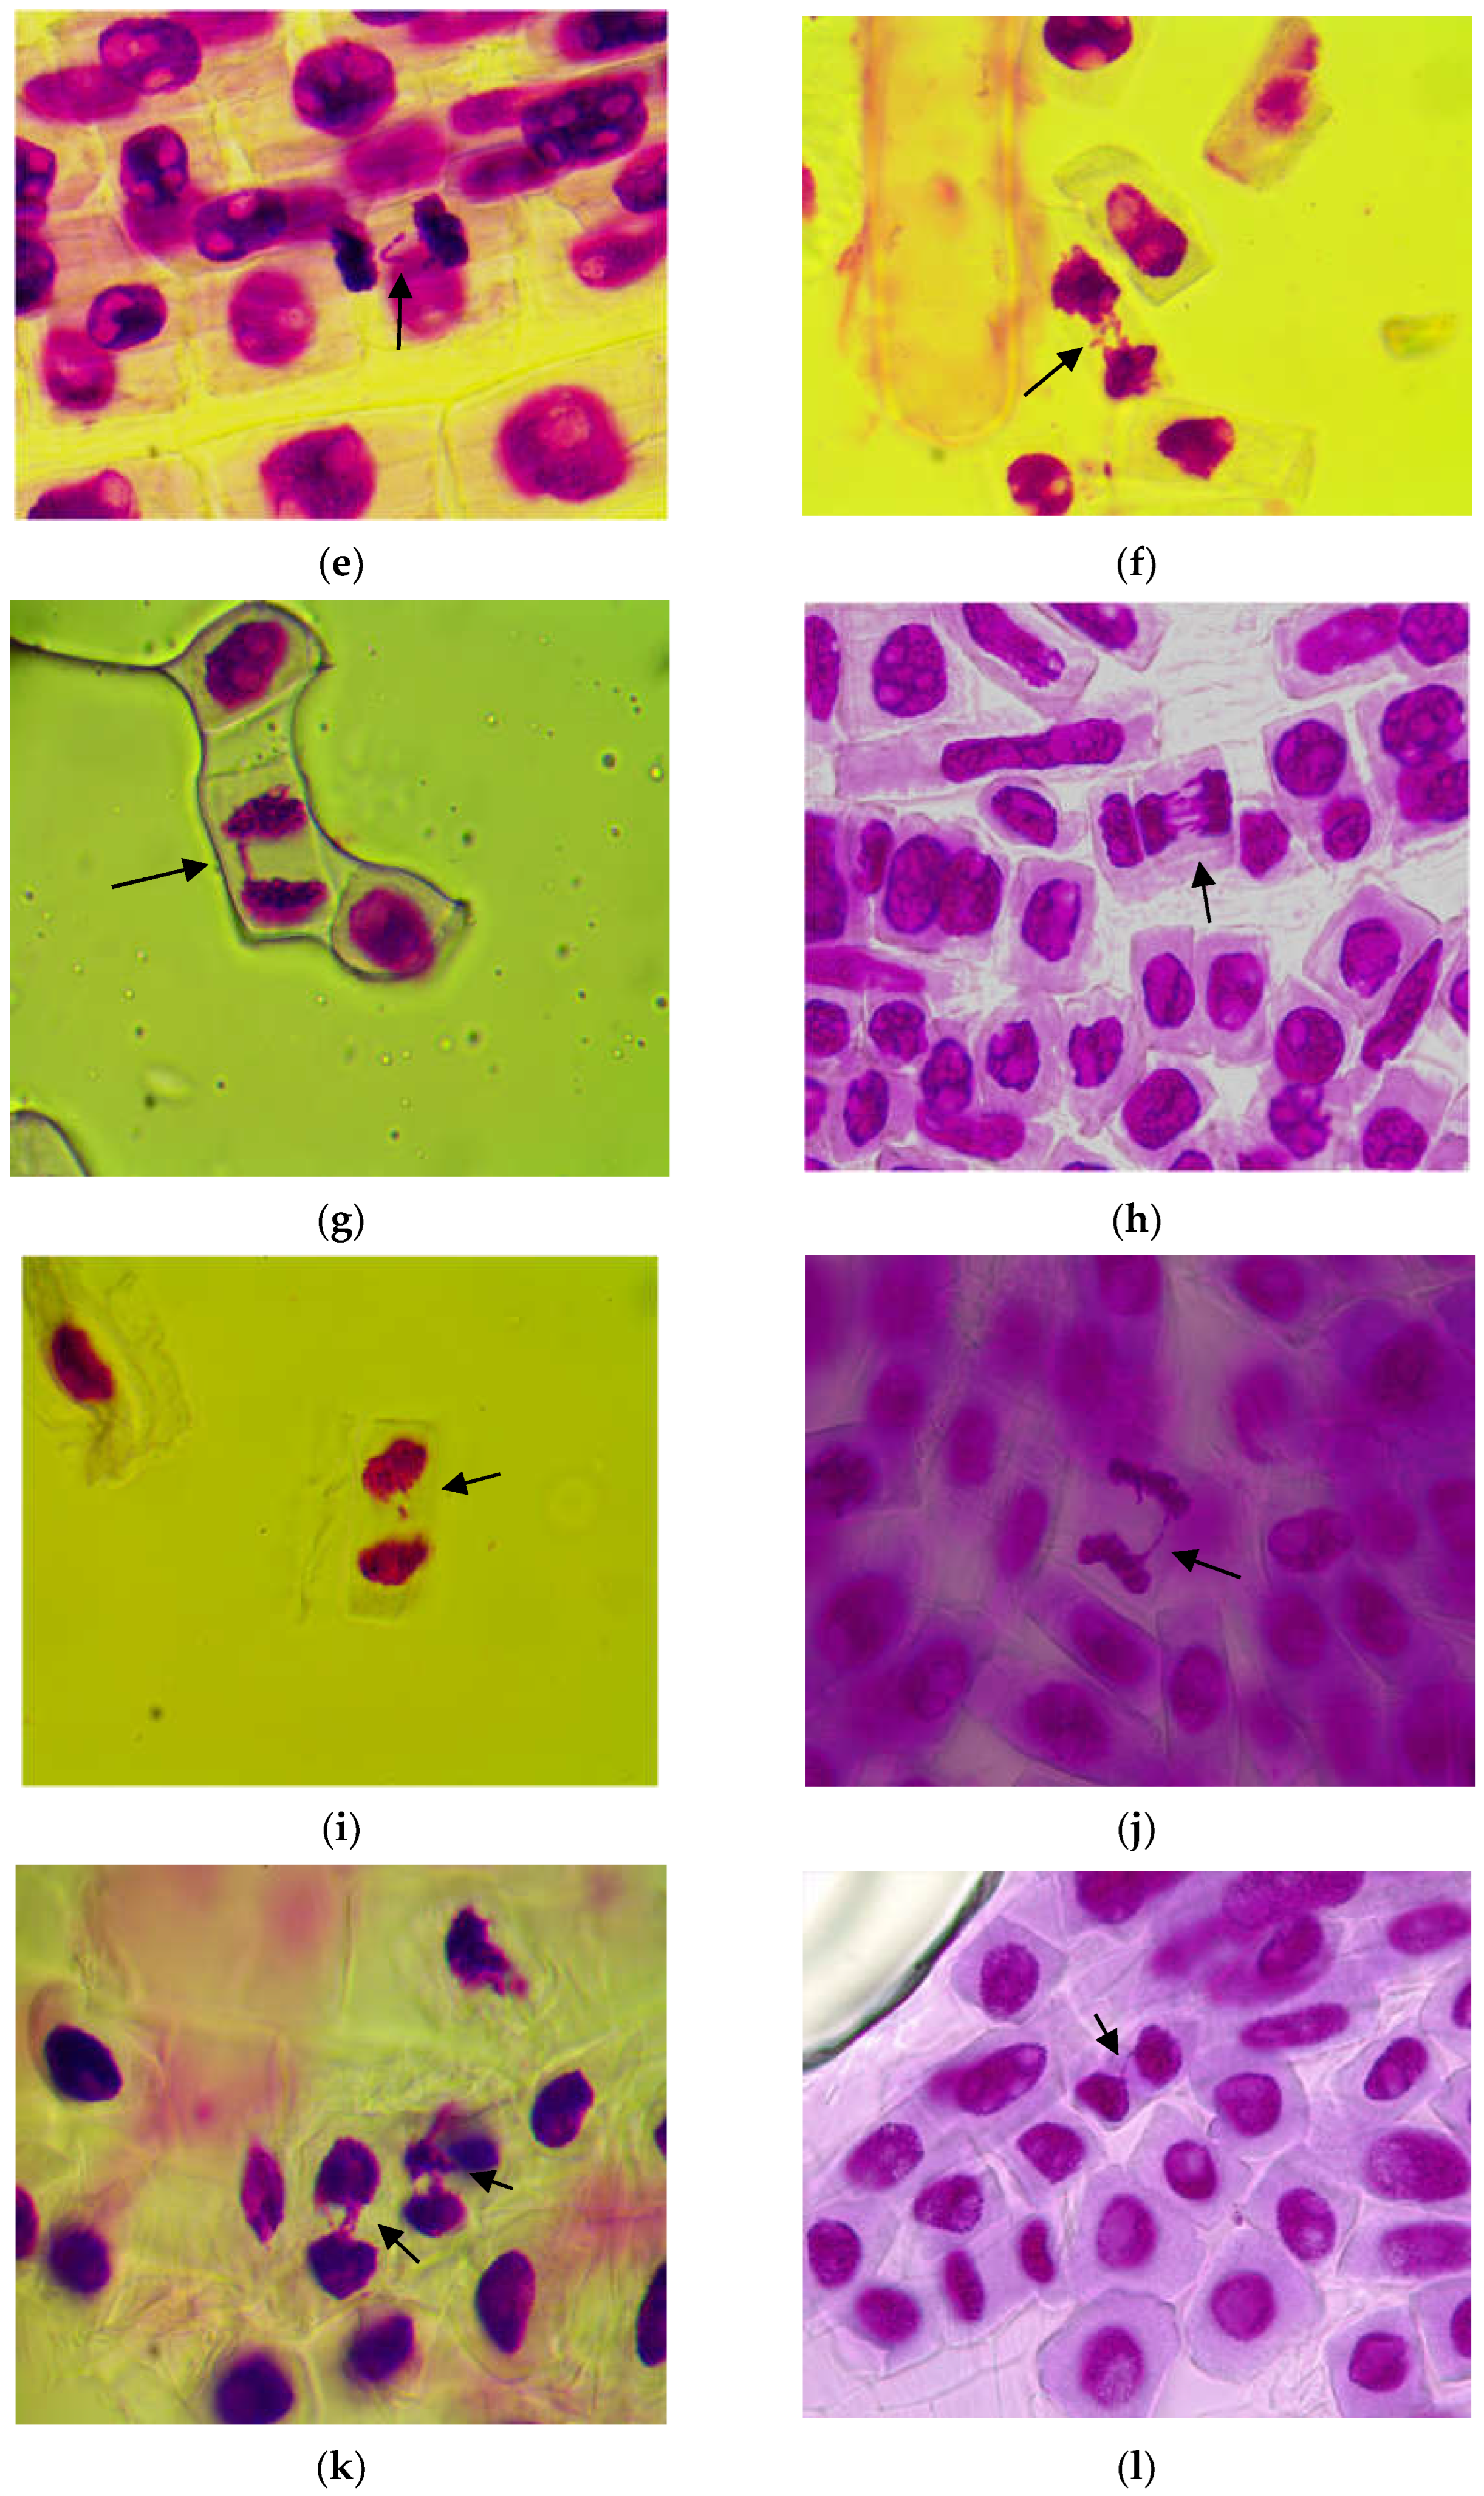
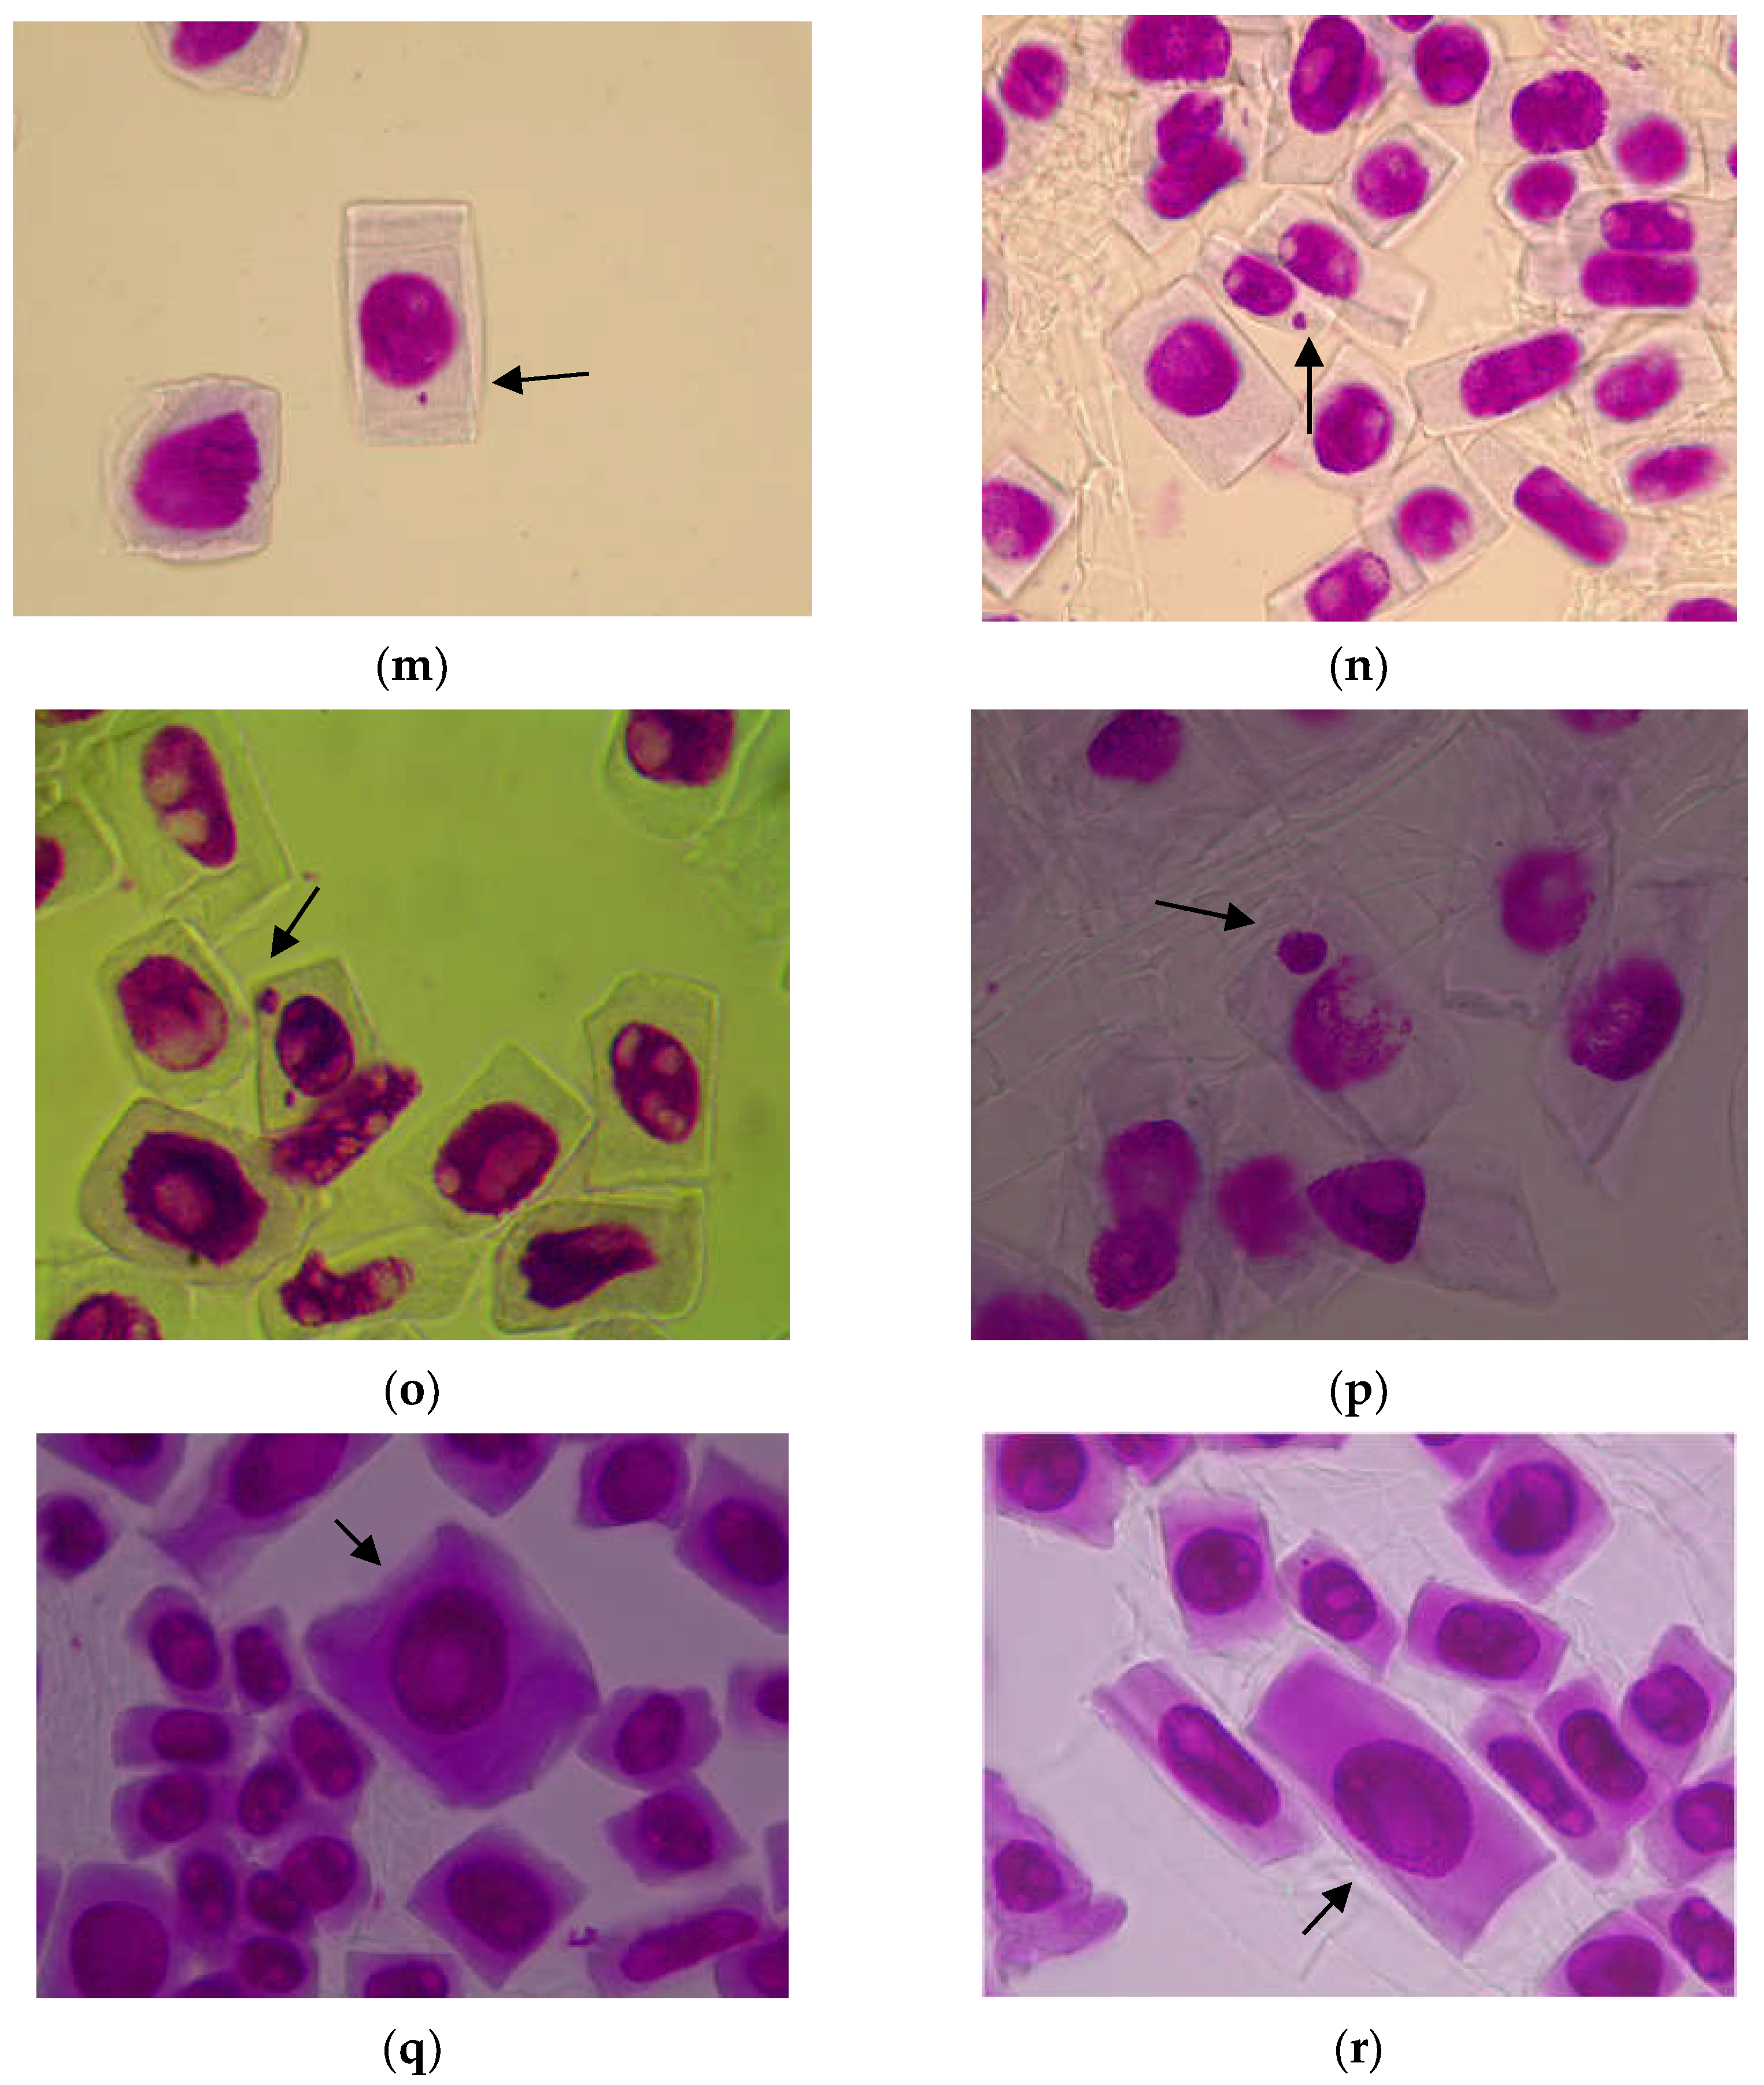
3.1.2. Genetic Abnormalities

PAW treatments on wheat grains induced genotoxic effects, which were assessed by quantifying the cells with genetic abnormalities in embryonic root tips. These genetic abnormalities have been identified in metaphases, ana-telophases (A–T) and interphases. Table 3 shows the frequency of cells with genetic abnormalities, also called aberrant cells, in the mitotic stages specified above, from the summation of which the genotoxic index was derived.
The aberrant metaphases induced by PAW treatments have subunit values in all experimental cases. Out of these, the highest and the most statistically assured values were recorded for V6 (0.36%), V4 (0.32%) and V8 (0.30%). The fewest metaphases were observed for V1 (0.03%) and V2 (0.05%). No aberrant metaphases were found for the control.
PAW treatments also induced aberrant ana-telophases whose frequency exceeded aberrant metaphases. Out of the eight PAW treatment variants, three experimental variants had the most aberrant ana-telophases with statistically assured frequencies higher than one, namely: V4 (1.22%), V6 (1.30%) and V8 (1.20%). The variants with the lowest frequencies of aberrant ana-telophases were: V3 (0.60%), V5 (0.45%) and V7 (0.40%). The control showed spontaneously occurring aberrant ana-telophases with an insignificant frequency (0.18%).
The aberrant interphases resulting from PAW treatments had the highest frequencies compared to aberrant metaphases and aberrant ana-telophases. The frequencies of aberrant interphases are higher than one in most cases. The experimental variants with the most abundant aberrant interphases were: V6 (3.90%), V4 (3.37%) and V8 (2.55%). As for the control, spontaneously occurring aberrant interphases had an insignificant frequency (0.08%).
The genotoxic index (GI) provides an overview of the frequency of genetic abnormalities identified in the meristematic cells of Triticum aestivum embryonic roots exposed to PAW treatments.
The GI was higher than one for each experimental variant of our study. In descending order, the highest statistically assured GI were recorded for V6 (5.56%), V4 (4.91%) and V8 (4.05%). The variant with the lowest GI was V7 (1.06%). Regardingthe control, the GI was the subunit (0.26%).
The genetic abnormalities identified in the meristematic cells of wheat roots were of different types. The frequencies of each type of genetic abnormality induced by PAW treatments are shown in Figure 2, Figure 3 and Figure 4.
The genetic abnormalities identified in metaphases consisted of: chromosomal fragments, laggard chromosomes, sticky chromosomes and c-metaphases, all these having subunit frequencies (Figure 2).
The c-metaphases present in all variants had the highest frequencies, especially in V4 (0.25%), V6 (0.27%) and V8 (0.21%). Chromosomal fragments were present only in V4 (0.04%), V6 (0.03%) and V8 (0.03%). Laggard chromosomes were present in five variants (V4, V5, V6, V7 and V8) with low frequencies (0.01–0.04%). Sticky chromosomes occurred in all experimental variants with low frequencies (0.01–0.05%). The control showed no genetic abnormalities in metaphase.
Most types of genetic abnormalities have been identified in ana-telophase cells, namely: chromosomal bridges, chromosomal fragments, associations between chromosomal bridges and chromosomal fragments, laggard chromosomes, multipolar ana-telophases and sticky chromosomes (Figure 3).
The most abundant of these abnormalities were chromosomal bridges, which had statistically assured frequencies higher than one in three PAW treatment variants: V6 (1.17%), V4 (1.02%) and V8 (1.01%). The other types of genetic abnormalities had subunit frequencies that were not significant. As for the control, chromosomal bridges occurred spontaneously with an insignificant frequency (0.18%).
The genetic abnormalities identified in interphase were micronuclei and giant nuclei (Figure 4). Both types of abnormalities were present in all experimental variants. Micronuclei had frequencies ranging from 0.43% to 3.38%. The highest frequencies of micronuclei were recorded forV6 (3.38%), V4 (3.07%) and V8 (2.1%). The same three variants also had giant nuclei with the highest frequencies, i.e., V6 (0.52%), V8 (0.45%) and V4 (0.3%). Regarding the control, spontaneous micronuclei occurred with an insignificant frequency (0.08%) (Figure 4).
The correlation between the GI (%) and MI (%) is negative and high (R2= − 0.907) (Figure 5).
All the genetic abnormalities identified in the Triticum aestivum root meristems of the eight experimental variants indicate the genotoxic potential of the water activated with non-thermal plasma used in our experiment.
The types of abnormalities induced by PAW treatments are shown in Figure 6 in order to demonstrate the pattern of genomic damage in wheat root meristems.

3.2. Evaluation of the Germination Rate

The germination rate of wheat grains watered with different variants of PAW was followed dynamically, i.e., after 48 h, 72 h, 96 h and 120 h of cultivation (Table 4).
After 48 h of the culture, the PAW treatment applied to V7 significantly accelerated germination (81.33%) as compared to the control (78%). followed in descending order by V3 (79.00%). The lowest germination rates for this first monitoring point were recorded for V4 (68.00%), V6 (68.33%) and V8 (69.66%). After 72 h of the culture, the germination rate was again high for V7 (90.33%), but also for V5 (89.00%), V3 (87.66%) and V2 (87.33%), while for the control, it was 89.33%. After 96 h of the culture, the PAW treatment applied to V1, V2, V3, V5 and V7 allowed for a germination rate comparable to that of the control (89–92.33%). On the contrary, V4, V6 and V8 had a significantly low number of germinated grains (71–73%). After 120 h of the culture, the germination rate trend of the wheat grains for the eight experimental variants was very similar to that of the previous day, ranging from 73% to 93.33%, while the control had 92.33%.
After five days of the culture, we can state that the germination rate of wheat grains was significantly reduced for V4 (79%), V6 (73%) and V8 (74%). For the other variants, V1, V2, V3, V5 and V7, the germination rate was comparable to that of the control (91.66–93.33%).
The germination rate of wheat grains under the influence of PAW treatments was reflected by other physiological parameters (root and shoot length) of the wheat sprouts as well.

3.3. Evaluation of the Length of the Embryonic Root and Shoot

The embryonic root length and shoot length of wheat sprouts were dynamically monitored over the course of 120 h of the culture (Table 5 and Table 6).
After 48 h of the culture, the roots of V3 (21.61 mm) were significantly longer, exceeding the control, while the roots of V6 were the shortest (1.58 mm). As for the other experimental variants, the root length was comparable to that of the control (17.57 mm). After 72 h of the culture, the roots of most variants were comparable to that of the control (34.39 mm) and exceeded it insignificantly. In two variants (V4 and V6), the roots were significantly shorter (15.52 and 17.28 mm, respectively). Significantly longer roots after 96 h of the culture were seen for V3 (55.56 mm) and V7 (54.94 mm), exceeding the control (43.14 mm), and significantly shorter roots were recorded for V6 (25.21 mm). After 120 h of the culture, the PAW-treated wheat sprouts of V7, V3 and V5 had the longest roots (74.44 mm, 71.1 mm and 65.38 mm, respectively), significantly exceeding the control (59.92 mm). At the opposite pole were the roots of: V6 (39.15 mm), V4 (49.29 mm), V2 (49.62) and V8 (52.56 mm) (Table 5).
The shoots of the PAW-treated wheat sprouts were generally uniform in length and statistically comparable to the control (Table 6). After 48 h of the culture, the strains of most wheat sprouts insignificantly exceeded the control (7.01 mm), but there were also cases where the shoots were significantly shorter—for instance, in V6 (0.5 mm).
After 72 h of the culture, the PAW-treated wheat sprouts had shoot lengths of 15.60 mm to 19.77 mm, while the control had a shoot length of 18.76 mm. After 96 h of the culture and PAW treatment, the wheat sprout shoot reached lengths of 34.24 mm (V3) and 31.83 mm (V7), respectively, with the two variants slightly exceeding the control (29.09 mm). After 120 h of the culture, significantly longer shoots resulted for V7 (50.89 mm) and significantly shorter shoots resulted for V4 (29.77 mm), as compared to the control (43.50 mm).
The results on the three analyzed biometric parameters of wheat sprouts led to the conclusion that some PAW treatments (V3, V5 and, especially, V7) had a slightly stimulatory effect on the root growth and shoot length of wheat sprouts.

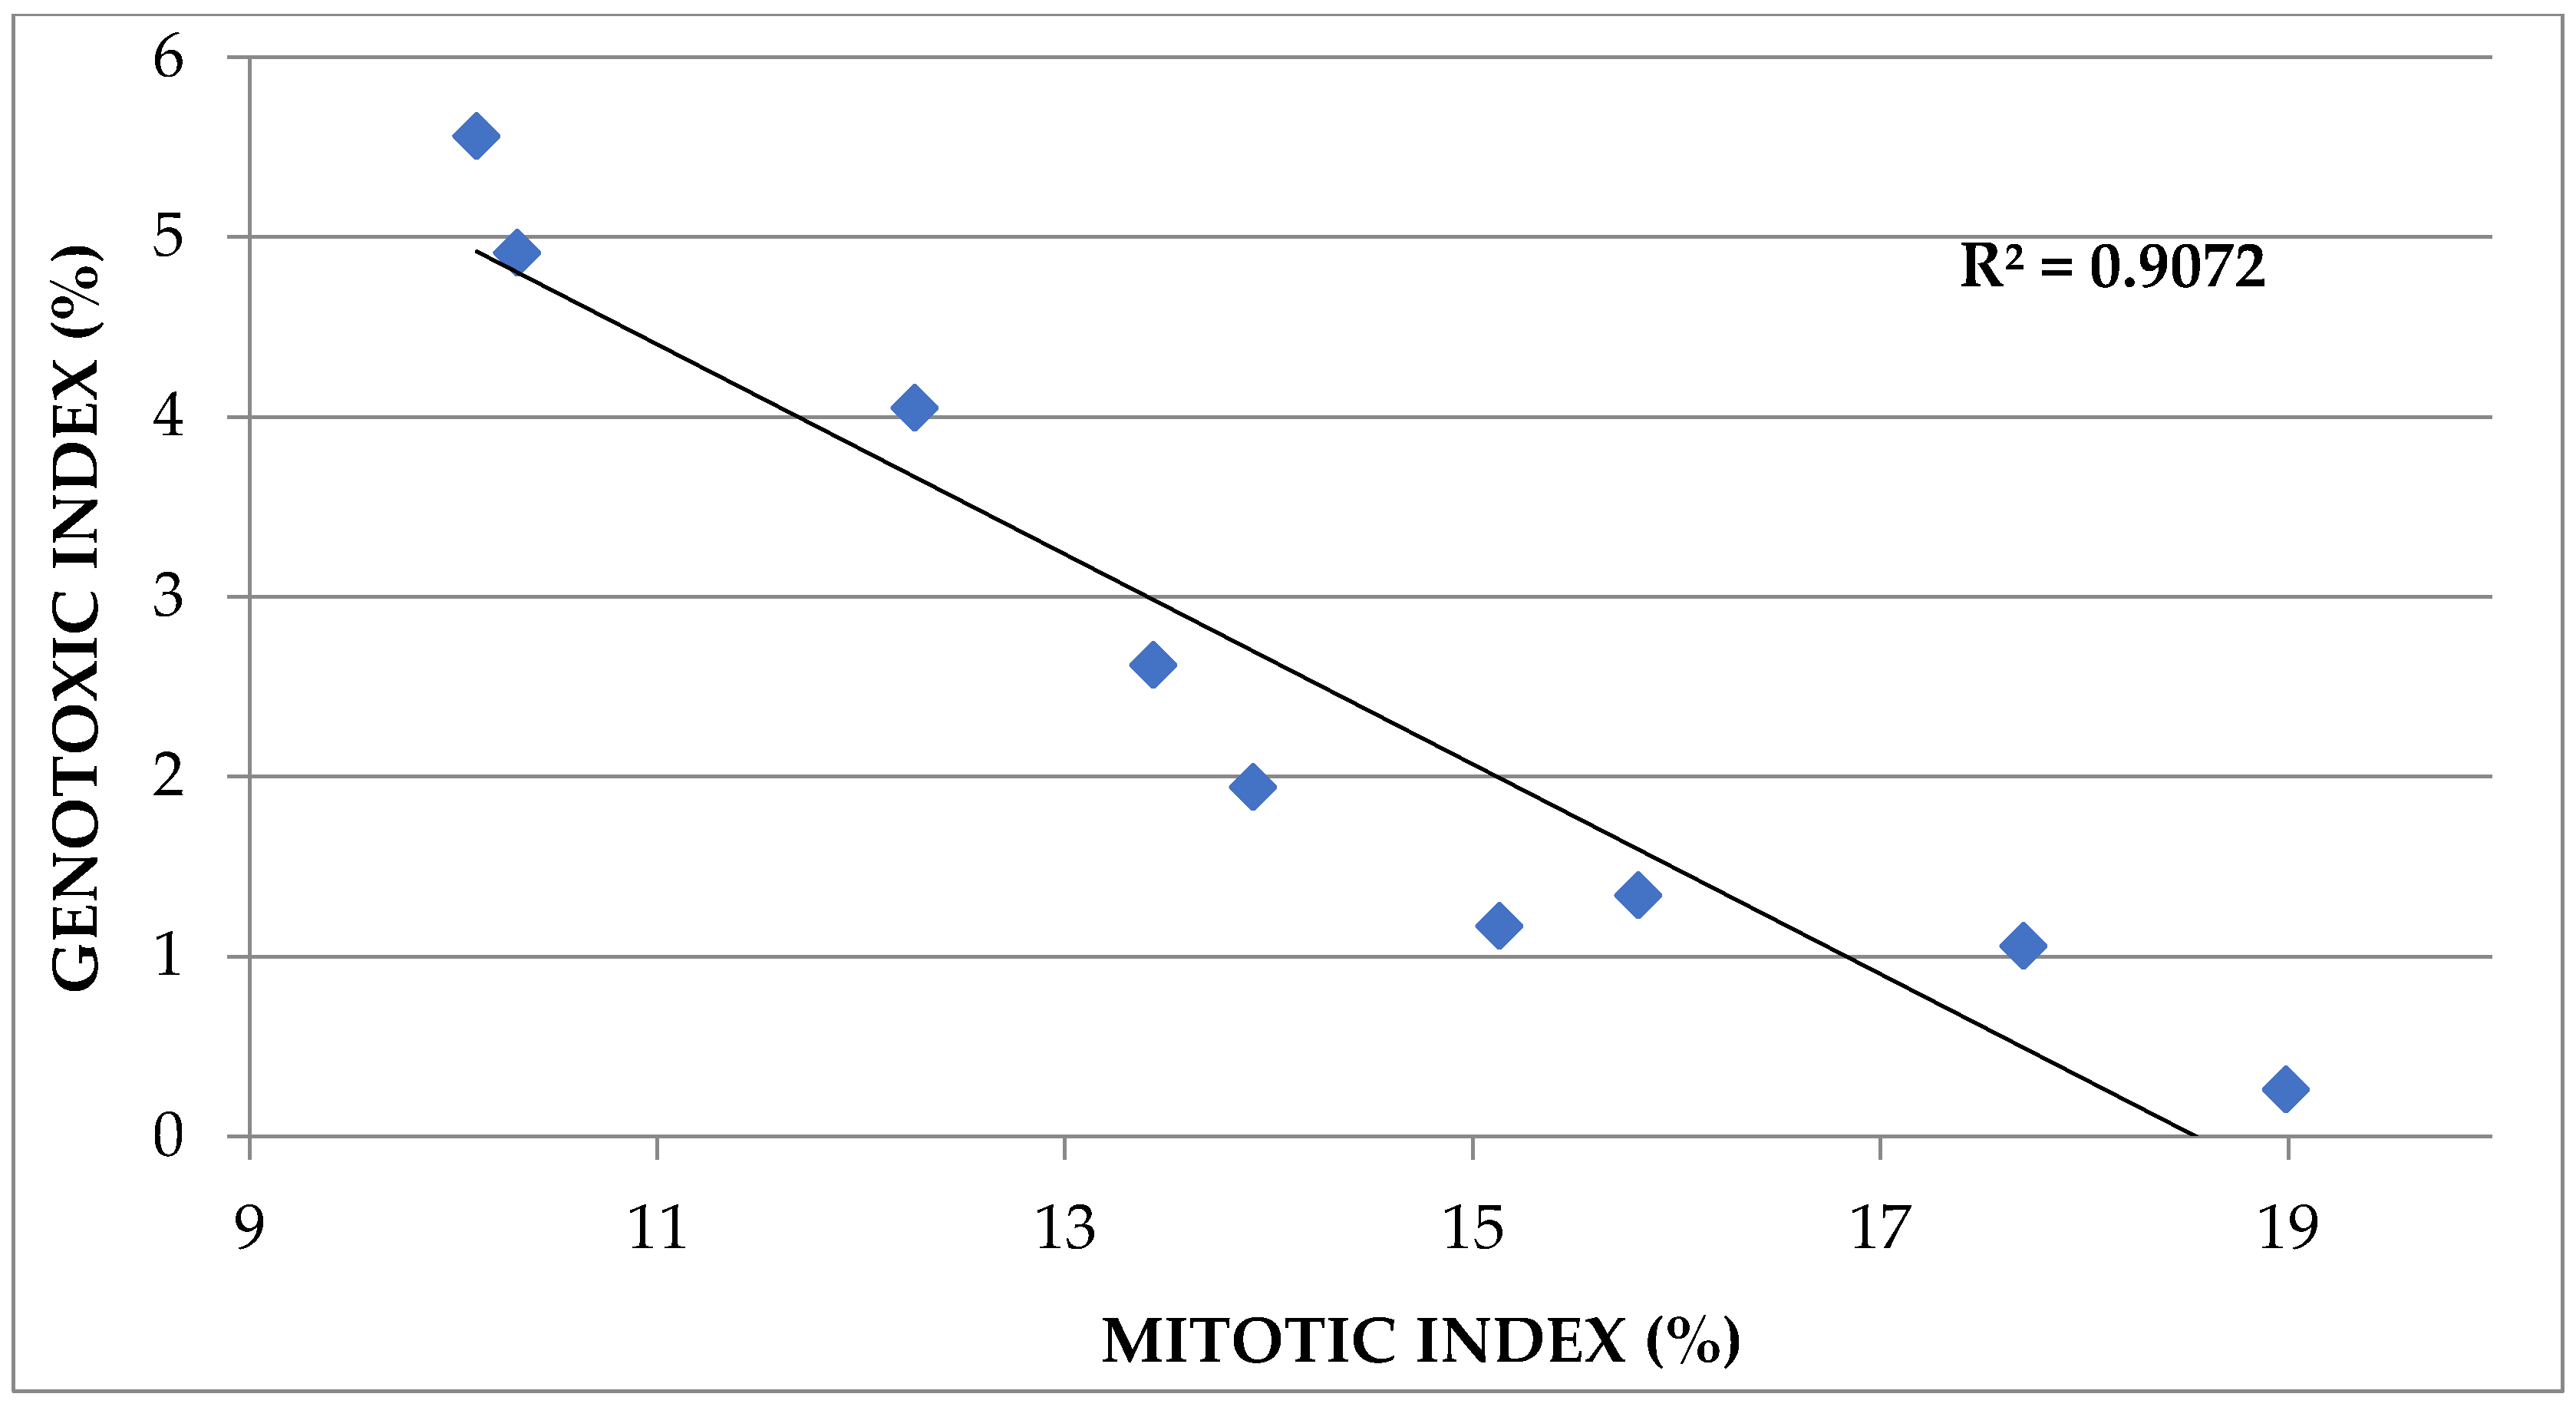
3.4. Correlations between Cytogenetic Parameters and Biometric Parameters

The cytogenetic investigations shown above are consistent with the macroscopic results (number of germinated grains, length of embryonic roots, length of shoots). To demonstrate this claim, we tried to determine the correlation coefficient (R2) between the main cytogenetic and biometric parameters of wheat sprouts treated with different PAW variants (Table 7).
We have found that MI positively correlatesfor all time-points with the germination rate of wheat grains (when R2 ranged from 0.612 to 0.772), with root length (when R2 ranged from 0.358 to 0.643) and with shoot length (when R2 ranged from 0.164 to 0.719). In contrast, GI negatively correlatesfor all time-points with the germination rate (when R2 ranged from −0.647 to −0.877), with root length (when R2 ranged from −0.445 to −0.687) and with shoot length (when R2 ranged from −0.054 to −0.706).
We conclude that, over the course of 120 h of the culture, the weakest correlations were between the MI and GI and the shoot length.

4. Discussion

During our study, we tested eight PAW treatment variants with different plasmatic indices. The effects of the eight PAW treatment variants were monitored by applying them to Triticum aestivum grains, which is an allohexaploid plant (2n = 6x = 42 chromosomes).

4.1. Cytogenetic Investigations

An important cytogenetic parameter is the mitotic index, which reflects the proportion of divided cells in relation to the proportion of all cells observed in the mitotic cycle. So, the mitotic index is an indicator estimating the frequency of cellular division [36,37,38]. The mitotic index may increase or decrease under the influence of different environmental factors. This results in either the proliferation of inordinate cells that may form tumors or in a mitodepressive effect slowing down the growth of the body. In both cases, the cytotoxic effect induced by diverse chemical or physical factors manifests while affecting the cellular functions [37,39,40].
In our experiment, the mitotic index decreased in correlation with the RONS concentration and the pH value of PAW. The mitotic index of wheat grains decreased when the RONS concentrations were high and the pH was low. The PAW variants with H2O2 values of 13, 14 and 22 mg/L, NO3 values of 49, 55 and 68 mg/L and an acid pH (4.1, 3.9 and 3.8, respectively) (namely, the experimental variants V4, V6 and V8) induced the lowest mitotic index as compared to the control watered with distilled water. In all these cases, the cytotoxic effect of PAW was obvious. On the contrary, the PAW treatment of 1 mg/L of H2O2 and 8 mg/L of NO3 (namely, V7) induced a statistically assured mitotic index close to that of the control.
Besides the cytotoxic effect, the PAW treatments used in our experiment also induced genotoxicity that was quantifiable through genetic anomalies in different stages of the mitotic index: metaphase, ana-telophase and interphases. The frequency of the genetic anomalies that we identified depended on the plasmatic composition in RONS and the pH of the PAW.
Our findings are in agreement with other authors’ findings, according to which DNA can be affected by non-thermal plasma treatments in both prokaryotic and eukaryotic cells in a reactive species concentration (RONS)-dependent manner [41]. Graves [42] showed that reactive species (RONS) penetrate the surface layer of plant and animal cells, and RONS by-products penetrate deeper into the cells, which maintains the effects of non-thermal plasma in space and time. The response of eukaryotic cells to the increased doses of RONS is delayed because plasma initiates cascades of biochemical events. In this regard, it is suggested that reactive oxygen and nitrogen species interact with membrane receptors and lipid bilayers, where they produce nanopores through lipid oxidation, which, in turn, triggers signaling pathways [43,44,45,46]. Once in the cytoplasm, RONS oxidise intracytoplasmic molecules and then enter the nucleus, where they cause DNA damage. As a result, the cell reacts by altering the gene expression, activating defence mechanisms and sending signals to other cells [46].
Prokaryotic cells show a much greater sensitivity than eukaryotic cells to non-thermal plasma treatments, even with low doses of RONS. This is because their DNA is unprotected by the nuclear envelope, and their antioxidant system is inefficient. RONS from non-thermal atmospheric-pressure plasmas interact with peptidoglycan in the bacterial wall while creating cracks and causing the physical destruction of the cell or death by oxidative stress due to the oxidative or nitrosative species entering the cell through the cracks in the wall structure [47,48,49,50]. Non-thermal plasma has also been shown to inactivate phage DNA before inactivating bacterial DNA and plasmid DNA. This suggests the protective role, for some time, of the bacterial cell wall [51]. The studies conducted on different bacterial species have shown a correlation between the cold plasma inactivation of bacteria and cell wall thickness, namely, gram-negative bacteria, which have a thin wall between two membranes, are more sensitive and more quicklyinactivate with non-thermal plasma than gram-positive bacteria, which have a much thicker cell wall [52]. Severe damage to bacterial cells does not allow the resistance to non-thermal plasma treatment to develop [50]. This explains the bactericidal and viral sterilizing effect of cold plasma on the surfaces of medical instruments, wounds, food, seeds, etc. Ptasinska [53] demonstrated that bacterial plasmid DNA is damaged when exposed to a plasma jet at atmospheric pressure through the formation of single-strand and double-strand breaks. They concluded that, during 1 min of plasma exposure, DNA strand breaks are caused by the following plasma components: UV light, positive ions, electrons and negative ions and excited and reactive species. Different amino acids combined with plasmid DNA provided the protection of DNA against the action of non-thermal plasmas [54].
The influence of non-thermal plasma on eukaryotic DNA has been much less studied compared to that on prokaryotic DNA. Thus, Kyzek [55] found, when using the comet assay, double-stranded DNA breaks following the treatment of pea seeds with non-thermal plasma generated in different types of gases (at atmospheric pressure in ambient air, oxygen or nitrogen). DNA damage increased significantly with the increase in the nitrogen content in the operating gas.
The pretreatment of pea seeds with non-thermal plasma at atmospheric pressure generated with a diffuse coplanar surface barrier discharge into ambient air, with exposures of 120–240 s, induced an adaptive response of pea seedlings against the effects of zeocin at toxic concentrations. Zeocin is a radiomimetic antibiotic that induces DNA double-strand breaks. The pre-treatment of pea seeds with non-thermal plasma acted as a stressor that triggered an adaptive response manifested through the induction of heat shock protein synthesis and the increase in antioxidant production in pea seedlings, which attenuates zeocin-induced DNA damage. Thus, the adaptive response obtained by means of plasma trained the plant to cope with another, more aggressive stressor [56,57].
Non-thermal plasma generated into the ambient air and applied to pea and soybean seeds with short exposure times caused DNA single-strand breaks in insignificant amounts and improved seed germination. However, the increase in theconcentration of pure nitrogen in the plasma composition, correlated with a higher UV radiation intensity, and the increased exposure time to plasma treatment caused a large amount of DNA damage [58,59,60].
DNA damage under these treatment conditions consisted of single-stranded and double-stranded breaks, as evidenced by the comet assay. Another genotoxicological method—the constant field gel electrophoresis method—detected only double-strand breaks. The results obtained by the two genotoxicological methods (the comet assay and constant field gel electrophoresis) demonstrated that non-thermal plasma treatments cause more single-strand breaks than double-strand breaks. Quantifying the relative numberof single-stranded and double-stranded breaks in the DNA macromolecule of plant cells is a first in the literature [59].
The same non-thermal plasma variants, whose action on pea and soybean seeds was commented on previously, induce other effects if applied to barley grains. Thus, non- thermal plasma generated in ambient air caused the greatest amount of DNA damage, while the plasma generated in nitrogen caused the least amount of DNA damage in the barley grains. The DNA damage in barley grains also consisted of single- and double-strand breaks and the oxidation of purines, except for the nitrogen-generated plasma, which did not oxidize the purines.These results demonstrate that the seed/grain type and the treatment conditions influence the amount of DNA damage with the same type of plasma [27]. Non-thermal plasma-activated water (PAW) did not induce significant increases inDNA damage in maize and barley grains [61].
The studies mentioned above showed DNA damage under the influence of non-thermal plasma by the standard and modified alkaline comet assay (used to measure DNA damage in eukaryotic cells) and constant field gel electrophoresis. In our study, we revealed the DNA damage by cytogenetic monitoring—a method which allowed us to investigate the effects of PAW at the chromosomal and nuclear level at different times of the wheat mitotic cellular cycle. Thus, the method used in the present study allowed for the detection of chromosomal aberrations and micronuclei, which are collectively referred to as genetic abnormalities. In our research, the types of genetic abnormalities induced by PAW treatments were: chromosomal fragments, chromosomal bridges, associations between bridges and fragments, laggard chromosomes, sticky chromosomes, c-metaphases, multipolar ana-telophases, giant nuclei and micronuclei.
The chromosomal fragments highlighted in our experiment prove the clastogenic effect of PAW, whereby phosphodiester DNA bridges are broken. Chromosomal fragments may have a centromere or be acentric. Fragments may also originate from chromosomal bridge breaks [62]. In this experiment, chromosomal fragments were present in metaphases and ana-telophases, especially in PAW variants with the highest concentrations in RONS and the lowest pH, i.e., V4, V6 and V8.
Another effect induced by PAW in our experiment was the chromosomal bridges. Bridges can result either from the fusion of broken chromosomes, from a dicentric chromosome, from the altered activity of replication enzymes or during the unequal translocation of chromatids [63,64]. Chromosomal bridges were observed in all experimental variants, but with different frequencies. The PAW with the highest concentrations of RONS and the lowest pH (i.e., V4, V6, V8) induced the highest frequencies of chromosomal bridges. The bridges observed were simple, multiple, thin, thick and very thick, continuous or broken. The chromosome bridges and fragments identified in our study are equivalent to the single-strand and double-strand DNA breaks under the influence of non-thermal plasma highlighted by the comet assay in the research of the authors mentioned above. The associations between bridges and fragments were present in variants V4, V6 and V8.
Laggard chromosomes result from the failure of chromosomes to attach to the spindle fiber and to migrate to one of the two cell poles [65]. Laggard chromosomes have non-functional centromeres due to the action of various mutagenic factors. We suggest that, in this study, the laggard chromosomes observed in most variants have damaged centromeres due to PAW action.
Sticky chromosomes indicate an extremely toxic and irreversible effect induced by certain genetic or environmental factors, causing cell death [66]. According to Daphedar [67], sticky chromosomes may be induced by physiological stress as a result of cell suffocation. The appearance of sticky chromosomes is considered to be due to the abnormal function of two types of non-histone proteins involved in chromosome organization, and the immediate consequence is the inhibition of DNA, causing DNA–DNA or DNA–protein cross-linking interactions [64]. These abnormal interactions cause multiple chromosomes to connect to each other, or the connection of the entire genome, by sub-chromatid bridges. In our experiment, we highlighted such bridges resulting from sticky chromosomes. In the next generations of cells, micronuclei may appear through the breaking of these bridges [64,68]. Our results show that PAW has the potential to induce sticky chromosomes since they were present in all the variants in metaphase, anaphase and telophase.
C-metaphase is caused by the inhibition of the mitotic spindle by chemicals with colchicine-like effects [69]. C-metaphases were present in all variants, which means that PAW disrupts the assembly of mitotic spindle microtubules. The highest frequencies of c-metaphases were recorded for the variants with the highest RONS concentrations and the lowest pH, i.e., V4, V6 and V8. C-metaphases cause the appearance of autopolyploid cells [70], a fact also confirmed by our study. In this regard, giant nuclei were detected in the interphase, which we consider to be autopolyploids, as they are the result of c-metaphases. The frequency of giant nuclei was very similar to the frequency of c-metaphases.
Another effect related to the defective division spindle is cell multipolarity. The multipolar cells in ana-telophases were present in most variants. They consolidate the idea that PAW acts on the mitotic spindle in a way that disrupts it.
Micronuclei were the most common genetic abnormalities identified in this study, especially in the V4, V6 and V8 variants. The identified micronuclei had different sizes, i.e., very small, very large and medium, located more or less close to the nucleus, as shown in the microphotographs in Figure 6. We suggest that very small micronuclei resulted from chromosomal fragments and that large and medium micronuclei resulted from laggard chromosomes or polyploid cells, where the excess genetic material tends to be removed from the nucleus [71]. Our research shows that, under the influence of PAW, wheat mitogenic cells have one or even two micronuclei. Regardless of their origin, micronuclei represent losses of genetic information, thus endangering cell viability. Using the micronucleus assay, dielectric barrier discharge plasma has been shown to induce micronuclei in brain cancer cells at exposure times of 120 and 240 s, which correlates with cell death [72]
The types of genetic abnormalities highlighted in our study show that PAW treatments can have clastogenic and aneugenic effects. The clastogenic effect is related to the ability of PAW to induce DNA damage, as shown by the comet assay. The aneugenic effect of PAW was expressed by cellular disorders produced by mitotic spindle damage, chromosome centromere damage and chromatin condensation deregulation.
We notice that, in comparison with the comet assay, cytogenetic monitoring allows for more extensive research of the damage to the genetic material under the influence of non-thermal plasma. We point out, in this respect, that the comet assay only revealed the clastogenic effects of non-thermal plasma, while cytogenetic monitoring allowed the clastogenic and aneugenic effects of non-thermal plasma to be revealed.
The genetic abnormalities revealed in our study manifested with different frequencies depending on the concentrations in RONS reactive species and the pH of the PAW solutions used as treatments.The highest concentrations of RONS (13, 14 or 22 mg/L H2O2 on one hand, and 49, 55 or 68 mg/L NO3, on the other hand) and the lowest pH (4.1, 3.9 or 3.8) of PAW resulted in the highest frequencies of genetic abnormalities in embryonic wheat roots, as was the case for theV4, V6 and V8 experimental variants. On the contrary, the lowest concentrations in RONS (1 or 3 or 5 mg/L H2O2 and 8 or 14 or 15 mg/L NO3) and the highest pH values (5.5 or 5.1) produced the least amount of damage to the genetic material.These are the V7, V3 and V5 variants.
The main factors involved in DNA damage by non-thermal plasma treatments are free radicals and non-radical species of ROS and RNS. Strand breaks can be caused either by deoxyribose oxidation by ROS/RNS or by the enzymatic cleavage of phosphodiester bonds [41,73,74,75,76] DNA stability is also affected by the acidic pH (below 4), which induces the hydrolysis of the N-glycosidic bond, thus separating the nitrogenous base from the deoxyribose [73]. At high concentrations, RONS species also become dangerous because they damage cell organelles through oxidative stress [77].
We mention that not all of the PAW treatments were aggressive on wheat meristematic cells, but only three out of the eight, namely, the PAW treatments with the highest concentrations in RONS and the lowest pH, applied to V4, V6 and V8. In these three variants, the mitotic indices were the lowest, and the genetic anomalies were the most abundant, out of which chromosomal bridges and micronuclei had frequencies higher than one. The other genetic abnormalities identified had low and insignificant frequencies.

4.2. Germination Rate and Length of the Embryonic Root and Shoot of Triticum aestivum

Non-thermal plasma applied to seeds/grains facilitates the wettability rate, thus stimulating germination. At the same time, the reactive species from the plasma penetrate the seeds/grains, which, together with the absorbed water, stimulate germination and the expression of various genes related to embryonic development, plant growth and resistance to pathogens [78,79]. However, the effects of the stimulation of germination and plant growth induced by non-thermal plasma are epigenetic; therefore, they are not transmitted hereditarily [80].
The composition of the non-thermal plasma used to treat the seeds is essential in order to obtain the desired effects. For example, the high concentrations of plasma reactive species did not stimulate the germination of Echinacea purpurea seeds, but the sprouts had a high content of vitamin C and phenolic acids [78].
The non-thermal plasma treatments applied to seeds have also shown that the working gas where plasma is generated and the concentrations of RONS and pH influence the germination rate of seeds/grains and the root and shoot growth. In our experiment, plasma was discharged into ambient air, and the plasma composition of PAW solutions applied to wheat grains was preset according to the data in Table 1. The PAW treatments for V4, V6 and V8 had the highest concentrations in H2O2 and NO3 and the lowest pH. These three treatments induced the lowest germination rates of wheat grains, which were significantly reduced as compared to the untreated control. The PAW treatments with much more reduced concentrations in reactive species for V1, V2, V3, V5 and V7 induced germination rates comparable to that of the control.
The embryonic roots of 120-day-old sprouts were the shortest for V2, V4, V6 and V8 and the longest for V7, V5 and V3. The sprout shoots of the same age were significantly longer for V7 and significantly shorter for V4. In the other variants, the shoots were comparable to the control. The result is that the PAW treatments with the lowest concentrations of reactive species (H2O2 and NO3) have a slightly stimulatory effect on the increase in the vigor of wheat sprouts and shoots.
Similar findings may be seen in other research as well. Thus, Švubová [60] showed that soybean seeds subjected to direct treatment with plasma generated in ambient air and oxygen at short exposure times significantly stimulated succinate-dehydrogenase activity, which increased the germination percentage by 20%, with positive effects on the seedling vigor. Longer exposure times to nitrogen-generated plasma inhibited this enzyme, with negative repercussions on germination and seedling growth. When Peťková [27] treated the barley grains with plasma generated in a nitrogen atmosphere with exposure times of 60–300 s, she obtained significant reduction in the germination, root weight and sprout shoot. We point out that, in case of direct non-thermal plasma treatments, the exposure times of seeds/grains are in the order of seconds or minutes, and the dose of reactive species accumulated in the biological material is directly related to the exposure time [17].
The high concentrations of ROS in plasma increase the activity of antioxidant enzymes in the seedlings in order to reduce the harmful effect of H2O2. Increased concentrations of photosynthetic pigments, soluble phenols, proline, alkaloids and changes in flavonoids are some other examples of proof of changes in the secondary metabolism, as a global defense reaction of plants to the stress induced by cold plasma treatments [81,82,83]. So, plasma treatments with high concentrations of ROS can alter the expression of genes for both primary (growth) and secondary (defense) metabolism [84]. This explains the fact that the non-thermal plasma treatments with high concentrations of RONS have the potential to increase the content of therapeutic biocompounds [78,85,86,87].

4.3. Correlations between Cytogenetic Parameters and Biometric Parameters

In the present study, the cytogenetic research demonstrated that there is a linear relationship between the mitotic index and the genotoxic index of PAW-treated wheat cells, expressed by a high negative correlation. The values of the biometric parameters increase with the augmentation of the mitotic index and decrease with the augmentation of the genotoxic index. Evidence for this includes the experimental variants V4, V6 and V8, with the lowest mitotic indices and the highest genotoxic indices, resulting in the lowest values of biometric parameters. On the contrary, V3, V5 and, especially, V7 had the highest mitotic indices and the lowest genotoxic indices, leading to the highest values of the biometric parameters. Most studies show a negative correlation between the plasma exposure time and its stimulatory effect on the physiological parameters [27,46,59,60,78,83,86].

5. Conclusions

PAW obtained from non-thermal plasma generated into ambient air at atmospheric pressure had different effects on wheat grains depending on the H2O2 and NO3 doses and the pH of the solution. The PAW variants with the highest dose of H2O2 (13–22 mg/L) in combination with the highest dose of NO3 (49–68 mg/L) and a low pH (3.9–4.1) were responsible for the reduced mitotic activity, the induction of the highest frequency of genetic abnormalities in wheat cells and the reduced germination rate, root length and shoot length of wheat sprouts.
The reduction in the mitotic activity, as compared to the untreated control, suggests the inhibition of DNA biosynthesis, namely, the manifestation of the cytotoxic potential of PAW, which was directly proportional to the doses of H2O2, and NO3 in the plasma composition.
The induced genetic abnormalities demonstrate the genotoxic potential of PAW, whose intensity was directly proportional to the doses of H2O2 and NO3 in the plasma composition. The diversity of the types of genetic abnormalities identified indicates that PAW can be considered an aneugenic and clastogenic mutagen for plants in an RONS dose- and pH-dependent manner. Identifying the types of PAW-induced genetic abnormalities in Triticum aestivum root tips has provided a better understanding of how PAW acts at a cellular level. Chromosomal bridges and micronuclei were the most common PAW-induced genetic abnormalities.
PAW variants with a low plasma profile of H2O2 (1–5 mg/L) and NO3(8–15 mg/L) and a pH 5.1–5.5 had a positive effect on the dynamics of the germination of the wheat grains and on the growth of wheat seedling roots and shoots. Out of these PAW treatment variants, only one experimental variant stood out, in which the root and shoot length significantly exceeded the control.
We recommend that the PAW treatments that we have shown to be potentially harmful to plants should be kept under control, especially since the use of non-thermal plasmas in agriculture has been increasing. In this respect, the establishment of precise and as-low-as-possible doses of reactive species with a pH as close as possible to 7 in the plasma composition would be necessary for minimally invasive PAW variants that are compatible with plant genome stability and in order to contribute to the increase in the agricultural yield.
Knowing that the use of non-thermal plasma is an ecological technology with the potential to stimulate the physiological processes, we consider that further research is necessary in order to establish the optimal combinations and concentrations of plasmatic parameters that may ensure increases in the agricultural yield.

Author Contributions

Conceptualization, S.P. and R.B.; methodology, S.P., R.B., A.P., V.S., D.D., O.B., D.E.C. and D.A; validation, S.P. and R.B.; formal analysis, S.P. and A.P.; investigation, S.P. and R.B.; resources, S.P. and R.B.; data curation, S.P. and A.P.; writing—original draft preparation, S.P., R.B. and O.B.; writing—review and editing, S.P., R.B., A.P., O.B. and D.E.C.; visualization, S.P. and R.B.; supervision, S.P. and R.B.; project administration, R.B., S.P. and D.A.; funding acquisition, R.B. and D.A. All authors have read and agreed to the published version of the manuscript.

Funding

This research was funded by a grant from the Romanian Ministry of Education and Research, CNCS-UEFISCDI, project PN-III-P2-2.1-PED-2019-0556 (contract 361PED/2020) within PNCDI III.

Data Availability Statement

The data presented in this study are available upon request from the authors.

Conflicts of Interest

The authors declare no conflict of interest.

References

  1. Mandici, A.; Cretu, D.E.; Burlica, R.; Astanei, D.; Beniuga, O.; Rosu, C.; Topa, D.C.; Aostacioaei, T.G.; Aprostosoaie, A.C.; Miron, A. Preliminary study on the impact of non-thermal plasma activated water on the quality in Triticum aestivum L. cv. Glosa sprouts. Horticulturae 2022, 8, 1158. [Google Scholar] [CrossRef]
  2. Herianto, S.; Shih, M.K.; Lin, C.M.; Hung, Y.C.; Hsieh, C.W.; Wu, J.S.; Chen, M.H.; Chen, H.L.; Hou, C.Y. The effects of glazing with plasma-activated water generated by a piezoelectric direct discharge plasma system on whiteleg shrimp (Litopenaeus vannamei). LWT 2022, 154, 112547. [Google Scholar]
  3. Naumova, I.K.; Maksimov, A.I.; Khlyustova, A.V. Stimulation of the germinability of seeds and germ growth under treatment with plasma-activated water. Surf. Eng. Appl. Electrochem. 2011, 47, 263–265. [Google Scholar]
  4. Khadre, A.; Yousef, A.E. Sporicidal action of ozone and hydrogen peroxide: A comparative study. Int. J. Food Microbiol. 2001, 71, 131–138. [Google Scholar]
  5. Fridman, G.; Brooks, A.D.; Balasubramanian, M.; Fridman, A.; Gutsol, A.; Vasilets, V.N.; Ayan, H.; Friedman, G. Comparison of direct and indirect effects of non-thermal atmospheric pressure plasma on bacteria. Plasma Process. Polym. 2007, 4, 370–375. [Google Scholar]
  6. Dobrynin, D.; Fridman, G.; Friedman, G.; Fridman, A. Physical and biological mechanisms of direct plasma interaction with living tissue. New J. Phys. 2009, 11, 115020. [Google Scholar]
  7. Ma, R.; Wang, G.; Tian, Y.; Wang, K.; Zhang, J.; Fang, J. Non-thermal plasma-activated water inactivation of food-borne pathogen on fresh produce. J. Hazard. Mater. 2015, 300, 643–651. [Google Scholar]
  8. Shen, J.; Tian, Y.; Li, Y.; Ma, R.; Zhang, Q.; Zhang, J.; Fang, J. Bactericidal effects against S. aureus and physicochemical properties of plasma activated water stored at different temperatures. Sci. Rep. 2016, 6, 28505. [Google Scholar]
  9. Traylor, M.J.; Pavlovich, M.J.; Karim, S.; Hait, P.; Sakiyama, Z.; Clark, D.S.; Graves, D.B. Long-term antibacterial efficacy of air plasma-activated water. J. Phys. D Appl. Phys. 2011, 44, 472001. [Google Scholar]
  10. Park, D.P.; Davis, K.; Gilani, S.; Alonzo, C.A.; Dobrynin, D.; Friedman, G.; Fridman, A.; Rabinovich, A.; Fridman, G. Reactive nitrogen species produced in water by non-equilibrium plasma increase plant growth rate and nutritional yield. Curr. Appl. Phys. 2013, 13, S19–S29. [Google Scholar]
  11. Leksakul, K.; Vichiansan, N.; Kaewkham, P.; Hattaphasu, B.; Boonyawan, D. Generating nitrate and nitrite on green oak lettuce in hydroponic farming by plasma system. Appl. Eng. Agric. 2021, 37, 105–112. [Google Scholar]
  12. Thirumdas, R.; Kothakota, A.; Annapure, U.S.; Siliveru, K.; Blundell, R.; Gatt, R.; Valdramidis, V.P. Plasma activated water (PAW): Chemistry, physico-chemical properties, applications in food and agriculture. Trends Food Sci. Technol. 2018, 77, 21–31. [Google Scholar]
  13. Oehmigen, K.; Hähnel, M.; Brandenburg, R.; Wilke, G.; Weltmann, K.-D.; Von Woedtke, T. The role of acidification for antimicrobial activity of atmospheric pressure plasma in liquids. Plasma Med. 2010, 7, 250–257. [Google Scholar]
  14. Leti, L.-I.; Gerber, I.C.; Mihaila, I.; Galan, P.-M.; Strajeru, S.; Petrescu, D.-E.; Cimpeanu, M.-M.; Topala, I.; Gorgan, D.-L. The modulatory effects of non-thermal plasma on seed’s morphology, germination and genetics–A Review. Plants 2022, 11, 2181. [Google Scholar] [PubMed]
  15. Zhang, K.; Zhang, G.; Liu, X.; Phan, A.N.; Luo, K. A study on CO2 decomposition to CO and O2 by the combination of catalysis and dielectric-barrier discharges at low temperatures and ambient pressure. Ind. Eng. Chem. Res. 2017, 56, 3204–3216. [Google Scholar]
  16. Liu, C.J.; Ye, J.; Jiang, J.; Pan, Y. Progresses in the preparation of coke resistant Ni-based catalyst for steam and CO2 reforming of methane. Chemcatchem 2015, 3, 529–541. [Google Scholar]
  17. Bolouki, N.; Kuan, W.H.; Huang, Y.Y.; Hsieh, J.H. Characterizations of a plasma-water system generated by repetitive microsecond pulsed discharge with air, nitrogen, oxygen, and argon gases species. Appl. Sci. 2021, 11, 6158. [Google Scholar]
  18. Graves, D.B. The emerging role of reactive oxygen and nitrogen species in redox biology and some implications for plasma applications to medicine and biology. J. Phys. D Appl. Phys. 2012, 45, 263001. [Google Scholar]
  19. Wang, H.; Guo, H.; Wu, Q.; Zhou, G.; Yi, C. Effect of activated carbon addition on H2O2 formation and dye decoloration in a pulsed discharge plasma system. Vacuum 2016, 128, 99–105. [Google Scholar]
  20. Guo, L.; Xu, R.; Gou, L.; Liu, Z.; Zhao, Y.; Liu, D.; Zhang, L.; Chen, H.; Kong, M.G. Mechanism of virus inactivation by cold atmospheric-pressure plasma and plasma-activated water. Appl. Environ. Microbiol. 2018, 84, e00726-18. [Google Scholar]
  21. Herianto, S.; Hou, C.Y.; Lin, C.M.; Chen, H.L. Nonthermal plasma-activated water: A comprehensive review of this new tool for enhanced food safety and quality. CRFSFS 2021, 20, 583–626. [Google Scholar]
  22. Puač, N.; Gherardi, M.; Shiratani, M. Plasma agriculture: A rapidly emerging field. Plasma Proces. Polym. 2018, 15, 1700174. [Google Scholar]
  23. Ranieri, P.; Sponsel, N.; Kizer, J.; Rojas-Pierce, M.; Hernández, R.; Gatiboni, L.; Grunden, A.; Stapelmann, K. Plasma agriculture: Review from the perspective of the plant and its ecosystem. Plasma Process. Polym. 2021, 18, 2000162. [Google Scholar]
  24. Waskow, A.; Howling, A.; Furno, I. Mechanisms of plasma-seed treatments as a potential seed processing technology. Front. Phys. 2021, 9, 617345. [Google Scholar]
  25. Imlay, J.; Chin, S.; Linn, S. Toxic DNA damage by hydrogen peroxide through the Fenton reaction in vivo and in vitro. Science 1988, 240, 640–642. [Google Scholar]
  26. Nakano, R.; Tashiro, K.; Aijima, R.; Hayashi, N. Effect of oxygen plasma irradiation on gene expression in plant seeds induced by active oxygen species. Plasma Med. 2016, 6, 303–313. [Google Scholar]
  27. Peťková, M.; Švubová, R.; Kyzek, S.; Medvecká, V.; Slováková, L.; Sevcovicova, A.; Gálová, E. The effects of cold atmospheric pressure plasma on germination parameters, enzyme activities and induction of DNA damage in barley. Int. J. Mol. Sci. 2021, 22, 2833. [Google Scholar] [PubMed]
  28. Burlicǎ, R.; Astanei, D.; Creţu, D.E.; Dîrlǎu, I.D.; Beniugǎ, O.; Padureanu, S.; Stoleru, V.; Patras, A. Non-thermal plasma t-shaped reactor for activated water production. EEMJ 2021, 20, 397–404. [Google Scholar]
  29. Sarinont, T.; Katayama, R.; Wada, Y.; Koga, K.; Shiratani, M. Plant growth enhancement of seeds immersed in plasma activated water. MRS Adv. 2017, 2, 995–1000. [Google Scholar]
  30. Shelar, A.; Singh, A.V.; Dietrich, P.; Maharjan, R.S.; Thissen, A.; Didwal, P.N.; Shinde, M.; Laux, P.; Luch, A.; Mathe, V.; et al. Emerging cold plasma treatment and machine learning prospects for seed priming: A step towards sustainable food production. RCS Adv. 2022, 12, 10467–10488. [Google Scholar]
  31. Constantin, M.J.; Owens, E.T. Introduction and perspectives plant genetic and cytogenetic assay. Mutat. Res. 1982, 99, 1–12. [Google Scholar]
  32. Fiskesjö, G. The Allium test as a standard in environmental monitoring. Hereditas 1985, 102, 99–112. [Google Scholar]
  33. Khanna, N.; Sharma, S. Allium cepa root chromosomal aberration assay. A review. Indian J. Pharm. Biol. Res. 2013, 1, 105–119. [Google Scholar]
  34. Sehgal, R.; Roy, S.; Kumar, V.L. Evaluation of cytotoxic potential of latex of Calotropis procera and podophyllotoxin in Allium cepa. Biocell 2006, 30, 9–13. [Google Scholar] [PubMed]
  35. Abdul-Baki, A.A.; Anderson, J.D. Vigor determination in soybean seed by multiple criteria. Crop Sci. 1973, 13, 630–633. [Google Scholar]
  36. Marcano, L.; Carruyo, I.; Del Campo, A.; Montiel, X. Cytotoxicity and mode of action of maleic hydrazide in root tips of Allium cepa L. Environ. Res. 2004, 94, 221–226. [Google Scholar]
  37. Leme, D.M.; Marin-Morales, M.A. Allium cepa test in environmental monitoring: A review on its application. Mutat. Res. 2009, 682, 71–81. [Google Scholar]
  38. Mattar, M.Z.; Sammour, R.H.; Haroun, S.A.; Seada, M.L.L. Assessment of the genotoxicity of wastewater samples on Vicia faba L. Life Sci. 2014, 11, 991–998. [Google Scholar]
  39. Smaka-Kincl, V.; Stegnar, P.; Lovka, M.; Toman, M.J. The evaluation of waste, surface and ground water quality using the Allium test procedure. Mutat. Res. 1996, 368, 171–179. [Google Scholar]
  40. Da Silva Souza, T.; da Silva Figueira Barone, L.; Lacerda, D.; dos Santos Vergilio, C.; de Oliveira, B.C.V.; de Almeida, M.G.; Thompson, F.; de Rezende, C.E. Cytogenotoxicity of the water and sediment of the Paraopeba River immediately after the iron ore mining dam disaster (Brumadinho, Minas Gerais, Brazil). Sci. Total Environ. 2021, 775, 145193. [Google Scholar]
  41. Arjunan, K.P.; Sharma, V.K.; Ptasinska, S. Effects of atmospheric pressure plasmas on isolated and cellular DNA—A review. Int. J. Mol. Sci. 2015, 16, 2971–3016. [Google Scholar] [PubMed]
  42. Graves, D.B. Oxy-nitroso shielding burst model of cold atmospheric plasma therapeutics. Clin. Plasma Med. 2014, 2, 38–49. [Google Scholar]
  43. Naviaux, R.K. Oxidative shielding or oxidative stress? J. Pharmacol. Exp. Ther. 2012, 342, 608–618. [Google Scholar]
  44. Lu, X.; Naidis, G.V.; Laroussi, M.; Reuter, S.; Graves, D.B.; Ostrikov, K. Reactive species in non-equilibriu atmospheric-pressure plasmas: Generation, transport, and biological effects. Phys. Rep. 2016, 630, 1–84. [Google Scholar]
  45. Tero, R.; Yamashita, R.; Hashizume, H.; Suda, Y.; Takikawa, H.; Hori, M.; Ito, M. Nanopore formation process in artificial cell membrane induced by plasma-generated reactive oxygen species. Arch. Biochem. Biophys. 2016, 605, 26–33. [Google Scholar] [PubMed]
  46. Holubová, L.; Kyzek, S.; Ďurovcová, I.; Fabová, J.; Horváthová, E.; Ševčovičová, A.; Gálová, E. Non-Thermal Plasma—A New Green Priming Agent for Plants? Int. J. Mol. Sci. 2020, 21, 9466. [Google Scholar]
  47. Wende, K.; Landsberg, K.; Lindequist, U.; Weltmann, K.-D.; von Woedtke, T. Distinctive activity of nonthermal atmospheric-pressure plasma jet on eukaryotic and prokaryotic cells in a cocultivation approach of keratinocytes and microorganisms. IEEE Trans. Plasma Sci. 2010, 38, 2479–2485. [Google Scholar]
  48. Lunov, O.; Zablotskii, V.; Churpita, O.; Jäger, A.; Polívka, L.; Syková, E.; Dejneka, A.; Kubinová, Š. The interplay between biological and physical scenarios of bacterial death induced by non-thermal plasma. Biomaterials 2016, 82, 71–83. [Google Scholar] [PubMed]
  49. Morrison, K.A.; Akintayo, R.; Jin, J.; Kaymakcalan, O.; Weinreb, R.; Dong, X.; Westblade, L.F.; Golkowski, C.; Spector, J.A. Abstract: Non-thermal plasma treatment safely and rapidly eradicates MRSA from infected wounds. Plast. Reconstr. Surg.-Glob. Open 2016, 4, 52–53. [Google Scholar]
  50. Waskow, A.; Betschart, J.; Butscher, D.; Oberbossel, G.; Klöti, D.; Büttner-Mainik, A.; Adamcik, J.; Von Rohr, P.R.; Schuppler, M. Characterization of efficiency and mechanisms of cold atmospheric pressure plasma decontamination of seeds for sprout production. Front. Microbiol. 2018, 9, 3164. [Google Scholar]
  51. Yasuda, H.; Hashimoto, M.; Rhaman, M.M.; Takashima, K.; Mizuno, A. States of biological components in bacteria and bacteriophages during inactivation by atmospheric dielectric barrier discharges. Plasma Process. Polym. 2008, 5, 615–621. [Google Scholar]
  52. Mai-Prochnow, A.; Clauson, M.; Hong, J.; Murphy, A.B. Gram positive and gram negative bacteria differ in their sensitivity to cold plasma. Sci. Rep. 2016, 6, 38610. [Google Scholar] [PubMed]
  53. Ptasinska, S.; Bahnev, B.; Stypczynska, A.; Bowden, M.; Mason, N.J.; Braithwaite, N.S.J. DNA strand scission induced by a non-thermal atmospheric pressure plasma jet. Phys. Chem. Chem. Phys. 2010, 12, 7779–7781. [Google Scholar]
  54. Stypczyńska, A.; Ptasińska, S.; Bahnev, B.; Bowden, M.; Braithwaite, N.S.J.; Mason, N.J. The influence of amino acids on DNA damage induced by cold plasma radiation. Chem. Phys. Lett. 2010, 500, 313–317. [Google Scholar]
  55. Kyzek, S.; Holubová, L.; Medvecká, V.; Zahoranová, A.; Sevcovicová, A.; Gálová, E. Genotoxic effect of low temperature plasma treatment on plant seeds. Toxicol. Lett. 2017, 280, S119. [Google Scholar]
  56. Kyzek, S.; Holubová, Ľ.; Medvecká, V.; Tomeková, J.; Gálová, E.; Zahoranová, A. Cold atmospheric pressure plasma can induce adaptive response in pea seeds. Plasma Chem. Plasma Process. 2019, 39, 475–486. [Google Scholar]
  57. Crawford, D.R.; Davies, K.J. Adaptive response and oxidative stress. EHP 1994, 102, 25–28. [Google Scholar]
  58. Tomeková, J.; Kyzek, S.; Medvecká, V.; Gálová, E.; Zahoranová, A. Influence of cold atmospheric pressure plasma on pea seeds: DNA damage of seedlings and optical diagnostics of plasma. Plasma Chem. Plasma Process. 2020, 40, 1571–1584. [Google Scholar]
  59. Švubová, R.; Kyzek, S.; Medvecká, V.; Slováková, Ľ.; Gálová, E.; Zahoranová, A. Novel insight at the effect of cold atmospheric pressure plasma on the activity of enzymes essential for the germination of pea (Pisum sativum L. cv. Prophet) seeds. Plasma Chem. Plasma Process. 2020, 40, 1221–1240. [Google Scholar]
  60. Švubová, R.; Slováková, Ľ.; Holubová, Ľ.; Rovňanová, D.; Gálová, E.; Tomeková, J. Evaluation of the impact of cold atmospheric pressure plasma on soybean seed germination. Plants 2021, 10, 177. [Google Scholar]
  61. Yemeli, G.B.N.; Švubová, R.; Kostolani, D.; Kyzek, S.; Machala, Z. The effect of water activated by nonthermal air plasma on the growth of farm plants: Case of maize and barley. Plasma Process. Polym. 2021, 18, 2000205. [Google Scholar]
  62. Yi, H.; Meng, Z. Genotoxicity of hydrated sulfur dioxide on root tips of Allium sativum and Vicia faba. Mutat. Res. 2003, 537, 109–114. [Google Scholar] [PubMed]
  63. Luo, L.Z.; Werner, K.M.; Gollin, S.M.; Saunders, W.S. Cigarette smoke induces anaphase bridges and genomic imbalances normal cells. Mutat. Res. 2004, 554, 375–385. [Google Scholar]
  64. Türkoğlu, S. Genotoxicity of five food preservatives tested on root tips of Allium cepa L. Mutat. Res. 2007, 626, 4–14. [Google Scholar] [PubMed]
  65. Adams, T.; Kerisew, B. Assessment of cytotoxicity and genotoxicity potential of effluents from Bahir Dar tannery using Allium cepa. Adv. Public Health 2022, 2022, 1–10. [Google Scholar]
  66. Anirban, P.; Nag, S.; Sinha, K. Cytological effects of blitox on root mitosis of Allium cepa L. IJSRP 2013, 3, 1–7. [Google Scholar]
  67. Daphedar, A.; Taranath, T.C. Cytotoxic and genotoxic effect of biofabricated zinc nanoparticles on mitotic chromosomes of Drimia polyantha (Roxb.) Jessop. IJPCBS 2018, 8, 53–63. [Google Scholar]
  68. Gomes, J.V.; dos Santos Teixeira, J.T.; Moreira de Lima, V.; Borba, R.H. Induction of cytotoxic and genotoxic effects of Guandu river waters in the Allium cepa system. Ambient. Água 2015, 10, 48–58. [Google Scholar]
  69. Badar, A. Mitodepressive and chromotoxic activities of two herbicides in Allium cepa. Cytologia 1983, 48, 451–457. [Google Scholar]
  70. Türkoğlu, Ş. Genotoxic effects of mono-, di-, and trisodiumphosphate on mitotic activity, DNA content, and nuclear volume in Allium cepa L. Caryologia 2009, 62, 171–179. [Google Scholar]
  71. Fernandes, T.C.C.; Mazzeo, D.E.C.; Marin-Morales, M.A. Mechanism of micronuclei formation in polyploidizated cells of Allium cepa exposed to trifluralin herbicide. Pest. Biochem. Physiol. 2007, 88, 252–259. [Google Scholar]
  72. Kaushik, N.K.; Uhm, H.; Ha Choi, E.H. Micronucleus formation induced by dielectric barrier discharge plasma exposure in brain cancer cells. Appl. Phys. Lett. 2012, 100, 084102. [Google Scholar]
  73. Halliwell, B. Oxidative stress and neurodegeneration: Where are we now? J. Neurochem. 2006, 97, 1634–1658. [Google Scholar]
  74. Shrivastav, M.; de Haro, L.P.; Nickolof, J.A. Regulation of DNA double-strand break repair pathway choice. Cell Res. 2008, 18, 134–147. [Google Scholar] [PubMed]
  75. Sivachandiran, L.; Khacef, A. Enhanced seed germination and plant growth by atmospheric pressure cold air plasma: Combined effect of seed and water treatment. RSC Adv. 2017, 7, 1822–1832. [Google Scholar]
  76. Arc, E.; Galland, M.; Godin, B.; Cueff, G.; Rajjou, L. Nitric oxide implication in the control of seed dormancy and germination. Front. Plant Sci. 2013, 4, 1–13. [Google Scholar]
  77. Dröge, W. Free radicals in the physiological control of cell function. Physiol. Rev. 2002, 82, 47–95. [Google Scholar]
  78. Mildažiene, V.; Pauzaite, G.; Nauciené, Z.; Malakauskiene, A.; Zukiene, R.; Januskaitiene, I.; Jakstas, V.; Ivanauskas, L.; Filatova, I.; Lyushkevich, V. Pre-sowing seed treatment with cold plasma and electromagnetic field increases secondary metabolite content in purple coneflower (Echinacea purpurea) leaves. Plasma Process. Polym. 2018, 15, 1700059. [Google Scholar]
  79. Šera, B.; Šery, M. Non-thermal plasma treatment as a new biotechnology in relation to seeds, dry fruits, and grains. Plasma Sci. Technol. 2018, 20, 044012. [Google Scholar]
  80. Hayashi, N.; Ono, R.; Nakano, R.; Shiratani, M.; Tashiro, K.; Kuhara, S.; Yasuda, K.; Hagiwara, H. DNA microarray analysis of plant seeds irradiated by active oxygen species in oxygen plasma. Plasma Med. 2016, 6, 459–471. [Google Scholar]
  81. Caverzan, A.; Passaia, G.; Rosa, S.B.; Ribeiro, C.W.; Lazzarotto, F.; Margis-Pinheiro, M. Plant responses to stresses: Role of ascorbate peroxidase in the antioxidant protection. Genet. Mol. Biol. 2012, 35, 1011–1019. [Google Scholar]
  82. Ghasempour, M.; Iranbakhsh, A.; Ebadi, M.; Oraghi Ardebili, Z. Seed priming with cold plasma improved seedling performance, secondary metabolism, and expression of deacetylvindoline O-acetyltransferase gene in Catharanthus roseus. Contrib. Plasma Phys. 2020, 60, e201900159. [Google Scholar]
  83. Noormohammadi, Z.; Mohammadzadeh-Shahir, M.; Fahmi, D.; Atyabi, S.M.; Farahani, F. Induced genetic and morphological changes in Catharanthus roseus L. by cold atmospheric plasma. Nova Biol. Reper. 2019, 6, 302–310. [Google Scholar]
  84. Stolárik, T.; Henselová, M.; Martinka, M.; Novák, O.; Zahoranová, A.; Cernák, M. Effect of low-temperature plasma on the structure of seeds, growth and metabolism of endogenous phytohormones in pea (Pisum sativum L.). Plasma Chem. Plasma Proc. 2015, 35, 659–676. [Google Scholar]
  85. Zhang, J.J.; Jo, J.O.; Huynh, D.L.; Mongre, R.K.; Ghosh, M.; Singh, A.K.; Lee, S.B.; Mok, I.S.; Hyuk, P.; Jeong, D.K. Growth-inducing effects of argon plasma on soybean sprouts via the regulation of demethylation levels of energy metabolism-related genes. Sci. Rep. 2017, 7, 41917. [Google Scholar] [PubMed] [Green Version]
  86. Jiang, J.; He, X.; Li, L.; Li, J.; Shao, H.; Xu, Q.; Ye, R.; Dong, Y. Effect of cold plasma treatment on seed germination and growth of wheat. Plasma Sci. Technol. 2014, 16, 54. [Google Scholar]
  87. Mildažienė, V.; Aleknavičiūtė, V.; Žūkienė, R.; Paužaitė, G.; Naučienė, Z.; Filatova, I.; Lyushkevich, V.; Haimi, P.; Tamošiūnė, I.; Baniulis, D. Treatment of common sunflower (Helianthus annus L.) seeds with radio-frequency electromagnetic field and cold plasma induces changes in seed phytohormone balance, seedling development and leaf protein expression. Sci. Rep. 2019, 9, 6437. [Google Scholar]
Figure 1. The experimental setup of the non-thermal plasma system: HVPS–High voltage power supply, HVP–High voltage probe, P-pump, PAW–Plasma activated water, E1–High voltage electrode, E2–Ground electrode, RSH–shunt.
Agronomy 13 00459 g001
Figure 2. Frequency of genetic abnormalities in wheat root meristem metaphases induced by non-thermal plasma-activated water treatment. Bars are means of three replicates/experimental variant ± SD. The letters (a–c) show significant differences, p < 0.05.
Agronomy 13 00459 g002
Figure 3. Frequency of genetic abnormalities in wheat root meristem ana-telophases induced by non-thermal plasma-activated water treatment. Bars are means of three replicates/experimental variant ± SD. The letters (a–e) show significant differences, p < 0.05.
Agronomy 13 00459 g003
Figure 4. Frequency of genetic abnormalities in wheat root meristem interphases induced by non-thermal plasma-activated water treatment. Bars are means of three replicates/experimental variant ± SD. The letters (a–d) show significant differences, p < 0.05.
Agronomy 13 00459 g004
Figure 5. Correlation between the genotoxic index (%) and mitotic index (%) in wheat root meristem cells treated with non-thermal plasma-activated water.
Agronomy 13 00459 g005
Figure 6. Types of genetic abnormalities induced by non-thermal plasma-activated water identified in Triticum aestivum root meristems: (a) c–metaphase; (b) sticky chromosomes in metaphase; (c) anaphase with a thin and whole bridge; (d) telophase with whole and broken bridges; (e) telophase with a laggard chromosome and a broken bridge; (f) telophase with a broken bridge and chromosomal fragments; (g) telophase with a whole bridge; (h) sticky chromosomes in telophase:multiple whole and broken bridges; (i) early telophase with a chromosomal fragment; (j) sticky chromosomes in multipolar ana-telophase: a whole bridge and a broken one; (k) two telophases with whole and broken multiple bridges; (l) telophase with a thin, whole bridge; (m) interphase with a very small micronucleus; (n) interphase with a medium-sized micronucleus; (o) interphases with two micronuclei of different sizes; (p) interphase with a large micronucleus; (q,r) autopolyploid giant nuclei; the microphotographs (ag,i,k,o) were taken with an Oxion microscope; the microphotographs (h,j,ln,pr) were taken with a Leica microscope (magnification: 1000×).
Agronomy 13 00459 g006aAgronomy 13 00459 g006bAgronomy 13 00459 g006c
Table 1. Electrical and chemical parameters of the PAW treatment variants.
Variant of PAWH2O2
(mg/L)
±5%
NO3
(mg/L)
±10%
Frequency
(Hz)
Pulse
(ms)
Q Air
(L/min)
Q Water
(mL/min)
pH
C0000007
V173015021104.6
V284025021104.4
V33146021205.1
V41349250213.334.1
V5515601.51255.1
V614552501.513.333.9
V71825022.5855.5
V8226825022.543.8
Table 2. Mitotic Index and distribution of mitotic phases on the root tips of Triticum aestivum treated with non-thermal plasma-activated water.
PAW Treatment VariantMean Number of Cells/VariantMitotic Index (%)Cells in Prophase
(%)
Cells in Metaphase
(%)
Cells in Anaphase
(%)
Cells in Telophase
(%)
C7603.3318.99 ± 3.00 e7.95 ± 1.00 e4.16 ± 0.78 c2.54 ± 1.00 bc4.34 ± 0.34 b
V17296.0013.92 ± 1.00 bc6.21 ± 0.87 cd3.53 ± 1.01 c1.95 ± 0.69 ab2.23 ± 1.15 a
V27706.3313.43 ± 1.94 bc7.34 ± 0.54 de2.22 ± 0.95 a1.16 ± 0.93 a2.71 ± 0.44 a
V37652.3315.81 ± 0.61 cd6.83 ± 0.50 cde4.12 ± 0.13 c2.15 ± 0.02 ab2.71 ± 0.02 a
V47666.3310.31 ± 0.89 a4.60 ± 0.30 b1.91 ± 0.35 a1.51 ± 0.44 ab2.29 ± 0.60 a
V57653.6715.13 ± 1.17 c6.56 ± 0.40 cd3.40 ± 0.40 bc2.52 ± 0.52 bc2.65 ± 0.65 a
V67762.6610.11 ± 0.59 a3.50 ± 0.50 a2.44 ± 0.04 ab1.82 ± 0.40 ab2.35 ± 0.35 a
V77747.6617.70 ± 0.91 de6.12 ± 0.12 c4.28 ± 0.28 c3.37 ± 0.37 c3.93 ± 0.27 b
V87734.0012.26 ± 0.06 ab5.84 ± 0.84 c2.33 ± 0.33 a1.70 ± 0.70 ab2.39 ± 0.25 a
Data represent mean values ± standard deviation. The letters (a–e) show significant differences, p < 0.05.
Table 3. Frequency of genetic abnormalities in mitotic phases on the root tips of Triticum aestivum treated with non-thermal plasma-activated water treatment.
PAW Treatment VariantCells in Metaphase (%)Cells in A-T (%)Cells in InterphaseGI (%)
Normal Metaphase (%)Aberrant Metaphase (%)Normal
A-T (%)
Aberrant
A-T (%)
Normal Interphase (%)Aberrant Interphase (%)
C4.16 ± 0.78 b0.00 ± 0.00 a6.70 ± 1.33 c0.18 ± 0.03 a80.93 ± 3.01 a0.08 ± 0.02 a0.26 ± 0.03 a
V13.50 ± 1.00 b0.03 ± 0.00 ab3.37 ± 0.52 ab0.81 ± 0.09 c84.98 ± 1.06 c1.10 ± 0.11 bc1.94 ± 0.12 c
V22.17 ± 0.94 a0.05 ± 0.01 abc2.97 ± 0.22 ab0.90 ± 0.10 c84.90 ± 2.02 c1.67 ± 0.10 c2.62 ± 0.14 d
V34.02 ± 0.11 b0.1 ± 0.03 bc4.26 ± 0.22 ab0.60 ± 0.10 b83.55 ± 0.65 bc0.64 ± 0.09 ab1.34 ± 0.26 bc
V41.59 ± 0.33 a0.32 ± 0.05 d2.58 ± 0.54 a1.22 ± 0.02 d86.32 ± 1.09 c3.37 ± 0.86 e4.91 ± 0.87 f
V53.29 ± 0.42 b0.11 ± 0.04 c4.72 ± 1.22 b0.45 ± 0.05 b84.26 ± 1.23 bc0.61 ± 0.09 ab1.17 ± 0.05 b
V62.08 ± 0.10 a0.36 ± 0.06 d2.87 ± 0.09 a1.30 ± 0.05 d85.99 ± 0.38 c3.90 ± 0.36 e5.56 ± 0.41 g
V74.16 ± 0.25 b0.12 ± 0.07 c6.90 ±0.73 c0.40 ± 0.02 b81.76 ± 0.99 ab0.54 ± 0.08 ab1.06 ± 0.14 b
V82.03 ± 0.34 a0.30 ± 0.04 d2.89 ± 0.41 a1.20 ± 0.10 d85.19 ± 0.34 c2.55 ± 0.39 d4.05 ± 0.45 e
Data represent mean values ± standard deviation. The letters (a–g) show significant differences, p < 0.05.
Table 4. Germination dynamics of wheat grains represented by the germination rate (%) after non-thermal plasma-activated water treatments.
PAW Treatment VariantGermination Rate of Grains (%)
After 48 hAfter 72 hAfter 96 hAfter 120 h
C78.00 ± 1.73 bc89.33 ± 2.08 c91.33 ± 5.03 b92.33 ± 2.08 b
V172.00 ± 7.00 ab82.00 ± 4.58 b90.00 ± 4.36 b92.66 ± 4.93 b
V275.66 ± 4.93 abc87.33 ± 1.53 bc91.33 ± 2.52 b91.66 ± 2.31 b
V379.00 ± 1.73 bc87.66 ± 4.04 bc89.00 ± 3.46 b92.00 ± 1.73 b
V468.00 ± 2.00 a70.00 ± 6.00 a71.00 ± 3.00 a79.00 ± 2.00 a
V571.66 ± 4.04 ab89.00 ± 3.46 bc89.00 ± 8.54 b93.33 ± 6.51b
V668.33 ± 5.03 a71.00 ± 2.00 a73.00 ± 3.00 a73.00 ± 3.00 a
V781.33 ± 5.13 c90.33 ± 5.77 c92.33 ± 6.81b92.33 ± 5.03 b
V869.66 ± 0.58 a71.33 ± 1.15 a72.33 ± 1.15 a74.00 ± 1.00 a
Data represent mean values ± standard deviation. The letters (a–c) show significant differences, p < 0.05.
Table 5. Dynamics of embryonic root length growth in wheat under the influence of non-thermal plasma-activated water treatments.
PAW Treatment VariantRoot Length (mm)
After 48 hAfter 72 hAfter 96 hAfter 120 h
C17.57 ± 2.94 bcd34.39 ± 2.11 b43.14 ± 3.19 bcd59.92 ± 5.65 bc
V115.08 ± 2.52 bc40.71 ± 2.82 b41.60 ± 1.91bc55.40 ± 1.17 bc
V219.10 ± 0.46 cd40.02 ± 2.93 b47.25 ± 5.49 cd49.62 ± 3.30 ab
V321.61 ± 1.09 d40.64 ± 2.13 b55.56 ± 4.29 d71.10 ± 5.79 d
V414.24 ± 2.54 b17.38 ± 2.26 a31.88 ± 4.24 ab49.29 ± 3.30 ab
V515.47 ± 0.21 bc37.80 ± 0.40 b51.33 ± 2.15 cd65.38 ± 3.83 cd
V61.58 ± 0.22 a15.52 ± 1.20 a25.21 ± 1.35 a39.15 ± 4.31a
V717.97 ± 1.91 bcd42.72 ± 1.83 b54.94 ± 7.17 d74.44 ± 4.26 d
V817.54 ± 2.29 bcd37.55 ± 1.85 b40.79 ± 2.23 bc52.56 ± 2.09 b
Data represent mean values ± standard deviation. The letters (a–d) show significant differences, p < 0.05.
Table 6. Dynamics of wheat shoot length growth under the influence of non-thermal plasma-activated water treatments.
PAW Treatment VariantShoot Length (mm)
After 48 hAfter 72 hAfter 96 hAfter 120 h
C7.01 ± 1.03 bc18.76 ± 3.18 a29.09 ± 1.13 b43.5 ± 5.73 ab
V17.91 ± 0.05 c14.97 ± 1.75 a28.37 ± 2.12 b41.10 ± 4.33 ab
V27.45 ± 1.23 bc15.60 ± 0.73 a16.33 ± 0.99 a34.51 ± 0.31 ab
V37.25 ± 0.92 bc19.77 ± 1.76 a34.24 ± 1.59 b46.27 ± 1.37 ab
V46.91 ± 0.27 bc17.19 ± 1.32 a29.00 ± 2.88 b29.77 ± 3.91 a
V57.39 ± 0.45 bc15.7 ± 2.17 a29.04 ± 1.89 b44.92 ± 2.27 ab
V60.50 ± 0.02 a17.19 ± 1.32 a17.91 ± 0.21 a34.90 ± 2.26 ab
V77.42 ± 0.30 bc17.69 ± 1.60 a31.83 ± 3.87 b50.89 ± 3.63 b
V86.13 ± 0.98 b16.33 ± 0.99 a28.31 ± 1.52 b33.26 ± 1.35 ab
Data represent mean values ± standard deviation. The letters (a–c) show significant differences at p < 0.05.
Table 7. Correlations between cytogenetic parameters and biometric parameters in wheat treated with non-thermal plasma-activated water.
Correlated ParametersCorrelation Coefficient (R2)
After 48 hAfter 72 hAfter 96 hAfter 120 h
MI (%) correlated to Germination Rate (%)0.7590.7720.6840.612
GI (%) correlated to Germination Rate (%)−0.647−0.877−0.829−0.829
MI (%) correlated to Root Length (%)0.3580.4740.5660.643
GI (%) correlated to Root Length (%)−0.445−0.609−0.687−0.668
MI (%) correlated to Shoot Length (%)0.2920.1640.2610.719
GI (%) correlated to Shoot Length (%)−0.457−0.054−0.259−0.706
Disclaimer/Publisher’s Note: The statements, opinions and data contained in all publications are solely those of the individual author(s) and contributor(s) and not of MDPI and/or the editor(s). MDPI and/or the editor(s) disclaim responsibility for any injury to people or property resulting from any ideas, methods, instructions or products referred to in the content.

