Abstract
The use of farm dairy effluents (FDE) has become a promising alternative to increase pasture yield while reducing the environmental impact of waste accumulation into streams, but other environmental implications should be considered. The present study aimed to assess the effect of application of either raw FDE or lagoon-stored FDE compared to dissolved urea or a non-amended control on N2O emission, soil N dynamics, functional microbial activity, and the yield and N-use efficiency of a fescue pasture. The normalized N application rate of 200 kg N ha−1 was divided into four seasonal events in a greenhouse experiment. Similar fescue forage production with FDE or urea positioned FDE application to soil as an alternative disposal. The repeated application of raw effluent delivered more organic C to the soil which induced an increase in enzyme activities, a shift in the catabolic activity of the soil microbial community, and greater N mineralization potential. On the other hand, urea addition decreased the functional activity of the soil microbial community. However, N2O emissions were greater for the raw effluent, so lagoon-stored effluent is an alternative to manage FDE under these conditions, avoiding urea addition and enhancing soil metabolic activity.
1. Introduction
Uruguay has a dairy herd of 759,000 and an annual milk production of 2.3 million tons, exporting 70% of its production [1]. Milk production in the country is predominantly pasture-based and managed with the input of N fertilizers [2]. In pasture-based systems, cows spend a few hours a day in the milking parlor or standing in the waiting yard. As a result, around 8100 million liters of farm dairy effluents (FDE) are generated annually in the country [3]. FDE contain a mixture of dairy cow feces and urine deposited during milking and subsequently diluted with wash-down water during the cleaning of the milking parlor [4].
In this predominantly pasture-based system, the dairy industry is increasingly attempting to maximize returns achievable through better utilization of grass with lesser inputs. Land application of FDE is a recommended practice in order to avoid direct discharge to waterways [5] and due to its recognized nutrient value, it reduces the need for purchased commercial fertilizer. This practice can provide organic matter for soil and pastures, recovering the nutrients from animal feeding within a framework of circular economy [6].
Milk production based mainly on grazing systems is important in Oceania and South American countries [7] and generates FDE with low dry matter content. The application of FDE for fertilization is a recommended practice to minimize reliance on synthetic chemical inputs [8] and to irrigate pastures or crops. In South America, FDE are used without treatment or with solid sedimentation and are sometimes stored in a two-lagoon system [9]. Generally, FDE are applied to the field by surface application (tanks or irrigation pumps) throughout the year [10]. In Australia, land application of FDE increased plant productivity [11] and injection and surface application were less prone to contaminating groundwater due to N losses [12].
Two-stage stabilization lagoons can remove significant amounts of suspended solids and organic contaminants, but may not be very effective in the removal of N and P [13]. Only considering N supply, inappropriate application rates or timing can lead to poor utilization by plants, causing nitrate leaching and groundwater contamination, or surface water contamination. In addition, soil nitrogen imbalances can lead to gaseous losses as nitrous oxide (N2O) emissions and volatilization of ammonia [14]. Agriculture is the principal source of N2O in Uruguay [15], and so the abatement of this potent greenhouse gas emission is essential for the country and the sustainability of the dairy industry to continue exporting products [16].
FDE are a significant source of available N and labile C with a high water content that can induce anaerobiosis in soil after their application [17]. These aspects are some of the factors that control the emission of N2O [18]. Hence, FDE application as an organic soil amendment can affect the soil’s organic C pool, nutrient content, and microbial activities [19]. The quantity and quality of organic C in FDE, depending on biodegradability and C:N ratio, may influence soil microbial activity and function and, thus, the turnover of mineral N after FDE application to the soil–plant system [20].
Since the majority of soil functions are microbially mediated, the diversity of the microbial community is essential in maintaining functioning terrestrial ecosystems [21]. Microbial functional diversity is defined as “the sum of the ecological processes, and/or capacity to use different substrates developed by the organisms of a community” [22]. In the past decades, different methodological approaches have been used for monitoring microbial functional diversity; among them, the most common are enzyme activities and community-level physiological profiling (CLPP) techniques [23]. Soil CLPP analysis with Biolog ECO-platesTM has demonstrated repeatability, discriminating power, and sensitivity for many factors [24]. Functional diversity measures derived from using enzyme activities inform us on general soil biological functioning, including not only the actual living microbial activity, but also the past biochemical activity still operating within the soil matrix, while CLPP provides an instant photograph of microbial physiology [23,25].
Studies about dairy effluents’ application to substitute N fertilization and the effect on the functional diversity of soil communities are scarce. Neufald et al. [26] reported that FDE, when compared to mineral fertilizer application, increased soil microbial biomass and activity and changed the ratio of bacterial to fungal biomass and soil microbial community structure. Applying FDE can increase microbial biomass and activity in soils, while community structure and catabolic capability remain resilient [27] or change depending on the type of manure treatment and rate of irrigation [28]. Therefore, determining the changes in the soil microbial functional diversity and activity resulting from FDE application is important to evaluate the effect of effluents on soil health [29].
The present work aimed to improve the understanding of the impact of the productive use of dairy effluents on pasture yield, microbial activity, and functional diversity and assess the environmental concern related to nutrient losses as N2O emissions. Through a greenhouse experiment, we compared the effects of seasonal application of equal amounts of total N as raw dairy effluent (RDE), lagoon-stored dairy effluent (LDE), or urea in pots planted with tall fescue (Festuca arundinacea Schreb.). We hypothesized that FDE application would promote microbial activity and soil N dynamics and, thus, increase pasture yield compared to synthetic fertilization. Simultaneously, RDE and LDE soil application may produce larger N2O emissions than urea.
2. Materials and Methods
2.1. Dairy Effluent and Soil Collection
Dairy effluents were collected from the dairy farm of Centro Regional Sur from the Faculty of Agronomy (Universidad de la República) with geographic coordinates 34°36′47.83″ S and 56°12′54.00″ W. The RDE was flushed from the barn floor and sampled fresh from a holding tank after solid sedimentation. For the LDE sampling, a total of 2 L was collected from four different points (north, south, east, and west) of a facultative lagoon system on the same day. The samples were stored in a plastic container and refrigerated at 4 °C once they reached the laboratory. The FDE were collected at the start of the experiment (September 2018) and before each application to the greenhouse pot experiment (November 2018, January 2019, and March 2019). Total N content was determined for both effluents at each sampling date.
The soil was collected from the topsoil layer (0–15 cm depth) of a field in the Faculty of Agronomy (34°50 S, 56°13 W). The soil was a Mollisol with 5.0%, 70.9%, and 24.1% proportions of sand, silt, and clay, respectively. The soil pH was 6.4, and the exchangeable cation contents were K, 2.0; Ca, 14.0; Mg, 3.1; and Na 0.3 cmol kg−1.
2.2. Experimental Design
The greenhouse pot experiment was maintained for eight months. Pots containing 4 kg of homogenized soil were sown with Festuca arundinacea cv. Tacuabé (four plants per pot), whose seeds were supplied by the National Institute for Seeds (INASE). The experiment had a randomized block design with three replicates for soil analysis and five replicates for gas sampling. The N fertilizer treatments included four applications to pasture soil at an equivalent rate of 50 kg N ha−1, i.e., 20 mg N kg of pot soil−1 consisting of (1) LDE, (2) RDE, (3) synthetic nitrogen fertilizer (Urea), and (4) a non-amended control (Control). All applications were performed in solution adjusted to the same final volume per pot; the same amount of tap water (pH: 6.9, electric conductivity (EC): 2 mS cm−1) was added to the control. The first application was at seeding. Consecutive fertilization/harvesting cycles of 45 days, simulating the typical management of fescue forage cuts, were performed three times. The final cut was performed two months after the last application of treatments. The fescue forage was cut manually at a height of 5 cm. The leachate was collected in trays beneath the pots and replenished to prevent nutrient loss by percolating the excess water when irrigated. During the whole trial period, each pot was weighed and watered to maintain 50% of the water-holding capacity when needed. Additionally, soil samples for some microbial activities and mineral N determinations were collected on the day of each treatment application and 7, 30, and 45 days after applications. The number of pots was considered to be destructively sampled after 45 days of each treatment application. The samples were collected from ten random soil cores from depths of 0 to 10 cm of the upper soil layer from each replicated pot, homogenized by hand, composited, mixed thoroughly, and sieved (2 mm mesh). Soil samples were kept at 4 °C for enzymatic activities and microbial physiological profiling at the end of the experiment.
2.3. Characterization of Farm Dairy Effluents (FDE)
The pH and EC were measured in a mixture of effluent and deionized water (1:2.5 v/v) by potentiometry. Total solids (TS) and suspended solids (SS) were analyzed following the standard procedure of APHA [30]. Total organic carbon (TOC) was analyzed by oxidation with potassium dichromate following Mebius’s technique [31]. Total nitrogen (TN) was analyzed by the Kjeldahl method [32]. Ammoniacal N (NH4+–N) in filtered suspensions was determined by colorimetric analysis according to Rhine et al. [33]. Organic N was calculated as TN content − NH4+–N.
2.4. Soil Chemical Analysis
At the end of the experiment, two months after the fourth application of FDE, soil samples were collected from each pot and chemical properties were determined. The soil was dried at 45 °C until a constant weight was reached. The soil’s mineral N (NO3−–N and NH4+–N) was extracted with a 2 M KCl solution, and colorimetric analysis was used to determine NH4+–N according to Rhine et al. [33] and NO3−–N according to Mulvaney [34]. Soil organic carbon was quantified by the Walkley–Black wet combustion method [35]. N mineralization (sum N_min) was estimated by the sum of NO3−–N and NH4+–N content (mg pot−1) plus the total N content in the aboveground biomass of fescue plants (mg pot−1) as per Arló et al. [36].
2.5. Forage Yield and Nitrogen Fertilizer Replacement Value
The aboveground biomass obtained at the final forage cut was dried at 65 °C for 48–72 h (until a constant weight was reached) and ground to pass through a 0.5 mm mesh. After that, the total N content was determined in forage biomass by the Kjeldahl method [32].
N uptake was calculated as the sum of total N content in the forage biomass of each cut. As the same amount of N was applied in both forms of the amendment (either synthetic fertilizer or FDE), the N-use efficiency (NUE) per pot was calculated as the subtraction of N uptake of the control from those of each treatment divided by the applied N [37].
Nitrogen fertilizer replacement value (NFRV %) was calculated as NUE effluent/NUE synthetic fertilizer × 100 [37].
2.6. Nitrous Oxide Emission
N2O fluxes were measured by the static chamber–gas chromatography method. The sampling chambers (diameter: 20 cm, height: 20 cm) were inserted 5 cm deep into the pot’s soil. The lid was fitted with a sampling port with a three-way valve and placed on top of the box at the beginning of each gas sampling day, when temperatures were recorded. Headspace gas samples were obtained with airtight 20 mL propylene syringes and were immediately transferred to pre-evacuated 12 mL glass Exetainer® vials (Labco Ltd., Buckinghamshire, UK). The sampling times were 0 min, 20 min, and 40 min. The sampling was carried out periodically after every N addition event for at least 20 days. The N2O concentrations were measured by gas chromatography on a GC-FID-mECD 7890 Agilent gas chromatograph with a HayeSep Q 80/100 mesh 1/8 column. To calculate gas flux rates from the soil’s surface to the chamber atmosphere, a linear increase in gas concentration over time was assumed as described previously [38]. The cumulative N2O emissions after each cut/N-added application were calculated by adding all mass flux values during the measurement period (20 days after application). The net N2O mass flux between two measurement dates was calculated as the mean flux values of the two dates multiplied by the number of days between these dates [39].
Yield-scaled N2O flux for each N-added application refers to cumulative N2O emissions divided by forage biomass production.
2.7. Soil Potentially Mineralizable Nitrogen
Potentially mineralizable nitrogen (PMN) was determined using the anaerobic method [40]. The soil was made into a slurry and incubated at 40 °C and accumulation of soil PMN was determined after one week.
2.8. Soil Potential Nitrification Activity
The assay for potential nitrification activity (PNA) was carried out using a microscale method based on ISO 15685 [41]. Briefly, 2.5 g of fresh soil was placed in a 50 mL flask, and a solution with 300 mM KH2PO4, 700 mM K2HPO4, 10 mM sodium chlorate, and 1.5 mM (NH4)2SO4 was added to create a 10 mL slurry. The reaction was incubated at 25 °C and shaken at 175 rpm. After 24 h, 1 mL samples were collected and added to 1 mL 2 M KCl, briefly vortexed, and centrifuged to separate soil particles. The resulting supernatant was removed and NO2− concentration was determined spectrophotometrically at 540 nm with Griess–Ilosvay reagent.
2.9. Soil Microbial Enzyme Activities
Dehydrogenase activity was determined using [2-(p-iodophenyl)-3-(p-nitrophenyl)-5-phenyl tetrazolium chloride] solution (INT) as substrate, incubated for 2 h at 40 °C. The reduced iodonitrotetrazolium formazan (INTF) was extracted and photometrically measured at 464 nm [42].
The alkaline phosphatase enzyme was determined following Margesin [43] and expressed as µg p-nitrophenol (pNP) per gram of dry soil and incubation time.
Urease activity was determined by a modified method according to Kandeler [44]. Briefly, 5 g soil samples were incubated with 2.5 mL of urea solution at 37 °C for 2 h and the released NH4+ (extracted with 2 M KCl) was determined.
2.10. Microbial Community Physiological Profiling
CLPP of soil microbial populations was performed by the BIOLOG EcoPlates™ (Biolog®, Hayward, CA, USA) method based on carbon substrate utilization. Briefly, 10 g of soil was shaken for 30 min in 90 mL of sterile 0.01 M PBS and then allowed to settle for 10 min. Then, 125 μL of the supernatant was diluted 100-fold in sterile PBS, mixed, and finally used to inoculate the wells of the BIOLOG EcoPlates™. The plates were incubated at 25 °C and read every 24 h with a microtiter plate reader Multiskan FC (Thermo Scientific, Waltham, MA, USA) at 590 nm for six days. The optical density (OD) for each well was calculated by subtracting the control well values of each plate from the OD value of the well [45]. Microbial activity in each microplate/time point was expressed using average well color development (AWCD), calculated as the sum of wells with activity per plate, divided by the 31 carbon sources, and the general bacterial activity for each plate was calculated as the area under the curve (AUC).
Substrate richness, microbial functional diversity, and growth efficiency were calculated based on 96 h worth of data, using an OD of 0.5 as a threshold for positive response. The OD data for a given well were normalized by dividing by the mean absorbance for all wells [46]. Growth efficiency (GE) was calculated as total growth divided by richness.
The substrates were classified into six substrate guilds, namely amines, amino acids, carbohydrates, carboxylic acids, polymers, and phenolics, according to Insam [47]. Then, mean well color development for each guild after 96 h was calculated.
2.11. Statistical Analysis
A general linear mixed model was fitted to N dynamics variables (mineral N, PMN, and PNA) and N2O fluxes to compare differences between treatments and application dates, using treatment as a fixed effect in the analysis of variance with Infostat software [48]. Data were tested for normality using the Shapiro–Wilk test and, when not normally distributed, were log-transformed to meet normality assumptions. When log data did not have a normal distribution, they were analyzed using the non-parametric Kruskal–Wallis test followed by a Wilcoxon rank sum test to determine significant differences between treatments.
One-way ANOVA was used to analyze the effect of FDE on pasture yield and quality, and on the soil chemical and microbiological parameters at the end of the experimental period.
Differences between CLPP were analyzed with a multivariate analysis of variance (MANOVA) model using the ANOSIM test. In addition, the CLPP was further analyzed by principal component analysis (PCA) using a correlation similarity matrix with the ten carbon substrates that accounted for 50% of the variability (SIMPER test). PCA was carried out using the “prcomp” function in the ggplot2 package [49] of R software (version 4.1.0) (R Foundation for Statistical Analysis, Viena, Austria).
The least significant differences (LSD) at the level p ≤ 0.05 was used to determine significance for all analyses.
Pearson correlation was used to calculate the correlation coefficients of inorganic N (NH4+ + NO3−)–N, PMN, and PNA with N2O fluxes at the third and fourth application of treatments.
3. Results
3.1. Effluent Characterization
Data on the physical properties and chemical composition of the FDE applied to the pots are summarized in Table 1.

Table 1.
Characterization of Raw dairy effluent (RDE) and Lagoon dairy effluent (LDE) applied to pots with fescue pasture (mean n = 3 ± S.E).
The pH of both effluents was slightly basic and the RDE always presented lower pH values (7.3–8.4) for each sampling date than the LDE (8.3–8.5), which was more stable, but differences between FDE types were only significant in January and March (p < 0.05). Electrical conductivity was more or less stable for both dairy effluents across all sampling dates. RDE had significantly higher EC than LDE (on average 3.8 vs. 2.8 mS cm−1), except for the September sample. Dry matter content in both FDE was generally low (less than 2.5%) and differed slightly between dates.
Total N was always higher for RDE than LDE (205–517 vs. 137–241 mg L−1), although not significantly different in September; the highest N content was in the summer sample. The organic N fluctuated between 64 and 94% of the total N for the RDE and 70–82% for the LDE. The lowest % organic N/total N corresponded to the warmest sampling dates (January and March for the southern hemisphere). Most of the mineral N was presented as NH4+. The NH4+–N content in RDE was significantly higher than that in LDE, but in the September sample, the highest content was for LDE.
As is typical of RDE, organic C content was higher, with an average of 1325 mg L−1 (848–1825 mg L−1), while LDE had an average of 287 mg L−1, excluding the January sample, which exhibited an unexpectedly higher concentration (1242 mg L−1). For the September sample (end of the cool season), RDE registered less total C than the rest of the sampling dates and the highest C content was registered in November samples. C:N ratios of RDE were high for the September–November samples compared to the January–March sampling dates and tended to be higher than those of LDE, excluding the January sampling date. In the summer samples, the higher organic C content was also correlated with higher dry matter content and total N and, thus, a higher C:N ratio.
Data regarding FDE characteristics corrected with the volume applied to the pots in each application season appear in Table S1.
3.2. Yield and N Uptake of F. arundinacea
The effect of FDE applications to fescue pasture on biomass production is shown in Table 2. Neither accumulated biomass nor N uptake of total pasture cuts were significantly different between treatments, although RDE and Urea presented higher average values of yield and N uptake.

Table 2.
Total yield of F. arundinacea, N uptake, N-use efficiency (NUE), and N fertilizer replacement values (NFRV%) from raw (RDE) and lagoon dairy effluents (LDE) or urea fertilizer amendment soil (mean n = 3 ± S.E).
At the end of the experiment, with data from the last application, though not significantly different (p = 0.07), the average NUE of LDE was the lowest (0.15 g N pot−1) while that of Urea was 0.63 and that of RDE was 0.38 (Table 2).
The NFRV value was not significantly different between both FDE (p = 0.13), on average, it was 60% for RDE and 22% for LDE (Table 2).
3.3. N2O Fluxes and N Dynamics in Soils
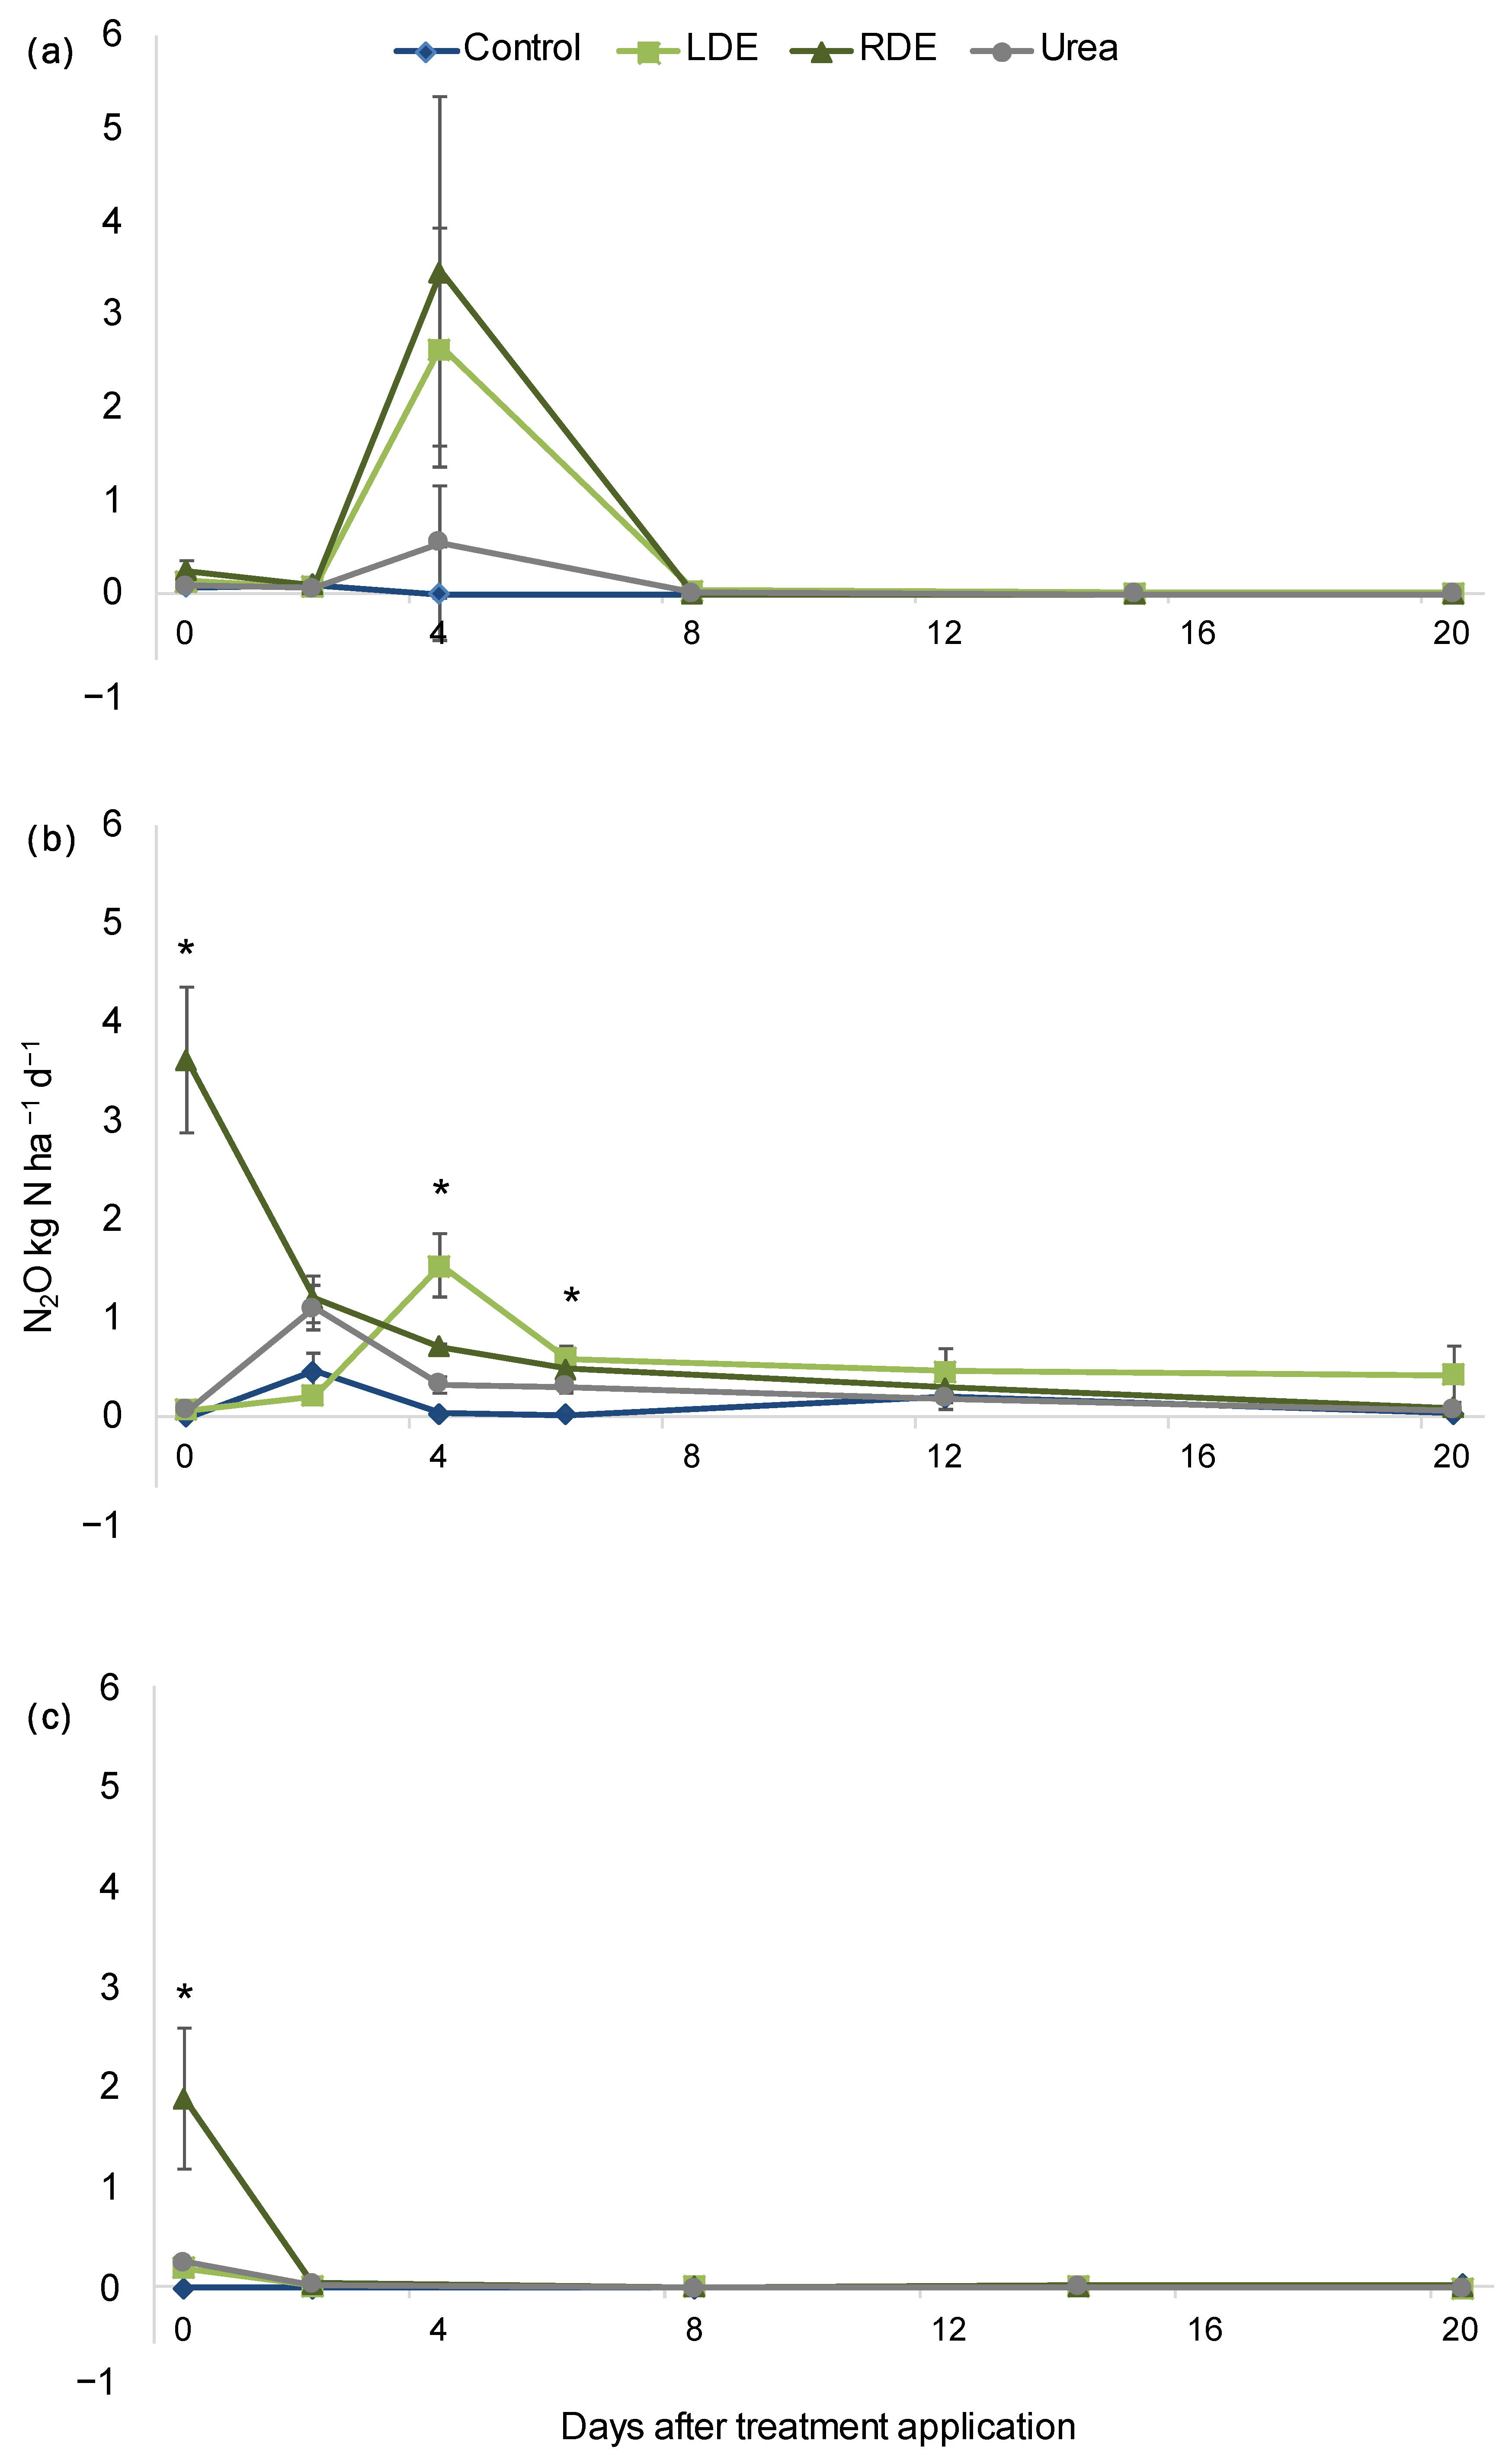
N2O fluxes peaked immediately after effluent application for up to 5 days for all dates of application measured (Figure 1). For the first application, there was no detected difference in N2O flux within treatments. After January applications, N2O emissions increased significantly (p < 0.05) in the RDE treatment compared with the other treatments on the day of application and remained elevated compared to Control 4 and 6 days after application. Notably, N2O fluxes from LDE were similar to those of RDE 4 and 6 days after application and were only greater than the control (Figure 1). After the last application (March), all N-amended treatments had greater N2O emissions than the control.
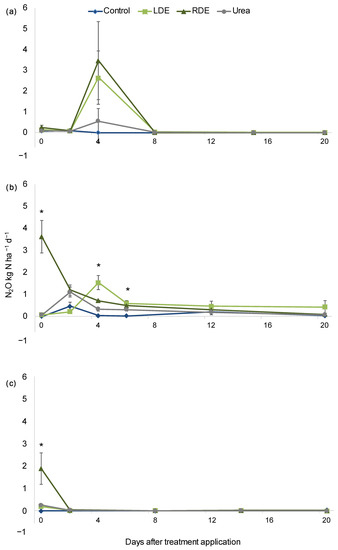
Figure 1.
Evolution of N2O fluxes after September (a), January (b), and March (c) application of Dairy effluents (DE), urea, or non-amended control (mean n = 5 ± S.E). (November application was not measured). Asterisks indicate sampling dates with significant differences within treatments at p < 0.05.
Nevertheless, when considering cumulative emissions of N2O–N for the 20 days after each application, only in the March application (the latter) did RDE increase the N2O fluxes over the other treatments (p = 0.03; Table S3). The yield-scaled N2O emission for the March application ranged from 1.1 to 5.1 mg N2O–N g forage−1, with the RDE treatment presenting the highest value, whereas there were no significant differences between treatments (Table S2).
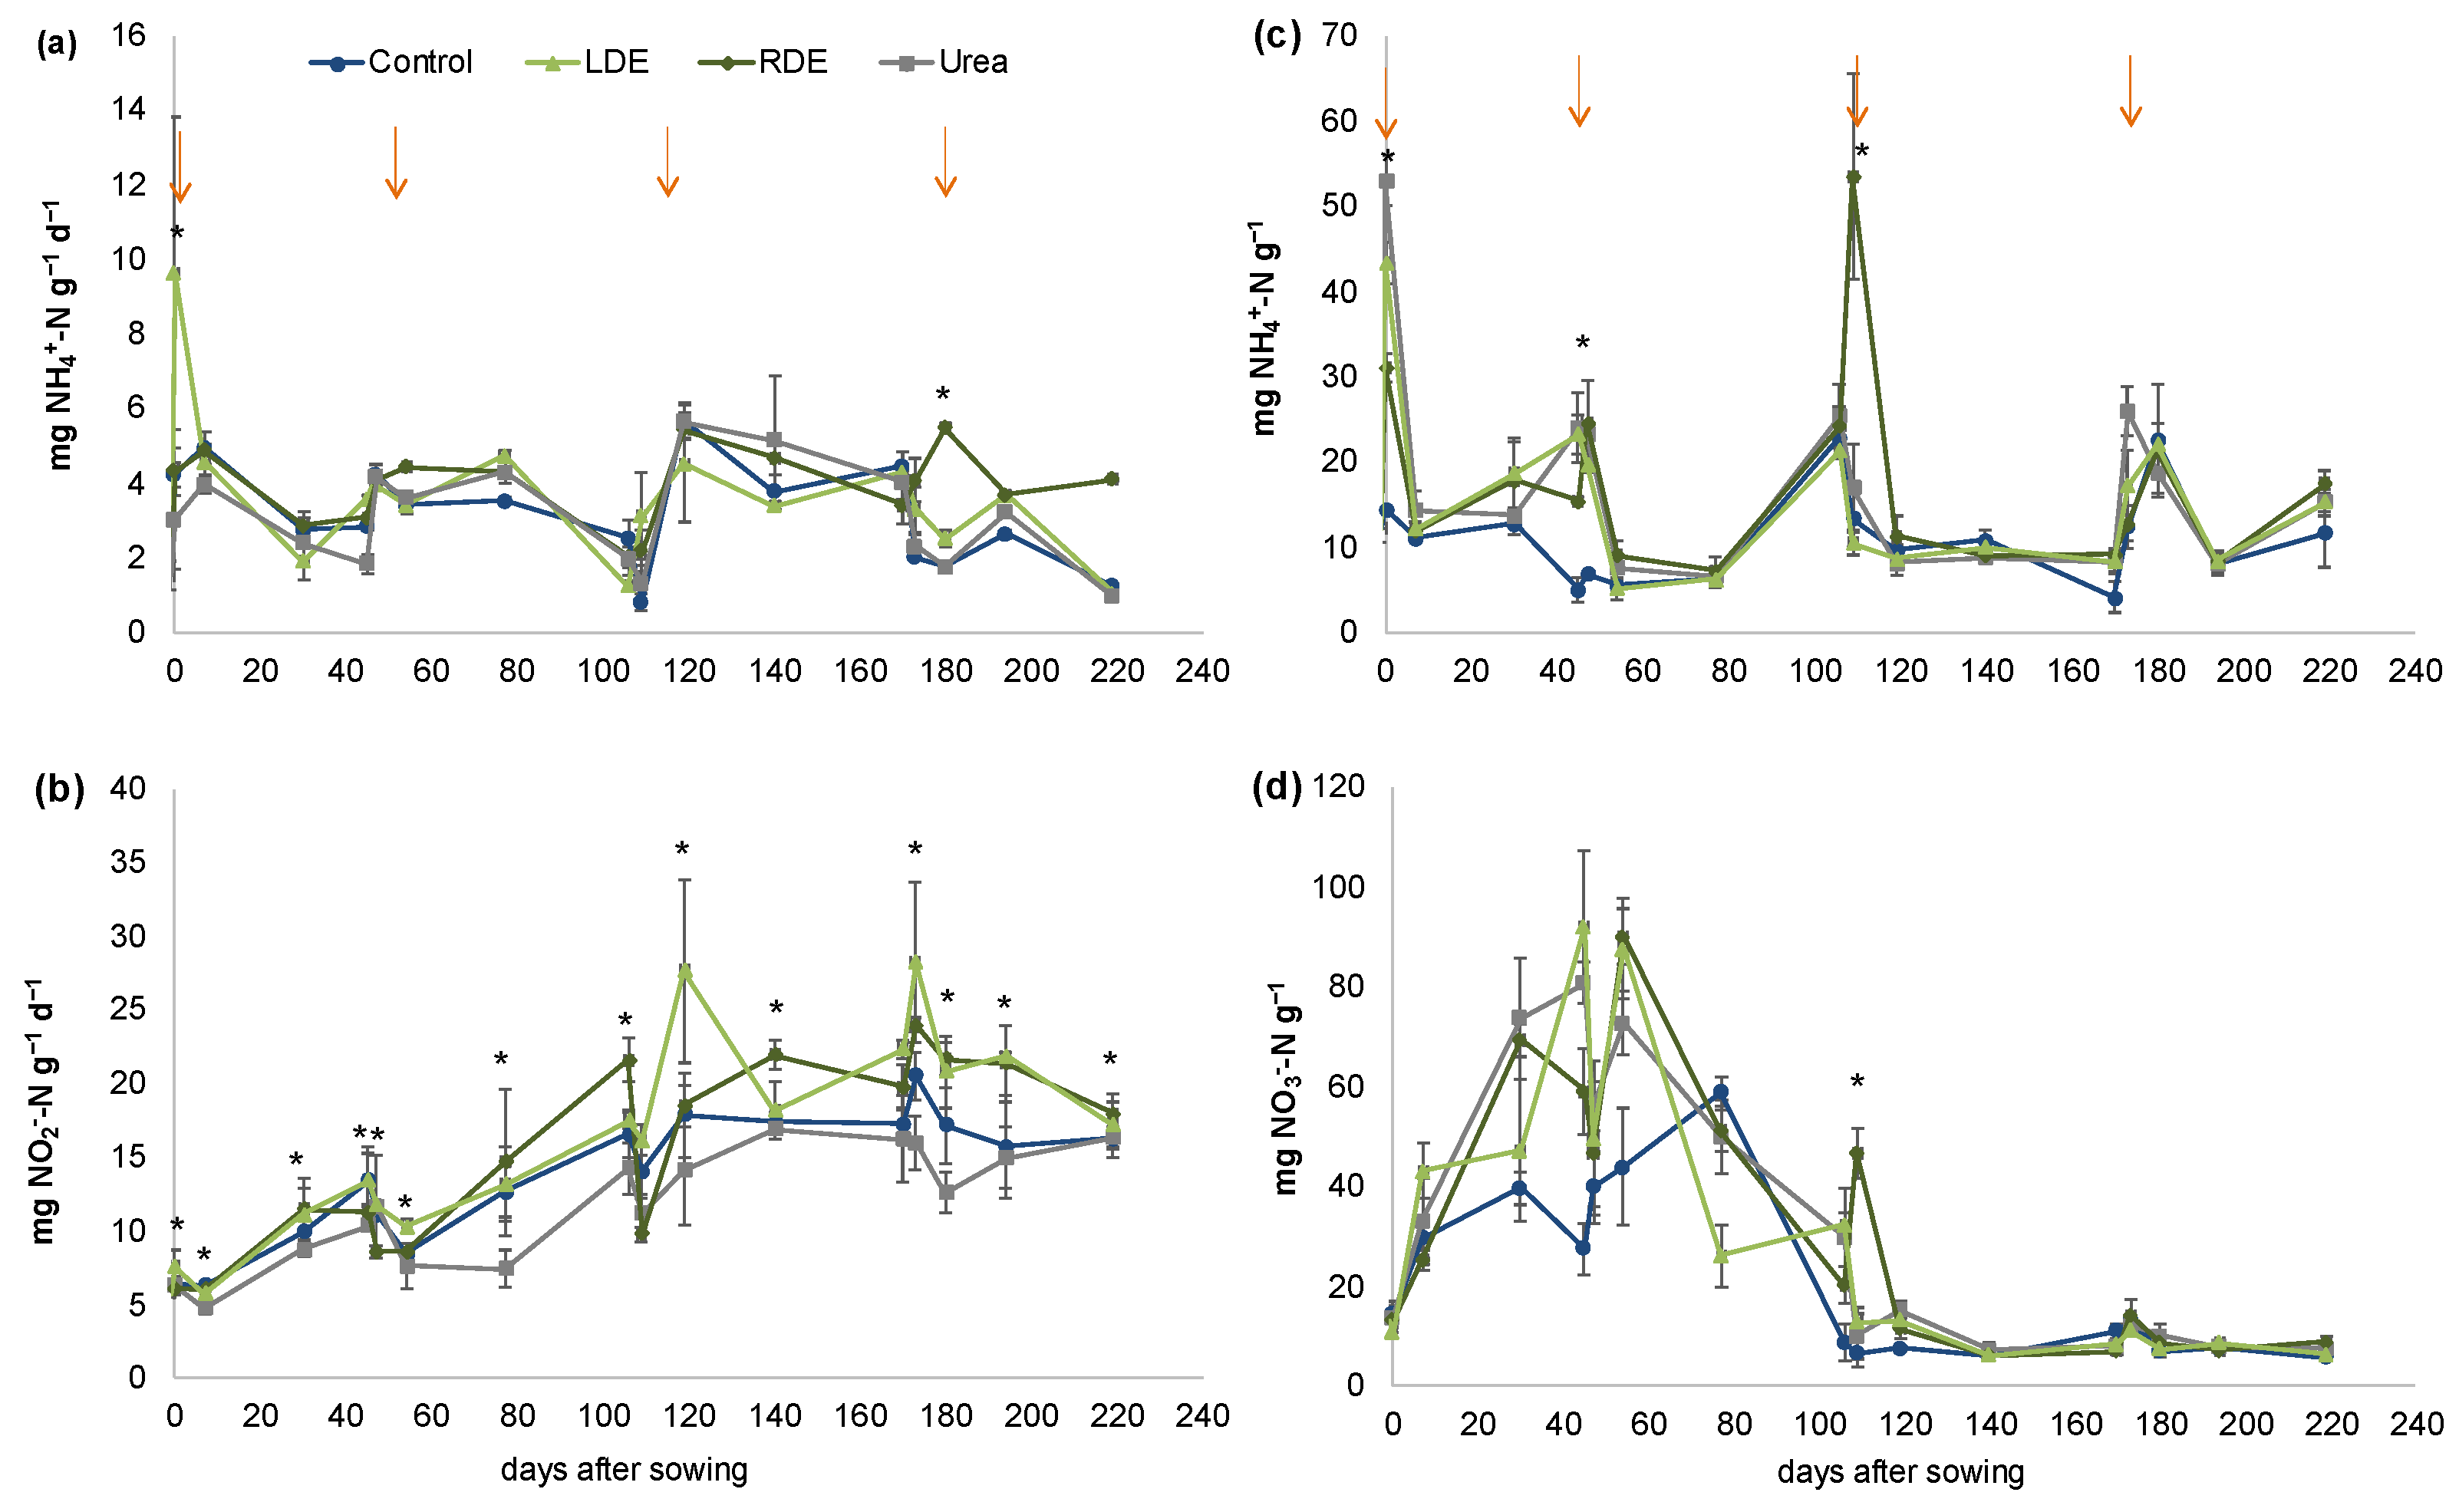
There was a significant interaction effect between the sampling date and treatment on soil PMN, NH4+–N, and NO3−–N content, indicating a varying response to the seasonal addition of N amendments measured over the 219-day experimental period (Figure 2).
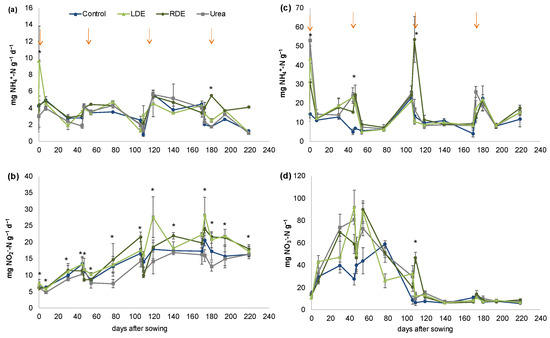
Figure 2.
Nitrogen dynamics in soil with fescue pasture with application of Raw (RDE) or Lagoon Dairy effluent (LDE), urea, and non-amended control (mean n = 3 ± S.E). Potentially mineralizable nitrogen (a), Potential nitrification activity (b), Ammonium (NH4+–N) content (c), Nitrate (NO3−–N) content (d). Arrows indicate treatment application. Asterisks indicate sampling dates with significant differences within treatments at p < 0.05.
LDE’s first application significantly increased PMN, but this effect disappeared thereafter (Figure 2a). Only after the fourth application did RDE significant increase PMN with respect to the rest of the treatments. When considering cumulative PMN after the last application, RDE increased PMN with respect to Control, Urea, and LDE and PMN declined in these treatments with respect to the rest of the applications (Table S3).
PNA was greater in soils with FDE compared with urea fertilization irrespective of the sampling date (p < 0.0001, Figure 2b). LDE increased PNA with respect to Control, but no significant differences were detected between control and RDE-amended soil (p < 0.05). PNA significantly increased after the third and fourth applications of treatments compared to the previous ones. When considering cumulative PNA at each application date, differences between soils with FDE and urea fertilization were more important in the last two applications (Table S3). Meanwhile, LDE increased cumulative PNA with respect to Urea on the third and fourth application dates, RDE only increased PNA after the fourth application, and no differences between FDE and non-amended soil were detected (Table S3).
The soil NH4+–N content peaked immediately after treatment application but significantly increased in FDE with respect to the control only after the first and second applications (Figure 2c). After the third application, the NH4+–N content significantly increased only in the RDE treatment and showed the highest levels therein.
The soil NO3−–N content was significantly higher for the first two N amendment applications compared with those thereafter (Figure 2d). The application of RDE significantly increased the soil NO3−–N content immediately after the third application, but no differences in NO3−–N content between treatments were further detected.
Both NH4+–N and NO3−–N contents were higher in soils with N amendments 45 days after sowing with the first application of treatments, but this increase in soil mineral N disappeared following successive amendment events. When considering accumulated mineral N during each application date, there was more mineral N available in the soil during the first application date than during the last two applications (Table S3). Accumulated mineral N during the first two application dates was higher for Urea and LDE than RDE, and all the N amendment treatments increased mineral N compared to non-amended soil. On the other hand, during the second application, mineral N was significantly higher in Urea and RDE compared to non-amended soil and there were no differences between both FDE treatments (Table S3). During the last two applications, there were no differences between treatments on accumulated soil mineral N.
Pearson’s correlation analysis showed that inorganic N concentrations had a strong positive relationship with N2O and NH4+–N with NO3−–N (Table S4). Significant positive relationships were also observed between PMN and PNA (Table S4).
When considering the soil N mineralization as the total N content in the pasture biomass plus the mineral N in the soil, RDE treatment increased the sum N_min compared to the control (Table S2).
3.4. Soil Microbiological Activities
The CLPP analysis carried out at the end of the experiment showed that the microbial activity of soil with urea addition was lower than those treated with FDE or control soil (AWCD, AUC, and GE, Table 3). FDE application did not increase the microbial activity with respect to the control soil. However, the indices of richness and diversity of FDE-amended soil and the other treatments were similar. Only a lower Shannon’s evenness (E) in carbon source utilization was observed in LDE (Table 3).

Table 3.
Substrate average color development (AWCD), the area under the curve (AUC), growth efficiency (GE), Shannon diversity index (H′), substrate richness (SR), and Shannon’s evenness (E) of the soil bacterial community of fescue pots after incubation for 96 h in Biolog EcoPlates with the application of RDE or LDE, urea, and non-amended control (mean n = 3 ± S.E). Different letters beside the numbers of each column indicate significant differences at p < 0.05.
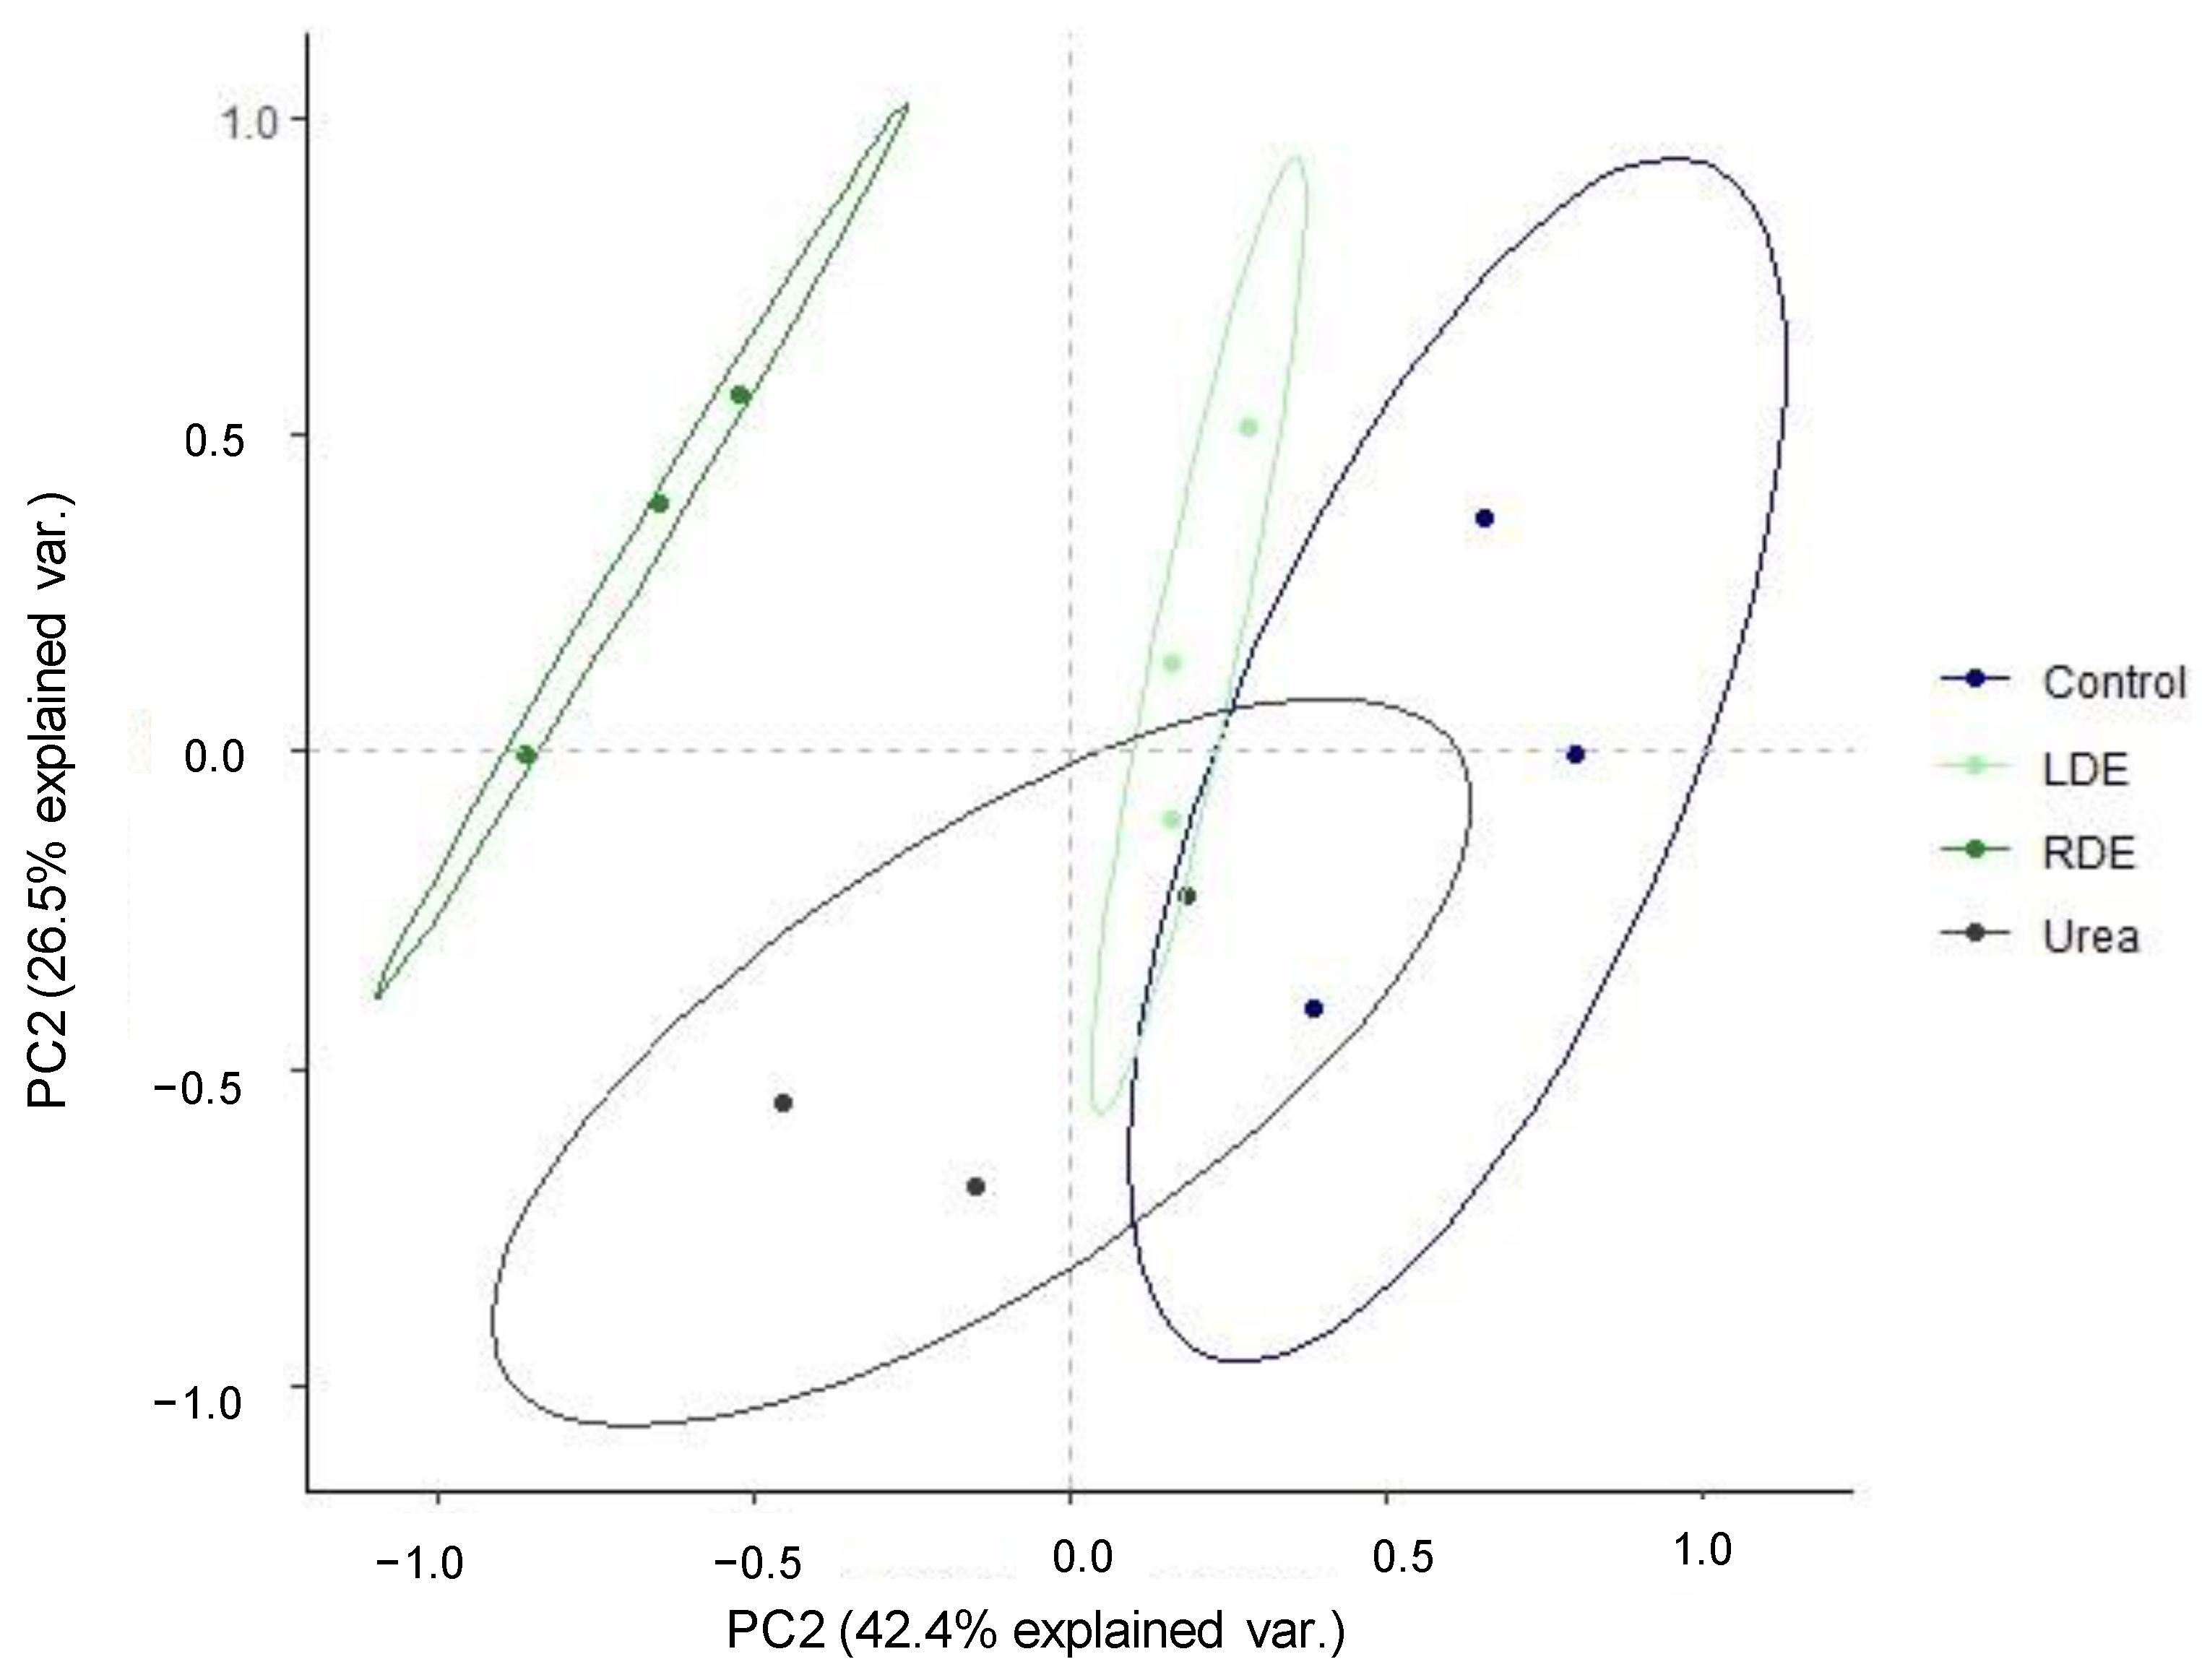
PCA visualization of general patterns was conducted for the CLPP in order to determine the extent of differentiation of FDE application with regard to carbon source utilization. The PCA showed a shift in the pattern of substrate utilization along PC1 with RDE clearly separated from the other treatments (Figure 3). The first and second PC explained 68.9% of the data variance.
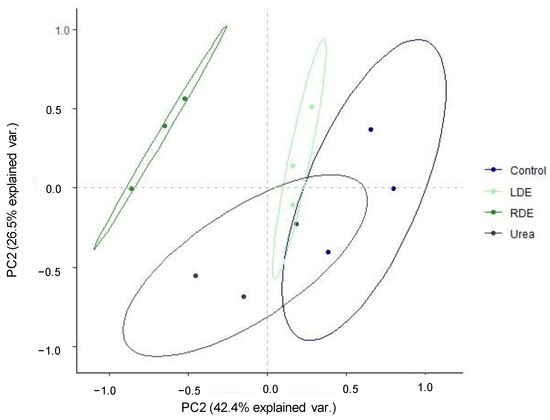
Figure 3.
Principal component analysis of Biolog EcoPlates incubated for 96 h containing pot soil of fescue pasture upon the application of raw dairy effluent (RDE), lagoon-stored effluent (LDE), urea, or no fertilization (control). Ellipses indicate 95% confidence intervals.
ANOSIM analysis supported this shift in carbon source utilization in response to soil RDE application (R = 0.73, p = 0.0002), indicating different functional diversity of soil microbiota.
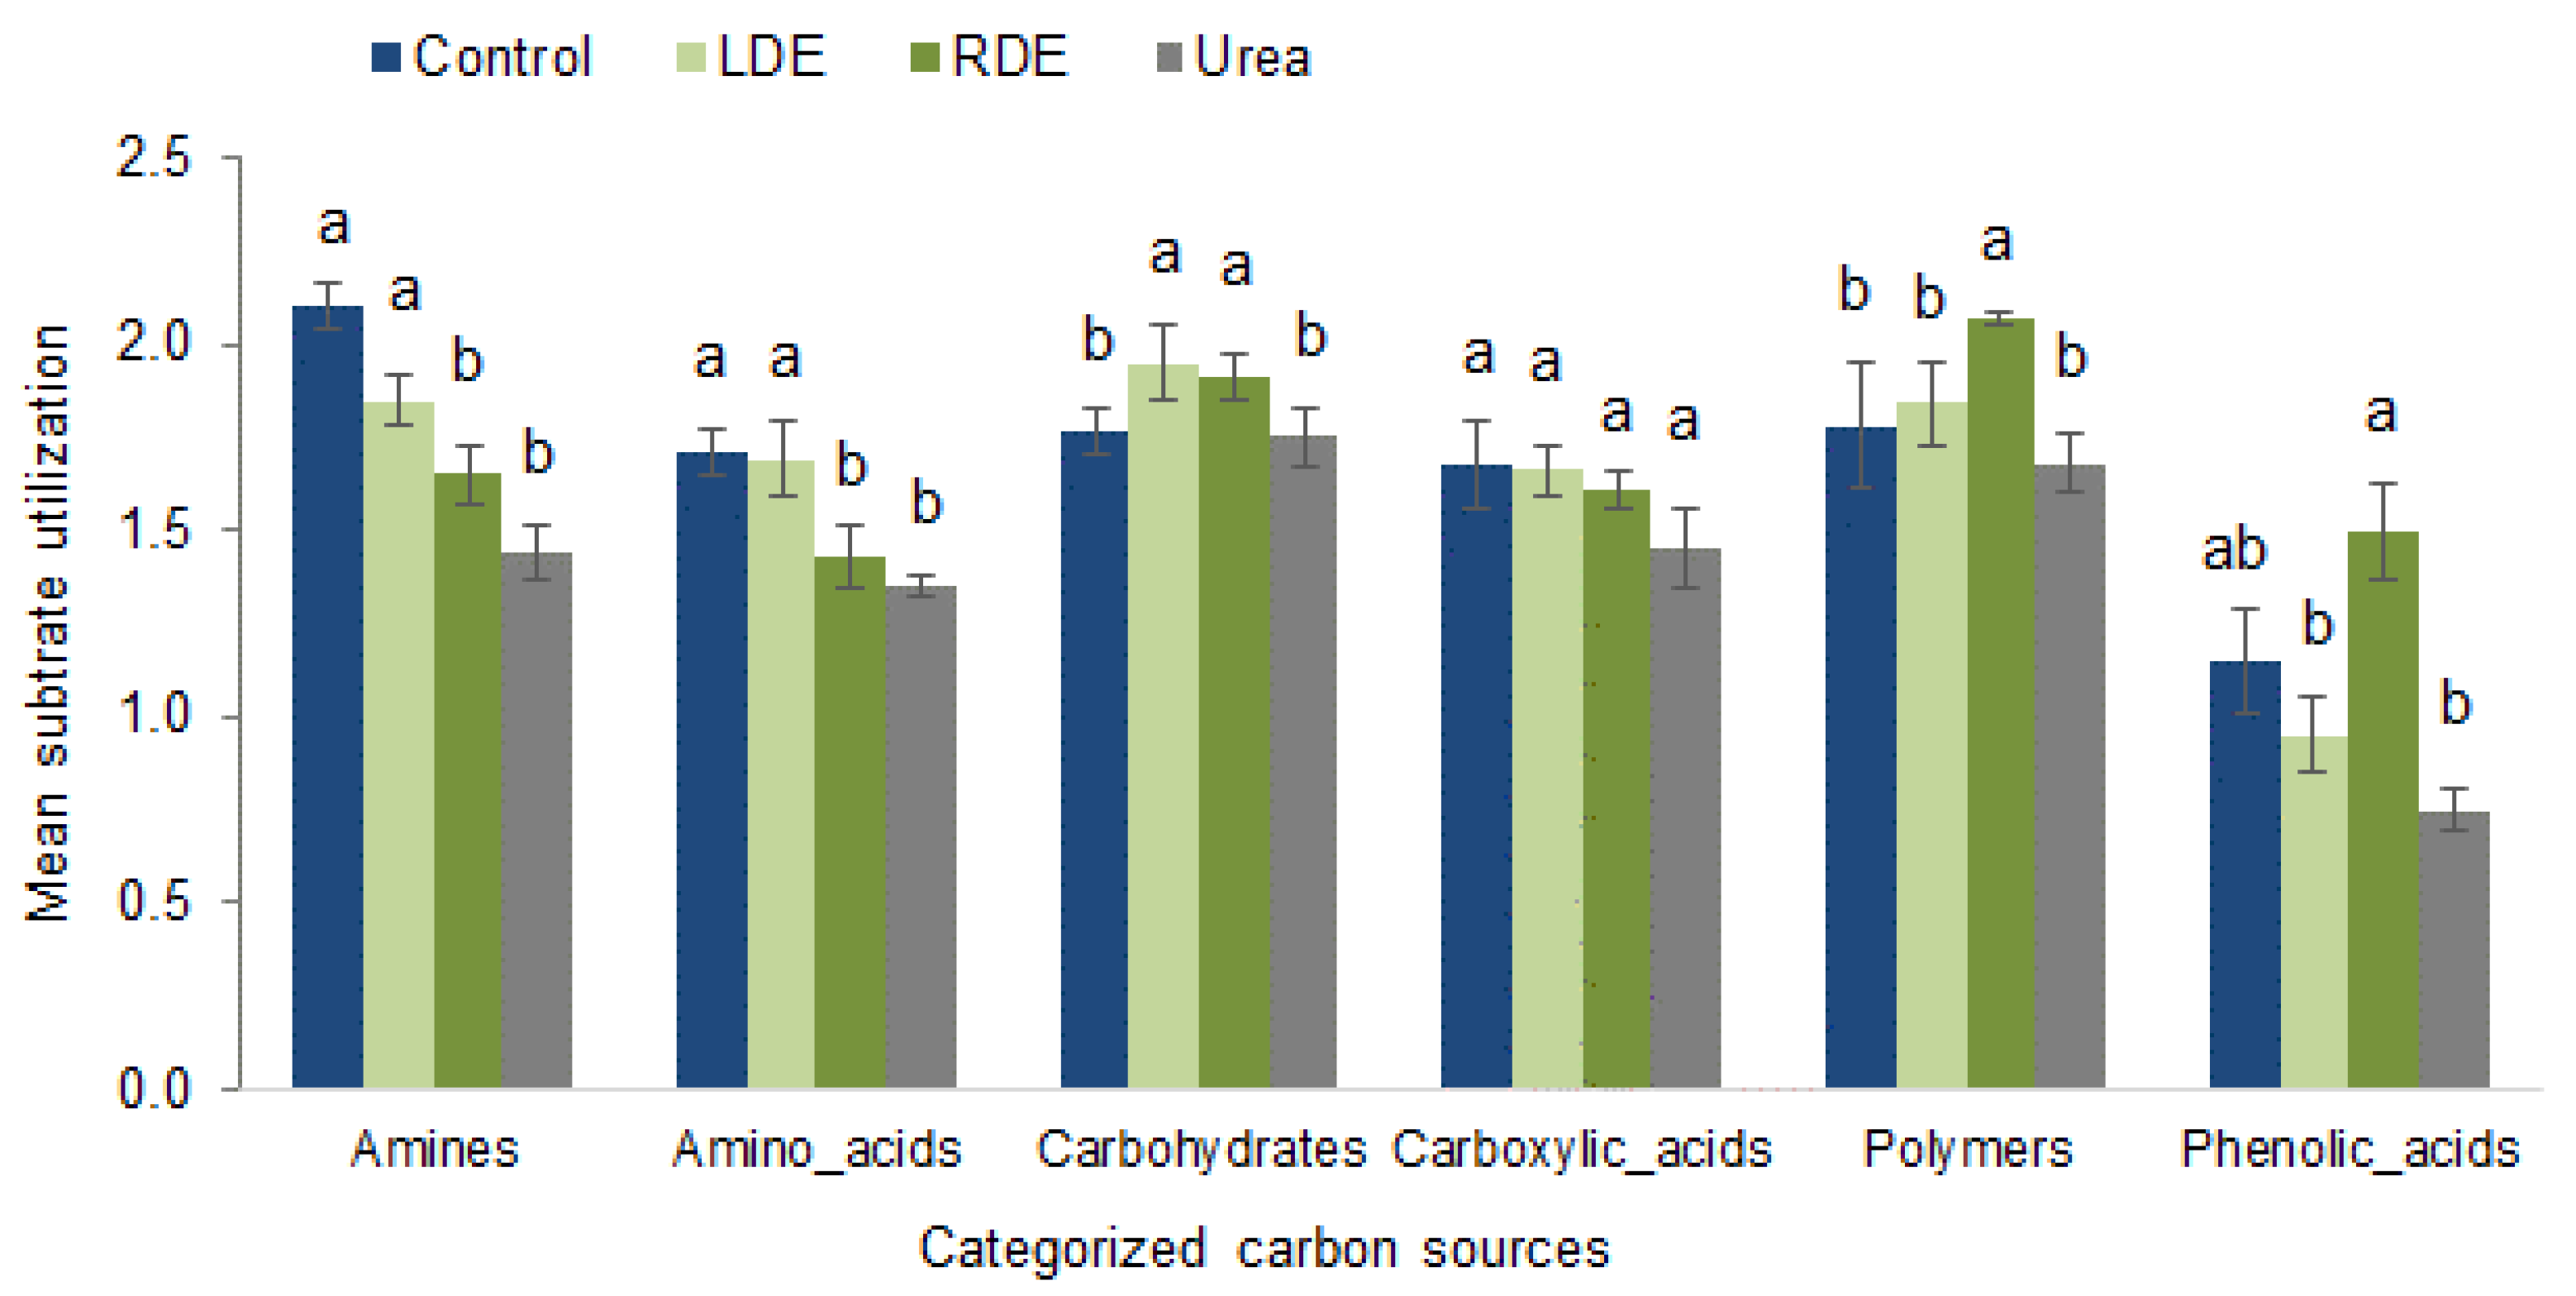
To gain a better understanding of microorganism metabolism in response to FDE application, we characterized microbial community function based on sole carbon source group utilization patterns. Figure 4 shows the utilization of compounds in each of the grouped chemical classes.
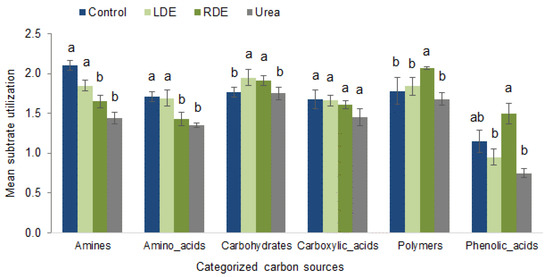
Figure 4.
Substrate utilization patterns of different carbon sources by soil microbial community after 96 h of incubation in Biolog EcoPlates upon the application of RDE, LDE, urea, or non-amended control to pots containing fescue pasture soil. Values represent means ± standard error (n = 3). Significant differences between treatments in each carbon substrate’s group utilization are indicated with different letters (p < 0.05).
There was a different pattern regarding carbon substrate utilization depending on the treatment applied to the soil. RDE application presented the soil microbial community with the greatest polymer and phenolic compound utilization. On the other hand, LDE and non-amended soil significantly increased amine and amino acid utilization. Both RDE and LDE applications showed greater carbohydrate utilization by the soil microbial community. Excluding RDE, the rest of the treatments showed that phenolic acids were the microorganisms’ least used carbon source (p < 0.05).
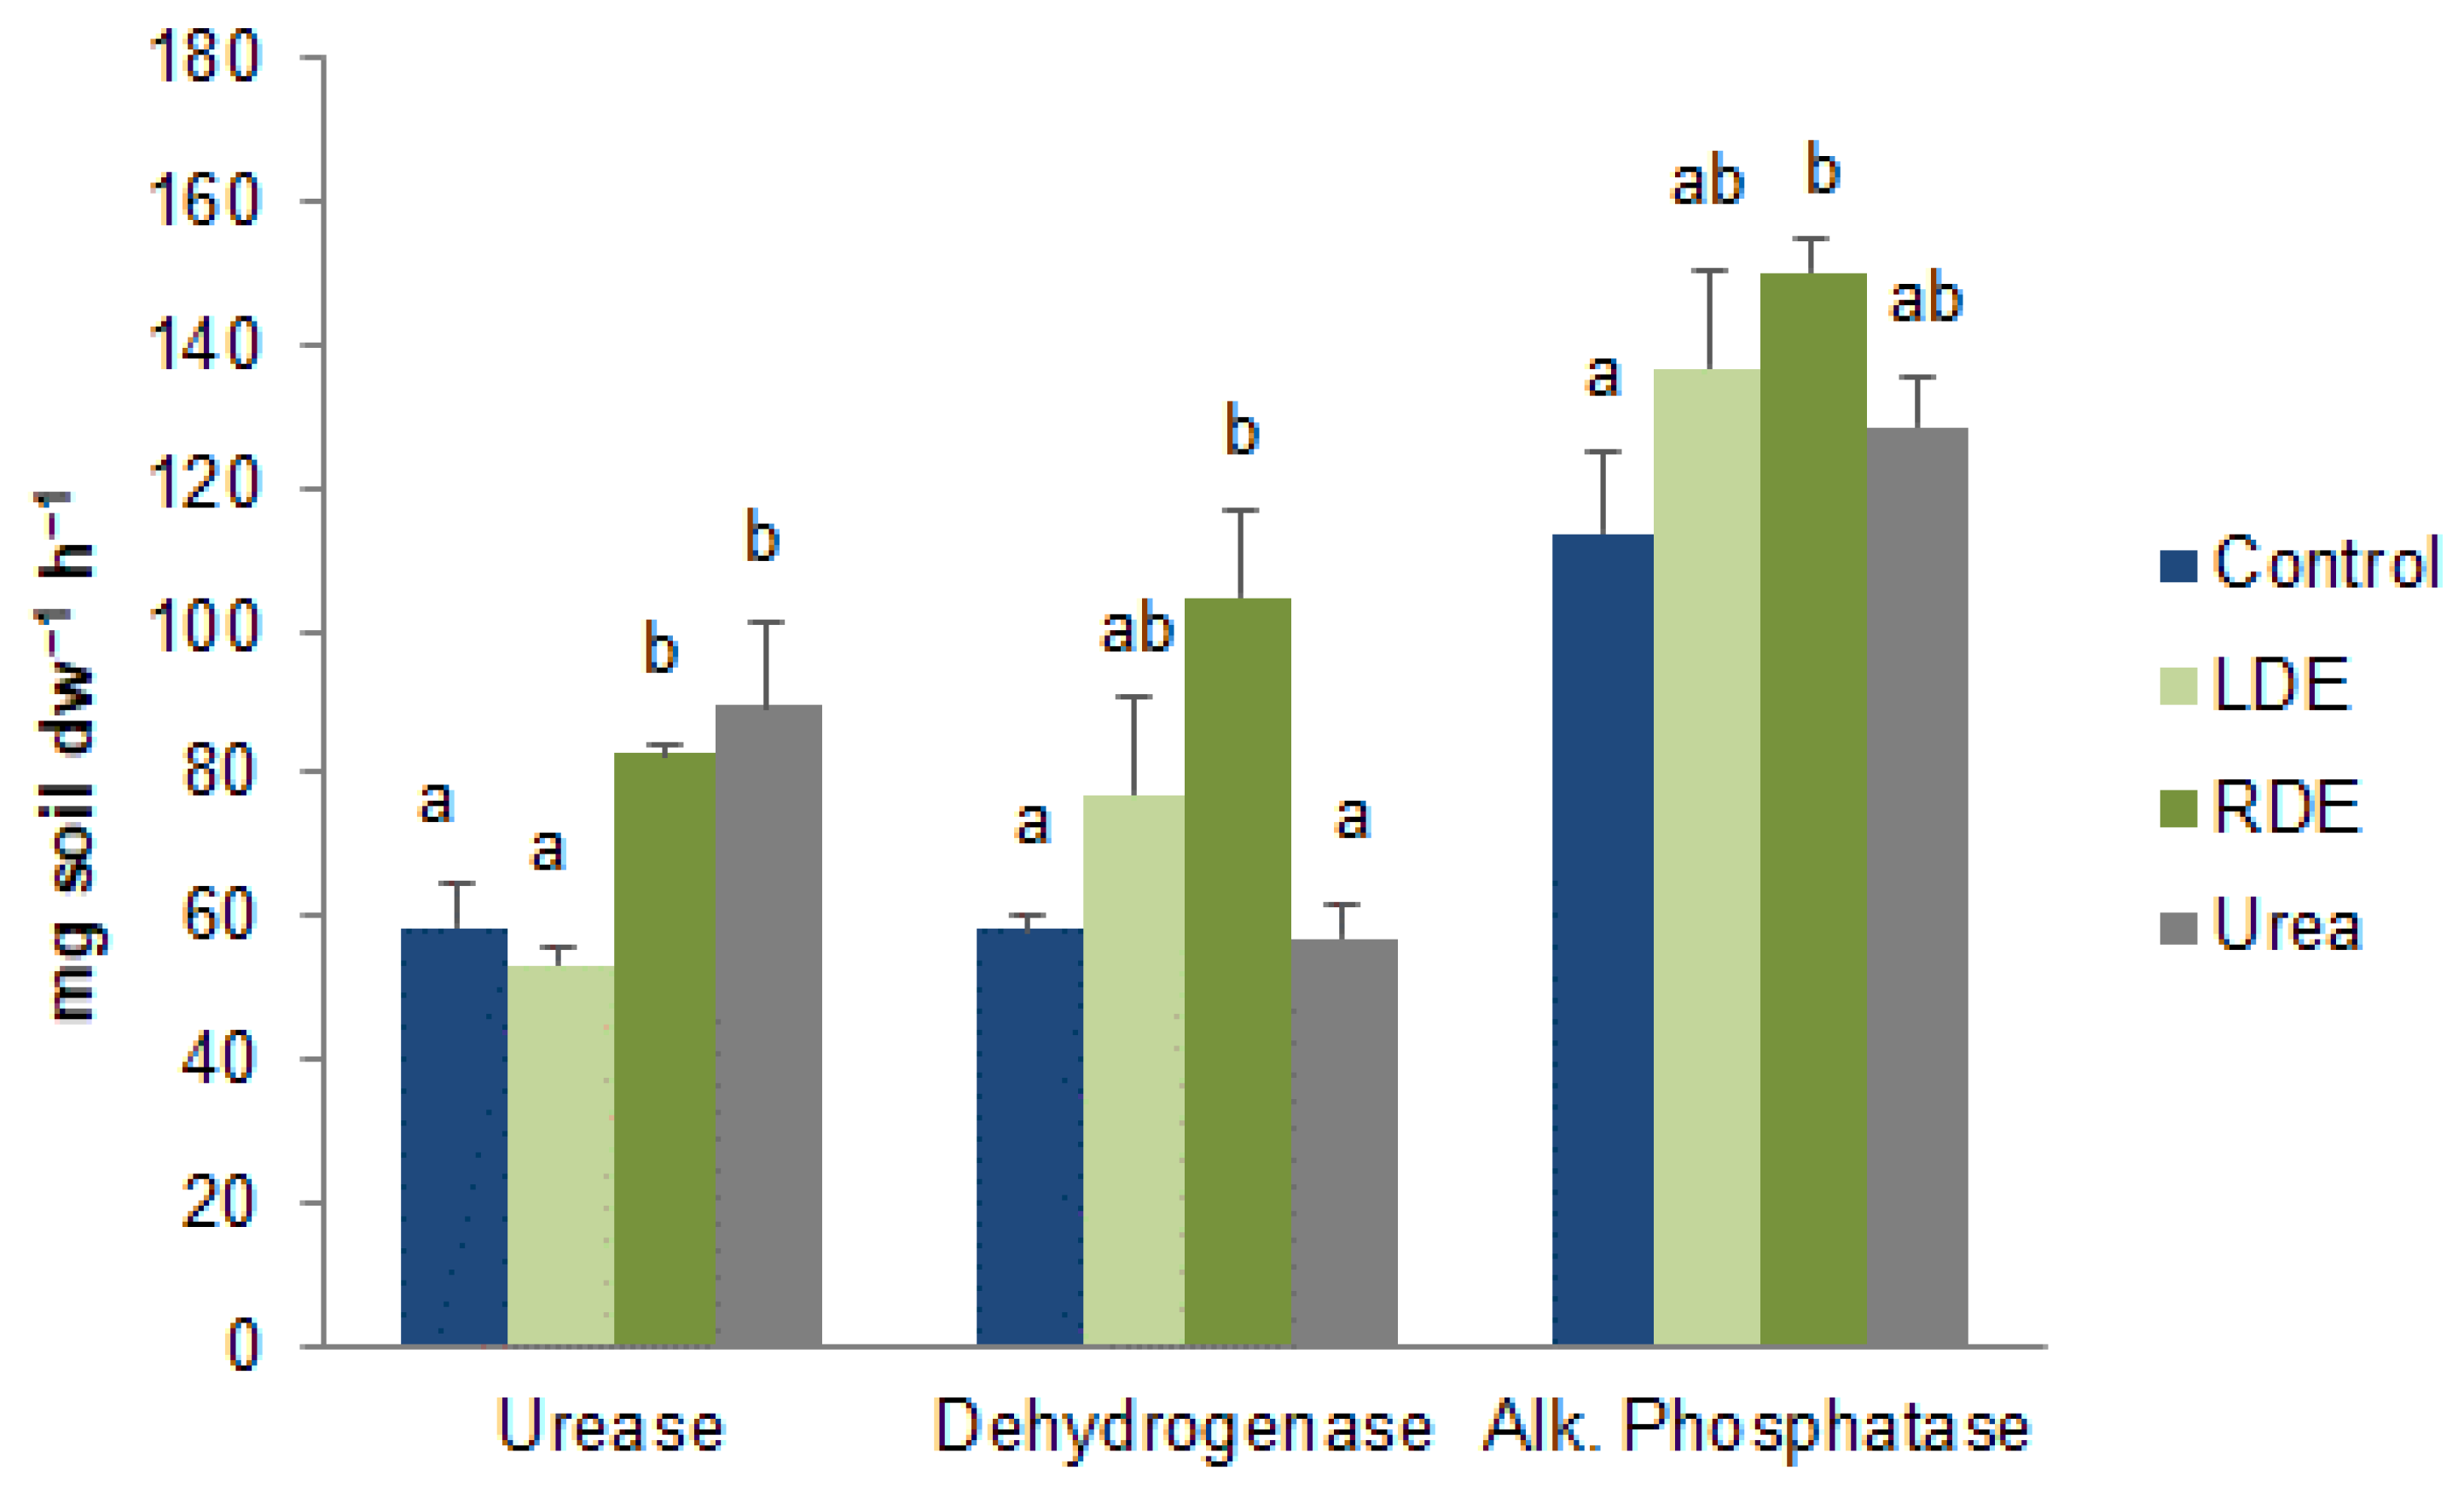
The microbial functional activity of fescue soil treated with FDE was also assessed by key enzymatic activities. Compared with the control soil, applications of RDE increased enzymatic activities, while LDE did not differ from control (Figure 5). Urease activity was also increased in urea-fertilized soil compared to control and LDE soils.
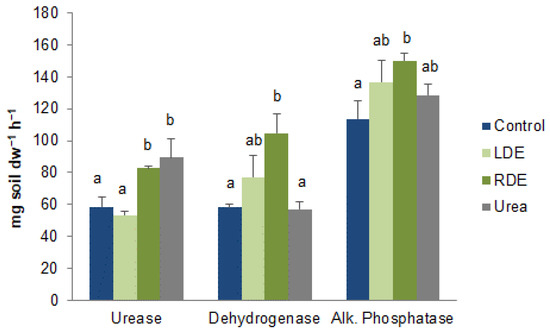
Figure 5.
Enzyme activities of soil with fescue pasture upon application of raw (RDE) or lagoon-stored dairy effluent (LDE), urea, or non-amended control. Values represent means ± standard error (n = 3). Different letters between treatments indicate statistically significant differences (p < 0.05).
4. Discussion
As an alternative to discharge into waterways, the application of dairy effluents to agricultural land is encouraged by the regulatory organisms of Uruguay. However, few studies in the country focus on the effects of dairy effluent application to pastures on N dynamics including N2O emission and soil microbial activity.
4.1. Dairy Effluents as N Fertilizers
One of the challenges of FDE reutilization as a pasture N supplier is its variable composition, complicating the prediction of its agronomic value. Compositional variations in FDE are likely due to the time of milking, the age and breed of the herd, feed quality, wash-water management, and the time relative to lactation [4]. The RDE presented the highest C:N ratio in all samples except for the summer sample (Table S1). An increase in the nutrient content of dairy effluent lagoons in summer (January) has been previously reported [50]. However, organic C content was generally higher in RDE than in LDE, accounting for one of the expected lagoon purposes. The organic N in both effluents was higher than ammonia N except for LDE in September (Table 1); organic N is the main N source added to the soil with FDE applications. FDE composition had characteristics similar to those of other dairy grazing systems such as those in New Zealand [51].
Luo et al. [52] reported in a meta-analysis that organic amendments increase crop yields compared to mineral-only fertilization. In the current study, although control pots had the lowest biomass yield and N uptake at the end of the experiment, those values were not significantly different from the fertilized ones, either with urea or with FDE (Table 2). The high fescue yield of the control treatment was likely due to soil characteristics such as high organic matter and nutrient content. This kind of soil with high initial N and P content can be found in the dairy basin of Uruguay. Nevertheless, there was a clear tendency to higher yield values with the application of urea and RDE compared to the control. In accordance with these results, FDE application to land may be an alternative final destination without affecting forage production. On the other hand, FDE application to pastures may be used as a fertilizer substitute if farmers take into account the nutrient content of effluents. Pagliari et al. [8] recommend testing FDE for nutrient availability as close to field application as possible. It is worthwhile to note that, being mainly a source of organic N, RDE showed a similar performance in maintaining pasture production and N uptake compared to urea, although organic N behaves in the soil as mineral fertilizer. This further indicates that RDE has the potential to be used as a nutrient source, especially as a source of N [53] with a NUE similar to that of Urea (Table 2) and a similar nitrogen replacement value (NFRV). However, the great variability between pots may not have registered the differences, while LDE tended to have lower NUE than RDE.
Additionally, the application of FDE to pastures may also cause micronutrient or Cu and Zn accumulation from manure or food additives. Manure is also a potential source of pathogens, antibiotics, and antibiotic-resistant bacteria [54].
4.2. Effect of Farm Dairy Effluent Application on Soil N Dynamics and N2O Emission
The amount of organic N added to the soil during the four repeated FDE applications was greater for RDE than LDE (Table S1), and only RDE showed estimated net N mineralization (sum N_min) higher than the control (Table S2). The different organic nitrogenous compounds present in both effluents and their different organic C contents can partially explain this result as well. The potential N mineralization activity of the soils was highest for RDE after repeated application (Figure 4 and Table S2). The pulse of this effluent addition to the soil can elicit responses in the decomposer community that can use this new organic matter substrate without inducing a ”positive priming” effect on native soil organic matter [55] as soil organic C did not decrease, at least in the short period evaluated (Table S2). The narrow C:N ratio within the FDE assured available N to plants after their application, as N immobilization may not be predominant [56].
Both RDE and LDE had higher PNA than Urea and nitrification was particularly noticeable after three or four repeated FDE applications, where the rhizosphere:bulk soil ratio may be higher, according to Rudisill et al. [57]. However, potential activity differs from the actual in situ rate due to the broad physiological diversity of ammonia oxidizers [58]. Furthermore, higher soil NO3− content in RDE-treated soils was measured on one of the sampling dates (Figure 2b), leaving more N available for lixiviation, leaching, or denitrification in addition to plant uptake [59]. Adequate use of dairy effluents must aim at the optimal use of their nutrients to avoid, for example, N being lost via gaseous emissions, of which NH3 and N2O are of particularly environmental concern. Although NH3 volatilization was not measured in the current study, the liquid application of FDE with low dry matter content and rapid infiltration in the soil make NH3 losses less prone in this case [60]. Soil NO3− and NH4+ content was also highly related to N2O emissions (Table S3), which suggests that N2O was the main source of N losses in this case.
Oxidation of NH3 by bacteria and archaea is partially responsible for global emissions of N2O directly as a by-product of NH3 oxidation, and indirectly through the provision of nitrite that is oxidized to NO3- and can be denitrified [61]. Nitrification and denitrification, the main processes associated with N2O emission in agricultural soils, are influenced by agricultural management practices [62]. One of the main reasons for N2O emissions from agricultural soils is the application of N fertilizer or amendments when plants cannot uptake all applied nitrogen. An increase in soil N content was correlated with subsequent N2O losses (Table S2). Denitrification seems to be more relevant as a N2O source than nitrification when studying different agroecosystems [63] and in grassland soils following manure application [64]. The presence of available C in FDE may enhance N2O fluxes, as most denitrifiers are heterotrophs. The peak of N2O registered immediately after treatment application could be a product of the O2 limitation caused by irrigation [65]. The highest N2O emission with repeated RDE irrigation coincided with the highest mineralization. This latter process is mainly an O2-demanding heterotrophic process and has a higher dependence on the rhizosphere because its oxic/anoxic interface offers a favorable habitat for coupled nitrification–denitrification [66].
However, greenhouse gases emitted during FDE storage have to be taken into account to recommend the type of effluent to be used for land application [67], showing the need for life cycle assessments. In the case of replacing urea with FDE as a N supply for plants, the fossil energy required for urea synthesis and the consequent greenhouse gas emissions are avoided.
4.3. Effect of Farm Dairy Effluent Application on Soil Microbial Functional Diversity and Activity
Our study showed that soil microbial community functional activity with the addition of synthetic fertilizer was lower than that with FDE application. This is in accordance with Bonanomi et al. [68], who reported higher AWCD values in soil treated with organic materials than with synthetic fertilizers. Urea application also decreased enzymatic activity with respect to FDE (Figure 5), except for urease. Meanwhile, RDE increased dehydrogenase and alkaline phosphatase enzyme activities compared to the control soil (Figure 5). The higher dehydrogenase enzyme activity, which is a representation of total microbial activity, was probably a result of the more readily available C pool due to the addition of RDE to the soil [69]. Luo et al. [52] reported in a meta-analysis that organic amendments increase enzymatic activity compared to mineral-only fertilization and Shi et al. [28] demonstrated that raw dairy effluent application increased soil microbial biomass and enzyme activity. Soil enzymes mediate organic matter decomposition, transformation, and mineralization and play an important role in nutrient cycling [70]. In this case, enzyme activities were good indicators of organic matter decomposition, being higher for RDE, which also stimulates N mineralization. However, LDE application was not associated with higher enzyme activity, as has been reported for organic amendments [52,53].
The soil after repeated RDE application presented a differentiated substrate utilization pattern (Figure 3). As has been previously reported [71], soil management can influence belowground microbial communities through multiple factors including the type and amount of C inputs. The addition of RDE to the soil with higher organic C content than that of LDE can keep a more even distribution (Table 3) of the catabolic structure of the soil community [72]. Frąc et al. [73] reported that the Biolog EcoPlatesTM assay allowed the detection of changes in the microbial functional diversity after dairy effluent application. However, the limitations of the Biolog assay may be considered and better referred to as the catabolic activity of fast-growing or eutrophic bacteria [72].
RDE stimulated polymer and phenolic compound utilization (Figure 4). Gallet et al. [74] showed that phenolic compounds comprised 15% of manure DOC and among them, syringic acid, p-hydroxybenzoic acid, and p-hydroxy benzaldehyde were the main components. This capacity of the microbial community to mineralize specific C substrates may reflect differences in the type, abundance, and availability of C sources present in the amendment [75].
5. Conclusions
The current study covered four complete growth–cut fescue cycles. The repeated application of RDE delivered more organic C and N to the soil than LDE. These inputs induced a shift in the catabolic activity of the soil microbial community and, thus, a greater N mineralization potential in RDE-amended soils. These indicators pointed to RDE as an amendment that can improve nutrient cycling and soil quality. Nevertheless, the trade-offs with other sustainability indicators such as N2O emission, which was greater during RDE treatment, must be considered. The application of FDE following partial treatment in stabilization lagoons to a fescue pasture substitutes urea as a N source without increasing N2O emissions and enhances soil biological activity compared to synthetic fertilizers.
Supplementary Materials
The following supporting information can be downloaded at: https://www.mdpi.com/article/10.3390/agronomy13020470/s1, Table S1: Carbon and nitrogen inputs expressed as the volume of Raw or Lagoon Dairy effluent applied to fescue pots; Table S2: Soil organic carbon, the sum N mineralization and Yield-scaled N2O emission at the last application of Raw or Lagoon Dairy effluent, urea, or non-amended control; Table S3: Cumulative nitrogen transformations in soil with fescue pasture upon the application of Raw (RDE) or Lagoon Dairy effluent (LDE), urea, or non-amended control; Table S4: Pearson Correlation among soil inorganic N ((NH4+ + NO3−)–N, potential nitrification activity (PNA), potentially mineralizable N (PMN), and N2O, taken from the third and fourth dairy effluent applications.
Author Contributions
Conceptualization, G.I., A.d.P. and P.I.; methodology, software, formal analysis, G.I. and P.I.; investigation, G.I.; resources, P.I.; writing—original draft preparation, G.I. and P.I.; writing—review and editing, G.I., P.I., A.R.-B. and A.d.P. project administration, P.I. and G.I. All authors have read and agreed to the published version of the manuscript.
Funding
This research was funded by the CSIC-Udelar project (Comisión Sectorial de Investigación Científica, Universidad de la República) “Irrigation with dairy farm effluents: a microbiological perspective on soil fertility and environmental impact”. The research was also supported by PEDECIBA with funding to P.I. and A.R.-B., G.I. was recipient of a Ph.D. fellowship from CAP (Comisión Académica de Posgrado-Udelar).
Data Availability Statement
The data presented in this study are available upon request from the corresponding author.
Acknowledgments
The authors thank Rebeca Gonnet, Jimena Arrarte, Ana Laura Rivero, Alvaro Hernàndez, and Dana Montedónico for their help with sampling and laboratory assays.
Conflicts of Interest
The authors declare no conflict of interest.
References
- INALE. Situación y Perspectiva de la Lechería Uruguaya. 2021. Available online: https://www.inale.org/informes/informe-2021/ (accessed on 1 December 2022).
- Fariña, S.R.; Chilibroste, P. Opportunities and Challenges for the Growth of Milk Production from Pasture: The Case of Farm Systems in Uruguay. Agric. Syst. 2019, 176, 102631. [Google Scholar] [CrossRef]
- DIEA. Anuario Estadístico Agropecuario. Montevideo. MGAP. 2021. Available online: https://www.gub.uy/ministerio-ganaderia-agricultura-pesca/comunicacion/publicaciones/anuario-estadistico-agropecuario-2021 (accessed on 1 December 2022).
- Hawke, R.M.; Summers, S.A. Effects of Land Application of Farm Dairy Effluent on Soil Properties: A Literature Review. N. Z. J. Agric. Res. 2006, 49, 307–320. [Google Scholar] [CrossRef]
- DINAMA. Manual Para la Gestión Ambiental de Tambos. Miniesterio de Ambiente. 2016. Available online: https://www.gub.uy/ministerio-ambiente/comunicacion/publicaciones/manual-para-gestion-ambiental-tambos (accessed on 1 December 2022).
- Ellen McArthur Foundation. Towards the Circular Economy: An Economic and Business Rationale for an Accelerated Transition. 2013. Available online: http://www.ellenmacarthurfoundation.org/publications (accessed on 1 December 2022).
- Herrero, M.A.; Palhares, J.C.P.; Salazar, F.J.; Charlón, V.; Tieri, M.P.; Pereyra, A.M. Dairy Manure Management Perceptions and Needs in South American Countries. Front. Sustain. Food Syst. 2018, 2, 22. [Google Scholar] [CrossRef]
- Pagliari, P.H.; Wilson, M.; Waldrip, H.M.; He, Z. Nitrogen and Phosphorus Characteristics of Beef and Dairy Manure. In Animal Manure: Production, Characteristics, Environmental Concerns, and Management; Waldrip, H.M., Pagliari, P.H., He, Z., Eds.; ASA Special Publications 67: Madison, WI, USA, 2020; pp. 45–62. [Google Scholar]
- INALE. Cartilla Sobre Criterios de Aplicación de Efluente a Terreno y su Implicancia Práctica en el Diseño e Implementación. 2020. Available online: https://www.inale.org/informes/criterios-de-aplicacion-de-efluente-a-terreno-y-su-implicancia-practica-en-el-diseno-e-implementacion/ (accessed on 1 December 2022).
- Salazar, F.; Herrero, M.A.; Charlón, V.; La Manna, A. Slurry Management in Dairy Grazing Farms in South American Countries. In Proceedings of the 14th International Conference of the FAO ESCORENA Network on the Recycling of Agricultural, Municipal and Industrial Redidues in Agriculture, Lisboa, Portugal, 13–15 September 2010; pp. 1–4. [Google Scholar]
- Hagare, D.; Hong, W.T.; Siddiqui, Z.; Natarajan, S.K.; Fyfe, J. Effect of Dairy Pond Sludge/Supernatant Application on Ryegrass Dry Matter Yield and Phosphorus Fractions in Soil. Agriculture 2022, 12, 351. [Google Scholar] [CrossRef]
- Cameron, K.C.; Rate, A.W.; Noonan, M.J.; Moore, S.; Smith, N.P.; Kerr, L.E. Lysimeter Study of the Fate of Nutrients Following Subsurface Injection and Surface Application of Dairy Pond Sludge to Pasture. Agric. Ecosyst. Environ. 1996, 58, 187–197. [Google Scholar] [CrossRef]
- Wang, H.; Magesan, G.N.; Bolan, N.S. An Overview of the Environmental Effects of Land Application of Farm Effluents. N. Z. J. Agric. Res. 2004, 47, 389–403. [Google Scholar] [CrossRef]
- Saggar, S.; Bolan, N.S.; Bhandral, R.; Hedley, C.B.; Luo, J. A Review of Emissions of Methane, Ammonia, and Nitrous Oxide from Animal Excreta Deposition and Farm Effluent Application in Grazed Pastures. N. Z. J. Agric. Res. 2004, 47, 513–544. [Google Scholar] [CrossRef]
- Watch, C. Agriculture. 2020. Available online: https://www.climatewatchdata.org/sectors/agriculture#drivers-of-emissions (accessed on 1 December 2022).
- Chilibroste, P. A Major Challenge for the Uruguayan Dairy Industry Sustainable Growth. Agrociencia Urug. 2021, 25, 25–27. [Google Scholar] [CrossRef]
- Bhandral, R.; Bolan, N.S.; Saggar, S.; Hedley, M.J. Nitrogen Transformation and Nitrous Oxide Emissions from Various Types of Farm Effluents. Nutr. Cycl. Agroecosystems 2007, 79, 193–208. [Google Scholar] [CrossRef]
- Chirinda, N.; Carter, M.S.; Albert, K.R.; Ambus, P.; Olesen, J.E.; Porter, J.R.; Petersen, S.O. Emissions of Nitrous Oxide from Arable Organic and Conventional Cropping Systems on Two Soil Types. Agric. Ecosyst. Environ. 2010, 136, 199–208. [Google Scholar] [CrossRef]
- Ge, G.; Li, Z.; Fan, F.; Chu, G.; Hou, Z.; Liang, Y. Soil Biological Activity and Their Seasonal Variations in Response to Long-Term Application of Organic and Inorganic Fertilizers. Plant Soil 2010, 326, 31–44. [Google Scholar] [CrossRef]
- Iocoli, A.; Orden, L.; Fernando, M.L.; Marisa, A.G.; Villamil, B.; Zabaloy, C. Towards Sustainable Dairy Production in Argentina: Evaluating Nutrient and CO2 Release from Raw and Processed Farm Waste. Agronomy 2021, 11, 2595. [Google Scholar] [CrossRef]
- Delgado-Baquerizo, M.; Maestre, F.T.; Reich, P.B.; Jeffries, T.C.; Gaitan, J.J.; Encinar, D.; Berdugo, M.; Campbell, C.D.; Singh, B.K. Microbial Diversity Drives Multifunctionality in Terrestrial Ecosystems. Nat. Commun. 2016, 7, 10541. [Google Scholar] [CrossRef]
- Insam, H.; Parkinson, D.; Domsch, K.H. Influence of Macroclimate on Soil Microbial Biomass. Soil Biol. Biochem. 1989, 21, 211–221. [Google Scholar] [CrossRef]
- Moscatelli, M.C.; Secondi, L.; Marabottini, R.; Papp, R.; Stazi, S.R.; Mania, E.; Marinari, S. Assessment of Soil Microbial Functional Diversity: Land Use and Soil Properties Affect CLPP-MicroResp and Enzymes Responses. Pedobiologia 2018, 66, 36–42. [Google Scholar] [CrossRef]
- Rutgers, M.; Wouterse, M.; Drost, S.M.; Breure, A.M.; Mulder, C.; Stone, D.; Creamer, R.E.; Winding, A.; Bloem, J. Monitoring Soil Bacteria with Community-Level Physiological Profiles Using BiologTM ECO-Plates in the Netherlands and Europe. Appl. Soil Ecol. 2016, 97, 23–35. [Google Scholar] [CrossRef]
- Nannipieri, P.; Giagnoni, L.; Renella, G.; Puglisi, E.; Ceccanti, B.; Masciandaro, G.; Fornasier, F.; Moscatelli, M.C.; Marinari, S. Soil Enzymology: Classical and Molecular Approaches. Biol. Fertil. Soils 2012, 48, 743–762. [Google Scholar] [CrossRef]
- Neufeld, K.R.; Grayston, S.J.; Bittman, S.; Krzic, M.; Hunt, D.E.; Smukler, S.M. Long-Term Alternative Dairy Manure Management Approaches Enhance Microbial Biomass and Activity in Perennial Forage Grass. Biol. Fertil. Soils 2017, 53, 613–626. [Google Scholar] [CrossRef]
- Liu, Y.Y.; Haynes, R.J. Influence of Land Application of Dairy Factory Effluent on Soil Nutrient Status and the Size, Activity, Composition and Catabolic Capability of the Soil Microbial Community. Appl. Soil Ecol. 2011, 48, 133–141. [Google Scholar] [CrossRef]
- Shi, Y.; Ziadi, N.; Hamel, C.; Bittman, S.; Hunt, D.; Lalande, R. Soil Microbial Biomass, Activity, and Community Composition as a Ff Ected by Dairy Manure Slurry Applications in Grassland Production. Appl. Soil Ecol. 2017, 125, 97–107. [Google Scholar] [CrossRef]
- Fox, E.M.; Fanning, S.; Corsetti, A.; Jordan, K. Microbial Food Safety along the Dairy Chain. Front. Microbiol. 2017, 8, 1612. [Google Scholar] [CrossRef] [PubMed]
- APHA. Standard Methods for the Examination of Water and Wastewater, 21st ed.; American Public Health Association: Washington, DC, USA, 2005. [Google Scholar]
- Mebius, L.J. A Rapid Method for the Determination of Organic Carbon in Soil. Anal. Chim. Acta 1960, 22, 120–124. [Google Scholar] [CrossRef]
- Bremner, J.M.; Mulvaney, C.S. Total Nitrogen. In Methods of Soil Analysis. Part 2. Chemical and Microbiological Properties; Page, A.L., Miller, R.H., Dinauer, K., Eds.; American Society of Agronomy: Madison, WI, USA, 1996; pp. 595–624. [Google Scholar]
- Rhine, E.D.; Mulvaney, R.L.; Pratt, E.J.; Sims, G.K. Improving the Berthelot Reaction for Determining Ammonium in Soil Extracts and Water. Soil Sci. Soc. Am. J. 1998, 62, 473. [Google Scholar] [CrossRef]
- Mulvaney, R.L. Nitrogen—Inorganic Forms. In Methods of Soil Analysis. Part 3. Chemical Methods; Page, A.L., Miller, R.H., Dinauer, K., Eds.; American Society of Agronomy: Madison, WI, USA, 1996; pp. 1123–1184. [Google Scholar]
- Nelson, D.W.; Sommers, L.E. Total Carbon, Organic Carbon, and Organic Matter. In Methods of Soil Analysis: Part 3 Chemical Methods; Sparks, D.L., Ed.; Soil Science Society of America and American Society of Agronomy: Madison, WI, USA, 1996; pp. 961–1010. [Google Scholar]
- Arlo, L.; Beretta, A.; Szogi, A.A.; del Pino, A. Biomass Production, Metal and Nutrient Content in Sorghum Plants Grown on Soils Amended with Sewage Sludge. Heliyon 2022, 8, e08658. [Google Scholar] [CrossRef] [PubMed]
- Baral, K.R.; Labouriau, R.; Olesen, J.E.; Petersen, S.O. Agriculture, Ecosystems and Environment Nitrous Oxide Emissions and Nitrogen Use Ef Fi Ciency of Manure and Digestates Applied to Spring Barley. Agric. Ecosyst. Environ. 2017, 239, 188–198. [Google Scholar] [CrossRef]
- Tarlera, S.; Capurro, M.C.; Irisarri, P.; Scavino, A.F.; Cantou, G.; Roel, A. Yield-Scaled Global Warming Potential of Two Irrigation Management Systems in a Highly Productive Rice System. Sci. Agric. 2016, 73, 43–50. [Google Scholar] [CrossRef]
- Bowden, D.; Melillo, M.; Steudler, A. Effects of Nitrogen Additions on Anual Nitrous Oxide Fluxes from Temperate Forest Soils in the Northeastern United States. J. Geophys. Res. 1991, 96, 9321–9328. [Google Scholar] [CrossRef]
- Kandeler, E. Nitrogen Mineralization. In Methods in Soil Biology; Schinner, F., Ohlinger, R., Margesin, R., Kandeler, E., Eds.; Springer: Berlin/Heidelberg, Germany, 1996; pp. 135–143. [Google Scholar]
- Hoffmann, H.; Schloter, M.; Wilke, B.M. Microscale-Scale Measurement of Potential Nitrification Rates of Soil Aggregates. Biol. Fertil. Soils 2007, 44, 411–413. [Google Scholar] [CrossRef]
- von Mersi, W.; Schinner, F. An Improved and Accurate Method for Determining the Dehydrogenase Activity of Soils with Iodonitrotetrazolium Chloride. Biol. Fertil. Soils 1991, 11, 216–220. [Google Scholar] [CrossRef]
- Margesin, R. Acid and Alkaline Phosphomonoesterase Activity with the Substrate P-Nitrophenyl Phosphate. In Methods in Soil Biology; Schinner, F., Ohlinger, R., Margesin, R., Kandeler, E., Eds.; Springer: Berlin/Heidelberg, Germany, 1996; pp. 2013–2016. [Google Scholar]
- Kandeler, E. Urease Activity by Colorimetric Technique. In Methods in Soil Biology; Schinner, F., Ohlinger, R., Margesin, R., Kandeler, E., Eds.; Springer: Berlin/Heidelberg, Germany, 1996; pp. 171–174. [Google Scholar]
- Garland, J.L.; Mills, A.L. Classification and Characterization of Heterotrophic Microbial Communities on the Basis of Patterns of Community-Level Sole-Carbon-Source Utilization. Appl. Environ. Microbiol. 1991, 57, 2351–2359. [Google Scholar] [CrossRef]
- Christian, B.W.; Lind, O.T. Key Issues Concerning Biolog Use for Aerobic and Anaerobic Freshwater Bacterial Community-Level Physiological Profiling. Int. Rev. Hydrobiol. 2006, 91, 257–268. [Google Scholar] [CrossRef]
- Insam, H. A New Set of Substrates Proposed for Community Characterization in Environmental Samples. In Microbial Communities: Functional Versus Structural Approaches; Insam, H., Rangger, A., Eds.; Springer: Berlin/Heidelberg, Germany, 1997; pp. 259–260. [Google Scholar] [CrossRef]
- Di Rienzo, J.A.; Casanoves, F.; Balzarini, M.G.; González, L.; Tablada, M.; Robledo, Y.C. InfoStat Versión 2020. Centro de Transferencia InfoStat, FCA, Universidad Nacional de Córdoba, Argentina: Córdoba. 2017. Available online: http://www.infostat.com.ar (accessed on 16 July 2019).
- Wickham, H.; Chang, W.; Wickham, M.H. ggplot2: Elegant Graphics for Data Analysis; Statistics and Computing, Data and Information Visualization, Computer Graphics; Springer: Cham, Switzerland, 2016; pp. 1–189. [Google Scholar] [CrossRef]
- Demanet, R.; Aguilera, M.; Mora, M. Efecto de La Aplicación de Purines Sobre El Sistema Suelo-Planta. Front. Agrícola 1999, 5, 87–94. [Google Scholar]
- Longhurst, R.D.; Roberts AH, C.; O’Connor, M.B. Farm Dairy Effluent: A Review of Published Data on Chemical and Physical Characteristics in New Zealand. N. Z. J. Agric. Res. 2000, 43, 7–14. [Google Scholar] [CrossRef]
- Luo, G.; Li, L.; Friman, V.P.; Guo, J.; Guo, S.; Shen, Q.; Ling, N. Organic Amendments Increase Crop Yields by Improving Microbe-Mediated Soil Functioning of Agroecosystems: A Meta-Analysis. Soil Biol. Biochem. 2018, 124, 105–115. [Google Scholar] [CrossRef]
- Zaman, M.; Cameron, K.C.; Di, H.J.; Inubushi, K. Changes in Mineral N, Microbial Biomass and Enzyme Activities in Different Soil Depths after Surface Applications of Dairy Shed Effluent and Chemical Fertilizer. Nutr. Cycl. Agroecosystems 2002, 63, 275–290. [Google Scholar] [CrossRef]
- Zhang, H.; Vocasek, F.; Antonangelo, J.; Gillespie, C. Temporal Changes of Manure Chemical Compositions and Environmental Awareness in the Southern Great Plains. In Animal Manure: Production, Characteristics, Environmental Concerns, and Management; Waldrip, H.M., Pagliari, P.H., He, Z., Eds.; ASA Special Publications 67: Madison, WI, USA, 2020; pp. 15–26. [Google Scholar]
- Kok, D.D.; Scherer, L.; de Vries, W.; Trimbos, K.; van Bodegom, P.M. Relationships of Priming Effects with Organic Amendment Composition and Soil Microbial Properties. Geoderma 2022, 422, 115951. [Google Scholar] [CrossRef]
- Amon, B.; Kryvoruchko, V.; Amon, T.; Zechmeister-Boltenstern, S. Methane, Nitrous Oxide and Ammonia Emissions during Storage and after Application of Dairy Cattle Slurry and Influence of Slurry Treatment. Agric. Ecosyst. Environ. 2006, 112, 153–162. [Google Scholar] [CrossRef]
- Rudisill, M.A.; Turco, R.F.; Hoagland, L.A. Fertility Practices and Rhizosphere Effects Alter Ammonia Oxidizer Community Structure and Potential Nitri Fi Cation Activity in Pepper Production Soils. Appl. Soil Ecol. 2016, 99, 70–77. [Google Scholar] [CrossRef]
- Hazard, C.; Prosser, J.I.; Nicol, G.W. Use and Abuse of Potential Rates in Soil Microbiology. Soil Biol. Biochem. 2021, 157, 108242. [Google Scholar] [CrossRef]
- Calderón, F.J.; McCarty, G.W.; Reeves, J.B. Analysis of Manure and Soil Nitrogen Mineralization during Incubation. Biol. Fertil. Soils 2005, 41, 328–336. [Google Scholar] [CrossRef]
- Clough, T.J.; Balaine, N.; Cameron, K.C.; Petersen, S.O.; Sommer, S.G. Effects of Dairy Shed Effluent Dry Matter Content on Ammonia and Nitrous Oxide Emissions from a Pasture Soil. J. Agric. Sci. 2018, 156, 1070–1078. [Google Scholar] [CrossRef]
- Prosser, J.I.; Hink, L.; Gubry-Rangin, C.; Nicol, G.W. Nitrous Oxide Production by Ammonia Oxidizers: Physiological Diversity, Niche Differentiation and Potential Mitigation Strategies. Glob. Chang. Biol. 2020, 26, 103–118. [Google Scholar] [CrossRef] [PubMed]
- Hofstra, N.; Bouwman, A.F. Denitrification in Agricultural Soils: Summarizing Published Data and Estimating Global Annual Rates. Nutr. Cycl. Agroecosystems 2005, 72, 267–278. [Google Scholar] [CrossRef]
- Liang, D.; Robertson, G.P. Nitrification Is a Minor Source of Nitrous Oxide (N2O) in an Agricultural Landscape and Declines with Increasing Management Intensity. Glob. Chang. Biol. 2021, 27, 5599–5613. [Google Scholar] [CrossRef]
- Van Nguyen, Q.; Wu, D.; Kong, X.; Bol, R.; Petersen, S.O.; Jensen, L.S.; Liu, S.; Brüggemann, N.; Glud, R.N.; Larsen, M.; et al. Effects of Cattle Slurry and Nitrification Inhibitor Application on Spatial Soil O2 Dynamics and N2O Production Pathways. Soil Biol. Biochem. 2017, 114, 200–209. [Google Scholar] [CrossRef]
- Bourdin, F.; Sakrabani, R.; Kibblewhite, M.G.; Lanigan, G.J. Effect of Slurry Dry Matter Content, Application Technique and Timing on Emissions of Ammonia and Greenhouse Gas from Cattle Slurry Applied to Grassland Soils in Ireland. Agric. Ecosyst. Environ. 2014, 188, 122–133. [Google Scholar] [CrossRef]
- Wei, X.; Zhu, Z.; Wei, L.; Wu, J.; Ge, T. Biogeochemical Cycles of Key Elements in the Paddy-Rice Rhizosphere: Microbial Mechanisms and Coupling Processes. Rhizosphere 2019, 10, 100145. [Google Scholar] [CrossRef]
- Laubach, J.; Heubeck, S.; Pratt, C.; Woodward, K.B.; Guieysse, B.; Van Der Weerden, T.J.; Chung, M.L.; Shilton, A.N.; Craggs, R.J. Review of Greenhouse Gas Emissions from the Storage and Land Application of Farm Dairy Effluent. N. Z. J. Agric. Res. 2015, 58, 203–233. [Google Scholar] [CrossRef]
- Bonanomi, G.; Filippis, F.D.e.; Zotti, M.; Idbella, M. Repeated Applications of Organic Amendments Promote Bene Fi Cial Microbiota, Improve Soil Fertility and Increase Crop Yield. Appl. Soil Ecol. 2020, 156, 103714. [Google Scholar] [CrossRef]
- Watts, D.B.; Torbert, H.A.; Feng, Y.; Prior, S.A. Soil Microbial Community Dynamics as Influenced by Composted Dairy Manure, Soil Properties, and Landscape Position. Soil Sci. 2010, 175, 474–486. [Google Scholar] [CrossRef]
- Lladó, S.; Baldrian, P. Community-Level Physiological Profiling Analyses Show Potential to Identify the Copiotrophic Bacteria Present in Soil Environments. PLoS ONE 2017, 12, e0171638. [Google Scholar] [CrossRef] [PubMed]
- Liao, J.D.; Boutton, T.W. Soil Microbial Biomass Response to Woody Plant Invasion of Grassland. Soil Biol. Biochem. 2008, 40, 1207–1216. [Google Scholar] [CrossRef]
- Wei, D.; Yang, Q.; Zhang, J.-Z.; Wang, S.; Chen, X.L.; Zhang, X.L.; Li, W.Q. Bacterial Community Structure and Diversity in a Black Soil as Affected by Long-Term Fertilization. Pedosph. An. Int. J. 2008, 18, 582–592. [Google Scholar] [CrossRef]
- Frąc, M.; Oszust, K.; Lipiec, J. Community Level Physiological Profiles (CLPP), Characterization and Microbial Activity of Soil Amended with Dairy Sewage Sludge. Sensors 2012, 12, 3253–3268. [Google Scholar] [CrossRef]
- Gallet, C.; Boissier, J.-M.; Berlandis, M. Short-Term Effects of Manure Application on Soil Leachates in a Mountain Catchment. Agronomie 2003, 23, 335–344. [Google Scholar] [CrossRef]
- Banning, N.C.; Lalor, B.M.; Cookson, W.R.; Grigg, A.H.; Murphy, D.V. Analysis of Soil Microbial Community Level Physiological Profiles in Native and Post-Mining Rehabilitation Forest: Which Substrates Discriminate? Appl. Soil Ecol. 2012, 56, 27–34. [Google Scholar] [CrossRef]
Disclaimer/Publisher’s Note: The statements, opinions and data contained in all publications are solely those of the individual author(s) and contributor(s) and not of MDPI and/or the editor(s). MDPI and/or the editor(s) disclaim responsibility for any injury to people or property resulting from any ideas, methods, instructions or products referred to in the content. |
© 2023 by the authors. Licensee MDPI, Basel, Switzerland. This article is an open access article distributed under the terms and conditions of the Creative Commons Attribution (CC BY) license (https://creativecommons.org/licenses/by/4.0/).

