Abstract
Elevated atmospheric CO2 concentrations (eCO2) has become the main feature and cause of global change that could affect crop growth in many aspects, including physiological processes and morphological development in plants and nutrient cycling and nutrient uptake from the soil. Studying the responses of crop growth to different nitrogen (N) supply forms under elevated atmospheric CO2 concentrations can guide nutrient management strategies for agricultural production under future climate change scenarios. Few studies addressed the effect of eCO2 on N uptake and morphological development for plants. This study was conducted in the CO2-controlled light incubators based on the sand-pot incubation using wheat and maize as experimental plants. Six treatments were set with two different environmental CO2 concentrations (aCO2, 390 µmol mol−1; eCO2, 690 µmol mol−1) and three different N supply forms, including ammonium−N, nitrate−N and ammonium-nitrate with 1:1 ratio. The following results were obtained: (i) Wheat and maize seedlings, as nitrate-preferring crops, grew better under mixed N forms than under single N forms. For the single N supply treatment, seedlings with nitrate−N supply showed better growth than with ammonium. (ii) For wheat plants, seedlings with a single ammonium−N supply showed slender height and fewer tillers; seedlings with a single nitrate−N supply were characterized by slightly shorter plant height, more tillers, and higher aboveground biomass. (iii) Compared to the aCO2 group, wheat seedlings with the ammonium−N supply showed an increased maximum root length and a decreased carbon concentration in root exudates; wheat seedlings with a single nitrate−N supply under eCO2 showed a significant increase in biomass and a decreased carbon concentration in root exudates; wheat seedlings with a mixed N supply under eCO2 explored a significant increase in carbon concentration in root exudate and a relatively lower N concentration. (iv) For maize plants, seedlings with either single ammonium−N or nitrate−N supply did not show significant differences in most growing indices. Maize seedlings with a mixed N supply exhibited an increase in aboveground biomass and N concentration in root exudates compared to those with a single N supply. (v) Compared with the aCO2 group, maize seedlings with mixed N supply under eCO2 conditions exhibited significant increases in plant height, aboveground biomass, and N concentration in root exudates. Single ammonium−N supply was toxic to wheat and maize plants under eCO2 conditions. We recommend raising the ratio of ammonium-to-nitrate under mixed N supply to improve the coordination of carbon and N metabolism for efficient crop growth under climatic change conditions of elevated atmospheric CO2 concentration.
1. Introduction
Since the Industrial Revolution, the atmospheric CO2 concentration increased from 280 μmol∙mol−1 to 413 μmol∙mol−1 in 2020 due to the extensive combustion of fossil fuels and changes in land use [1]. With the continuous increase of atmospheric CO2 concentration, the Intergovernmental Panel on Climate Change (IPCC) predicts that it will reach 603 to 1135 μmol∙mol−1 by the end of the 21st Century under various climate change scenarios [2].
As a primary material of photosynthesis for green plants, the elevation of atmospheric concentration of CO2 does result in a series of influences on plant growth, including photosynthesis, carbon and nitrogen metabolism, the distribution of photosynthetic products to aboveground and belowground, crop yield, and nutrient cycling in the soil. Among the three major staple food crops, wheat and maize are two crops grown in dryland conditions, representing two distinct photosynthetic pathways, C3 and C4 types [3,4]. Studies have shown that elevated atmospheric CO2 concentrations (eCO2) could affect plant growth in many aspects, such as the stomatal conductance [5], photosynthetic rate, distribution of photosynthetic products [6], nitrogen uptake efficiency [7], plant growth and development [8]. The main channel for the gaseous exchange between the stomata of leaves and the external environment is most susceptible to the CO2 concentration in the environment. eCO2 could decrease the stomatal conductance [8,9,10,11] and thus reduce the transpiration rate [11,12]. For C3 crops, the net photosynthetic rate per unit leaf area can increase by approximately 65% upon the increase of CO2 concentration [13]. Studies have shown that eCO2 can promote the formation and accumulation of carbohydrates, which increases the leaf area and dry matter of wheat [14,15,16], and this offsets the effect of stomatal closure on water consumption in transpiration to a certain extent [12]. Other studies have also shown that under eCO2 conditions, the proportion of carbon assimilation to belowground parts increases. Thus, root biomass, especially fine root biomass [17,18], and rhizosphere carbon deposition also increase. These increased carbon deposits include root exudates, dead or exfoliated root tissues, microbes (including mycorrhiza) that grow relying on root exudates, and microbial debris [19]. Under eCO2 conditions, the proportion of carbon assimilates allocated to the lower part of the ground increases, with a corresponding increase in visible root biomass, as well as in invisible root exudate or co-called carbon deposition [20,21], which includes polysaccharides, organic acids, and amino acids, etc. There is still less study to address the root exudate under eCO2. In addition, under eCO2 conditions, the uptake of some mineral nutrients (such as nitrogen, etc.) which are transported from the soil to aboveground organs via transpiration could be decreased due to the reduced transpiration rate caused by the reduction of stomatal conductance under eCO2, thereby affecting plant growth to a degree [22].
Nitrogen (N) is one of the three major mineral elements necessary for plant growth. It is the main element of many important components in plants, such as amino acids, nucleotides, and proteins, especially enzymes that are involved in many key metabolic activities for plant growth [23]. N is also a major compositional element of chlorophyll, and some plant hormones contain N or N−derivatives as well [24]. Some studies have shown that the uptake of N by plants is limited by photosynthetic carbon assimilation [25,26], while under eCO2 conditions, The relatively sufficient supply of photosynthetic products promotes the overall uptake of N [27,28]. For instance, Stitt et al. [26,29] found that the uptake of mineral N by plants also increased under eCO2 conditions. Plant types and varieties and different supply forms of N will affect the uptake of N by plants. Ammonium−N (NH4+−N) is the N form uptaken by plants, such as rice, under flooded conditions, whereas nitrate−N (NO3−N) is the main form of N uptaken by dryland plants, such as wheat and maize. Plants convert NO3−N needs to be reduced to NH4+−N before it can be further assimilated into amino acids and amides to synthesize proteins further. The assimilation process of nitrate−N needs electrons produced in photorespiration without the consumption of CO2 other than O2. However, under eCO2 conditions, the photorespiration of C3 plants is inhibited due to increased environmental CO2 concentrations; therefore, the assimilation of nitrate−N may be hindered under eCO2 [30,31,32]. Thus, the preferred N form uptaken by plants under eCO2 conditions may be ammonium−N, which requires less energy.
However, excessive ammonium−N could cause ammonium toxicity to cells if it is not assimilated timely. The excessive accumulation of ammonium in the plant tissues inhibits electron transfer during respiration, especially the oxidation of reductive coenzyme in the term of I-NADH, which affects the normal physiological activities of crops [30,31,32]. Excessive uptake of NH4+ could induce a series of impacts on plants, including the deficiency of other cations in plants, alter in cellular pH and osmotic balance, disruption of the electron transfer in the photosynthetic phosphorylation process, and the accumulation of NH4+ in leaves and changes in the metabolism of polyamines and phytohormones, and finally resulting in stunted root growth, chlorotic leaves, reduced root-to-crown ratio, decreased biomass and even death of the plant. However, under eCO2, these situations may differ to some degree [33,34].
Currently, a few studies have examined the individual effects of eCO2 and N forms on plant growth. However, an explicit study on responses of plant growth to different N forms under different atmospheric CO2 concentrations is lacking. In this study, we conducted a sand incubation experiment with nutrient solutions based on the environment-controlled incubator to examine the influence of N supply forms on wheat and maize growth under different atmospheric CO2 concentrations. We expect this study will provide N management strategies on crop production aiming at high-yield and high-quality agricultural production under rising atmospheric CO2 concentration conditions in the future.
2. Materials and Methods
2.1. Sand Culture Experiment
In this study, sand culture was carried out using wheat (variety of Zhongmai 175) and maize (variety of Zhengdan 958) as studied plants, representing C3 and C4 photosynthetic types, respectively. In the experiment, wheat and maize seedlings with 2 to 3 leaves were transplanted into pots and placed in the CO2−controlled light incubators (model RGL-P1000-F3, Hefei Dascate Biotechnology Co., Ltd., Hefei, China) where environmental factors were controlled, including CO2 concentrations, light, and temperature. Black plastic pots with the dimensions 5 cm × 10 cm × 13.5 cm and 9.5 cm × 13 cm × 19 cm were used for wheat and maize, respectively (bottom diameter × top diameter × height). All the pots were filled with 2–4 mm sterilized vermiculite, 170 g for wheat pots, and 250 g for maize pots, retaining one seedling per pot. Two incubators of the same model were set up under two CO2 concentrations at 390 µmol∙mol−1 and 690 µmol∙mol−1 respectively. In the RCP6.0 scenario of the IPCC AR5, atmospheric CO2 concentrations are projected to reach 670 μmol/mol by 2100. Combined with the control facilities of the CO2-controlled light incubators, a setting of 690 μmol/mol was made in this study, closer to the future concentration of atmospheric CO2 by the year 2100 under RCP 6.0 scenario, a moderate greenhouse gas mitigation scenario in the future. The culture temperatures were set at 30 ± 0.5 °C at daytime and 15 ± 0.5 °C at night, respectively. Plants were exposed to light from 08:00 to 18:00 every day and kept in the dark at night, with a constant relative humidity of 50% ± 3%. CO2 was continuously supplied via external gas cylinders from 08:00 to 18:00 during the day, and no external CO2 was supplied to the incubator at night. Both wheat and maize were incubated for 42 days. When the CO2 concentration reached the destination concentration, the balance of air was maintained. The remaining gas in the air was also relatively balanced.
2.2. Experimental Design
The incubation experiment comprised 6 treatments (Table 1): (1) ambient CO2 concentration + nutrient solution with ammonium−N as N supply form (aCO2−AmN); (2) ambient CO2 concentration + nutrient solution with nitrate−N as N supply form (aCO2−NiN); (3) ambient CO2 concentration + whole nutrient solution with mixed ammonium−N and nitrate−N as N forms (aCO2−Mix) in which both nitrate−N and ammonium−N in total N concentration were each equivalent to a single nitrogen supply treatments. and (4)–(6) with enriched CO2 concentration (eCO2) under three different N supply forms including eCO2−AmN, eCO2−NiN and eCO2−Mix. Each treatment had 10 pots placed randomly in the incubator.

Table 1.
Six treatments of the experiment.
The wheat/maize seeds were disinfected with 75% alcohol and 2% sodium hypochlorite solution and then rinsed with sterile water for subsequent use. The sterilized wheat/maize seeds were placed on the filter paper in the sterilized petri dish, sprayed with sterile water, and placed in an incubator under a constant temperature of 28 °C for germination. Wheat seedlings with green buds up to 2 cm were placed in the refrigerator at 4 °C for 4 to 5 d for vernalization. Germinated seeds with the same degree of growth period were transferred to a nursery tray filled with sterilized vermiculite. Then, 7 days after germination (7 d), seedlings with the same degree of growth were selected and transplanted to their corresponding cultivation pots. Seedlings in the culture pots were regularly watered using Hoagland’s complete nutrient solution (Fuzhou Feijing Biotechnology Co., Ltd., Fuzhou, China). The N concentration in the nutrient solution was 1 mM. After 20 days of growing in each incubator, 48 pots at the same growth stage were selected to go to the next process, in which each treatment had eight replicates.
After 20 days of incubation, the Hogeland full nutrient solution was replaced with a nitrogen-free Hogeland nutrient solution, and three different N sources were additionally added. (NH4)2SO4 was added at the 1 mM ammonium−N concentration to eight pots as an AmN treatment. KNO3 was added at the 1 mM nitrate−N concentration to another eight pots as NiN treatment. NH4NO3 was added as 0.5 mM concentration (0.5 mM ammonium−N plus 0.5 mM nitrate−N) to another group of 8 pots as a mix treatment. The companion ion for AmN was sulfate, which made the sulfate concentration 11% higher than the original 4.6 mM, which was not toxic to the seedlings at this concentration [20,35,36]. For the NiN−treated pots, the companion ion was potassium, with a concentration higher by 17% than the original solution (6 mM), which would not induce toxicity at the concentration, according to the literature [21,37,38,39,40]. On the 42nd day of incubation (i.e., three weeks after different N solution watering), seedlings were sampled to measure the associated indices and avoid serious toxicity of ammonium−N on seedlings with too long duration [41,42,43]. Furthermore, at this incubation stage, the fast-growing vegetation period, the root exudate was more vigorous than during the reproduction period for better root exudate collection and measurement in this study [44,45].
2.3. Measurement Indices and Methods
On day 42, after germination, 5 pots of each treatment were sampled. On the sampling day, seedlings were grown in the incubator for 5 h in the morning, and 3 pots for each treatment were randomly selected to measure the root exudates by gently rinsing the seedling with sterilized water to wash away the soil and sand particles attached to the surface of the roots. To analyze the root exudes, the seedlings with roots submerged in sterilized water at minimal amounts were incubated under aCO2 and eCO2 for 3 h. The collected solution was quickly frozen in liquid nitrogen and stored at −80 °C until further analysis. The concentrations of total carbon (C) and N in the exudates were determined using a C and N analyzer (Multi N/C 2100, Jena, Germany). Root exudate is usually composed of polysaccharides, amino acids, organic acids, etc., which are C- or N- compounds and may produce some other possible effects on the soil C and N cycling in the soil, therefore we tried to check more effects of eCO2 on root exudate except for the visible phenological trait of plant growth in this study.
The remaining five replicates of seedlings for each treatment were also washed with sterilized water to determine their relevant morphological traits, including the plant height, stem diameter, maximum root length, and number of tillers for wheat/maize, and then dried under 105 °C to determine the aboveground and belowground biomass. The total C and N concentrations for above and belowground biomass were measured using an elemental analyzer (Vario-PYRO-cube, Langenselbold, Germany). The C and N analyzer and elemental analyzer work by converting the C and N elements into CO2 gas and nitrogen oxide, respectively, to obtain a value. The C and N analyzer measures the carbon and nitrogen content in water samples, while the elemental analyzer measures the carbon and nitrogen content in solid samples.
2.4. Data Analysis
All data were analyzed using Microsoft Excel 2010. Statistical analysis and multiple comparisons were conducted using SPSS 24.0 with one-way ANOVA and two-way ANOVA analysis. Graphs were drawn using Excel 2010 and Origin 2021.
3. Results
3.1. Response of Wheat and Maize to N Forms under Different Atmospheric CO2 Concentrations in Morphological Traits
Regardless of aCO2 or eCO2 conditions, the plant height of wheat, as shown in Table 2, exhibited the following trend under different N supply treatments: Mix ≈ AmN > NiN, indicating that young wheat seedlings had a certain uptake preference for ammonium−N. Within 42 d, the plant height of wheat in the Mix treatment significantly increased by 26.4% (aCO2) and 16.2% (eCO2), compared with the NiN treatment. Compared to the AmN treatment, the plant height of wheat under Mix also showed an increase to a certain extent, but not at a significant level, increasing by 10.1% and 8.3% under aCO2 and eCO2 conditions, respectively. Under the same N supply forms, there was no significant difference in plant height between the eCO2 and aCO2 treatments.
Table 2.
Agronomic traits for wheat growing.
The responses of the maximum root length of wheat to N forms were different under different CO2 concentration levels. The root length of seedlings supplied with nitrate−N and mixed N under aCO2 was significantly higher than that of seedlings supplied with ammonium−N, showing a 29.1% and 38.9% increase, respectively. However, no significant difference was observed in the maximum root length of wheat between nitrate−N and mixed nitrogen treatments. Under eCO2 conditions, the maximum root length of wheat treated with ammonium−N was significantly greater than that under aCO2; however, it did not show a significant difference between NiN and Mix treatments under either aCO2 or eCO2 conditions.
The response of wheat tiller numbers to different N forms was relatively significant among treatments (Table 2). The results of two-way ANOVA showed that there was an interaction between CO2 and N forms on the tiller numbers for wheat. Regardless of aCO2 or eCO2 conditions, the overall pattern showed the following trend: Mix > NiN > AmN treatment. For the single N supply treatments, the tiller numbers of wheat treated with nitrate−N increased significantly (p < 0.05) by 32.0% and 82.6% than AmN treatments under aCO2 and eCO2 conditions, respectively. Compared with the AmN and NiN treatments, the tiller number of seedlings under the miN treatment increased by 56.0% (p < 0.05) and 18.2% under aCO2 conditions, and by 141.3% (p < 0.05) and 32.1% (p < 0.05) under eCO2 conditions. For wheat seedlings supplied with single N, the tiller numbers did not show a significant difference under different CO2 conditions, while treatments supplied with mixed N forms exhibited a significant increase in the tiller numbers by 33.6% under eCO2 than aCO2.
The stem diameter of wheat (Table 2) was significantly larger for treatments with mixed N supply than that with single N forms. However, there was little difference in wheat stem diameter among treatments supplied by a single N form (i.e., either AmN or NiN), and the overall trend of stem diameters was Mix > NiN ≈ AmN. For the mixed N supply treatment, the stem diameter of wheat under the eCO2 condition increased significantly by 18.3% compared with the aCO2 condition. The two-way ANOVA results showed no significant negative interaction between eCO2 and N supply form on agronomic traits for maize growing under experimental conditions.
In general, for the morphological development of wheat, single ammonium−N supply mainly affected the maximum root length and tiller number of wheat. The negative impact of ammonium−N on the maximum root length of wheat was greater under aCO2 conditions. Under eCO2 conditions, the negative impact of single ammonium−N supply on wheat root length was not significantly different from treatments with single nitrate−N and mixed Nitrogen supply, indicating that roots preferred to uptake ammonium−N under eCO2 conditions to some extent, perhaps due to partial instant offset of increased photosynthesis under eCO2 to ammonium toxic. The overall response of morphological development for wheat seedlings with mixed N supply was generally better than treatments with single N supply, and the nitrate−N treatment was much better than the ammonium−N treatment, especially in terms of tiller number.
Regarding the morphological development indicators of maize (Table 3), no significant difference was observed in shoot diameter and maximum root length between different treatments. However, some differences were observed in plant height. The seedlings of the eCO2−Mix treatment exhibited the most height, followed by eCO2−NiN, and there were no significant differences in plant height among the other four treatments, indicating that eCO2 and Mix had a positive interaction with maize plant height. This differed from the obvious variations in the performance of wheat plant height under the supply of different N forms.
Table 3.
Agronomic traits for maize growing.
3.2. Response of Wheat and Maize in Biomass to Different N Supply Forms under Different Atmospheric CO2
After drying, the aboveground biomass (Figure 1, Table 4) showed that regardless of aCO2 or eCO2 conditions, the overall trend of aboveground biomass of wheat supplied with different N forms was: Mix ≈ NiN > AmN. Under aCO2 conditions, the aboveground biomass of wheat treatments supplied with mixed N and nitrate−N was 1.88 and 1.66 times that of the ammonium−N treatment, respectively. By contrast, under eCO2 conditions, these differences were even higher, being 2.86 and 2.94 times greater, respectively.
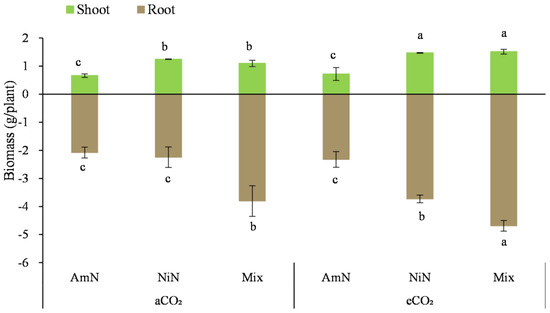
Figure 1.
Biomass of wheat supplied with different N forms under two atmospheric CO2 concentrations. Note: (1) AmN denotes Ammonium N, NiN denotes Nitrate N, Mix denotes Mixed N; (2) aCO2 denotes the ambient atmospheric CO2 concentration at 390 µmol/mol; eCO2 denotes the enriched atmospheric CO2 concentration at 690 µmol/mol; (3) Different letters mean significant differences at p < 0.05 level for each indice; (4) Statistical analyses for above- and belowground are conducted separately; (5) Error bars are the standard deviation of five replicates.
Table 4.
Two-factor ANOVA analyses for wheat biomass.
The belowground wheat biomass after 42 d of growth was 1.8 to 4.5 times that of the aboveground biomass. Under eCO2 conditions, the belowground biomass was much higher than that under aCO2 conditions, increasing by approximately 11.9–66.0%. Under aCO2 conditions, the overall trend of belowground biomass for wheat with different N supply forms was: Mix > NiN ≈ AmN. The belowground biomass of the mixed treatment was significantly higher by 83.0% and 69.3% under aCO2 conditions compared with the NiN and AmN treatments, respectively. By contrast, under eCO2 conditions, the belowground biomass of wheat supplied with different N forms was in the order of Mix > NiN > AmN, with significant differences among treatments. The belowground biomass of the mix showed significantly higher by 101.6% and 25.8%, respectively, compared with the treatments supplied with nitrate−N and ammonium−N under eCO2 (Figure 2).
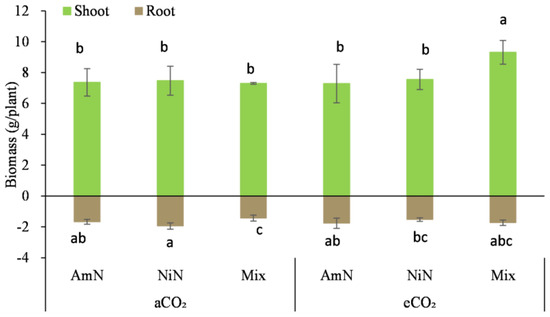
Figure 2.
Biomass of maize supplied with different N forms under two atmospheric CO2 concentrations. Note: (1) AmN denotes Ammonium N, NiN denotes Nitrate N, Mix denotes Mixed N; (2) aCO2 denotes the ambient atmospheric CO2 concentration at 390 µmol/mol; eCO2 denotes the enriched atmospheric CO2 concentration at 690 µmol/mol; (3) Different letters mean significant differences at p < 0.05 level for each indice; (4) Statistical analyses for above- and belowground are conducted separately; (5) Error bars are the standard deviation of five replicates.
For maize seedlings at 42d after germination, the aboveground biomass, after drying, in this period was 4.1 to 5.4 times that of the belowground biomass, which was different for wheat seedlings, where the belowground biomass in this period was 1.8 to 4.5 times that of the aboveground biomass, an opposite trend. Among the six treatments, only the aboveground biomass of the eCO2−Mix treatment for maize was significantly higher by 23.7% to 27.8% than the other treatments. The difference in aboveground biomass among the other five treatments was not significant. For the belowground biomass of maize, Mix treatment under aCO2 conditions was significantly lower than that of AmN and NiN treatments, by 6.0% and 13.9%, respectively. However, under eCO2 conditions, no significant difference was observed in the belowground biomass of maize supplied with different N forms (Table 5).
Table 5.
Two-factor ANOVA analyses for maize biomass.
3.3. Responses of C and N Concentrations in the Root Exudates to Different N Forms and Atmospheric CO2 Concentrations for Wheat and Maize
The total C concentration in wheat root exudates was in the range of 59.8–99.3 mg/L after 42 d of sand culture (Figure 3). The C concentration in the root exudates from the Mix treatment was 77.2 mg/L and 99.2 mg/L under aCO2 and eCO2 conditions, respectively, which were higher by 20.6% and 65.9% than that from the AmN treatment, respectively, and were not significantly different than NiN treatments. Under different atmospheric CO2 concentrations, except for the AmN treatment, the C concentration in the wheat exudates under eCO2 was higher than the corresponding treatment under aCO2 conditions. For the treatments supplied with mixed N and nitrate−N, the C concentrations under eCO2 in wheat root exudates were significantly higher than the corresponding treatments under aCO2 conditions, by 22.3% and 28.5%, respectively. For the ammonium N−supplied wheat, no significant difference was observed in the C concentration of root exudates between the eCO2 and aCO2 groups (Table 6).
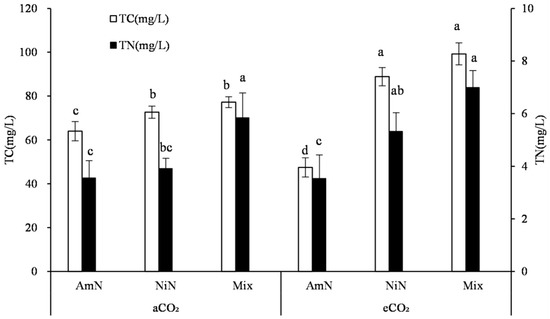
Figure 3.
Carbon and nitrogen concentrations in the root exudates of wheat. Note: (1) AmN denotes Ammonium N, NiN denotes Nitrate N, Mix denotes Mixed N; (2) TC means total C concentration, TN means total N concentration; (3) aCO2 denotes the ambient atmospheric CO2 concentration at 390 µmol/mol; eCO2 denotes the enriched atmospheric CO2 concentration at 690 µmol/mol; (4) Different letters mean significant differences at p < 0.05 level for each indice; (5) error bars are standard deviation; (6) Statistical analyses for TC and TN LSD are conducted separately.
Table 6.
Two-factor ANOVA analyses for indices in the root exudate of wheat.
The total N concentration in wheat root exudates after 42 d of growth was between 3.56 mg/L and 7.00 mg/L (Figure 3). No significant difference was observed between treatments with the same N form under different CO2 concentrations. When supplied with different N forms, the overall trend observed in the N concentration in exudates was: Mix > NiN > AmN. The N concentration of the Mix treatment under the eCO2 condition was significantly higher by 98.0% than that of the AmN treatment. The N concentrations of exudates among different N supply treatments under aCO2 conditions were not significant owing to the large variation across replicates.
For maize and C4 crops, the total C concentrations in root exudates of different N supply treatments were ranked at the trend: Mix ≈ NiN > AmN. However, the differences among treatments were not significant. Under different atmospheric CO2 concentrations, no significant difference was observed in the total C concentration of root exudates among treatments supplied with different N forms (Figure 4). The total N concentration in maize root exudates (Figure 4), under different N supply conditions, was significantly higher in the mix−N treatments than that supplied with single N. Under aCO2 conditions, the N concentration in maize root exudates in the mix treatment group was 38.6% and 58.3% higher than in the AmN and NiN treatments. Under eCO2 conditions, the total N concentration in maize root exudates in the Mix−N treatment was higher by 37.1% and 30.2% than that in the AmN and NiN treatments, respectively, which were slightly smaller improvements. Under different CO2 concentrations and the same nitrogen supply conditions, the nitrogen concentration of the exudates in the eCO2 treatment group was generally higher than that of the aCO2 treatment group. For the treatments supplied with different N forms of AmN, NiN, and mix, the N concentrations of the maize root exudates in the eCO2 group were significantly higher than that in the aCO2 group, by 27.9%, 53.8%, and 26.5%, respectively, indicating that promotion effect of eCO2 on N concentrations in the maize root exudates was stronger under eCO2 than under aCO2.
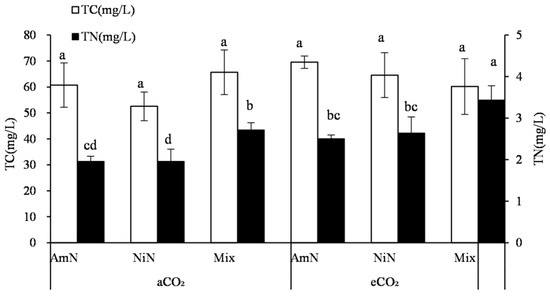
Figure 4.
Carbon and nitrogen concentrations in root exudates of maize. Note: (1) AmN denotes Ammonium N, NiN denotes Nitrate N, Mix denotes Mixed N; (2) TC means total C concentration, TN means total N concentration; (3) aCO2 denotes the ambient atmospheric CO2 concentration at 390 µmol/mol; eCO2 denotes the enriched atmospheric CO2 concentration at 690 µmol/mol; (4) Different letters mean significant differences at p < 0.05 level for each indice; (5) error bars are standard deviation; (6) Statistical analyses for TC and TN LSD are conducted separately.
Results of the two-way ANOVA showed that the interaction between CO2 and N form only exhibited a significant increase in TC concentration in wheat root secretions, and there was no significant difference in the TC and TN concentrations for maize among different treatments (Table 7).
Table 7.
Maize Two-factor ANOVA analyses for indices in the root exudate of wheat.
3.4. C and N Concentrations in the Aboveground and Belowground Biomass under Different N Supply Forms and Atmospheric CO2 Concentrations
Total C concentration in wheat seedlings: The aboveground and belowground C concentrations of wheat seedlings grown for 42 d were about 41.2–42.0% (aboveground) and 38.2–38.6% (belowground), with no significant difference among the six treatments (Figure 5).
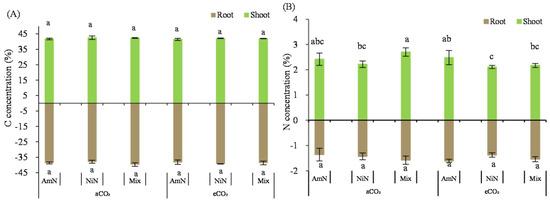
Figure 5.
The carbon (A) and nitrogen (B) concentrations of wheat seedlings. Note: (1) AmN denotes Ammonium N, NiN denotes Nitrate N, Mix denotes Mixed N; (2) TC means total C concentration, TN means total N concentration; (3) aCO2 denotes the ambient atmospheric CO2 concentration at 390 µmol/mol; eCO2 denotes the enriched atmospheric CO2 concentration at 690 µmol/mol; (4) Different letters mean significant differences at p < 0.05 level for each indice; (5) error bars are the standard deviation; (6) above- and belowground LSD are separate analyses.
Total N concentration in wheat seedlings: The aboveground N concentration of wheat seedlings was between 2.22% and 2.70% (Figure 5) and was generally lower in the eCO2 group than that in the aCO2 group. Under the eCO2 condition, N concentration in wheat seedlings supplied with ammonium−N, nitrate−N, and mixed nitrogen was reduced by 7.7%, 28.5% (p < 0.05, and 27.2% (p < 0.05), respectively, compared with the corresponding N supply treatments under aCO2 conditions. In the eCO2 group, the belowground N concentration in wheat seedlings for the NiN and mix treatments were significantly lower by 22.5% and 16.3%, respectively, compared with the AmN treatment.
The N concentration of wheat roots grown for 42 d was between 1.36% and 1.61%. Under aCO2 conditions, there was no significant difference in the N concentration of wheat roots among treatments supplied with different N forms. However, under eCO2 conditions, the N concentration of wheat roots treated with the nitrate−N and mixed N was significantly lower than that with ammonium−N, by 26.9% and 17.7%, respectively. Under eCO2 conditions, the N concentration of wheat roots supplied with nitrate−N and mixed N were significantly lower than those under aCO2 conditions, by 16.8% (NiN) and 13.7% (Mix). For the ammonium−N supply treatments, there was no significant difference in the N concentration of wheat roots between the aCO2 and eCO2 groups (Table 8).
Table 8.
Two-factor ANOVA analyses for C and N concentration in wheat seedlings.
N uptake in the wheat seedlings: For wheat seedlings supplied with different N forms (Figure 6), the N uptake in the Mix treatment was higher than that in the other two treatments supplied with single N forms (i.e., either AmN or NiN) regardless of aboveground or belowground parts. The aboveground N uptake of the Mix treatment group was higher by 59.2% and 15.0% than that from AmN and NiN, respectively (average of aCO2 and eCO2 conditions). For single N−supplied treatments, no significant difference was observed in the N uptake under aCO2 conditions. However, the N uptake of plants in the nitrate−N treatment group was significantly higher than that of plants in the ammonium−N treatment group by 43.2% under eCO2 conditions (average of aboveground and belowground content) (Table 9).
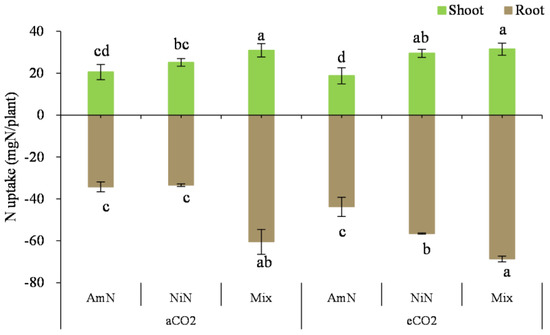
Figure 6.
The N uptake of wheat seedlings. Note: (1) AmN denotes Ammonium N, NiN denotes Nitrate N, Mix denotes Mixed N; (2) TC means total C concentration, TN means total N concentration; (3) aCO2 denotes the ambient atmospheric CO2 concentration at 390 µmol/mol; eCO2 denotes the enriched atmospheric CO2 concentration at 690 µmol/mol; (4) Different letters mean significant differences at p < 0.05 level for each indice; (5) error bars are standard deviation; (6) above- and belowground LSD are separate analyses.
Table 9.
Two-factor ANOVA analyses for N uptake in wheat seedlings.
N uptake in the wheat roots: For the N uptake in the wheat roots, it was significantly higher in the mix treatments than that in the treatments supplied with a single N supply. Under aCO2 conditions, the N uptake in the wheat roots was 76.6% and 80.6% higher than in the AmN and NiN treatments, whereas the percentage increase was 56.8% and 21.4%, respectively. In addition, the root N uptake in the NiN treatment group under eCO2 conditions was significantly higher than that under aCO2 conditions and higher than that in the AmN group, which was perhaps attributed to the dilution effect resulting from higher biomass of NiN treatment under the eCO2 treatment than under aCO2 (Figure 2). Under aCO2 conditions, there was no significant difference in the root N uptake between AmN and NiN treatments. Under different atmospheric CO2 conditions, the root N uptake in the NiN and Mix groups under eCO2 conditions was significantly higher than that of their corresponding treatments under aCO2 conditions, by 68.8% and 13.5%, respectively. However, there was no significant difference in the N uptake in the wheat roots treated with AmN under different atmospheric CO2 concentrations.
Total carbon concentration in maize seedlings: The total carbon concentration in the maize seedlings grown for 42 d ranged from 40.7% to 41.0% (aboveground) and from 37.7% to 39.3% (belowground). Similar to the measurement results from wheat, there were no significant differences in the C concentration among biomass of the six treatments for either aboveground or belowground (Figure 7).
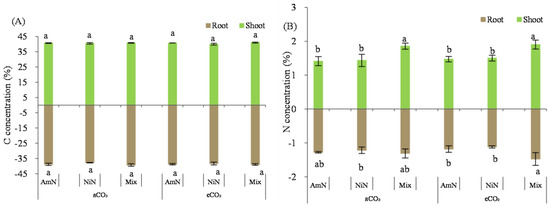
Figure 7.
The total carbon (A) and total nitrogen (B) concentration in maize seedlings. Note: (1) AmN denotes Ammonium N, NiN denotes Nitrate N, Mix denotes Mixed N; (2) TC means total C concentration, TN means total N concentration; (3) aCO2 denotes the ambient atmospheric CO2 concentration at 390 µmol/mol; eCO2 denotes the enriched atmospheric CO2 concentration at 690 µmol/mol; (4) Different letters mean significant differences at p < 0.05 level for each indice; (5) error bars are the standard deviation; (6) above- and belowground LSD are separate analyses.
Total N concentration in maize seedlings: The aboveground N concentration of maize seedlings grown for 42 d was around 1.43–1.86% (Figure 7). Data showed that the N concentration was higher in the mixed treatments than in single N form supplied treatments regardless of aCO2 or eCO2 conditions. The N concentration of maize seedlings in the mixed treatment was significantly higher than that supplied with ammonium−N and nitrate−N under aCO2, by 35.4% and 54.7% under aCO2, respectively. In contrast, the percentage increase was 19.0% and 26.7% under eCO2, respectively. However, for the treatments supplied with the same N form, the N concentration in the amaze seedlings did not significantly differ under different atmospheric CO2 concentrations.
For the N concentration of maize roots grown over 42 d, the measurement data exhibited in the order Mix > NiN ≈ AmN, regardless of atmospheric CO2 concentrations (Figure 7). For the treatments supplied with mixed N forms, the N concentration in the maize roots was higher than single N−supplied treatments by 23.9% (average under aCO2) and 38.8% (average under eCO2), respectively. Similar to that observed for the aboveground N concentration in maize seedlings, there was no significant difference in the N concentration in the maize root for treatments supplied with the same N forms between the aCO2 and eCO2 groups.
N uptake in maize seedlings: For maize grown over 42 d, the N uptake in seedlings was 4.98 to 8.22 times that in the roots (Figure 8). N uptake in maize seedlings in the mixN treatments was significantly higher than in treatments supplied with AmN and NiN, by 43.8% and 54.0% (average of aCO2 and eCO2 conditions), respectively. However, no significant difference was observed in the aboveground N uptake between the treatment groups supplied with the two single−N−supplied treatments. For the N uptake in seedlings from the mixed treatment, it was significantly higher by 13.9% under eCO2 than that under aCO2. For the treatments supplied with single N, there was no significant difference in the N uptake under different CO2 concentrations.
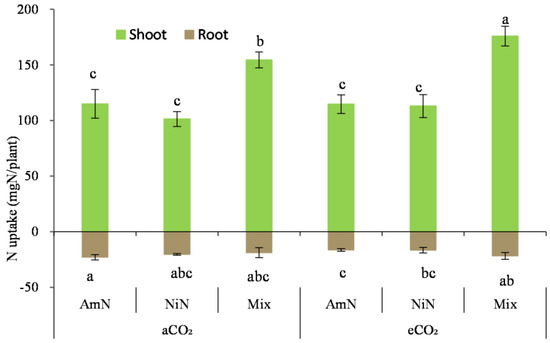
Figure 8.
The N uptake of maize seedlings. Note: (1) AmN denotes Ammonium N, NiN denotes Nitrate N, Mix denotes Mixed N; (2) TC means total C concentration, TN means total N concentration; (3) aCO2 denotes the ambient atmospheric CO2 concentration at 390 µmol/mol; eCO2 denotes the enriched atmospheric CO2 concentration at 690 µmol/mol; (4) Different letters mean significant differences at p < 0.05 level for each indice; (5) error bars are standard deviation; (6) above- and belowground LSD are separate analyses.
For the N uptake in the maize roots (Figure 8), it only exhibited a significant decrease in AmN treatment than that in treatments with nitrate−N and mixed N supply (p < 0.05) under eCO2, which was the combined effect of biomass and N concentration. There was no significant difference in the N uptake among other treatments under the different CO2 conditions.
Two-way ANOVA showed that the interaction of CO2 and N form had significant interaction in N content in the aboveground part of wheat and N uptake at the belowground part of maize. Still, no other significant interaction was found (Table 8, Table 9, Table 10 and Table 11).
Table 10.
Two-factor ANOVA analyses for C and N concentrations in maize seedlings.
Table 11.
Two-factor ANOVA analyses for N uptake in maize seedlings.
4. Discussion
4.1. Response of Plant Growth on Different N Supply Forms
Although both wheat and maize, dryland-derived crops, prefer nitrate−N, some studies have also reported that wheat and other crops have a certain demand for ammonium−N at the seedling stage [46]. Our measurement showed that most growing indices of wheat and maize exhibited better under the supply of mixed N forms, which is consistent with the results reported in most previous studies [47,48,49].
The responses of different growth indices in wheat and maize to single N form supply were not uniform. For wheat, the main morphological and C and N indices to ammonium−N supply were worse than those with a nitrate−N application (except plant height), including the maximum root length, stem diameter, tiller numbers, C concentration in root exudates, and N uptake by seedlings. Furthermore, most growth indices in the single nitrate−N supplied treatments were better than those observed under single ammonium−N supplied. Some growth indices for the single nitrate−N treatments were equivalent to those under the mixed N conditions, which were reflected in the aboveground biomass, C concentration in root exudates, and aboveground N uptake. For maize, C4 photosynthetic type, treatment applied with mixed N forms exhibited better in terms of plant height, plant N concentration, and N concentration in root exudates compared with those supplied with single N forms. Maize seedlings supplied with Nitrate−N also grew better than those supplied with ammonium−N, especially in plant height. However, indices regarding belowground growing and other aboveground morphological indices measured in maize in this study did not show significant differences across treatments supplied with different N forms. This perhaps may be attributable to the characteristics of maize, such as large leaf area, high photosynthetic efficiency of the C4 pathway, and higher resistance to stress. The two-factor interaction between CO2 and N form was found in terms of tiller number, above- and belowground dry weight, carbon concentration in root exudates, and was minute in N concentration in wheat. The two-way ANOVA showed that interaction between CO2 and N form was significantly expressed in belowground biomass and root N uptake in maize.
In general, dryland crops that prefer nitrate could uptake and accumulate more nitrate than its required amount. Excessive nitrate−N is usually stored in the vegetative organs and mainly occurs during the vegetative growth stage [50]. Nitrate−N accumulated in plants can be used as endogenous nutrient storage and released into the cytoplasm for the plant to re-use when the exogenous N supply is insufficient [51]. Crops can tolerate nitrate−N o a certain extent; however, excess ammonium−N could damage nitrate-preferring crops [52]. Large amounts of ammonium−N uptaken by nitrate-preferring plants cannot be assimilated in time and thus accumulated in the plant cells, followed by ammonium-toxicity to crops, via inhibiting electron transfer during respiration metabolism, especially caused oxidation of reduced coenzyme I-NADH, thereby affecting normal physiological activities for plant growing [53]. Studies have shown that plants that uptake ammonium−N could release H+ in the root, causing acidification in the root environment and thus resulting in toxicity on roots [54,55]. By contrast, when plants uptake nitrate−N, the root system releases OH− to the rhizosphere, increasing the pH of the rhizosphere, which is beneficial for root growth [55,56]. As previously reported, under high ammonium−N conditions, the leaf area of wheat was reduced [52], and the root growth was restricted [56], thus causing a reduction in the root-to-shoot ratio and other signs derived from ammonium toxicity, such as the occurrence of fine roots and black roots [57]. It was observed that when ammonium−N and nitrate−N were simultaneously supplied, the root system exhibited a robust ability to uptake and assimilate ammonium−N, and the ammonium−N could be utilized by the meristem of the root tips effectively [57].
N, an important compositional element for chlorophyll, plays a role in the process of photosynthetic carbon assimilation in plants [58]. At the same time, nitrogen assimilation in plants also requires a large amount of the carbon skeleton and energy derived from plant photosynthesis [59]. Therefore, the quantity and form of N supply are critical to the plant [60]. Ammonium−N is mainly assimilated in the roots, and nitrate−N could be assimilated in both root and shoots; thus, the appropriate supply of both forms of N could promote the co-utilization of carbohydrates [61]. It was reported that, under mixed N supply conditions, the activity of glutamine synthase (GS) for ammonium−N assimilation was higher [62], and the expression level of glutamate synthase (GOGAT) required in the second step of ammonium assimilation was also higher than that under single N form supply [63]. Therefore, the simultaneous supply of both ammonium−N and nitrate−N could ensure plants assimilate N using mild energy, allowing plants to grow better. This is in line with the observation of this study, which exhibited the comprehensive effects of supply with multiple N forms on the various growth indices of wheat maize than single N supply.
4.2. Response of Plant Growth to N Supply Forms under Elevated Atmospheric CO2 Concentrations
In this study, compared with aCO2 conditions, the growth differences of wheat supplied with different N forms under eCO2 conditions were reflected in the following aspects: (i) For the single ammonium−N supplied treatment, the maximum root length of wheat seedlings supplied under the eCO2 conditions was greater than that under aCO2 (Table 2). (ii) For the single nitrate−N supplied wheat, some growth indices exhibited better under eCO2 than under aCO2 conditions, including aboveground and belowground biomass (Figure 1), as well as C concentration in root exudates (Figure 3) and N concentration in the plant (Figure 6) perhaps due to the dilution effect by higher biomass. (iii) As to the treatments treated with mixed N forms, these indices displayed significant improvement under eCO2 than under aCO2, including the stem diameter (Table 2), aboveground and belowground biomass (Figure 1), and C concentration in root exudates (Figure 3).
Unlike wheat, for maize, a C4 photosynthetic plant, most growth indices did not show significant differences for single N−supplied treatments between eCO2 and aCO2 conditions. The effects of eCO2 on the maize seedlings were mainly observed in the mixed N−supplied treatment, specifically in the plant height (Table 3), N concentration in root exudates (Figure 4), and aboveground N uptake (Figure 8), thereby reflecting the different responses of different photosynthetic types of crops to eCO2 conditions.
As a nitrate-preferring crop, the finding that eCO2 had a significant effect on wheat growth under mixed N supply conditions is consistent with the results of most previous studies [59,60,61]. However, in a study on Pinus sylvestris, Su [64] found that eCO2 promoted biomass accumulation at different supply ratios of ammonium to nitrate. In a study conducted on tomato (C3 plant), Cohen [65] found that whether ammonium−N or nitrate−N was supplied, eCO2 increased the N uptake of the whole plant and improved the water use efficiency of the shoot. However, eCO2 inhibited the development of xylem vessels and thus increased the root length. Tingey [66] and Ma [67] experiments on rice and Douglas fir found that under eCO2 concentrations, photorespiration decreased, perhaps caused by the increased sensitivity of Rubisco to eCO2. Thus, the N concentration in the roots was significantly higher than that in the aboveground biomass because less N was allocated to photosynthesis−related enzymes (e.g., RuBP carboxylase, nitrate reductase, and glutamine synthase). This is consistent with our results that N concentration (Figure 5) and N uptake in the roots (Figure 6) were increased in wheat seedlings supplied with nitrate−N or mixed N under eCO2 conditions in this study.
In general, wheat seedlings had distinct responses in various indices to different N supply forms under both aCO2 and eCO2 conditions, indicating that wheat seedlings were more sensitive to the variation in atmospheric CO2 concentrations than maize seedlings. Supply with single ammonium−N negatively influenced most growth indices, including the maximum root length, tiller number, and aboveground biomass. The maximum root length of wheat seedlings supplied with ammonium−N was greater under eCO2 conditions than under aCO2 conditions, suggesting that increased C assimilation under eCO2 conditions may partly offset the negative impacts of single N supply to wheat seedlings. However, the C concentration in root exudates showed a decrease (p < 0.05) in wheat, which may be associated with the resilience strategy of the root system under higher CO2 conditions. Hu’s [68] study on tea trees showed that an increased ratio of ammonium-to-nitrate under a mixed N supply scenario could cause a decrease in stomatal conductance and thus may cause a reduction in the uptake of other nutrients via transpiration flow, such as calcium, magnesium, potassium, and other mineral elements, which in turn impact plant growth [69].
According to the comprehensive analysis based on our results and the literature mentioned above, it could be deduced that even if C3 crops theoretically prefer to uptake ammonium−N under eCO2 in the future, mixed N supply is still required due to possible toxicity under excessive ammonium−N. Further, under eCO2, it is likely better for plant growth to increase the ratio of ammonium-to-nitrate based on the mixed N supply forms. This is supported by the fact that the best overall growth for both wheat and maize was achieved with a mixed nitrogen supply under eCO2 conditions in this study.
Under future climate change characterized by elevated atmospheric CO2 concentrations, nitrification inhibitors could be recommended to use in order to inhibit soil nitrification to a certain extent, making N exist in the form of ammonium−N for a longer period in the dryland system dominated by nitrate−N [70]. Based on the N management strategy, using the nitrification inhibitors, it can meet the preference of plants for soil ammonium−N uptake to a certain extent, as well as decrease the N2O emission derived from nitrification, and thus promote plant growth. Regarding the optimal ratio of ammonium-to-nitrate−N under eCO2 for different crops in each period, a more detailed investigation is needed.
5. Conclusions
In this study, sand culture experiments were conducted to investigate the response of wheat and maize growth to N supply forms under different atmospheric CO2 conditions and got the following main conclusions:
Response of wheat and maize growth to N supply forms: Wheat plants supplied with ammonium N were characterized by taller and thinner seedlings, a lower number of tillers, and a shorter maximum root length. Wheat seedlings with nitrate N supply had slightly shorter plant heights and more tillers. Compared to wheat plants treated with ammonium N, the treatment of wheat seedlings supplied with mixed N showed better promotion than the treatments with single N supply in most of the growth indices. For maize, a C4 crop, the advantage of mixed N supply over single N supply was mainly exhibited in the promotion in terms of biomass and N concentration in both plant and root exudates.
Response of wheat and maize growth to N supply forms under eCO2: In treatments with ammonium N supply, the maximum root length of wheat seedlings was greater under eCO2 conditions than under aCO2, whereas higher C concentration in root exudate and biomass were observed in wheat seedlings supplied with nitrate and mixed N under eCO2 conditions than under aCO2. Maize seedlings provided with mixed forms of N supply under eCO2 conditions exhibited greater plant height, N concentration in root exudates, and N uptake in shoots. However, the main growth indices in maize did not show significant improvement in treatments with single N supply under eCO2 conditions compared to that under aCO2.
As the application of single ammonium N could result in a certain level of toxicity to plants, it is recommended to appropriately adjust N supply with an increased ammonium N ratio in mixed N forms to meet the demand of crops in response to increased atmospheric CO2 concentrations under future climate change scenarios.
Author Contributions
The experiment was designed and investigated by L.G. Data analysis was conducted by X.H., P.L., Y.L. (Yingchun Li) and L.G. Experiments were conducted by L.D., Y.L. (Ying Liu) and F.M.; Manuscript was prepared by L.D. and L.G. All authors have read and agreed to the published version of the manuscript.
Funding
This study was funded by the National Key R&D program of China (2019YFA0607403) and National Natural Science Foundation of China (31971773). The Agricultural Science and Technology Innovation Program of the Chinese Academy of Agricultural Sciences also supported this study.
Data Availability Statement
The original contributions presented in the study are included in the article. Further inquiries can be directed to the corresponding author.
Conflicts of Interest
The authors declare that the research was conducted in the absence of any commercial or financial relationships that could be construed as a potential conflict of interest.
References
- WMO. The state of greenhouse gases in the atmosphere based on global observations through 2020. WMO Greenh. Gas Bull 2021, 17, 1–10. [Google Scholar]
- IPCC. Climate Change 2021: The Physical Science Basis. Contribution of Working Group I to the Sixth Assessment Report of the Intergovernmental Panel on Climate Change; Pachauri, R.K., Meyer, L.A., Eds.; IPCC: Geneva, Switzerland, 2021. [Google Scholar]
- Lee, S.H.; Megonigal, P.J.; Langley, A.J.; Kang, H. Elevated CO2 and nitrogen addition affect the microbial abundance but not the community structure in salt marsh ecosystem. Appl. Soil Ecol. 2017, 117–118, 129–136. [Google Scholar] [CrossRef]
- Atia, A.; Rabhi, M.; Debez, A.; Abdelly, C.; Gouia, H.; Haouari, C.C.; Smaoui, A. Ecophysiological aspects and photosynthetic pathways in 105 plants species in saline and arid environments of Tunisia. J. Arid Land 2014, 6, 762–770. [Google Scholar] [CrossRef]
- Wang, F.; Gao, J.; Yong, J.W.H.; Wang, Q.; Ma, J.; He, X. Higher atmospheric CO2 levels favor C3 plants over C4 plants in utilizing ammonium as a nitrogen source. Front. Plant Sci. 2020, 11, 537443. [Google Scholar] [CrossRef] [PubMed]
- Ma, Z.L.; Zhao, W.Q. Research progress on input of plant community-derived soil organic carbon and its responses to climate warming. Chin. J. Ecol. 2020, 39, 270–281, (In Chinese with English abstract). [Google Scholar]
- Wang, B.; Wang, Y.F.; Guo, C.; Li, Y.E.; You, S.C.; Qin, X.B.; Chen, H.L. Effects of elevated air temperature and carbon dioxide concentration on nitrogen use of double rice (Oryza sativa L.) in Open-top Chambers. Acta Agron. Sin. 2015, 41, 1295–1303, (In Chinese with English abstract). [Google Scholar] [CrossRef]
- Bloom, A.J.; Kasemsap, P.; Rubio-Asensio, J.S. Rising atmospheric CO2 concentration inhibits nitrate assimilation in shoots but enhances it in roots of C3 plants. Physiol. Plant. 2019, 168, 963–972. [Google Scholar] [CrossRef]
- Long, S.P.; Ainsworth, E.A.; Rogers, A.; Ort, D.R. Rising atmospheric carbon dioxide: Plants FACE the Future. Annu. Rev. Plant Biol. 2004, 55, 591–628. [Google Scholar] [CrossRef] [PubMed]
- Stitt, M.; Krapp, A. The interaction between elevated carbon dioxide and nitrogen nutrition: The physiological and molecular background. Plant Cell Environ. 1999, 22, 583–621. [Google Scholar] [CrossRef]
- Baker, J.; Allen, L.H.; Boote, K.; Pickering, N. Rice responses to drought under carbon dioxide enrichment 2. Photosynthesis and evapotranspiration. Glob. Change Biol. 2010, 3, 129–138. [Google Scholar] [CrossRef]
- Shimono, H.; Bunce, J.A. Acclimation of nitrogen uptake capacity of rice to elevated atmospheric CO2 concentration. Ann. Bot. 2008, 103, 87–94. [Google Scholar] [CrossRef] [PubMed]
- Del Pozo, A.; Pérez, P.; Morcuende, R.; Alonso, A.; Martínez-Carrasco, R. Acclimatory responses of stomatal conductance and photosynthesis to elevated CO2 and temperature in wheat crops grown at varying levels of N supply in a Mediterranean environment. Plant Sci. 2005, 169, 908–916. [Google Scholar] [CrossRef]
- Li, X.; Khan, A.; Lv, Z.; Fang, L.; Jiang, D.; Liu, F. Effect of multigenerational exposure to elevated atmospheric CO2 concentration on grain quality in wheat. Environ. Exp. Bot. 2019, 157, 310–319. [Google Scholar] [CrossRef]
- Asseng, S.; Jamieson, P.; Kimball, B.; Pinter, P.; Sayre, K.; Bowden, J.; Howden, S. Simulated wheat growth affected by rising temperature, increased water deficit and elevated atmospheric CO2. Field Crops Res. 2004, 85, 85–102. [Google Scholar] [CrossRef]
- Weigel, H.-J.; Manderscheid, R. Crop growth responses to free air CO2 enrichment and nitrogen fertilization: Rotating barley, ryegrass, sugar beet and wheat. Eur. J. Agron. 2012, 43, 97–107. [Google Scholar] [CrossRef]
- Broberg, M.C.; Högy, P.; Feng, Z.; Pleijel, H. Effects of elevated CO2 on wheat yield: Non-linear response and relation to site productivity. Agronomy 2019, 9, 243. [Google Scholar] [CrossRef]
- Dennis, P.G.; Miller, A.J.; Hirsch, P.R. Are root exudates more important than other sources of rhizodeposits in structuring rhizosphere bacterial communities? FEMS Microbiol. Ecol. 2010, 72, 313–327. [Google Scholar] [CrossRef]
- Paterson, E.; Hall, J.M.; Rattray, E.A.S.; Griffiths, B.S.; Ritz, K.; Killham, K. Effect of elevated CO2 on rhizosphere carbon flow and soil microbial processes. Glob. Change Biol. 1997, 3, 363–377. [Google Scholar] [CrossRef]
- Bouranis, L.D.; Chorianopoulou, N. Styliani; Dionias, Alexandros; Sofianou, Giouli; Thanasoulas, Aristotelis; Liakopoulos, Georgios; Nikolopoulos, Dimosthenis. Comparison of the S-, N- or P-Deprivations’ impacts on stomatal conductance, Transpiration and Photosynthetic Rate of Young Maize Leaves. Am. J. Plant Sci. 2012, 3, 1058–1065. [Google Scholar] [CrossRef]
- Adeyemi, T.A.; Adeoye, S.A.; Ogunyemi, T.J.; Adedeji, E.A.; Oluyemi, B.; Ojo, V.O.A. Comparisons of nutrient solutions from organic and chemical fertilizer sources on herbage yield and quality of hydroponically produced maize fodder. J. Plant Nutr. 2020, 3, 1258–1267. [Google Scholar] [CrossRef]
- Di, L.; Dong, J.; Gruda, N.S.; Li, X.; Duan, Z. Elevated root-zone temperature promotes the growth and alleviates the photosynthetic acclimation of cucumber plants exposed to elevated [CO2]. Environ. Exp. Bot. 2022, 194, 104694. [Google Scholar] [CrossRef]
- Richardson, A.E.; Barea, J.; Mcneill, A.M.; Claire, P.C. Acquisition of phosphorus and nitrogen in the rhizosphere and plant growth promotion by microorganisms. Plant Soil 2009, 321, 305–339. [Google Scholar] [CrossRef]
- Gong, X.; Li, L.; Qin, L.; Huang, Y.; Ye, Y.; Wang, M.; Wang, Y.; Xu, Y.; Luo, F.; Mei, H. Targeted metabolomics reveals impact of N application on accumulation of amino acids, Flavonoids and phytohormones in tea shoots under soil nutrition deficiency stress. Forests 2022, 10, 1629. [Google Scholar] [CrossRef]
- Cure, J.D.; Acock, B. Crop response to carbon dioxide doubling: A literature survey. Agric. For. Meteorol. 1986, 38, 127–145. [Google Scholar] [CrossRef]
- Oehlmann, N.N.; Rebelein, J.G. The Conversion of Carbon Monoxide and Carbon Dioxide by Nitrogenases. Chembiochem 2022, 20, e202100453. [Google Scholar] [CrossRef]
- Field, C.B.; Matson, P.A.; Mooncy, H.A. Responses of terrestrial ecosystems to a changing atmosphere. Annu. Rev. Ecol. Syst. 1992, 23, 201–235. [Google Scholar] [CrossRef]
- Zhang, J.; Li, Y.; Yu, Z.; Adams, J.; Tang, C.; Wang, G.; Liu, X.; Liu, J.; Franks, A.; Liu, J.; et al. Elevated atmospheric CO2 and warming enhance the acquisition of soil-derived nitrogen rather than urea fertilizer by rice cultivars. Agric. For. Meteorol. 2022, 324, 109117. [Google Scholar] [CrossRef]
- Dromantienė, R.; Pranckietienė, I.; Jodaugienė, D.; Paulauskienė, A. The Influence of various forms of nitrogen fertilization and meteorological factors on nitrogen compounds in soil under laboratory conditions. Agronomy 2020, 10, 2011. [Google Scholar] [CrossRef]
- Hormoz, B.; Stephen, A.P.; Rich, J.N. A field method of determining NH4+ and NO3−; uptake kinetics in intact roots: Effects of CO2: Enrichment on trees and crop specie. Plant Soil 1999, 217, 123–134. [Google Scholar]
- Gerendás, J.; Zhu, Z.; Bendixen, R.; Ratcliffe, R.G.; Sattelmacher, B. Physiological and biochemical processes related to ammonium toxicity in higher plants. Z. Für Pflanz. Und Bodenkd. 1997, 160, 239–251. [Google Scholar] [CrossRef]
- Wang, X.; Wei, X.; Wu, G.; Chen, S. Ammonium application mitigates the effects of elevated carbon dioxide on the carbon/nitrogen balance of Phoebe bournei seedlings. Tree Physiol. 2021, 41, 1658–1668. [Google Scholar] [CrossRef] [PubMed]
- Asensio, J.S.; Rachmilevitch, S.; Bloom, A.J. Responses of Arabidopsis and wheat to rising CO2 depend on nitrogen source and nighttime CO2 levels. Plant Physiol. 2015, 168, 156–163. [Google Scholar] [CrossRef] [PubMed]
- Ma, Q.; Wang, J.; Sun, Y.; Yang, X.; Ma, J.; Li, T.; Wu, L. Elevated CO2 levels enhance the uptake and metabolism of organic nitrogen. Physiol. Plant 2018, 162, 467–478. [Google Scholar] [CrossRef]
- Maniou, F.; Chorianopoulou, S.N.; Bouranis, D.L. New insights into trophic aerenchyma formation strategy in maize (Zea mays L.) organs during sulfate deprivation. Front. Plant Sci. 2014, 3, 5–581. [Google Scholar] [CrossRef] [PubMed]
- Siyiannis, V.F.; Protonotarios, V.E.; Zechmann, B.; Chorianopoulou, S.N.; Müller, M.; Hawkesford, M.J.; Bouranis, D.L. Comparative spatiotemporal analysis of root aerenchyma formation processes in maize due to sulphate, nitrate or phosphate deprivation. Protoplasma 2012, 249, 671–686. [Google Scholar] [CrossRef] [PubMed]
- Fan, J.; Halpern, M.; Yu, Y.; Zuo, Q.; Shi, J.; Fan, Y.; Wu, X.; Yermiyahu, U.; Sheng, J.; Jiang, P.; et al. The mechanisms responsible for N deficiency in well-watered wheat under elevated CO2. Front. Plant Sci. 2022, 13, 801443. [Google Scholar] [CrossRef]
- Wang, P.; Bi, S.; Wang, S.; Ding, Q. Variation of wheat root exudates under aluminum stress. J. Agric. Food Chem. 2006, 54, 10040–10046. [Google Scholar] [CrossRef]
- Shen, X.; Yuan, Y.; Zhang, H.; Guo, Y.; Zhao, Y.; Li, S.; Kong, F. The Hot QTL locations for Potassium, Calcium, and Magnesium Nutrition and agronomic traits at seedling and maturity stages of wheat under different potassium treatments. Genes 2019, 10, 607. [Google Scholar] [CrossRef]
- Wei, J.; Li, C.; Li, Y.; Jiang, G.; Cheng, G.; Zheng, Y. Effects of external potassium (k) supply on drought tolerances of two contrasting winter wheat cultivars. PLoS ONE 2013, 8, 69737. [Google Scholar] [CrossRef]
- Esteban, R.; Ariz, I.; Cruz, C.; Moran, F.J. Review: Mechanisms of ammonium toxicity and the quest for tolerance. Plant Sci. 2016, 248, 92–101. [Google Scholar] [CrossRef]
- Yang, L.I.; Li, Y.X.; Li, Y.X.; Tian, Z.W.; Hu, J.L.; Adkins, S.; Dai, T.B. Changes of oxidative metabolism in the roots of wheat(Triticum aestivum L.) seedlings in response to elevated ammonium concentrations. J. Integr. Agric. 2021, 20, 1216–1228. [Google Scholar]
- Ravazzolo, L.; Revisan, T.S.; Forestan, C.; Arotto, V.S.; Sut, S.; Dall’Acqua, S.; Malagoli, M.; Quaggiotti, S. Nitrate and ammonium affect the overall maize response to nitrogen availability by triggering specific and common transcriptional signatures in roots. Int. J. Mol. Sci. 2020, 21, 686. [Google Scholar] [CrossRef]
- Usyskin-Tonne, A.; Hadar, Y.; Yermiyahu, U.; Minz, D. Elevated CO2 and nitrate levels increase wheat root-associated bacterial abundance and impact rhizosphere microbial community composition and function. ISME J. 2021, 15, 1073–1084. [Google Scholar] [CrossRef]
- Lapie, C.; Sterckeman, T.; Paris, C.; Leglize, P. Impact of phenanthrene on primary metabolite profiling in root exudates and maize mucilage. Environ. Sci. Pollut. Res. Int. 2020, 27, 3124–3142. [Google Scholar] [CrossRef] [PubMed]
- Xu, Y.; Xiao, Z.; Zhang, X.; Zhao, C.; Li, Y.; Che, T.; Li, Y.; Zang, X.; Jiang, S.; Li, H.; et al. The nutrient preferences of rice and wheat influence fluoranthene uptake. Front. Environ. Sci. 2022, 10, 987743. [Google Scholar] [CrossRef]
- Ochieng’, I.O.; Gitari, H.I.; Mochoge, B.; Rezaei-Chiyaneh, E.; Gweyi-Onyango, J.P. Optimizing Maize Yield, Nitrogen efficacy and grain protein content under different N forms and rates. J. Soil Sci. Plant Nutr. 2021, 21, 1867–1880. [Google Scholar] [CrossRef]
- Kim, T.; Mills, H.A.; Wetzstein, H.Y. Studies on effects of nitrogen form on growth, development, and nutrient uptake in pecan. J. Plant Nutr. 2002, 25, 497–508. [Google Scholar] [CrossRef]
- Lyu, X.; Liu, Y.; Li, N.; Ku, L.; Hou, Y.; Wen, X. Foliar applications of various nitrogen (N) forms to winter wheat affect grain protein accumulation and quality via N metabolism and remobilization. Crop. J. 2022, 10, 1165–1177. [Google Scholar] [CrossRef]
- Miao, Y.F.; Li, S.X.; Xu, X.F.; Wang, Z.H.; Li, X.H.; Fu, Y.Y.; Luo, L.C. Ponses of winter wheat to ammonium and nitrate nitrogen. Acta Pedol. Sin. 2014, 51, 564–574, (In Chinese with English abstract). [Google Scholar]
- Li, S.X.; Wang, Z.H.; Hu, T.T.; Gao, Y.J.; Stewart, B.A. Nitrogen in dryland soils of China and its management. Adv. Agron. 2009, 101, 123–181. [Google Scholar] [CrossRef]
- Britto, D.T.; Kronzucker, H.J. NH4+ toxicity in higher plants: A critical review. J. Plant Physiol. 2002, 159, 567–584. [Google Scholar] [CrossRef]
- Pan, R.Z. Plant Physiology; Frontiers of Philosophy in China: Beijing, China, 2012. [Google Scholar]
- Henriksen, G.H.; Bloom, A.J.; Spanswick, R.M. Measurement of net fluxes of ammonium and nitrate at the surface of barley roots using ion-selective microelectrodes. Plant Physiol. 1990, 93, 271–280. [Google Scholar] [CrossRef] [PubMed]
- Tsay, Y.F.; Ho, C.H.; Chen, H.Y.; Lin, S.H. Integration of nitrogen and potassium signaling. Annu. Rev. Plant Biol. 2011, 62, 207–226. [Google Scholar] [CrossRef] [PubMed]
- Liu, N.; Han, T.; BassiriRad, H. Root proliferation into patches of different nitrogen forms: A 17-plant species study. J. Soil Sci. Plant Nutr. 2022, 22, 2835–2846. [Google Scholar] [CrossRef]
- Gazzarrini, S. Three functional transporters for constitutive, diurnally regulated, and starvation-induced uptake of ammonium into arabidopsis roots. Plant Cell Online 1999, 11, 937–948. [Google Scholar] [CrossRef]
- Li, S.; Yu, K.; Huo, Y.; Zhang, J.; Wu, H.; Cai, C.; Liu, Y.; Shi, D.; He, P. Effects of nitrogen and phosphorus enrichment on growth and photosynthetic assimilation of carbon in a green tide-forming species (Ulva prolifera) in the Yellow Sea. Hydrobiologia 2016, 776, 161–171. [Google Scholar] [CrossRef]
- Imran, M.; Hu, C.X.; Hussain, S.; Rana, M.S.; Riaz, M.; Afzal, J.; Aziz, O.; Elyamine, A.M.; Ismael, M.A.F.; Sun, X.C. Molybdenum-induced effects on photosynthetic efficacy of winter wheat (Triticum aestivum L.) under different nitrogen sources are associated with nitrogen assimilation. Plant Physiol. Biochem. 2019, 141, 154–163. [Google Scholar] [CrossRef]
- Zainul, A.; Werner, K.H.; Tabassum, H.; Aysha, R.; Alwahibi, M.S.; Elshikh, M.S.; Hussain, M.I.; Zulfiqar, F.; Mansoor, S.; Abbas, Z. Biomass production and predicted ethanol yield are linked with optimum photosynthesis in phragmites karka under salinity and drought conditions. Plants 2022, 11, 1657. [Google Scholar] [CrossRef]
- Hawkesford, M.; Horst, W.; Kichry, T.; Lambers, H.; Schjoerring, J.; Møller, I.S.; White, P. Functions of macronutrients Marschner P. In Marschner’s Mineral Nutrition of Higher Plants; Academic Press: Cambridge, MA, USA, 2011; pp. 135–151. [Google Scholar] [CrossRef]
- Li, Q.; Xu, X.; Gu, H.; Gao, H.; Zhu, Y.; Dong, C.; Shen, Q. Effects of applying different nitrogen form on cherry tomato nitrogen metabolism during fruit development. Chin. J. Appl. Ecol. 2010, 21, 2335–2341. [Google Scholar]
- Yang, Y. Effects of Nitrogen on growth, Quality and Key Enzymes of Nitrogen Metabolism in Rich and Noble Vegetables. Master’s Thesis, Hunan Agricultural University, Changsha, China, 2011. [Google Scholar]
- Su, W. Effect of Elevation CO2 on Nitrogen Uptake Characteristic and Growth of Larix gmelinii and Pinus sylvestris var. mongolic. Master’s Thesis, Northeast Forestry University, Harbin, China, 2018. [Google Scholar]
- Cohen, I.; Rapaport, T.; Berger, R.T.; Rachmilevitch, S. The effects of elevated CO2 and nitrogen nutrition on root dynamics. Plant Sci. 2018, 272, 294–300. [Google Scholar] [CrossRef]
- Tingey, D.T.; Mckane, R.B.; Olszyk, D.M.; Johnson, M.G.; Rygiewicz, P.T.; Henry, L.E. Elevated CO2 and temperature alter nitrogen allocation in douglas-fir. Glob. Change Biol. 2003, 9, 1038–1050. [Google Scholar] [CrossRef]
- Ma, H.; Zhu, J.; Xie, Z.; Ceng, X.; Liu, G. Effects of CO2 enrichment on the allocation of biomass and C, N uptake in rice organs. Chin. J. Eco-Agric. 2005, 3, 38–41, (In Chinese with English abstract). [Google Scholar]
- Hu, G. Effect of nitrogen forms and abiotic stress on tea plant physiological characteristics and nitrogen metabolism. Master’s Thesis, Anhui Agricultural University, Hefei, China, 2018. [Google Scholar]
- Del Amor, F.M.; Piñero, M.C.; Otálora-Alcón, G.; Perez-Jimenez, M.; Marin-Minano, M. Effect of different nitrogen forms and CO2 enrichment on the nutrient uptake and water relations of pepper plants (Capsicum annuun L.). Procedia Environ. Sci. 2015, 29, 203–204. [Google Scholar] [CrossRef]
- Subbarao, G.V.; Nakahara, K.; Ishikawa, T.; Ono, H.; Yoshida, M.; Yoshihashi, T.; Zhu, Y.; Zakir, H.A.K.M.; Deshpande, S.P.; Hash, C.T.; et al. Biological nitrification inhibition (BNI) activity in sorghum and its characterization. Plant Soil 2012, 366, 243–259. [Google Scholar] [CrossRef]


Disclaimer/Publisher’s Note: The statements, opinions and data contained in all publications are solely those of the individual author(s) and contributor(s) and not of MDPI and/or the editor(s). MDPI and/or the editor(s) disclaim responsibility for any injury to people or property resulting from any ideas, methods, instructions or products referred to in the content. |
© 2023 by the authors. Licensee MDPI, Basel, Switzerland. This article is an open access article distributed under the terms and conditions of the Creative Commons Attribution (CC BY) license (https://creativecommons.org/licenses/by/4.0/).