Article

Effects of Different Soil Water and Heat Regulation Patterns on the Physiological Growth and Water Use in an Apple–Soybean Intercropping System

1
School of Soil and Water Conservation, Beijing Forestry University, Beijing 100083, China
2
Forest Ecosystem Studies, National Observation and Research Station, Jixian 042200, China
*
Author to whom correspondence should be addressed.
Agronomy 2023, 13(2), 511; https://doi.org/10.3390/agronomy13020511
Submission received: 12 January 2023 / Revised: 30 January 2023 / Accepted: 2 February 2023 / Published: 10 February 2023

Abstract

:
In this study, a typical apple–soybean intercropping system was used to analyze the effects of different soil water and heat regulation modes on the spatial distribution of the soil water content (SWC), photosynthetic physiological characteristics, and growth. Three maximum irrigation levels [50% (W1), 65% (W2), and 80% (W3) of field capacity (FC)] and two mulching intervals [from seedling to podding stage (M1) and during the full stage (M2) of soybeans] were tested. The results showed that the SWC of W3M2 was the highest, while the W2M1 and W1M2 treatments used more deep soil water. Irrigation increased the chlorophyll content, net photosynthesis, and transpiration rate of leaves in the agroforestry system. In addition, the net photosynthetic rate of leaves under the W2 irrigation level increased after mulch removal in the later growth stage. At W1 and W2 irrigation levels, the soybean yield of half-stage mulching was 0.85–15.49% higher than that of full-stage mulching. Multiple regression analysis showed that grain yield under the W3M2 treatment reached the maximum value of the fitting equation. The photosynthetic rate, water use efficiency, and grain yield under W2M1 reached 71–86% of the maximum value of the fitting equation, with the largest soil plant analysis development value. To effectively alleviate water competition in the apple–soybean intercropping system, our results suggest adoption of the 80% FC upper irrigation limit (W3) combined with soybean M2 treatment in young apple trees–soybean intercropping system during water abundant years. In addition, adoption of the 65% FC upper irrigation limit (W2) combined with the soybean M1 treatment in water deficit years could effectively improve soil water, heat environment, and promote growth.

1. Introduction

The Loess Plateau is a highly fragile ecological area in China with a priority for soil and ecological restoration [1]. The typical agroforestry model in this region is crucial for the efficient utilization of land resources as well as prevention and control of soil erosion [2,3,4,5]. However, the region experiences highly varied annual precipitation patterns with uneven seasonal distribution. Precipitation is mainly concentrated from July to October, which accounts for 64.2% of the total annual precipitation. Irregular precipitation can lead to uneven distribution of soil water and heat and can also affect the transport and accumulation of soil nutrients, such as organic matter, nitrogen, phosphorus, and potassium in soil water [6]. Changes in soil nutrient accumulation can disrupt the absorption and utilization of water, fertilizer, and other resources among different crops in an intercropping system and directly affect their ecological process and productivity level [7,8,9,10]. To achieve a sustainable and efficient development of agroforestry system in this area, suitable soil water and heat regulation should be implemented during the critical period of crop growth.
Soil water and heat status can directly affect the water and nutrient absorption of crops [11], which is crucial for growth and development in the agroforestry system. In addition to natural factors, such as climate and soil [12], mulching method, irrigation technology, and management level can all affect the variation laws of soil water and heat [13]. Moderate water and heat conditions in soil environment can promote differences in the ecological niche of an intercropping system by providing nutrient resources to crops [14], leading to efficient utilization of resources between species [15]. It is beneficial to the growth and development of intercropping systems and can significantly improve the system output and economic benefits. Drip irrigation under mulch is an important water and heat control method in arid and semi-arid areas [16]. The method can not only provide adequate water irrigation based on the crop-water but also can effectively improve soil water and heat conditions in top soil, alleviate water competition among intercropping systems, increase grain yield, and improve water use efficiency [17]. However, the application of soil water and heat regulation technology based on drip irrigation under mulch is currently still mainly concentrated in monocropping system. Compared with a monocropping system, the complex underground root and canopy structure of an intercropping system makes it more competitive for resources, and its physiological characteristics as well as water use differs from those of monocropping system [18]. The intercropping system has irrigation volume threshold, and excessive or too low volume is unfavorable for interspecific complementarity, which can inhibit crop growth, development, and dry matter formation [19]. The soil temperature varies with different irrigation amounts, which can directly affect soil or water heat exchange. Rational soil water and heat status forms the basis for achieving efficient utilization of soil water and nutrients in an intercropping system. Thus, rational soil water and heat conditions can promote the growth and development of the intercropping system and increase yield as well as economic benefits. However, key technical parameters of soil water and heat regulation in an intercropping system still need further evaluation.
In this study, different mulching intervals and drip irrigation levels were set to explore the effects of different soil water and heat regulation modes on the spatial distribution of soil water, photosynthetic characteristics, and growth indexes of a typical agroforestry system. These results provide a theoretical basis and technical reference for ideal water and heat regulation mode of apple–soybean intercropping system in the Loess area.

2. Materials and Methods
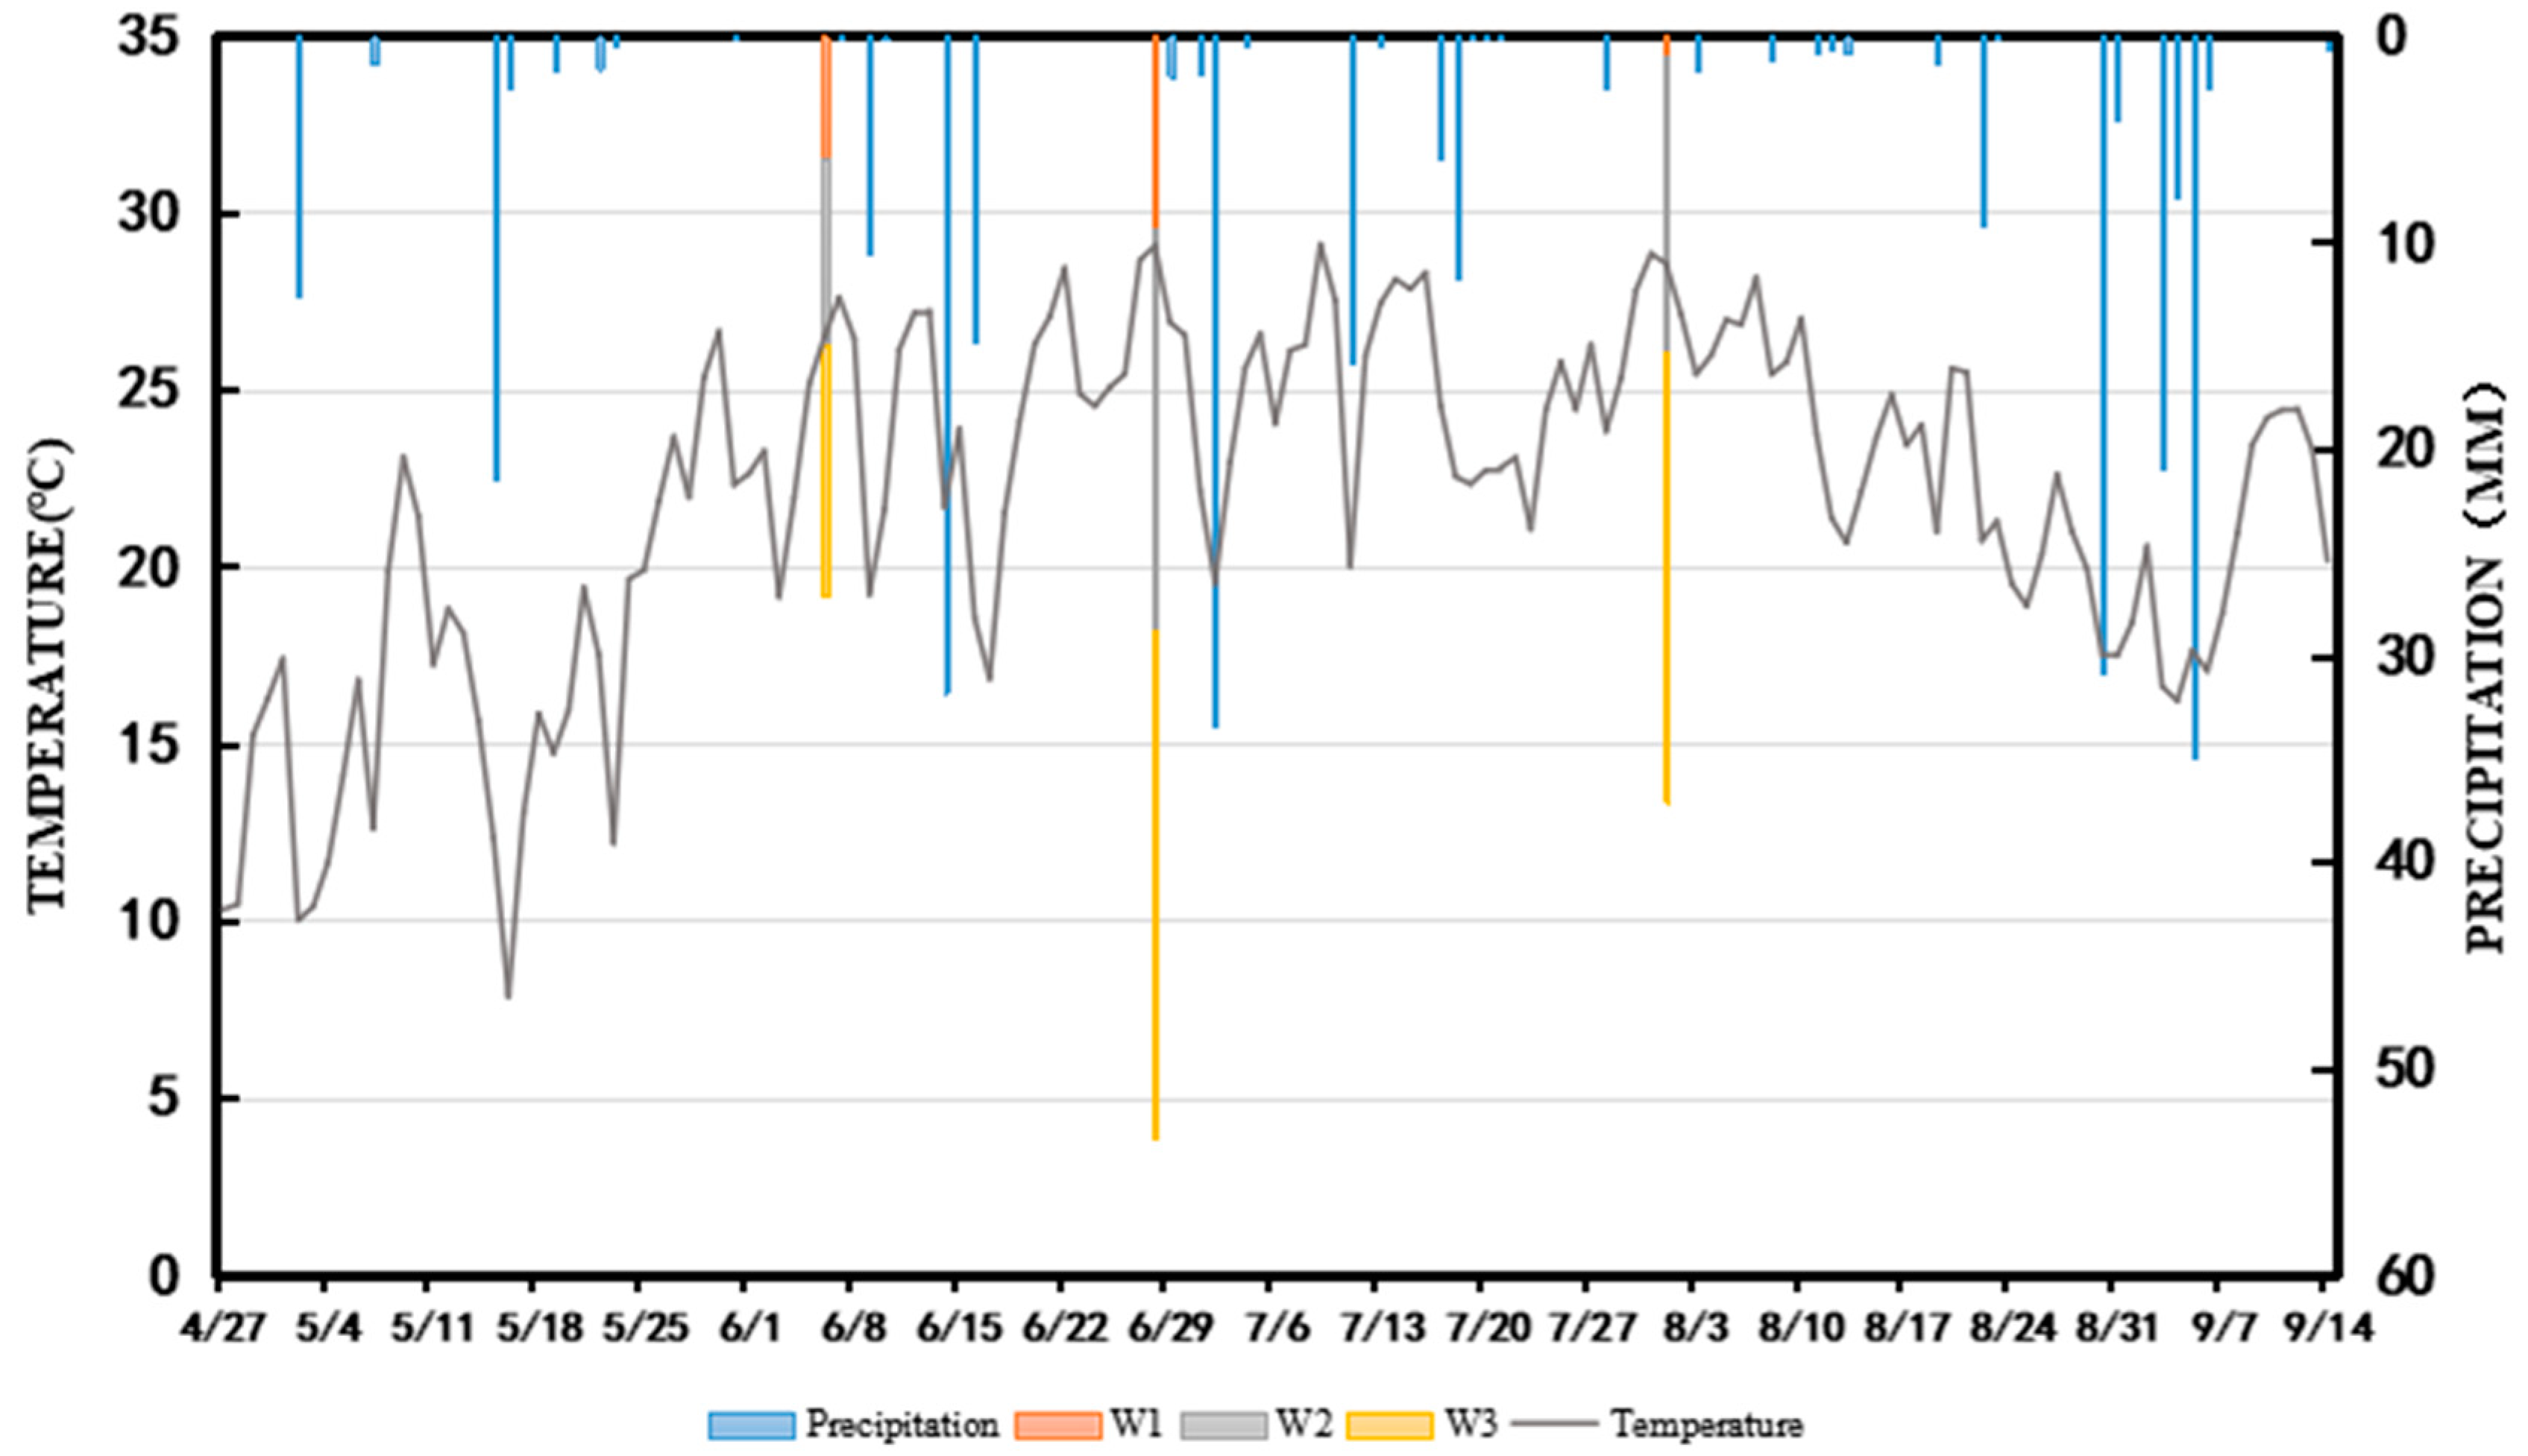
2.1. Study Area

The study site is located in the Forest Ecosystem Studies, National Observation and Research Station, Jixian, Shanxi, China (110°26′28″–111°07′21″ E, 35°53′13″–36°21′03″ N), which lies in in the Loess gully region with poor soil of below 1% organic matter. The area has a warm temperate continental climate, an annual average frost-free period of 175 days, average annual precipitation of 576 mm, average annual evaporation of 1724 mm, and an average temperature of 10 ℃. The average soil bulk density of the 0–60 cm layer is 1.26 g/cm3, while the average FC is 27.05%. The background soil nutrient values in the orchard for organic matter, ammonium nitrogen, nitrate nitrogen, available phosphorus, and available potassium are 9.44 g/kg, 0.72, 6.91, 4.63, and 77.76 mg/kg, respectively.
Temperature and rainfall initially increased then decreased during the growth period from soybean branching to filling stages (Figure 1). The average temperature was 22 ℃ during the soybean growth period, and the temperature was generally higher at the branching, podding, and filling stages. The total rainfall during the soybean growth period was 291.7 mm, with the highest precipitation accounting for 29.83% of total rainfall during the podding stage. The irrigation amount at the branching, podding, and filling stages were 27.10, 53.31, and 37.08 mm, respectively.

2.2. Experimental Material

The apple–soybean intercropping system in the Yonggu Village, Zhongduo Township, and Ji County was used in this study. The field contained the Yanfu No. 8 apple tree variety, which was planted in 2018 and has yet to reach the fruit set stage. The tree line is going north–south, with row spacing of 5 × 5 m, an average diameter of 2.3 cm at breast height, north–south crown width of 1.8 m, east–west crown width of 1.3 m, and crown height of 2.7 m. The soybean variety was Jindou 36, with a row spacing of 0.3 × 0.5 m. The rows between soybean and apple trees were 0.6 m apart, both in the north to south trend, and soybeans were sown on 27 April 2021. Each experimental plot contained one apple tree and eight rows of soybeans in a total land area of 23 m2 (Figure 2). Since apple plants were yet to reach the fruit set stage, the growth period of the intercropping system was based on the soybean growth period. The dates of branching stage, podding stage, and filling stage were 27 May 27 to 16 June, 17 June to 21 July, and 22 July to 20 August, respectively.

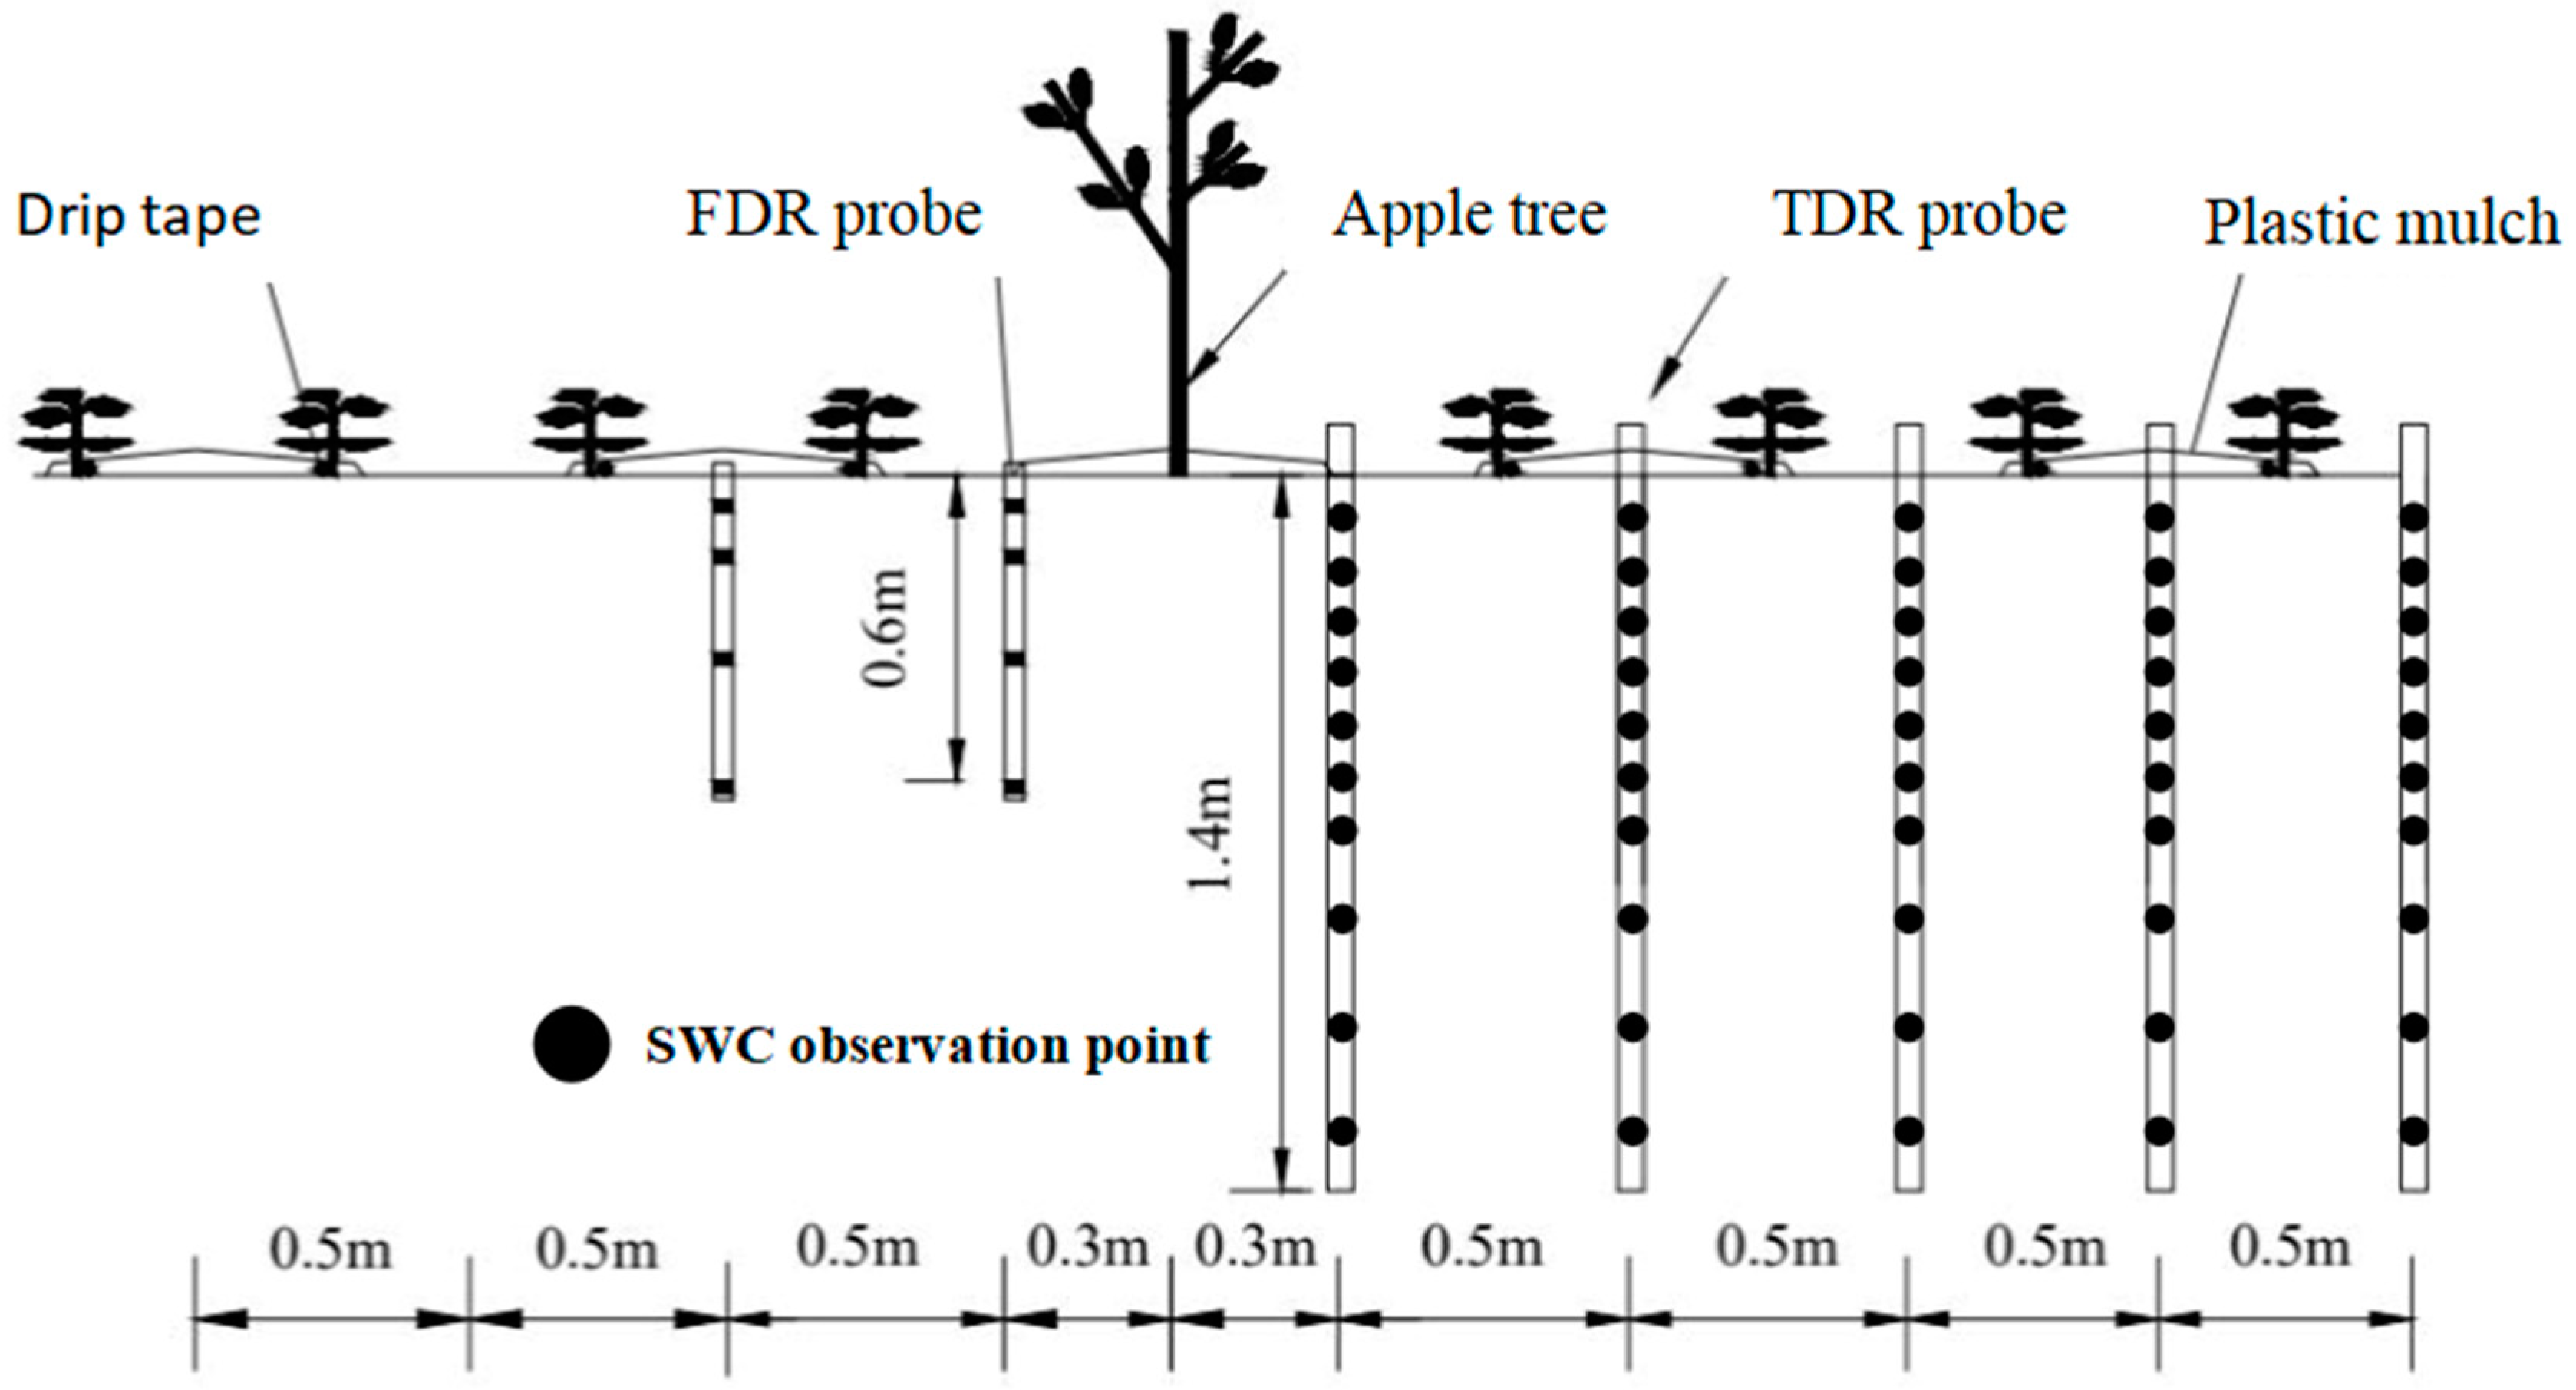
2.3. Experimental Design

The study was conducted from April to September 2021, and a two-factor experiment of irrigation and mulch stage was set. Three upper irrigation levels were set based on the range of soil suitable moisture for apple and soybean growth, including 50% (W1, low water), 65% (W2, medium water), and 80% (W3, high water) of the planned average mass water content in the moist soil layer for FC. The two mulching treatments for soybean included half-stage (mulching from the sowing to podding stage) (M1) and full stage (M2), with a polyethylene plastic white transparent film of 0.6 m width as the mulching material.
Experiments were designed with six treatments and three control groups, including CK0 (no irrigation and no plastic mulching), CK1 (no irrigation and plastic mulching from the seeding to podding stage), and CK2 (no irrigation and plastic mulch treatment during the final stage). Each treatment was in triplicates, with a total of 27 test plots. In the three key stages of soybean water demand (branching, podding, and filling stage), irrigation was performed during seven consecutive days without effective rainfall. The soil water content (SWC) of each treatment was measured before irrigation, and the irrigation quota was determined according to differences in the measured soil water content and the target water content. The drip irrigation was used, with one drip irrigation belt being laid in each soybean row. The drip irrigation belt was positioned at the root of soybeans at a 0.5 m spacing. In this experiment, irrigation quota of dryland crops was used to calculate irrigation amount with the following formula [20]:
M = 10γH(θwθ0)
where, M is the irrigation amount (mm); γ is the soil bulk density the moist layer of the soil program; H is the depth of soil planned moist layer (cm); θw is the target gravimetric water content of soil. θ0 is the soil mass water content the time of measurement. H values were 20, 40, and 60 cm at the branching, podding, and filling stages, respectively.
Prior to soybean sowing, compound fertilizer with the N-P-K ratio of 26:12:7 was evenly applied to the test plot, and the base fertilizer was applied at 817 kg/hm2. For the soybean at the podding stage, compound fertilizer (N-P-K ratio, 11:44:5) was applied once in eight treatments except for CK0. An overall top fertilizer amount of 490 kg/hm2 was applied into the soil with irrigation water.

2.4. Measurements

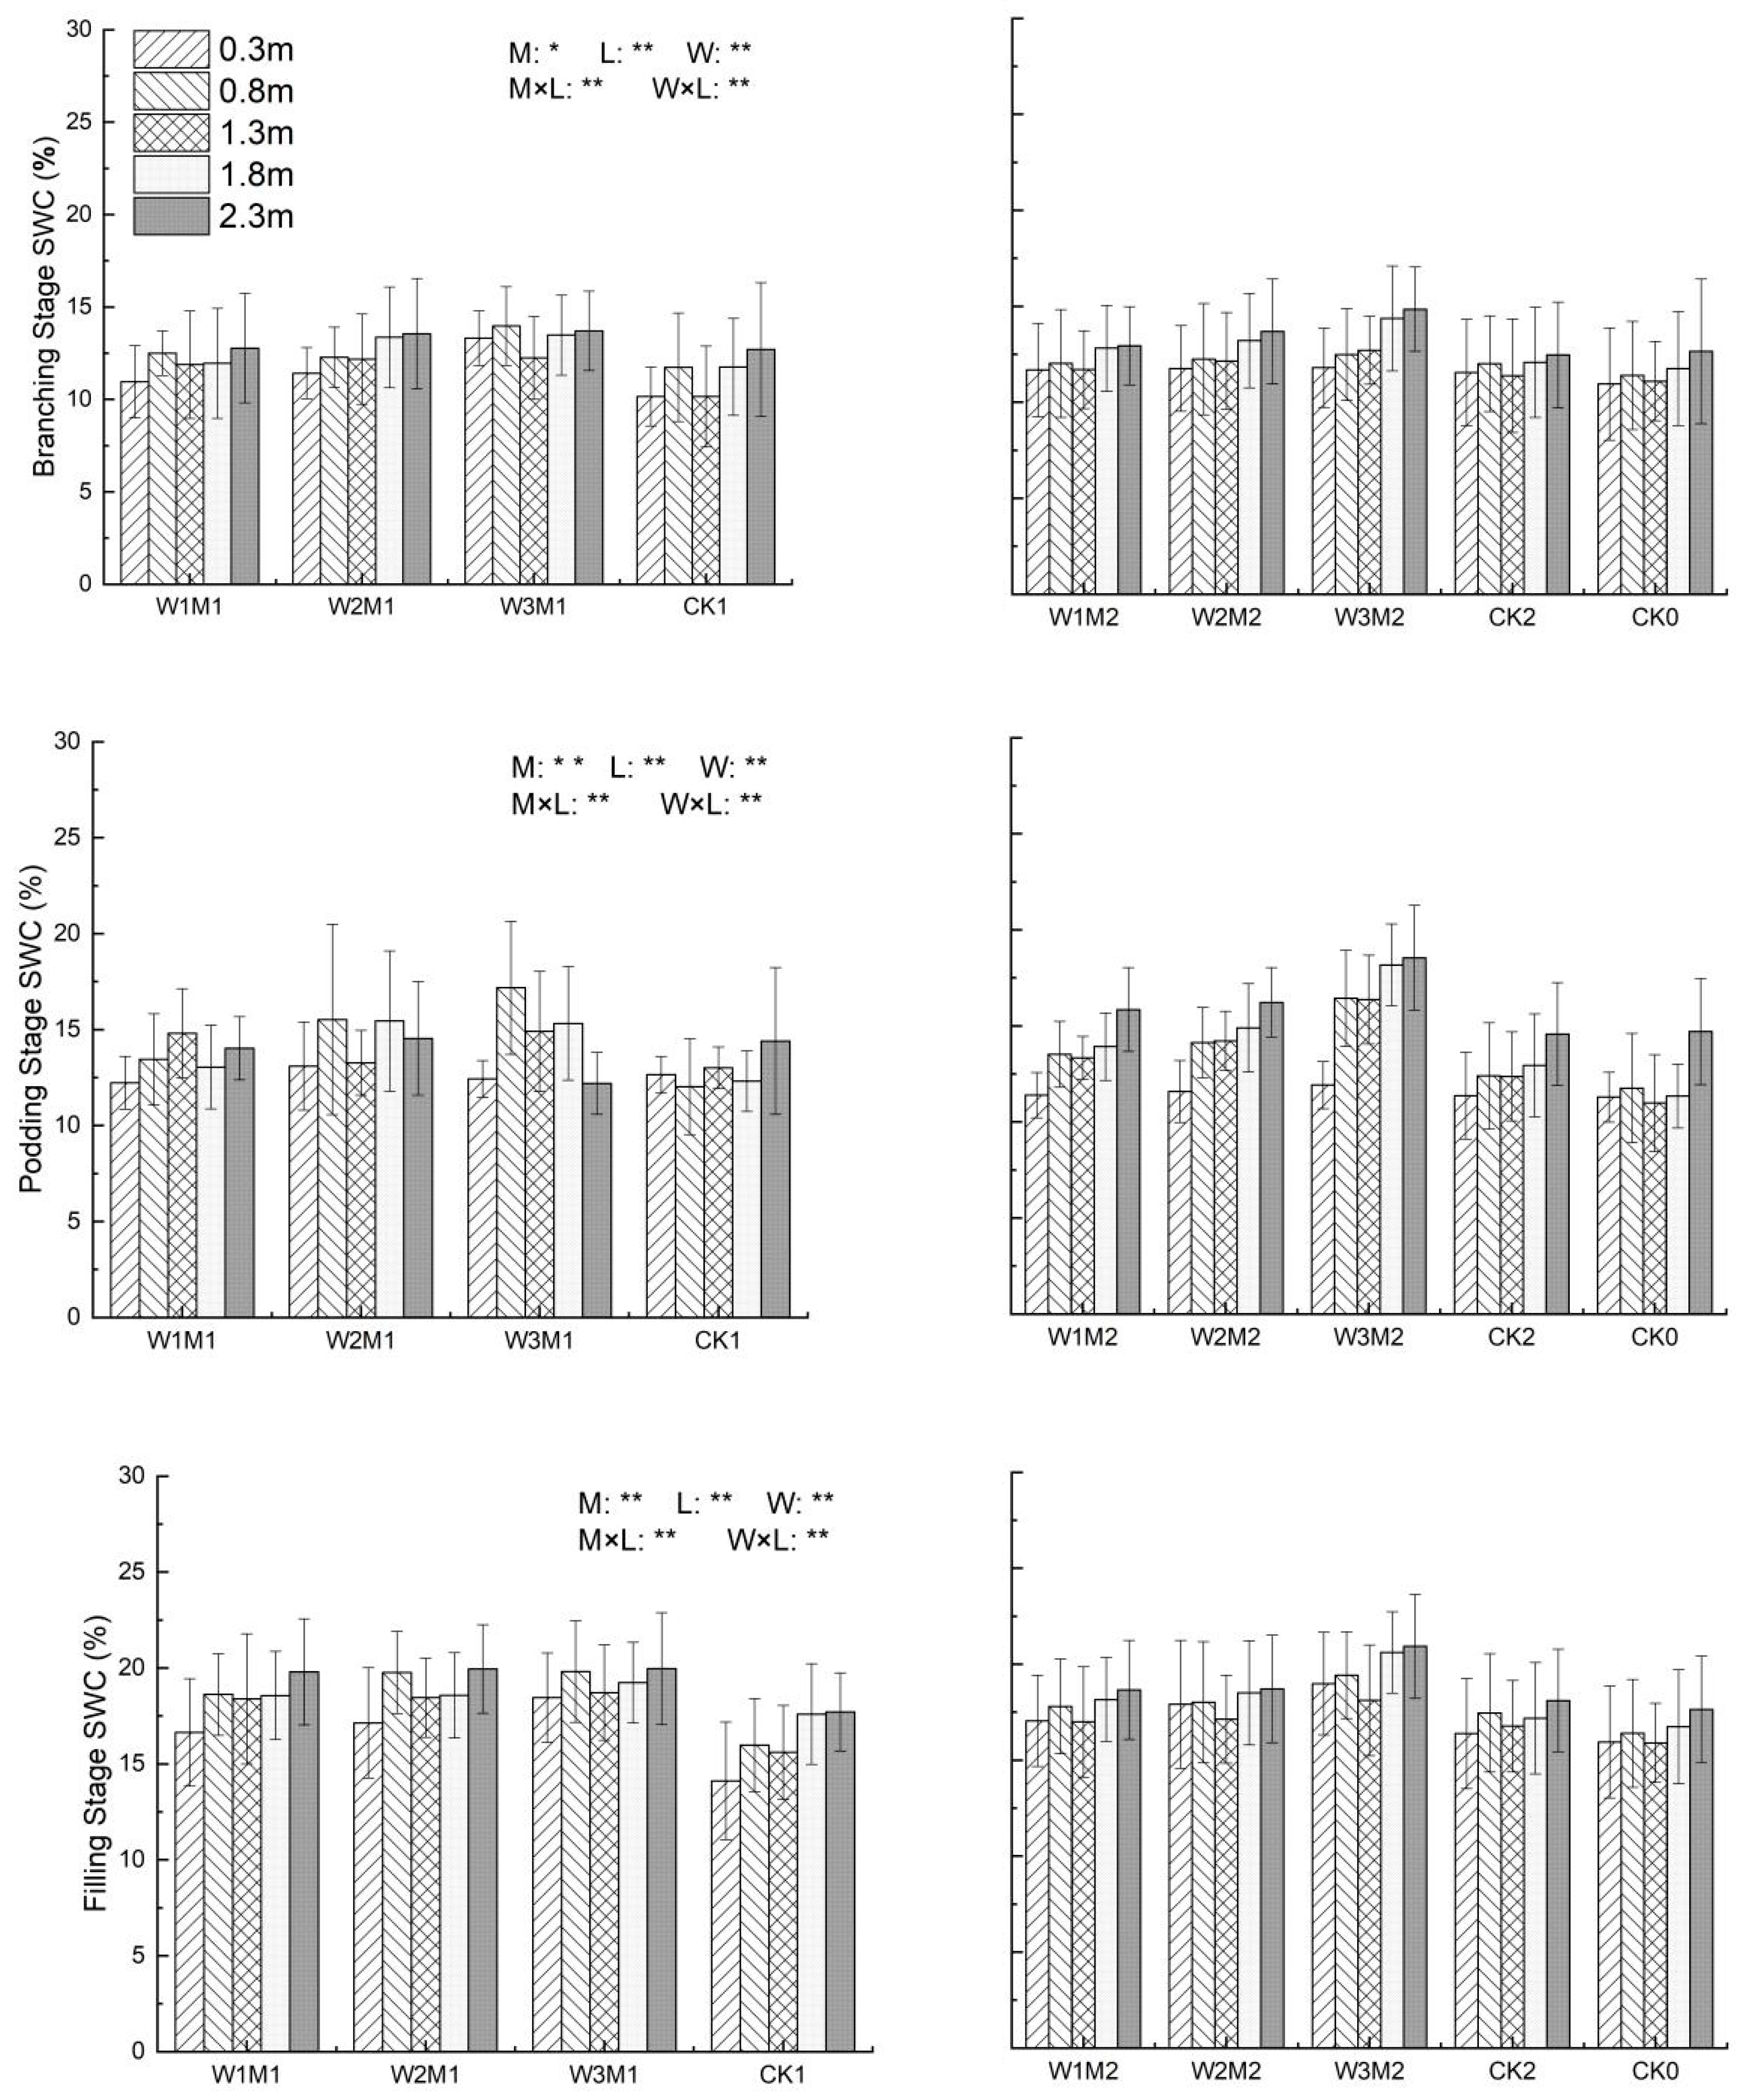
2.4.1. Soil Water Content Measurement

Time-domain reflectometry (TDR) probes (TRIME-PICO-IPH, IMKO, Ettlingen, Germany) were used to measure SWC after sowing at observation points set at 0.3, 0.8, 1.3, 1.8, and 2.3 m from the tree row (Figure 2) and soil depths of 0–10, 10–20, 20–30, 30–40, 40–50, 50–60, 60–70, 70–90, 90–110, and 110–130 cm. Calibration was carried out using the drying method.

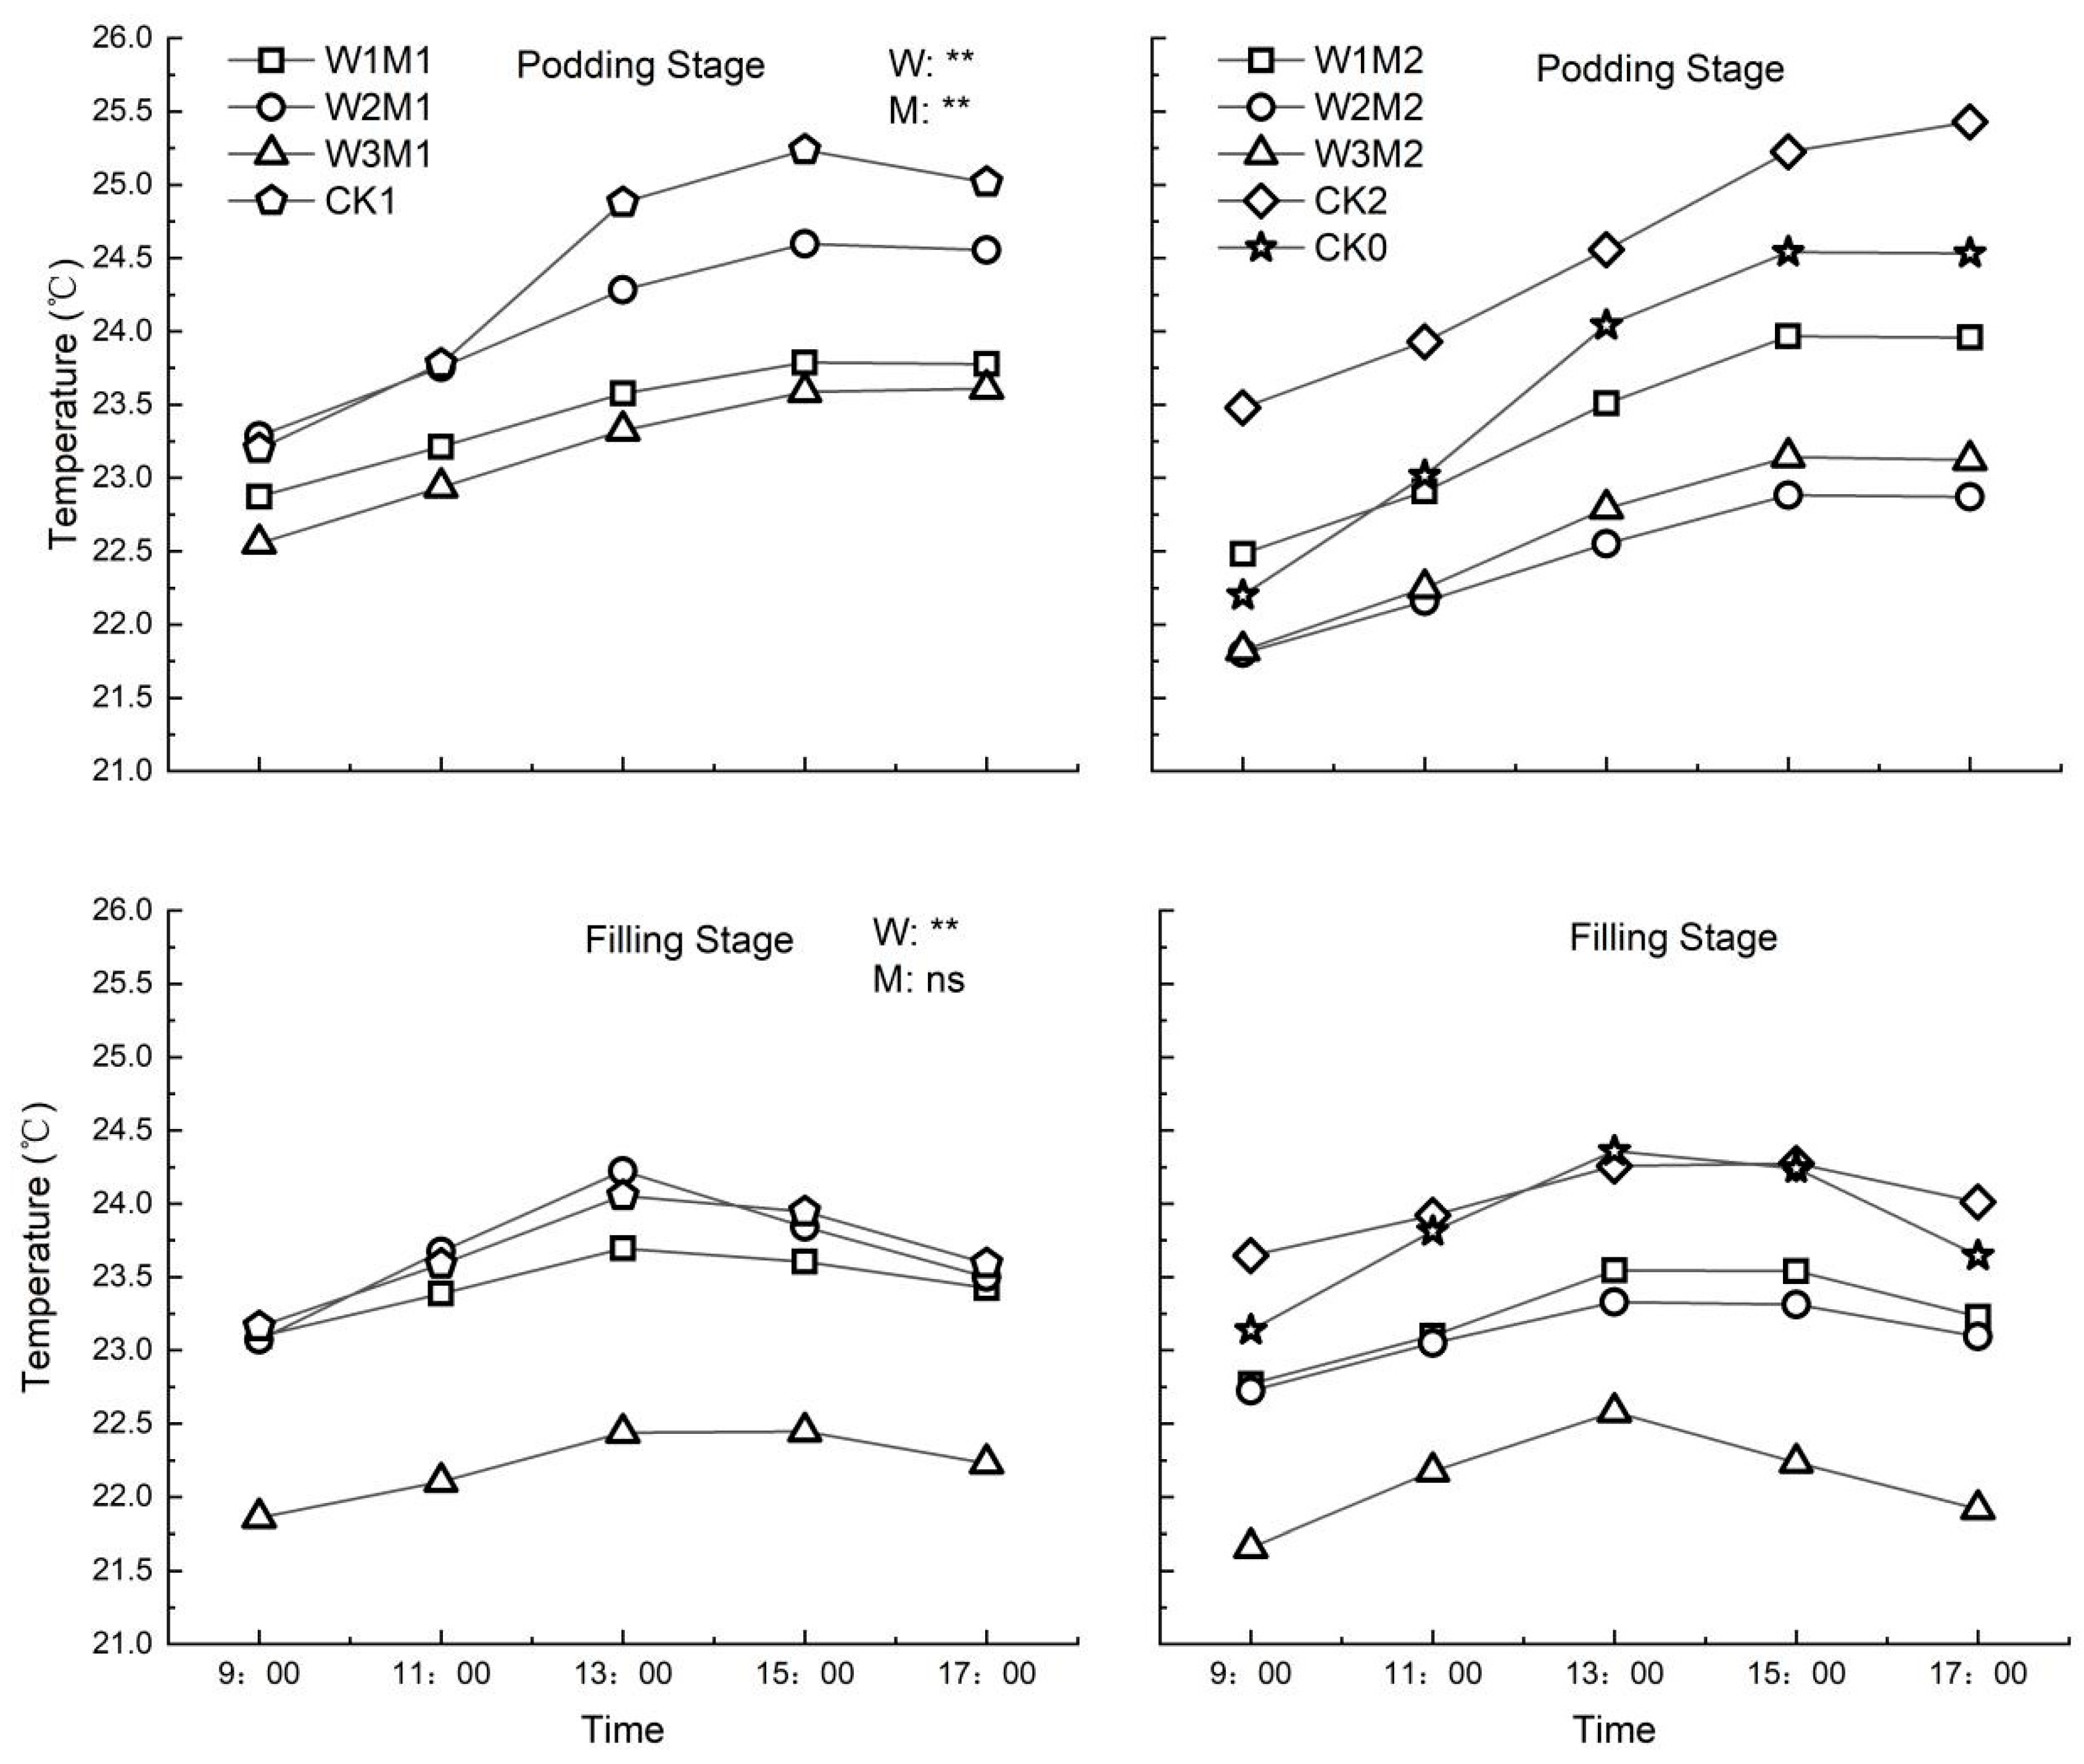
2.4.2. Determination of Soil Temperature

Soil temperature was collected using a soil temperature monitoring tube (KR-4W-N01-TYN, SDRMCT, Shandong, China) at a 30 min time interval. The soil temperature monitoring points were 0.3 m and 0.8 m away from tree rows at soil depths of 5, 15, 35, and 60 cm (Figure 3).

2.4.3. Determination of Plant Physiological Indexes

(1)
The relative chlorophyll contents of the apple and soybean leaves were recorded with a portable dual wavelength chlorophyll meter (SPAD 502, Minolta Camera Co., Ltd., Tokyo, Japan) during the branching, podding, and filling stages of soybeans. The apple tree with the most vigorous growth was selected in each plot, and the sampling points determined in the direction perpendicular to the tree rows. The sampling points were 0.55 m and 1.55 m away from the tree row, respectively. Three soybeans with vigorous growth were selected from each sampling point for labeling. During measurement, the vein was omitted, and the average value of multiple measurements was obtained.
(2)
Measurement of photosynthetic index of soybean in the seed filling stage was performed on a sunny cloudless weather using a portable Li-6400 photosynthesis instrument (Li-Cor company, USA). The most vigorous apple tree was selected in each plot, and the sampling point was determined in the direction perpendicular to the tree row. The sampling points were 0.55, 1.05, and 1.55 m away from the tree row, respectively. Three soybeans with vigorous growth were selected for listing and marking at each sampling point. Three complete and unshielded upper leaves were selected for each soybean. Analysis was conducted between 9 am to 5 pm, and each index was measured in three replicates then average value calculated. The net photosynthetic rate (Pn, μmol∙m−2∙s−1) and transpiration rate (Tr, mmol∙m−2∙s−1) were measured.

2.4.4. Determination of Crop Growth Index and Yield

The plant height (cm) was measured at the soybean branching, podding, and seed filling stages using a tape measure, while the leaf area index (LAI) was measured with a leaf area index instrument. Soybean grain yield was measured at the mature stage.

2.5. Data Processing and Statistical Analysis

2.5.1. Calculation of Water Consumption

The soybean water consumption at each growth stage was calculated following the principle of water balance using the formula below [21].
ET = I + P + URF ± ΔW
where, ET is the water consumption at the growth stage (mm); I represent the amount of irrigation at the growth stage (mm); P is the effective precipitation at the stage (mm); U is the amount of groundwater recharge (mm); R is surface runoff (mm); F is the deep seepage; and ΔW is the difference (mm) between the consumption of 0–120 cm of soil water storage at the beginning and the end of the growth stage. Since the terrain of the plot used in this test is flat, the surface runoff was considered to be zero. Groundwater recharge at the 30 m underground water depth is zero. Deep leakage is not considered in drip irrigation and is considered to be zero.

2.5.2. Water Use Efficiency

The WUE of intercropping system based on soybean yield was calculated using the following formula:
WUE = GY/ET
where, WUE is water use efficiency (kg/m3); GY is soybean grain yield (kg/hm2)
The irrigation water utilization efficiency was calculated with the formula below:
IWUE = GY/I
where, IWUE and I represent the utilization efficiency of irrigation water (kg/m3) and the amount of irrigation (mm), respectively.
The average values of triplicate measurement of the vertical and horizontal soil moisture content were calculated, then the effects of three factors affecting SWC, including plastic mulch treatment, distance from the tree, and distance between the drip irrigation belts, were analyzed by SPSS 20.0 ver. 20.0 (SPSS Inc., Chicago, IL, USA). The least significant difference was used to assess significance differences test at p = 0.05.

3. Results

3.1. Effects of Soil Water and Heat Regulation on the Diurnal Variation of Soil Temperature

The diurnal variation of soil temperature in the podding and filling stages showed an initially increasing followed by a decreasing trend (Figure 4). The highest temperature in the podding period occurred at 3 pm, while the highest temperature in the filling stage occurred at 1 pm. The temperature of the control group showed a rapid rate of increase with a large change range and was significantly higher than that of other treatments. Increased irrigation level in the M1 group caused the soil temperature to initially exhibit an increasing trend, which then decreased, suggesting that the highest soil temperature in a decreasing order was detected in W2 followed by W1, with the lowest in W3, while the temperature of W2M1 was ~0.32–7.97% higher than that of other treatments. In the M2 group, the soil temperature decreased with the increase in irrigation level at the filling stage, indicating that the soil temperature was highest in W1, followed by W2, and lowest in W3. The temperature of W1M2 was ~0.20–5.99% higher than that of other treatments, while the soil temperature at the podding stage was higher than that at the filling stage.

3.2. Spatial Distribution of Soil Water and Inter-Specific Water Competition

In the horizontal direction, the average SWC at the 0–130 cm soil layer initially increased then decreased with the increase in distance from the tree, with the minimum SWC value being observed at 0.3 m from the tree (Figure 5). The soil water content was highest at 2.3 m from the tree but decreased slightly at 1.3 m from the tree. Under the same mulching condition, the SWC increased gradually with the change of growth period, with the maximum value being detected in the filling stage. The SWC at 2.3 m from the tree was ~4.87–17.65% higher than that at other distances. Compared with other treatments, the SWC of W3 increased by 2.94–21.53%. In the vertical direction, SWC at 0–130 cm soil layer in different growth stages showed an initially increasing trend, which then decreased with the increase in soil depth and irrigation level (Figure 6).
The maximum water contents of W2M1 and W1M2 treatments were detected at 60 cm depth, with observed maximum SWC at 40 cm for other treatments, and the soil water content of 40 cm soil layer increased by 26.04~42% compared with that of 10 cm. The SWC in 0–60 cm soil layer changed sharply, with a range of 33.41–48.85%. The SWC in 60–130 cm soil layer gradually stabilized, with a range of 6.83–34.26%. In the 0–130 cm soil layer, SWC changes in the non-mulching state was more dramatic than that in the mulching state, with the most obvious change in the filling stage.
Table 1 shows the slope of SWC with the distance from the tree. The SWC in all growth stages was positively correlated with the distance from the tree, while it was significantly positively correlated with the slope of the distance from the tree at the podding stage. Mulch removal increased the slope of the SWC with the distance from the tree under W1 and W2 irrigation levels. In addition, mulch removal could reduce the slope of the SWC with the distance from the tree under W3 irrigation level. Except for CK0 treatment, the maximum slope of each growth period was W3M2.

3.3. Effects of Soil Water and Heat Regulation on the Growth Indexes of Intercropped Apple and Soybean

The SPAD value of apple leaves exhibited an initial decrease, which then increased with the growth period under different soil water and heat regulation methods, with the largest SPAD value being observed at the filling stage (Table 2). Similarly, the LAI of apple leaves initially increased and then decreased with growth period, with the podding stage having the largest LAI value. Under the half-term plastic mulching condition, the SPAD value of apple leaves increased with increased irrigation level, while the LAI value decreased first and then increased with increasing irrigation level. The LAI value of apple leaves under mulch removal was higher than that of plastic mulch treatment, indicating that mulch removal could increase the LAI value of apple leaves. The SPAD and LAI values of soybean leaves increased with the growth period. However, the increase was relatively slow in the early growth stages, and a higher growth rate was observed in the middle growth stage. Under the same plastic mulching condition at the branching and filling stages, higher irrigation levels resulted in higher SPAD, LAI, and plant height. The LAI of W3 group was 1.13–18.52% and 13.92–55% higher than that of W2 group and W1 group, respectively. The SPAD of each treatment was 2.24–15.36% higher than that of the control group. Under the same irrigation level, the SPAD and LAI values of soybean leaves treated with plastic mulching at the branching and podding stages were significantly higher than those without plastic mulching. The SPAD and LAI values of uncovering film at the filling stage were significantly higher than those of plastic mulch treatment. Notably, largest SPAD and LAI values were observed in the W2M1 treatment. Analysis of variance showed that irrigation levels at the branching and podding stages had significant effects on chlorophyll content, LAI, and SPAD (p < 0.05), whereas irrigation levels and plastic mulching at different stages had extremely significant effects on plant height (p < 0.01).

3.4. Physiological Characteristics of Photosynthesis and Inter-Specific Competition of Apple and Soybean in Intercropping System

The effects of different irrigation and mulching treatments on photosynthetic indexes of apple and soybean are shown in Table 3. The daily mean Pn value of apples in each treatment showed a decreasing trend with the increase in irrigation level, while it showed an increasing trend in the half period of plastic mulch treated soybeans. The Pn values of apple were higher than that of soybean under W1 irrigation level but were lower than that of soybean under W2 and W3 irrigation levels. Under W1 and W3 irrigation levels, the Pn value of soybean leaves after full-stage mulching M2 increased by 1.26% to 5.97% compared with M1 of half-stage mulching, while its values under W2 irrigation level increased with un-mulching. The daily mean Tr values of apple and soybean leaves in the full-stage mulching M2 was higher than that in the half-stage mulching M1. Similarly, the daily mean Tr values of apple and soybean leaves in the irrigation treatment was 34.17–158.64% and 19.9–84.51% higher than that of the control group, respectively. The daily mean value of leaf water use efficiency (WUEi) of apple and soybean decreased with the increase in irrigation level, and their values in the M2 were lower than that in the M1 treatment. Variance analysis showed that plastic mulch treatment time and irrigation level had extremely significant effects on Pn, Tr, and WUEi of apple and soybean. The interaction of the plastic mulching period with irrigation level had an extremely significant effect on Tr but had no significant effect on Pn and WUEi.
The correlation values between the photosynthetic index of soybean in each treatment and the distance from the tree are shown in Table 1. The change of slope in the table reflected the degree of inter-specific competition. The lowest slope of net photosynthetic and transpiration rates at the W2 irrigation level was observed when the half-stage was covered with M1. The slope of net photosynthetic rate first increased and then decreased with the increase in irrigation level when the full stage was covered with M2. The slope of net photosynthetic rate first decreased and then increased with the increase in irrigation level. The lowest slope of net photosynthetic rate was observed in the W3 irrigation level. At the W2 irrigation level, the slope of net photosynthetic rate decreased, while the slope of transpiration rate increased. Plastic mulch treatment reduced the slope of net photosynthetic rate at the W1 and W3 irrigation levels.

3.5. Effects of Soil Water and Heat Regulation on Soybean Yield and Soil Water Use Characteristics

Plastic mulch treatment effectively improved soybean yield and water use efficiency, with CK0 treatment recording the lowest yield (Table 4). Under the same mulch condition, higher irrigation level was accompanied with higher soybean yield. At the W1 and W2 irrigation levels, soybean yield of half-stage mulching was 0.85–15.49% higher than that of full-stage mulching. The soybean yield of full-stage mulching was 25.15% higher than that of half-stage mulching at the W3 irrigation level. Under M1 treatment, the water consumption from sowing to seed filling stage increased with the increase in irrigation level. In M2 treatment, water consumption initially increased and then decreased with the increase in irrigation amount, with no significant difference between W2 and W3 (p > 0.05). Except for the W2 irrigation level, water consumption in the M1 treatment was higher than that of M2 treatment under different irrigation amounts, and it exhibited an average of 1.53% increase compared with the M2 group. The crop water consumption of each irrigation treatment was significantly higher than those of the three control treatments. The highest and lowest water consumption values were observed in the W3M1 and CK0 treatments, respectively, with the consumption in each treatment being ~1.02–79.11% higher than that of CK0. Under the W1 and W2 irrigation levels, the WUE after mulch removal was significantly higher than that of the plastic mulch treatment. Under the M1 plastic mulch condition, WUE and IWUE decreased with the increase in irrigation level. The highest WUE of about 3.43–43.27% was observed in the W1M1 treatment. Under the M2 plastic mulch condition, WUE and IWUE initially decreased then increased with the increase in irrigation level. The CK0 treatment exhibited the lowest WUE. Analysis of variance showed that irrigation level had a significant effect on soybean grain yield, water consumption, WUE, and irrigation water use efficiency (p < 0.01). Mulch removal time had a significant effect on soybean grain yield (p < 0.05), water consumption, and WUE (p < 0.01) but had no significant effect on irrigation water use efficiency.
The nonlinear multiple regression results between irrigation level, temperature, and physiological parameters are shown in Figure 7. In this study, factors were normalized, and the quantitative relationship between irrigation, temperature, soybean WUE, Pn, and GY were obtained. Results showed that WUE, Pn, and GY did not reach the maximum value of the fitting in the same treatment. However, under the same irrigation and temperature levels, WUE of W1M1 treatment, GY, and Pn of W3M2 treatment could reach the maximum value of the fitting equation. In addition, irrigation, temperature, soil water, and heat coupling had significant effects on soybean WUE and GY (p < 0.05).

4. Discussion

4.1. Effects of Different Irrigation and Plastic Mulch Treatments on Spatial Distribution of Soil Water

Under different soil water and heat regulation methods, the SWC showed obvious spatial distribution differences, while its values under full-stage plastic film mulching were significantly higher than those under half-stage plastic film mulching. The significantly higher SWC observed at the filling stage than that at podding and branching stages was likely due to short plant height and small ground coverage during the early growth stage, which increased the invalid evaporation water consumption at the vegetative growth stage. In the later stage, the plants are larger; due to the sealing, the ground cover is better, and the soil water consumption is mainly leaf transpiration [22]. The SWC throughout the plastic film mulching was significantly higher than that in the half period of plastic film mulching due to the stronger capacity of crops to preserve water and moisture during plastic film mulching. In addition, the diurnal variation in soil temperature was smaller under prolonged plastic film mulching [23]. In the horizontal direction, the SWC of the intercropping system first increased then decreased with the increase in the distance between tree rows. The SWC decreased at 1.3 m from the tree, which could be due to absence of shade from the apple canopy at this distance, leading to increased evaporation of surface soil water [24]. In the vertical direction, the SWC of the intercropping soybean in each growth period initially increased before decreasing with the depth of soil layer. The soil water content of W2M1 and W1M2 treatment of 50–60 cm is greater than that of other treatments, possibly because the competition for water in the intercropping system becomes more and more strong with the soil water deficit, and the deep soil water under the membrane is rising [25], due to the capillary function, which increases the utilization of water in the deep soil by crops to maintain their normal growth and development of [26]. Generally, W2M1 treatment was more suitable for water absorption and utilization in the intercropping plants. Film removal at the filling stage could increase the daily average temperature of 0–60 cm soil layer and alleviate the competition for water and heat resources during the growth of intercropped plants [27]. Under W1 and W2 irrigation levels, plastic mulch removal could increase the slope of the SWC with the distance from the tree, while the slope decreased under W3 irrigation level. This suggests that mulch removal could not only increase the difference in water absorption rate between apple trees and other crops under W1 and W2 irrigation levels but could also reduce the difference of water absorption rate between intercropped plants under the W3 irrigation level, which could be due to increased root water absorption rate and root water absorption of apple and soybean as irrigation level increase. High water irrigation can enhance the soil water status, and root water absorption can ensure that the plant meets its demand for rapid water supply thereby reducing inter-species water competition.

4.2. Physiological Growth Characteristics of Apple and Soybean in the Intercropping System

In this study, irrigation was shown to increase the chlorophyll, net photosynthetic efficiency, and transpiration rate of leaves in the agroforestry system. Mulch removal reduced the transpiration rate of apple and soybean leaves, increased the net photosynthetic rate of soybean under W2 irrigation level, and alleviated photosynthetic competition. The Pn of apple was greater than that of soybean under W1 irrigation level. In contrast, the Pn of apple was smaller than that of soybean under the W2 and W3 irrigation levels, which might be attributed to stronger improvement in the photosynthetic performance of soybean leaves by increased irrigation level in the agroforestry system than that of young apples. Higher photosynthetic parameters of soybean were observed under the W2 and W3 irrigation levels. Under the W2 irrigation level, mulch removal increased the Pn of soybean leaves, which could be because the plastic mulch hindered precipitation from entering the soil, and its removal increased the soil water content. In addition, the SPAD value, LAI, and plant height under the W3 irrigation level were high, and plants showed an obvious shading effect, which caused relatively low leaf surface temperature and reduced the net photosynthetic efficiency [28]. Transpiration rate of apple and soybean leaves under full-stage mulching was higher than that under half-stage mulching, suggesting that mulching can increase leaf water content, stomatal conductance, and leaf transpiration rate but decrease the leaf WUEi [29,30,31,32]. Mulching can effectively improve the chlorophyll content of plant leaves at branching and podding stages. For example, plastic mulching increased the soil temperature and water content in the early stage of soybean growth, which promoted the diffusion of phosphorus and other nutrients in the soil and increased the soybean soil-nutrients uptake [33]. The LAI and chlorophyll contents of apple and soybean leaves in the M1 treatment were higher than those in the M2 mulching treatments at the filling stage, which might be due to the fact that plastic mulching at the late growth stage of soybeans consumes more nitrogen, accelerates root senescence and soil organic matter mineralization, and enhances nutrient loss [34]. In this study, the LAI and SPAD of soybean leaves under the W2M1 were higher than those of other treatments, while at the W2 irrigation level, plastic mulch removal reduced the slope of net photosynthetic rate and distance from the tree. This suggested that mulch removal could reduce the difference in the photosynthetic performance between apple and soybean leaves, with lower inter-specific competition compared to other treatments.

4.3. Effects of Soil Water and Heat Regulation on Yield and Soil Water Use Characteristics of the Intercropping System

An increase in soybean yield with increased irrigation amount was observed, with the yield of the W1 and W2 irrigation levels under the half-mulch stage being higher than that of the full-mulch stage, which might be due to the fact that the warming and moisture conservation effects from plastic film mulching are beneficial to the early plant growth and water use [35]. In the late growth stage, the warming effect from plastic film mulching inhibits plant root development [34] and decreases both evapotranspiration and water use efficiency of crops, which affect yield. However, plastic film mulching in the late growth stage under the W3 irrigation level could increase soybean yield, as irrigation reduced the soil temperature and reduced the effect of high temperature on the premature roots and leaves senescence [36]. Under the W1 and W2 irrigation levels, WUE of M1 treatment was significantly higher than that of M2 treatment. This could be attributed to the observed significantly higher yield in the M1 treatment than that of M2 treatment due to low water consumption in M1, as well as increased soil temperature due to mulching, which promoted plant transpiration, water consumption, and lateral soil moisture movement, resulting in more water consumption and lower water use efficiency of M2 treatment [37]. The WUE in the full-stage mulching was higher than that of the half-stage mulching under the W3 irrigation level, which could be attributed to the significantly higher yield of the full-stage mulching than that of the half-stage mulching. In addition, at later crop growth stage, the surface soil of the mulching treatment lost the film barrier causing the soil water evaporation to be higher than that of the full-stage mulching treatment. Multiple regression analysis showed that GY of the W3M2 treatment could reach the maximum value of the fitting equation, and soybean yield increased with the increase in irrigation amount, which was consistent with the results of a previous study [18] evaluating the effects of integrated water and fertilizer application on the physiological characteristics of an intercropping system. In this study, the Pn, WUE, and GY of W2M1 treatment reached 71–86% of the maximum value of the fitting equation, while SPAD had the largest value, indicating that the water and heat regulation conditions in W2M1 were more conducive for improving the economic benefits of the intercropping system during insufficient soil moisture or poor water periods. In summary, in order to effectively alleviate the water competition in the apple–soybean intercropping system in the Loess area of western Shanxi, to optimize the soil water and heat conditions of the intercropping system, and to improve the system output as well as its economic benefits, adopting a water and heat regulation condition of 80% FC upper limit irrigation level (W3) combined with soybean full-stage mulching (M2) during crop year with sufficient soil moisture or water is recommended. Similarly, a water and heat regulation mode of 65% FC upper limit irrigation level (W2) combined with soybean half-stage mulching (M1) in the year of insufficient soil moisture or poor water is also recommended.

5. Conclusions

This study demonstrated that plastic mulch treatment during the half growth period with medium water supply or plastic mulch treatment during the full-stage period with low water supply could use more deep soil water. Irrigation increased the net photosynthetic efficiency and transpiration rate of leaf chlorophyll of crops in the agroforestry system. Mulching effectively increased the leaf chlorophyll content at the soybean branching and podding stages. Mulch removal at seed filling stage (M1) increased the SPAD and LAI of apple and soybean but decreased the Tr and increased the WUE of soybean leaves. At the W1 and W2 irrigation levels, the soybean yield in the half-stage mulching was higher than that of full-stage mulching. Multiple regression analysis showed that GY treated with W3M2 could reach the maximum value of the fitting equation; Pn, WUE, and GY of W2M1 treatment could reach 71–86% of the maximum of the fitting equation. Therefore, to effectively alleviate water competition in an apple–soybean intercropping system, it is recommended that the soil water and heat regulation mode of 80% FC upper limit irrigation level (W3) combined with soybean full-stage mulching (M2) should be adopted in the system of young apple trees intercropped with soybeans in a water abundant year. Similarly, soil water and a heat regulation mode of 65% FC upper limit irrigation level (W2) combined with soybean half-stage mulching (M1) should be adopted in a water deficient year.

Author Contributions

Conceptualization, L.W. and R.W.; methodology, C.L.; software, C.X.; validation, R.W.; formal analysis, C.L.; investigation, H.D., X.W., M.Z. and W.X.; resources, X.W.; data curation, L.W.; writing—original draft preparation, L.W.; writing—review and editing, L.W. and R.W.; visualization, L.W.; supervision, R.W. and C.L.; project administration, R.W.; funding acquisition, National Key Research and Development Program of China and National Natural Science Fund. All authors have read and agreed to the published version of the manuscript.

Funding

This research was funded by National Key Research and Development Program of China (2022YFE0115300) and National Natural Science Fund (32271960).

Data Availability Statement

The data presented in this study are available on request from the corresponding author. The data are not publicly available due to ethical restrictions.

Acknowledgments

We are grateful for the support from the Forest Ecosystem Studies, National Observation and Research Station, Jixian, Shanxi, China.

Conflicts of Interest

The authors declare no conflict of interest.

References

  1. Zhu, X. Maintaining Soil Reservoirs to Ensure Beautiful Mountains in Loess Plateau. Soil Water Conserv. China 2006, 1, 6–7. [Google Scholar]
  2. Bado, B.V.; Whitbread, A.; Manzo, M.L.S. Improving agricultural productivity using agroforestry systems: Performance of millet, cowpea, and ziziphus-based cropping systems in West Africa Sahel Agriculture. Ecosyst. Environ. 2021, 305, 107175. [Google Scholar] [CrossRef]
  3. Ehret, M.; Graß, R.; Wachendorf, M. The effect of shade and shade material on white clover/perennial ryegrass mixtures for temperate agroforestry systems Agroforestry Systems. Agrofor. Syst. 2015, 89, 557–570. [Google Scholar] [CrossRef]
  4. Pavlidis, G.; Tsihrintzis, V.A. Environmental Benefits and Control of Pollution to Surface Water and Groundwater by Agroforestry Systems: A Review Water Resources Management. Water Resour. Manag. 2018, 32, 1–29. [Google Scholar] [CrossRef]
  5. Lorenz, K.; Lal, R. Soil organic carbon sequestration in agroforestry systems. A review. Agron. Sustain. Dev. 2014, 34, 443–454. [Google Scholar] [CrossRef]
  6. Yang, L.; Wei, W.; Chen, L.; Mo, B. Response of deep soil moisture to land use and afforestation in the semi-arid Loess Plateau, China. J. Hydrol. 2012, 475, 111–122. [Google Scholar] [CrossRef]
  7. Gao, L.; Xu, H.; Bi, H.; Xi, W.; Bao, B.; Wang, X.; Bi, C.; Chang, Y. Intercropping competition between apple trees and crops in agroforestry systems on the Loess Plateau of China. PLoS ONE 2017, 8, e70739. [Google Scholar] [CrossRef]
  8. Peng, X.; Zhang, Y.; Cai, J.; Jiang, Z.; Zhang, S. Photosynthesis, growth and yield of soybean and maize in a tree-based agroforestry intercropping system on the Loess Plateau. Agrofor. Syst. 2009, 76, 569–577. [Google Scholar] [CrossRef]
  9. Sun, Y.; Bi, H.; Xu, H.; Duan, H.; Peng, R.; Wang, J. Below-Ground Interspecific Competition of Apple (Malus pumila M.)–Soybean (Glycine max L. Merr.) Intercropping Systems Based on Niche Overlap on the Loess Plateau of China. Sustainability 2018, 10, 3022. [Google Scholar] [CrossRef]
  10. Yun, L.; Bi, H.; Gao, L.; Zhu, Q.; Ma, W.; Cui, Z.; Wilcox, B.P. Soil Moisture and Soil Nutrient Content in Walnut-Crop Intercropping Systems in the Loess Plateau of China. Arid. Land Res. Manag. 2012, 26, 285–296. [Google Scholar] [CrossRef]
  11. Yinglong, Q.; Haibin, S.; Ruiping, L.; Ju, Z.; Bin, L.; Min, L. Effects of film mulching on maize growth and soil water, fertilizer and heat under fertigation of drip irrigation. Trans. Chin. Soc. Agric. Eng. 2019, 35, 99–110. [Google Scholar]
  12. Pozníková, G.; Fischer, M.; Kesteren, B.; Orság, M.; Hlavinka, P.; Žalud, Z.; Trnka, M. Quantifying turbulent energy fluxes and evapotranspiration in agricultural field conditions: A comparison of micrometeorological methods. Agric. Water Manag. 2018, 209, 249–263. [Google Scholar] [CrossRef]
  13. Dutta, B.; Grant, B.; Congreves, K.; Smith, W.; Wagner-Riddle, C.; VanderZaag, A.; Tenuta, M.; Desjardins, R. Characterising effects of management practices, snow cover, and soil texture on soil temperature: Model development in DNDC. Biosyst. Eng. 2018, 168, 54–72. [Google Scholar] [CrossRef]
  14. Firbank, L.; Watkinson, A. On the Effects of Competition: From Monocultures to Mixtures. Perspect. Plant Compet. 1990, 165–192. [Google Scholar] [CrossRef]
  15. Yang, F.; Liao, D.; Fan, Y.; Gao, R.; Wu, X.; Rahman, T.; Yong, T.; Liu, W.; Liu, J.; Du, J.; et al. Effect of narrow-row planting patterns on crop competitive and economic advantage in maize–soybean relay strip intercropping system. Plant Prod. Sci. 2017, 20, 1–11. [Google Scholar] [CrossRef]
  16. Bu, L.-d.; Liu, J.-l.; Zhu, L.; Luo, S.-s.; Chen, X.-p.; Li, S.-q.; Hill, R.; Zhao, Y. The effects of mulching on maize growth, yield and water use in a semi-arid region. Agric. Water Manag. 2013, 123, 71–78. [Google Scholar] [CrossRef]
  17. DeBruyne, S.; Feldhake, C.; Burger, J.; Fike, J. Tree effects on forage growth and soil water in an Appalachian silvopasture. Agrofor. Syst. 2011, 83, 189–200. [Google Scholar] [CrossRef]
  18. Zhou, X.; Wang, R.; Gao, F.; Xiao, H.; Xu, H.; Wang, D. Apple and maize physiological characteristics and water-use efficiency in an alley cropping system under water and fertilizer coupling in Loess Plateau, China. Agric. Water Manag. 2019, 221, 1–12. [Google Scholar] [CrossRef]
  19. Jannoura, R.; Joergensen, R.; Bruns, C. Organic fertilizer effects on growth, crop yield, and soil microbial biomass indices in sole and intercropped peas and oats under organic farming conditions. Eur. J. Agron. 2014, 52, 259–270. [Google Scholar] [CrossRef]
  20. Man, J.; Yu, J.; White, P.; Gu, S.; Zhang, Y.; Guo, Q.; Shi, Y.; Wang, D. Effects of supplemental irrigation with micro-sprinkling hoses on water distribution in soil and grain yield of winter wheat. Field Crops Res. 2014, 161, 26–27. [Google Scholar] [CrossRef]
  21. Chai, Y.Q.; Turner, N.C.; Zhang, R.-Z.; Yang, C.; Niu, Y.; Siddique, K.H. Chapter Two—Water-Saving Innovations in Chinese Agriculture. Adv. Agron. 2014, 126, 149–201. [Google Scholar]
  22. Li, F.; Ma, Y. Evaluation of the Dual Crop Coefficient Approach in Estimating Evapotranspiration of Drip-Irrigated Summer Maize in Xinjiang, China. Water 2019, 11, 1053. [Google Scholar] [CrossRef]
  23. Mao, H. Research on soybean water requirement and schedule of drip irrigation. Agric. Res. Arid. Areas 2009, 27, 112–117. [Google Scholar]
  24. Yuan, Y.; Lei, M.; Yuxin, P.; Fenge, P.; Sunlan, R.; Miao, Z.; Yunfei, H. Effect of Three Different Herb-rubber Intercropping Patterns on Soil Physical and Chemical Properties in Rubber Forest. Chin. Agric. Sci. Bull. 2017, 33, 91–96. [Google Scholar]
  25. Li, F.-M.; Guo, A.-H.; Wei, H. Effects of clear plastic film mulch on yield of spring wheat. Field Crops Res. 1999, 63, 79–86. [Google Scholar] [CrossRef]
  26. Gao, Y.; Duan, A.; Qiu, X.; Liu, Z.; Sun, J.; Zhang, J.; Wang, H. Distribution of roots and root length density in a maize/soybean strip intercropping system. Agric. Water Manag. 2010, 98, 199–212. [Google Scholar] [CrossRef]
  27. Meng, T.; Weida, G.; Tusheng, R.; Baoguo, L. Spatio-temporal variation of soil water and temperature between maize rows as affected by no-tillage and strip crop straw mulching in southern Jilin Province. J. Plant Nutr. Fertil. 2022, 28, 1297–1307. [Google Scholar]
  28. Chenghao, Z.; Ruoshui, W.; Xuan, Z.; Chaonan, L.; Xiaoyu, D. Photosynthetic and growth characteristics of apple and soybean in an intercropping system under different mulch and irrigation regimes in the Loess Plateau of China. Agric. Water Manag. 2022, 266, 107595. [Google Scholar]
  29. Ai, Z.; Yang, Y.; Wang, Q.; Han, S.; Yang, Y.; Wang, Q.; Qiu, G. Changes of surface energy partitioning caused by plastic mulch in a cotton field. Int. Agrophys. 2018, 32, 349–356. [Google Scholar] [CrossRef]
  30. Gu, X.; Liang, Z.; Huang, L.; Ma, H.; Wang, M.; Yang, H.; Liu, M.; Lv, H.; Lv, B. Effects of plastic film mulching and plant density on rice growth and yield in saline-sodic soil of Northeast China. J. Food Agric. Environ. 2012, 10, 560–564. [Google Scholar]
  31. Khan, I.; Iqbal, B.; Khan, A.; Inamullah; Rehman, A.; Fayyaz, A.; Shakoor, A.; Farooq, T.; Wang, L.-x. The Interactive Impact of Straw Mulch and Biochar Application Positively Enhanced the Growth Indexes of Maize (Zea mays L.) Crop. Agronomy 2022, 12, 2584. [Google Scholar] [CrossRef]
  32. Lopes, W.; de Negreiros, M.; Dombroski, J.; Rodrigues, G.; Soares, A.; Araujo, A. Growth analysis of tomato plants ‘SM-16′ cultivated under different mulching. Hortic. Bras. 2011, 29, 554–561. [Google Scholar] [CrossRef]
  33. Qian, L.; Yubo, Q.; Caixia, Y.; Lili, K.; Meng, W.; Yunpeng, H.; Bo, S.; Yinkai, Z.; Chen, X.; Zhiquan, L. Effect of Drip Fertigation Mode on Maize Yield, Nutrient Uptake and Economic Benefit. Sci. Agric. Sin. 2022, 55, 1604–1616. [Google Scholar]
  34. Li, S.; Li, D.; Li, F.; Bai, H.; Ling, L.; Wang, J. Soil ecological effects of plastic film mulching in semiarid agro-ecological system. J. Northwest Agric. For. Univ. (Nat. Sci. Ed.) 2003, 31, 21–29. [Google Scholar]
  35. Yin, W.; Chai, Q.; Zhao, C.; Yu, A.; Fan, Z.; Hu, F.; Fan, H.; Guo, Y.; Coulter, J. Water utilization in intercropping: A review. Agric. Water Manag. 2020, 241, 106335. [Google Scholar] [CrossRef]
  36. Bu, L.; Zhu, L.; Liu, J.; Luo, S.; Chen, X.; Li, S. Source–Sink Capacity Responsible for Higher Maize Yield with Removal of Plastic Film. Agron. J. 2013, 105, 591–598. [Google Scholar] [CrossRef]
  37. Gan, Y.; Siddique, K.; Turner, N.; Li, X.-G.; Niu, J.-Y.; Yang, C.; Liu, L.; Chai, Q. Ridge-Furrow Mulching Systems—An Innovative Technique for Boosting Crop Productivity in Semiarid Rain-Fed Environments. Adv. Agron. 2013, 118, 429–476. [Google Scholar]
Figure 1. Precipitation and temperature during co-growth period of the apple and soybean.
Agronomy 13 00511 g001
Figure 2. Plane layout of the apple–soybean intercropping system.
Agronomy 13 00511 g002
Figure 3. Vertical layout of the apple–soybean intercropping system.
Agronomy 13 00511 g003
Figure 4. Effects of different irrigation and film mulching treatments on diurnal variation of soil temperature. Note: The temperature data of each treatment in the figure are the mean temperature of the geothermometer at soil depths of 5 cm, 15 cm, 30 cm, and 60 cm, which are 0.3 m and 0.8 m away from the apple tree. ** was highly significant (p < 0.01). ns indicates no significant.
Agronomy 13 00511 g004
Figure 5. Dynamic changes of soil water content during soybean growing period. Note: * indicates significant correlation (p < 0.05); ** was highly significant (p < 0.01). M is the film mulching period; L is the distance from the tree; and W is the irrigation level. The same below.
Agronomy 13 00511 g005
Figure 6. Vertical variation of soil water content during soybean growth period. Note: ** was highly significant (p < 0.01). S is the growth period; D is the soil depth. The same below.
Agronomy 13 00511 g006
Figure 7. Regression equation of soybean net photosynthetic rate (Pn), soil water use efficiency, and grain yield (GY) and partial with water input and fertilization rate. Note: * indicates significant correlation (p < 0.05); ** was highly significant (p < 0.01); ns indicates no significant.
Agronomy 13 00511 g007
Table 1. Slope analysis of soil water content and distance from tree at each growth stage.
TreatmentW1M1W2M1W3M1W1M2W2M2W3M2CK0CK1CK2
SWCBranching Stage0.275 ns0.195 *0.281 **0.012ns0.445 **0.664 **0.947 **0.159ns0.152 **
Podding Stage0.32 **0.279 **0.236 **0.493**0.105 **0.699 **0.884 **0.38 **0.217 **
Filling Stage0.395 *0.425 **0.046 **0.045**0.17 ns0.707 **1.075 **0.039 **0.091 **
PhPn2.514 **0.059 ns1.419 *−0.812 ns1.293 **0.056 ns1.107 ns1.672 **0.233 ns
Tr1.547 **0.514 ns0.567 ns0.249 ns−0.129 ns0.909 ns1.015 **0.049 ns0.341 ns
Note: * indicates significant correlation (p < 0.05); ** was highly significant (p < 0.01), ns indicates no significant.
Table 2. Effects of different irrigation and film mulching treatments on growth indexes of apple and soybean.
TreatmentAppleSoybean
Branching StagePodding StageFilling StageBranching StagePodding StageFilling Stage
SPADLAISPADLAISPADLAISPADLAIHeight/cmSPADLAIHeight/cmSPADLAIHeight/cm
W1M147.31 ± 1.82 c1.03 ± 0.06 a44.84 ± 2.62 d1.47 ± 0.42 ab55.17 ± 5.38 a0.97 ± 0.25 a39.33 ± 1.09 abc2.90 ± 0.22 bc49.10 ± 5.70 abc42.57 ± 0.88 a3.60 ± 1.38 ab76.00 ± 2.83 b46.08 ± 3.91 ab4.45 ± 1.03 ab96.50 ± 8.17 a
W2M154.59 ± 0.56 ab0.67 ± 0.21 d50.95 ± 1.71 c1.10 ± 0.69 ab61.43 ± 6.96 a0.93 ± 0.47 a41.23 ± 2.52 ab3.28 ± 0.46 a50.12 ± 3.51 abc43.42 ± 1.77 a4.42 ± 1.16 a85.67 ± 10.46 a47.58 ± 5.08 a5.52 ± 1.43 a99.00 ± 7.59 a
W3M156.68 ± 2.85 a0.83 ± 0.06 bc53.99 ± 3.06 b1.73 ± 0.23 a61.90 ± 6.06 a1.17 ± 0.21 a41.90 ± 1.65 a3.32 ± 0.43 a47.82 ± 6.95 bc45.12 ± 1.36 a4.47 ± 1.44 a91.17 ± 5.04 a46.93 ± 2.14 ab5.37 ± 0.85 a100.17 ± 8.75 a
W1M254.24 ± 1.09 ab0.90 ± 0.00 ab42.59 ± 0.80 d1.77 ± 0.15 a57.67 ± 9.07 b0.40 ± 0.00 b40.22 ± 0.69 ab2.63 ± 0.29 c51.32 ± 3.12 abc43.10 ± 2.70 a3.00 ± 0.43 ab83.33 ± 5.57 ab43.07 ± 1.58 bc3.62 ± 0.84 bc94.83 ± 6.62 a
W2M253.60 ± 4.12 ab0.77 ± 0.06 bcd52.94 ± 1.58 b1.17 ± 0.12 ab62.50 ± 6.86 a0.80 ± 0.17 ab40.28 ± 1.76 ab2.70 ± 0.37 c54.62 ± 1.50 ab43.15 ± 3.02 a4.57 ± 0.93 a84.83 ± 8.01 a44.97 ± 4.31 abc5.25 ± 1.30 a101.50 ± 12.05 a
W3M247.74 ± 1.35 c0.63 ± 0.06 de56.45 ± 2.84 a1.03 ± 0.61 ab55.63 ± 3.60 a0.97 ± 0.32 a40.68 ± 2.01 ab3.20 ± 0.13 ab55.24 ± 2.92 a43.50 ± 2.16 a4.65 ± 1.04 a91.33 ± 3.50 a45.07 ± 2.03 abc5.31 ± 0.43 a102.50 ± 11.95 a
CK050.36 ± 1.01 bc0.50 ± 0.10 e47.09 ± 2.22 bc1.00 ± 0.36 ab59.00 ± 4.93 a0.80 ± 0.20 ab38.30 ± 5.48 c0.43 ± 0.10 d19.91 ± 10.35 d40.53 ± 1.14 a1.92 ± 0.42 bc35.00 ± 7.54 c41.13 ± 2.60 bc1.52 ± 0.31 bc50.50 ± 14.12 b
CK156.51 ± 3.27 a0.73 ± 0.06 cd55.90 ± 1.27 a0.83 ± 0.29 b59.57 ± 7.30 a0.73 ± 0.21 ab36.32 ± 1.87 bc1.75 ± 0.05 e44.85 ± 2.92 e41.47 ± 2.60 a2.45 ± 0.50 c65.67 ± 9.91 d43.10 ± 2.68 c2.95 ± 1.08 d80.17 ± 10.68 c
CK252.68 ± 3.74 a0.60 ± 0.00 de50.64 ± 1.17 c0.90 ± 0.26 b53.57 ± 7.59 a0.80 ± 0.26 ab36.70 ± 3.23 c1.87 ± 0.20 d36.04 ± 6.17 c42.48 ± 6.30 a2.72 ± 0.71 bc60.67 ± 2.07 c43.27 ± 2.76 bc3.47 ± 0.90 c73.00 ± 7.18 b
Significance Testing (F-Value)
M2.007 ns13.768 **1.107 ns1.718 ns13.768 **2.39 ns0.98ns13.751 **28.742 **0.507 ns0.959 ns34.882 **2.785 ns6.285 **6.285 **
I1.084 ns6.812 **2.575 ns2.048 ns6.812 **1.917 ns8.037 **31.061 **12.365 **0.642 *11.675 **38.445 **2.381 ns10.408 **10.408 **
M×I12.874 **3.339 *12.675 **1.889 ns3.339 **1.53 ns0.453 ns27.723 **5.071 **0.480 ns0.554 ns1.731 ns0.586 ns1.554 ns1.554 ns
Note: * indicates significant correlation (p < 0.05); ** was highly significant (p < 0.01); ns indicates no significant. M is the film mulching period; I indicates irrigation, (a–d) represents the label of significant difference.
Table 3. Effects of different irrigation and film mulching treatments on photosynthetic indexes of apple and soybean.
TreatmentAppleSoybean
PnTrWUEiPnTrWUEi
W1M115.55 ± 4.10 ab5.89 ± 2.51 b2.93 ± 0.89 abc14.92 ± 6.50 b8.06 ± 3.91 c2.00 ± 0.81 b
W2M114.38 ± 6.25 ab6.13 ± 2.98 b2.57 ± 1.06 bc15.03 ± 5.86 b8.51 ± 4.30 c1.96 ± 0.80 b
W3M113.55 ± 5.67 bc6.43 ± 2.78 b2.15 ± 0.43 cd16.53 ± 6.56 a9.74 ± 4.15 b1.88 ± 0.98 b
W1M216.28 ± 5.76 a7.78 ± 3.91 a2.45 ± 1.36 bc15.26 ± 7.88 ab11.22 ± 5.69 a1.37 ± 0.51 c
W2M212.05 ± 4.73 c9.13 ± 3.91 a1.75 ± 0.58 d13.12 ± 5.18 cd11.86 ± 3.95 a1.36 ± 0.39 c
W3M211.82 ± 3.91 c7.87 ± 3.30 a1.63 ± 0.44 d17.71 ± 6.80 a12.55 ± 4.79 a1.35 ± 0.30 c
CK08.87 ± 4.26 d2.88 ± 1.33 d3.46 ± 1.72 a9.28 ± 3.74 e4.69 ± 2.43 e2.96 ± 3.25 a
CK111.58 ± 3.17 c4.39 ± 2.87 c3.71 ± 2.66 a15.12 ± 5.54 bc6.73 ± 3.62 d2.70 ± 1.46 a
CK28.76 ± 4.14 d3.53 ± 2.22 cd3.10 ± 4.26 ab12.45 ± 6.07 d6.78 ± 3.27 d2.13 ± 1.06 b
Significance Testing (F-Value)
M5.163 **10.261 **6.137 **18.611 **39.935 **36.938 **
I19.282 **22.970 **12.102 **12.054 **39.791 **21.533 **
M × I2.302 ns5.650 **0.616 ns2.498 ns6.085 **0.624 ns
Note: ** was highly significant (p < 0.01); ns indicates no significant. M is the film mulching period; I indicates irrigation, (a–e) represents the label of significant difference.
Table 4. Effects of different irrigation and film mulching treatments on yield and water use in intercropping system.
TreatmentGY/WC/WUE/IWUE/
(Kg•hm−2)(mm)(Kg•hm−2•mm−1)(Kg•m−3)
W1M11553.07 ± 109.91 b286.18 ± 4.13 d5.43 ± 0.38 a3.22 ± 0.23 a
W2M11572.83 ± 115.96 b363.86 ± 3.13 c4.32 ± 0.32 bc1.28 ± 0.10 c
W3M11624.23 ± 272.46 b428.45 ± 2.4 a3.79 ± 0.64 c0.90 ± 0.15 c
W1M21344.71 ± 239.29 bc283.18 ± 0.88 d4.75 ± 0.85 abc2.70 ± 0.48 b
W2M21510.02 ± 226.46 b391.58 ± 3.02 b3.86 ± 0.58 c1.10 ± 0.16 c
W3M22032.68 ± 397.40 a387.41 ± 4.09 b5.25 ± 1.03 ab1.20 ± 0.23 c
CK0675.90 ± 35.01 e239.21 ± 0.73 f2.83 ± 0.15 d-
CK11025.00 ± 267.65 cd265.64 ± 0.95 e3.86 ± 1.01 c-
CK2928.26 ± 39.19 d241.66 ± 1.49 f3.84 ± 0.16 c-
Significance Testing (F-Value)
M32.802 **4698.796 **19.410 **102.703 **
I5.821 *19.330 **10.317 **1.233 ns
M × I6.369 **224.256 **10.179 **3.917 *
Note: * indicates significant correlation (p < 0.05); ** was highly significant (p < 0.01); ns indicates no significant. M is the film mulching period; I indicates irrigation, (a–f) represents the label of significant difference.
Disclaimer/Publisher’s Note: The statements, opinions and data contained in all publications are solely those of the individual author(s) and contributor(s) and not of MDPI and/or the editor(s). MDPI and/or the editor(s) disclaim responsibility for any injury to people or property resulting from any ideas, methods, instructions or products referred to in the content.

