Article

Revealing Genetic Variations Associated with Chip-Processing Properties in Potato (Solanum tuberosum L.)

Highland Agriculture Research Institute, Rural Development Administration, Pyeongchang 25342, Republic of Korea
*
Author to whom correspondence should be addressed.
Agronomy 2023, 13(3), 642; https://doi.org/10.3390/agronomy13030642
Submission received: 25 January 2023 / Revised: 21 February 2023 / Accepted: 22 February 2023 / Published: 23 February 2023
(This article belongs to the Section Crop Breeding and Genetics)

Abstract

:
Although the potato chip industry is booming, and distinct chip-processing clones have been released over the past 60 years, the genetic architecture of their chip-processing characteristics remains largely unknown. Case-control genome-wide association studies (GWAS) with SolCAP SNP array data for chip-processing clones versus all other market classes in the 393-line potato diversity panel were performed using the GWASpoly R package, enabling detection of significant signals on chromosome 10. Our results were replicated using internal replication of a strata-corrected 190-line panel. Furthermore, the genomic scans employing selective sweep approaches such as the cross-population composite likelihood ratio method (XP-CLR) and PCAdapt redetected the same signals as those in our GWAS. Through applications of four selective sweep approaches, various genetic variants were found across the genome that had been differentially selected. These genomic regions under selection along with transcriptomic data analysis are involved in carbohydrate metabolism-related genes or loci and transcription factors, indicating to be associated with the improvement of chip-processing performance of potato cultivars. Kompetitive allele-specific PCR (KASP) assays were designed for the causal SNPs to use in validating the chip-processing clones. The results could have implications for genomics-assisted breeding of the promising chip-processing cultivars in potato.

1. Introduction

The cultivated potato (Solanum tuberosum L.), a vegetative propagated auto-tetraploid, is the world’s most vital non-cereal food crop. It is consumed fresh or in various processed forms, as well as having some industrial applications.
Potato chips, invented in the 1850s, form the largest snack food sector in all markets [1]. With the growing chip-processing industry after World War II, intensive potato breeding for chip-processing clones over the past 60 years has dramatically increased chip-processing performance which specifically matches industry requirements for the production of chips, resulting in divergence of a distinct market class called chip-processing clones from all other non-chip-processing lines including Table, French Fry Processing, Pigmented, Starch Processing, and Yellow [2,3,4]. The stringent market requirements for chip-processing varieties include light chip color, round tuber shape, low defects, high starch content, and resistance to cold-sweetening. Moreover, in chip-processing practices, many more parameters/properties can be considered in order to obtain fried potato snacks compatible with consumer acceptance or expectations, leading to the continued need for potatoes with improved physical and biochemical quality attributes of potato chips.
In practical breeding, the chip-processing phenotype is determined primarily as synergistic effects of some traits such as tuber shape, chip color, and specific gravity (reflecting dry matter or starch content) [5]. For the potato chip-processing industry, a first priority for chip quality is color after frying. Reducing sugar content at harvest and after storage is a determining factor whether chip color is light or dark. When thin slices of tubers are fried at high temperatures, the reducing sugars (glucose and fructose) which are formed predominantly from the hydrolysis of tuber sucrose, interact with amino acids in the Maillard reaction to produce an unacceptably dark-colored product [6]. For the processing clones belonging to the chip-processing market class, tuber glucose concentration was dramatically reduced in the late 1960s, and a consistent decrease in tuber sucrose content has also been achieved over time [2]. Although color after frying is also important in the French Fry Processing lines, the French fry processing industry uses different methods, such as blanching, which reduce the effects of reducing sugars on the appearance of the final product [2]. The ideal chipping potato is round and the size of a baseball [5]. Little or no change was observed for tuber shape over time within the chip-processing clones [2], whereas French fries were produced with oblong to long tubers. In the USA a specific gravity of 1.080 is deemed the minimum for processing. As starch content can vary considerably from season to season, the level of starch is always evaluated relative to that in the widely grown chipping variety, “Atlantic” [5].
Breeding potatoes remains challenging because the complexity of their auto-tetraploidy and highly heterozygous genome, the complexity of their plant and crop physiology, the duration of their growth cycle, their low multiplication factor, and the difficulties with the evaluation of their phenotype, have all resulted in slow progress, compared with diploid plants such as rice and tomato [7]. In the current potato breeding system, characterized by tetraploidy (2n = 4x = 48) and intolerance to inbreeding, superior allele combinations can be achieved via marker-assisted selection (MAS) [8].
Although, in the genomics era, molecular breeding of polyploidy crops such as potato has lagged behind many diploid crop species, genetic characterization of potato clones for economically important traits such as the chip-processing components has been conducted using the completed potato genome sequence information and various genetic resources available, for example, marker dense linkage maps, molecular markers, and next generation sequencing (NGS) platforms (reviewed by [9]). Marker-trait associations to identify quantitative trait loci (QTL) have been performed primarily using two approaches: linkage mapping in biparental population and genome-wide association studies (GWAS). GWAS explores associations of genotypes with phenotypes by testing for differences in the allele frequency of genetic variants between diverse germplasm accessions in contrast to genetic mapping studies in biparental mapping populations. In potato, high-throughput genotyping platforms ([2,10,11]) such as SolCAP array and SolSTW array that provide genome-wide representation of the single nucleotide polymorphisms (SNPs) present in the potato germplasm along with bioinformatics tools applicable to polyploids such as fitPoly [12], ClusterCall [13], and GWASpoly [14] increase the opportunity to detect genomic variants accurately, in comparison with genetic studies using genotyping by sequencing (GBS) data [15].
In terms of identification of genomic regions associated with the chip-processing components such as chip color, starch content or dry matter content using GWAS, some results have been published. For chip color, [16] employed GWAS with GBS data of 46,406 SNPs to identify significantly associated SNPs on chromosomes 4 and 10, with the strongest signal on chromosome 10. The greatest number of SNPs were located on chromosome 10 within the region from 49 Mb to 58 Mb. Another study, [17], also identified a cluster of 372 SNPs associated with chip color on chromosome 10 in the region between 50 and 60 Mb by employing genotyping by sequencing approach on 762 offspring of biparental crosses of 18 tetraploid parents and 74 breeding clones. In addition, 612 SNPs were found significant for starch content. The SNPs were mainly found on chromosome 10 for both traits, namely 316 SNPs for chip color and 596 SNPs for starch content, and 234 of those were found significant for both traits.
Although two GWAS studies in different populations aforementioned were carried out using GBS data, identification of QTL for chip color in similar region on chromosome 10 indicates that this may be an important region for chip color in potato [16]. However, the GBS data set used in these studies is not well suited for the discovery of exact genetic variants of genes for chip color and starch content as well. Contrary to GBS-based GWAS studies, SNP array-based GWAS studies have been published ([14,18]), but they did not identify any QTL for chip color, probably due to insufficient markers and population size (3441 SNPs and 221 tetraploid clones and 2095 SNPs and 110 individuals of biparental tetraploid population, respectively).
Tuber shape is a polygenic trait of potato and has been researched in multiple quantitative genetic studies (reviewed by [19]). Several biparental linkage mapping studies, genome-wide association studies and transcriptomic analyses have mapped major QTL for the tuber shape trait to a major locus, Ro, at 48.9 Mb on chromosome 10 ([20,21,22,23,24]), although the molecular identities of the QTL have not yet been published. QTL for tuber shape were also found on other chromosomes (reviewed by [19]).
QTL for specific gravity which is influenced by environmental factors such as temperature, rainfall, and day length, were reported on several linkage groups including chromosome 10 ([19,25,26]). The intensive selection events for the targeted traits in the breeding process is the major mechanism driving differentiation of populations, leaving footprints known as selection signatures, which can indicate regions harboring functionally important sequences of DNA ([27,28,29]).
The identification of selection signatures can provide novel insights into mechanisms that create diversity across populations and contribute to mapping of genomic regions underlying selected traits or phenotypes ([29,30]). A variety of approaches for detecting the genomic regions selected in the history of crop domestication and improvement have been applied to several crop plants including rice [31], wheat [32], soybean [33], oat [34], maize [35], tomato [36], potato ([4,24]), and Brassica rapa [37]. The cross-population likelihood method (XP-CLR) [38] and the cross-population extended haplotype homozygosity (XP-EHH) ([39,40]) method are approaches to identifying signals of selection through population comparison. The former identifies genetic regions based on allele frequency differentiation between populations, which is much more robust to ascertainment bias in SNP discovery than methods based on the allele frequency spectrum. The latter was designed to detect ongoing or nearly fixed selective sweeps by comparing haplotypes from two populations and relies on linkage disequilibrium (LD). The integrated haplotype homozygosity score (iHS) is also a linkage disequilibrium-based method, with both extreme extended haplotype homozygosity (EHH) for a short distance and moderate EHH for a longer distance from a core region being suggestive of positive selection. The PCA-based genome scans for selection (PCAdapt) [41] tests how much each locus is associated with population structure, assuming that outlier loci are indicative of local adaptation.
In this study, we analyzed 8303 SolCAP SNP genotyping array data for 393 tetraploid potato clones bred by global potato breeding programs from Korea, Japan, North America and other countries including landraces. From both the original 393-line panel and the strata-corrected 190-line panel, we detected strong significant GWAS signals on chromosome 10, and the lead SNP in GWAS was redetected in other approaches. We also detected hundreds of regions across the genome that had been differentially selected between chip-processing market class and all of the rest market classes. These selected regions are associated with chip-processing performance of potato cultivars and contain primarily known functional genes involved in carbohydrate metabolism and transcription factors as well. All genetic variants detected were validated with the expression pattern by using transcriptome data in leaf and tuber tissues. Kompetitive allele-specific PCR (KASP) assays were designed for the causal SNPs to use in validating the chip-processing clones. The results may have significant implications for future genome-assisted development of robust chip-processing cultivars in potato.

2. Materials and Methods

2.1. Plant Material and Phenotyping

We used a panel of 393 diverse cultivated potato clones described by our previous study with release dates ranging from 1857 to 2011 [4]. The panel included 69 Korean potato clones (43 commercial varieties and 26 advanced breeding lines) selected over 40 years by a local potato breeding program, and 324 potato collections from various countries (Japan, North America, the Netherlands, Germany, Chile, New Zealand, and Austria). Market class designations for potato clones under study were based on the previous papers [2,3,4]. In order to determine chip-processing designations for cultivars and advanced breeding lines from Korean potato germplasm, we performed a randomized complete block design with two replicates in two local environments. The following traits were analyzed; the ratio of tuber length to width (LW) [42], specific gravity measured by weighing a sample in air and then reweighing the sample in water (https://www.agric.wa.gov.au/potatoes/specific-gravity-potato-tubers (accessed on 2 February 2020)), tuber glucose content (grams 100 g−1 fresh weight) as described in [43], L* as the lightness measurement of the external color of the potato chips by using a Chroma meter (Konica–Minolta Inc., Tokyo, Japan) [42] and dry matter content (%) measured by a freeze-dry method [44]. A log10-transformation was performed for the tuber glucose content and BLUEs (best linear unbiased estimates) were calculated for all traits of study with restricted maximum likelihood (REML) using the software package META-R [45].

2.2. Genome-Wide Association Study

From a total of 393 market class-specified potato clones described in our previous study [4], we created a binary phenotype, chip-processing/non-chip-processing (denoted as “1”/“2”) (Supplementary Table S1). The chip-processing indicates 95 clones assigned to chip-processing market class, while the non-chip-processing contains the remaining clones assigned to the rest market classes. “NA” means clones with unknown market class. We performed a case-control GWAS in the 393-line panel using the filtered high quality 3977 SNPs based on the dosage genotyping model, to identify loci associated with the chip-processing characteristics. The R package GWASpoly tailored for auto-polyploids based on the Q + K mixed model [14] can test additive marker models as well as non-additive marker models. We used the additive model and two simplex dominant models (1_dom_alt and 1_dom_ref). In this study, we conducted the GWAS for three different models: (1) naïve model, (2) kinship (K) model, and (3) QDAPC + K model. The Q matrix was based on the discriminant analysis of principal components (DAPC) method in R package adegenet [46]. Using R package PCAmatchR for optimal case-control matching based on principal component analysis (PCA) [47], we created an internal replication consisting of 190-line panel, which shared individual clones with the discovery cohort but was ancestrally matched. After PCAmatchR was performed, the control composed of 95 non-chip-processing clones corresponding the 95 chip-processing clones (Supplementary Table S3). The whole-genome significance cutoff with the Bonferroni correction was set as p < 0.05/3977 = 1.26 × 10⁻⁵ (−log10(p) = 4.9). The correlation analysis of genotypes for the most significant SNP (lead SNP) and chip processing was performed. Significance of differences in chip-processing frequencies among different genotypes was calculated using the z-score calculator for two population proportions (https://www.socscistatistics.com/tests/ztest/ (accessed on 6 May 2021)).

2.3. Principal Component Analysis

Principal component analysis (PCA) was conducted using the 3977 filtered high-quality SNPs based on the dosage genotyping model [4]. The dudi.pca function of the adegenet R package was run to perform PCA. We also used PCAmatchR, a software for performing optimal case-control matching using principal component analysis (PCA), in order to select controls that are well matched by ancestry to cases. After running PCAmatchR, 95 non-chip-processing clones corresponding to the 95 chip-processing cases were obtained, with being subjected to GWAS (Supplementary Table S3).

2.4. Selective Sweeps Analysis

First, a panel consisting of a total of 227 potato clones (90 chip-processing clones and 137 non-chip-processing clones) was created (Supplementary Table S4), which displayed clear separation of two populations (chip processing versus non-chip processing), by the PCA analysis of the 393-line diversity panel (Supplementary Figure S5e). Selection signature analyses were carried out using the 3977 SNPs for by applying four complementary statistical methods, the cross-population likelihood method (XP-CLR) [38], PCA-based genome scans for selection (PCAdapt) [41], integrated haplotype homozygosity score (iHS) and cross-population extended haplotype homozygosity (XP-EHH) ([39,40]).
XP-CLR: The XP-CLR package implements a composite likelihood method for detecting selective sweeps based on modeling the likelihood of multilocus allele frequency differentiation of two populations [38]. We downloaded the genetic map of [48] and interpolated the genetic positions for each SNP. The software XP-CLR was run with parameters “XPCLR -xpclr chip.geno non-chip.geno mapfile.snp xpclr -w1 0.0005 100 100 1 -p0 0.95” for each chromosome. After running XP-CLR, the average XP-CLR scores were obtained along the interpolated genetic positions and regions separated by low-score segment of less than 3.0 were merged. Regions greater than 3.0 were considered as differentially selected regions.
PCAdapt: The R package pcadapt performs genome scans to detect outlier loci excessively related with population structure which are considered candidates for local adaptation or selection outcomes [41]. The option for linkage disequilibrium (LD) clumping was applied to remove variants in LD. A list of outliers was provided based on the Benjamini–Hochberg Procedure (method = “BH”) using 1% as false discovery rate threshold.
iHS and XP-EHH: The two methods are based on linkage disequilibrium (LD) patterns, unlike the outlier test PCAdapt which is based on allele frequency differentiation. iHS is known to be sensitive to ongoing or incomplete selection signatures, whereas XP-EHH is best at revealing the selection signatures close to fixation [37]. SHAPEIT2 [49] set to the default options (window 0.5, burn 200, prune 200, main 500) was used to obtain phased haplotypes for iHS and XP-EHH analyses, implemented using the rehh package [50] in R. Candidate-selection sweep regions were defined as the SNP regions under selection by both the applied statistics. Genes spanning ~100 kb upstream and downstream of the candidate selection regions were retrieved from the genome browser window of the Spud DB database (http://spuddb.uga.edu/ (accessed on 1 January 2021)).

2.5. Transcriptome Analysis

In order to see expression patterns of the candidate gene containing the causal SNP marker and to rule out non-functional candidate genes, gene expression values (TPM) for potato RNA-seq libraries from the Sequence Read Archive (SRA) for leaf and tuber tissues of the two popular tetraploid cultivars, cvs. Atlantic and Superior, were downloaded from the Spud DB database (http://spuddb.uga.edu/dm_v6_1_download.shtml (accessed on 5 August 2021)). Genes spanning ~100 kb upstream and downstream of the candidate selection regions of the most significant SNPs for the chip-processing market class were selected, and an expression pattern associated with the SNPs was shown, except genes whose TPM equals 0 across libraries. The heatmap was created using pheatmap R package (https://rdrr.io/cran/pheatmap/ (accessed on 9 September 2021)).

2.6. KASP Assay

KASP assays were validated in a panel of 49 tetraploid cultivars and associated with the phenotype data of traits such as specific gravity, L*(chip color lightness), dry matter content and chip-processing market. Then, 50 bp of flanking sequence on either side of the target SNP (http://spuddb.uga.edu/ (accessed on 5 September 2021)) was submitted to LGC Biosearch Technologies (Seoul, Korea) for designing KASP primers. Fluorescence detection of the reactions was carried out using a QuantStudio 3 (Applied Biosystems, Thermo Fisher Scientific, Waltham, MA, USA) and the signal data (X (Allele 1) and Y (Allele 2)) were extracted using the QuantStudio™ Design & Analysis Software (Applied Biosystems), followed by genotype calls using the fitPoly R package [12].

3. Results

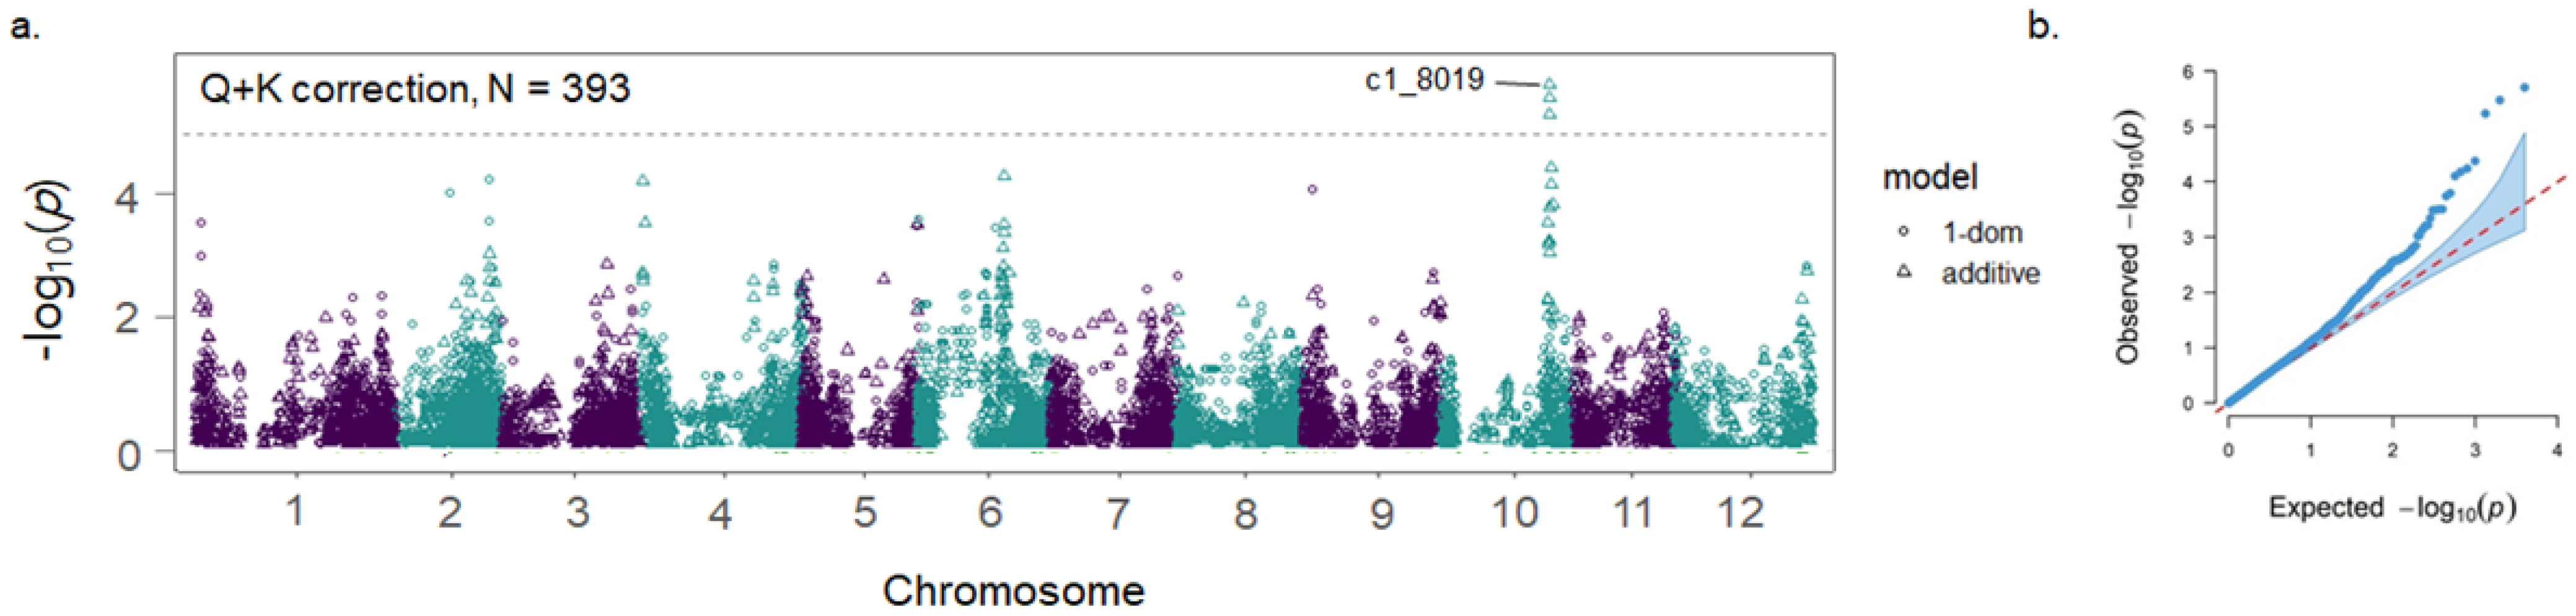
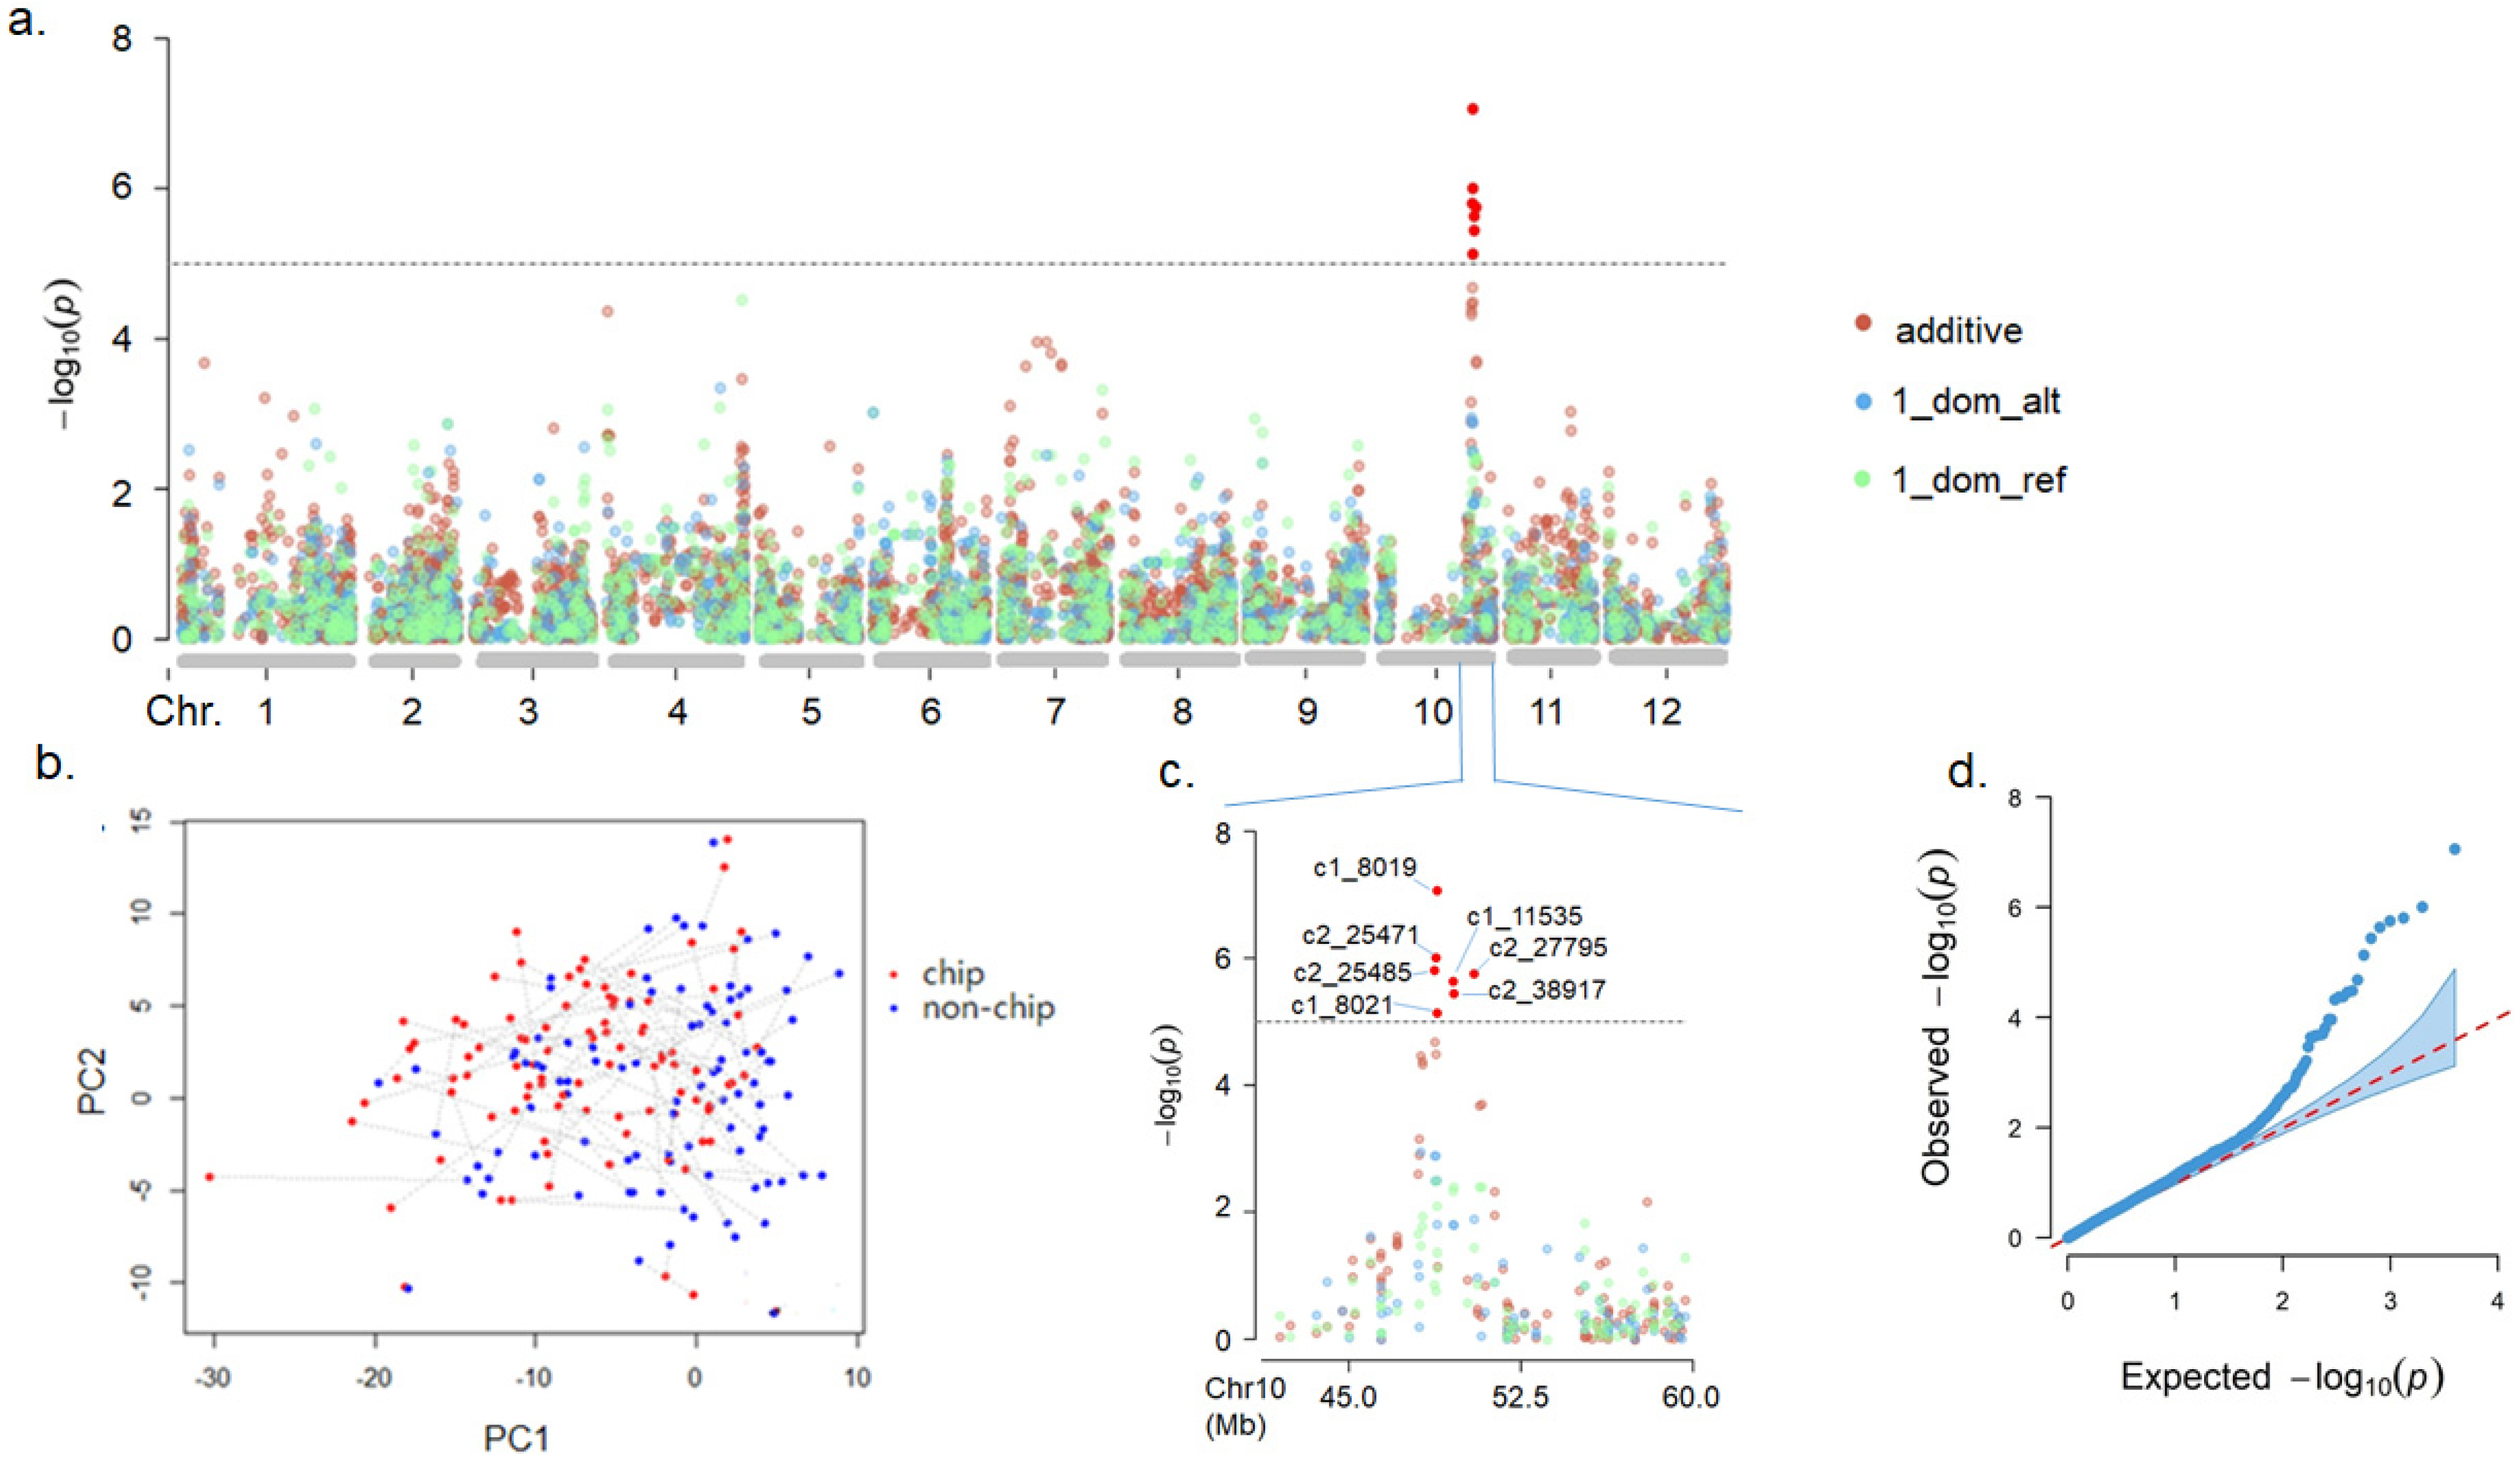
3.1. Genome-Wide Association Study

To identify genetic variants for chip processing, we initially analyzed 3977 high quality genome-wide SNPs for GWAS of 95 cases versus 298 controls using the K-correction function of GWASpoly. The calculated genome-wide LD was low and a 5–10 Mb window seemed appropriate to filter only the most significant markers in the output as described by Endelman (https://jendelman.github.io/GWASpoly/GWASpoly.html (accessed on 5 May 2021)) (Supplementary Figure S1). We found genome-wide significant associations (−log10(p) = 7.06) between a lead SNP marker c1_8019 and chip processing on chromosome 10 (Supplementary Figure S2a). Moreover, on chromosome 4, we detected another GWAS signal with a significant association (−log10(p) = 5.17) between a lead SNP marker c1_7568 and chip processing. Although the K model reduced inflation significantly relative to naïve model (Supplementary Figure S2b,c), the signal on chromosome 4, when implemented QDAPC + K model, disappeared and the GWAS signal on chromosome 10 has been reproduced (Figure 1a). The lead SNP marker c1_8019 located at chr10:49709990..49720192 (http://spuddb.uga.edu/ (accessed on 6 September 2021)) of the potato reference genome DMv6.1. In previous GWAS studies ([14,51]), the lead SNP marker c1_8019 was discovered to be associated with the tuber shape. The current association cohort is heterogeneous as there are long tuber cultivars representing russet and French fry clones among the control contrary to the case. In order to minimize the effects by tuber shape as a covariate and subsequently see if GWAS signals at the same region on chromosome 10 reproduce, we carried out GWAS with the 332-line panel excluding long tuber clones including russet and French fry processing clones among the control. Indeed, when we applied the Li and Ji threshold [52], we found significant signals at the same region on chromosome 10 passing the genome-wide significance threshold of −log10(p) = 4.63 (Supplementary Figure S3; Supplementary Table S2) were still detected, suggesting that the remaining signals except those by tuber shape could be attributed by effects of individual component traits for the chip-processing phenotype. Principal component analysis (PCA) of population structure for the 393-line diversity panel (Supplementary Figure S4) revealed evidence for population structural stratification between cases and controls. We employed PCAmatchR software to select controls that are well matched by ancestry to cases, resulting in a new 190-line diversity panel consisting of 95 chip-processing clones and 95 non-chip-processing clones with which both cases and controls plotted evenly in the PCA analysis (Figure 2b). The use of the 190-line diversity panel in the subsequent GWAS also showed similar GWAS signals on chromosome 10, with being genome-wide significant associations (−log10(p) = 7.06) between the lead SNP marker c1_8019 and chip processing. That QTL explained 14% of the phenotypic variance (R2 = 0.14). Table 1 shows SNPs passing the genome-wide significance threshold of −log10(p) = 5.0 for GWAS using the 190-line diversity panel. We investigated the association of SNP c1_8019 with chip processing (Figure 3). The incidence of chip processing was significantly greater in ABBB (82.4%) and BBBB (83.3%) genotypes as compared to the AAAA (13.6%), AAAB (36.8%) and AABB (50.0%) genotypes at p < 0.01 in the z-score test for two population proportions. There were no significant differences in the frequency of chip processing between ABBB and BBBB groups and between AAAB and AABB groups, respectively. These results indicate that the occurrence of B allele of c1_8019 at the HSI2-like locus is associated with increased frequency of chip processing.

3.2. Selective Sweeps

We further employed the selective sweep approaches to discover the selection signatures for chip processing.
We choose four selective sweep approaches to identify genes or loci or genomic regions that have been under selection due to breeding of chip-processing potato cultivars: XP-CLR, PCAdapt, iHS and XP-EHH. Based on PCA analysis, we created a new 227-line panel in which the 90 chip-processing vs. 137 non-chip-processing populations are separated clearly into two groups (Supplementary Figure S5e). We found the same signals on chromosome 10 as those discovered in GWAS when used XP-CLR and PCAdapt, while no signals on the same position using iHS and XP-EHH, as shown in the integrated Circular Manhattan plot for all five genomic scans employed in this study (Figure 4 and Figure S5a–d).
XP-CLR and PCAdapt: Selection signatures were found for genes, loci or regions which harbor 122 most significant SNPs across the genome, in which scores of XP-CLR ranged between 3.0 and 18.5 (Supplementary Table S6). We found selection signatures for key enzymes or proteins known to involve in starch or sugar or carbohydrate metabolism such as UDP-glucose pyrophosphorylase (Soltu.DM.01G028790), invertase/pectin methylesterase inhibitors (Soltu.DM.01G031690, Soltu.DM.01G031700, Soltu.DM.01G031740, Soltu.DM.10G019840, Soltu.DM.10G019850), UDP-glycosyltransferase (Soltu.DM.02G009030), UDP-glucose 6-dehydrogenase (Soltu.DM.02G009480), starch synthase (Soltu.DM.02G020170), phosphofructokinase (Soltu.DM.02G020660), glycosyl hydrolase (Soltu.DM.02G023650), UDP-glucosyl transferase (Soltu.DM.02G025510), hexokinase-like (Soltu.DM.02G027090), xyloglucan endotransglucosylase/hydrolase (Soltu.DM.02G027190), glucose-1-phosphate adenylyltransferase (Soltu.DM.03G012410), α-amylase-like (Soltu.DM.03G013410), pectin lyase-like (Soltu.DM.03G027130), starch branching enzyme (Soltu.DM.04G037620), pyruvate kinase (Soltu.DM.06G013720), cell wall/vacuolar inhibitor of fructosidase (Soltu.DM.10G019860), alkaline/neutral invertase (Soltu.DM.11G006090), SEX4 (Soltu.DM.12G016610.1), sucrose synthase (Soltu.DM.12G011710), and B-S glucosidase (Soltu.DM.12G011740), etc. We also identified genes encoding important transcription factors such as HSI2-like (Soltu.DM.10G018620.1, Soltu.DM.10G018620.2, Soltu.DM.10G018640), BEL1-like homeodomain (Soltu.DM.02G029880.1), WRKY transcription factors (Soltu.DM.03G013350) and so on. In fact, HSI2 (HIGH-LEVEL EXPRESSION OF SUGAR-INDUCIBLE GENE2) of Arabidopsis thaliana is known to be a B3 DNA-binding domain protein that represses the transcription of sugar-inducible reporter gene [53]. When we employed PCAdapt, we identified 86 outlier loci involved in biological adaptation or selective sweeps based on the Benjamini–Hochberg procedure using 1% as false discovery rate threshold (Supplementary Table S6). We found selection signatures for key enzymes or proteins known to be involved in starch or sugar or carbohydrate metabolism and transport such as glucose-1-phosphate adenylyltransferase (Soltu.DM.01G049590), β-galactosidase (Soltu.DM.01G049850), neutral invertase (Soltu.DM.01G050680), triosephosphate isomerase (Soltu.DM.01G050700), UDP-glycosyltransferase (Soltu.DM.02G009030), pyruvate decarboxylase (Soltu.DM.02G016510), starch synthase (Soltu.DM.02G020170), phosphofructokinase (Soltu.DM.02G020660), UDP-glucosyl transferase (Soltu.DM.02G021500), tonoplast monosaccharide transporter (Soltu.DM.02G022370), glycosyl hydrolase (Soltu.DM.02G023650), mannose-1-phosphate guanylyltransferase (Soltu.DM.02G026810), hexokinase-like (Soltu.DM.02G027090), UDP-glucose 6-dehydrogenase (Soltu.DM.02G031050), UDP-glucosyl transferase (Soltu.DM.02G031240), UDP-glycosyltransferase (Soltu.DM.03G011430), α-amylase-like (Soltu.DM.03G013410), sugar isomerase (SIS) (Soltu.DM.03G019300), sucrose transporter (Soltu.DM.05G006180), sugar transporter (Soltu.DM.07G002310), β-amylase (Soltu.DM.07G018100), xyloglucan endotransglucosylase/hydrolase (Soltu.DM.07G018430), and pectin lyase-like (Soltu.DM.08G028230). Furthermore, we identified the same transcription factor HSI2-like on chromosome 10 as discovered in GWAS, and other transcription factors as well.
iHS and XP-EHH: When we used these approaches, we found fewer significant SNPs across the genome than those identified using XP-CLR and PCAdapt (Supplementary Table S6). Out of 11 identified genes and regions for iHS, three genes were involved in carbohydrate metabolism; galactosyltransferase (Soltu.DM.04G010260.5), UDP-glucosyl transferase (Soltu.DM.04G010350), cellulose-synthase-like D2 (Soltu.DM.08G003680), and glucose-6-phosphate/phosphate translocator-related (Soltu.DM.10G004860). In XP-EHH, 18 genes or regions were identified, out of which galactosyltransferase (Soltu.DM.04G010260.5), UDP-glucosyl transferase (Soltu.DM.04G010350, Soltu.DM.07G013820), UDP-glycosyltransferase (Soltu.DM.07G013850, Soltu.DM.07G013870), pyruvate dehydrogenase E1 alpha (Soltu.DM.07G013720), and pectin lyase-like (Soltu.DM.07G014040) were involved in carbohydrate metabolism. Table 2 shows the SNP regions under selection identified by more than two approaches applied. A total of 43 genes were identified for more than two approaches in terms of signatures of selection, which included putative functional genes encoding UDP-glycosyltransferase, UDP-glucose 6-dehydrogenase, pyruvate decarboxylase-2, starch synthase, phosphofructokinase, glycosyl hydrolase, hexokinase-like, xyloglucan endotransglucosylase/hydrolase, and cell wall/vacuolar inhibitor of fructosidase.

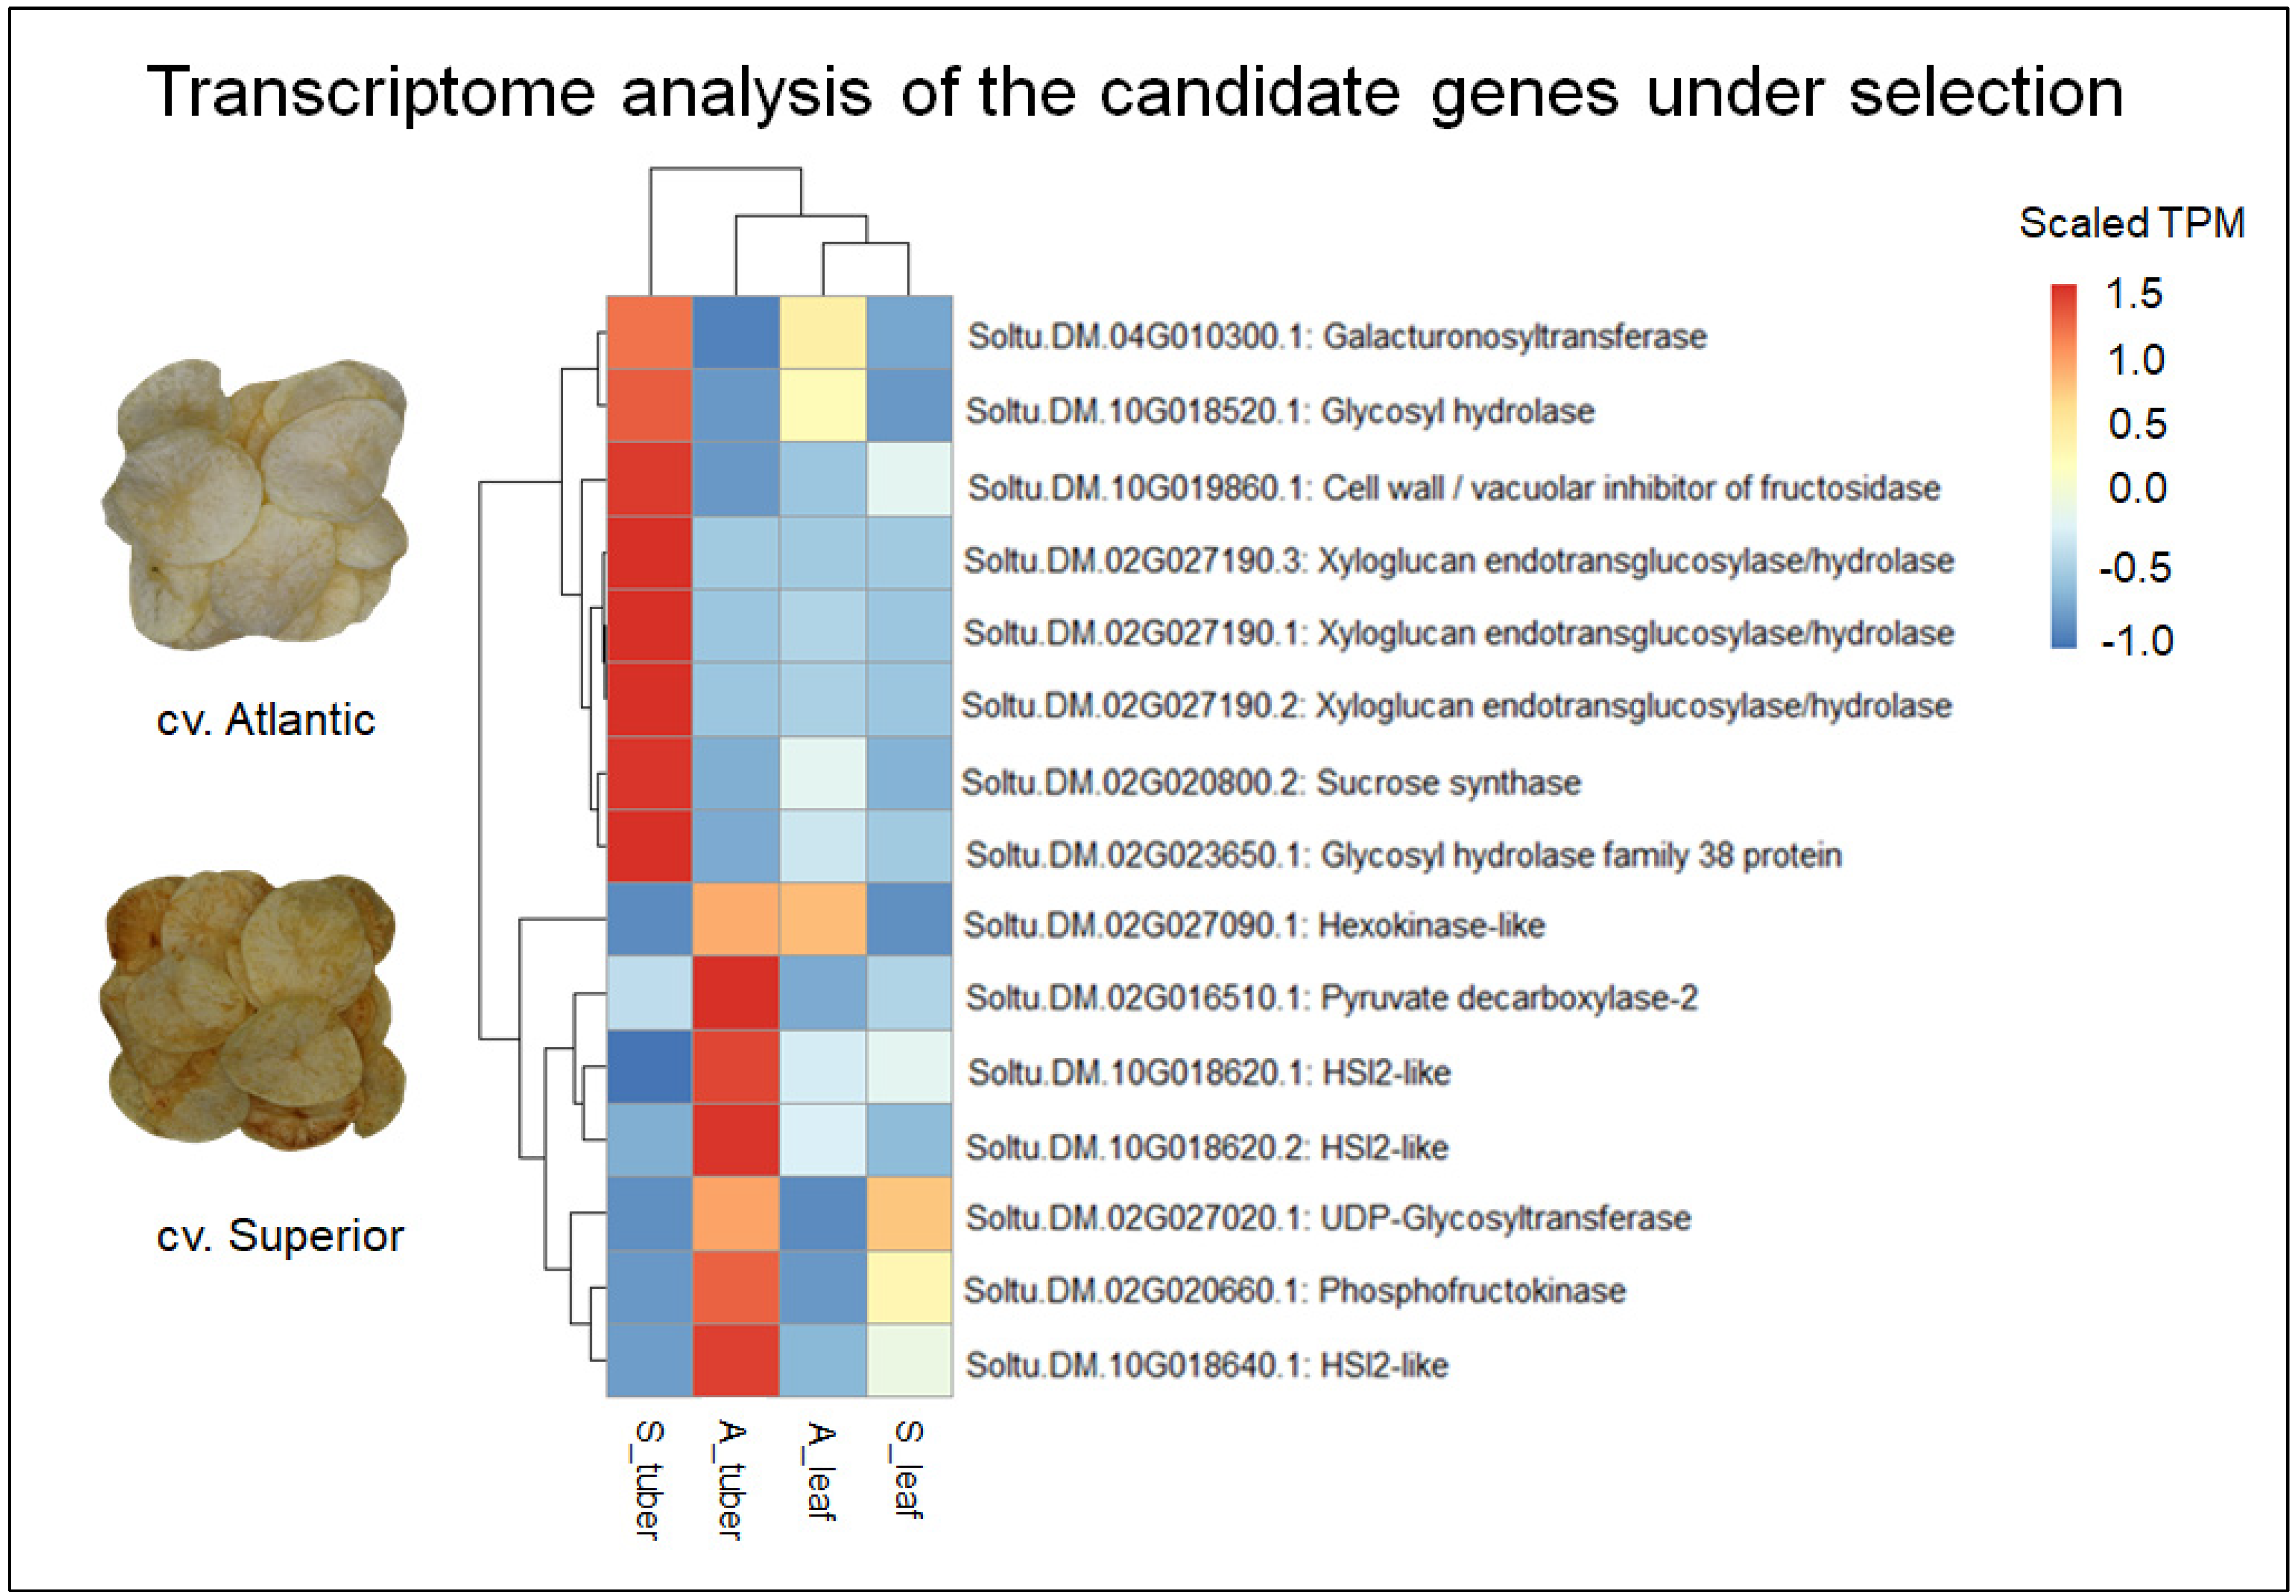
3.3. Transcriptome Analysis

In order to rule out the candidate genes having no expression, and to see expression patterns of the candidate gene, HSI2-like, containing the causal SNP between chip processing and non-chip processing among cultivars, we analyzed existing transcriptome data from leaf and tuber tissues of two popular tetraploid potato cultivars, cvs. Atlantic and Superior, which are classified as Chip processing and Table, respectively [54] (Figure 5, Supplementary Table S6). Taking expression patterns of the genes identified by XP-CLR into account, there were no expression for some genes such as Soltu.DM.02G009520 (AGAMOUS-like), Soltu.DM.03G013380 (AGAMOUS-like), Soltu.DM.09G000470 (α-1,4-glycosyltransferase) and Soltu.DM.12G011710 (sucrose synthase) (Supplementary Table S7). For the five genes (Soltu.DM.01G031700, Soltu.DM.01G031740, Soltu.DM.10G019840, Soltu.DM.10G019850 and Soltu.DM.01G031690) encoding Plant invertase/pectin methylesterase inhibitor, four had no expression. Figure 5 shows the candidate genes with differential expression of >3.0-fold for TPM values between two cultivars. With respect to expression in tubers for HSI2-like genes (Soltu.DM.10G018620.1, Soltu.DM.10G018620.2, and Soltu.DM.10G018640.1) on chromosome 10, cv. Atlantic has higher expression levels than those of cv. Superior, potentially indicating the possibility that these genes could play a role in forming chip processing in tetraploid potatoes as elucidated by GWAS, XP-CLR and PCAdapt approaches.

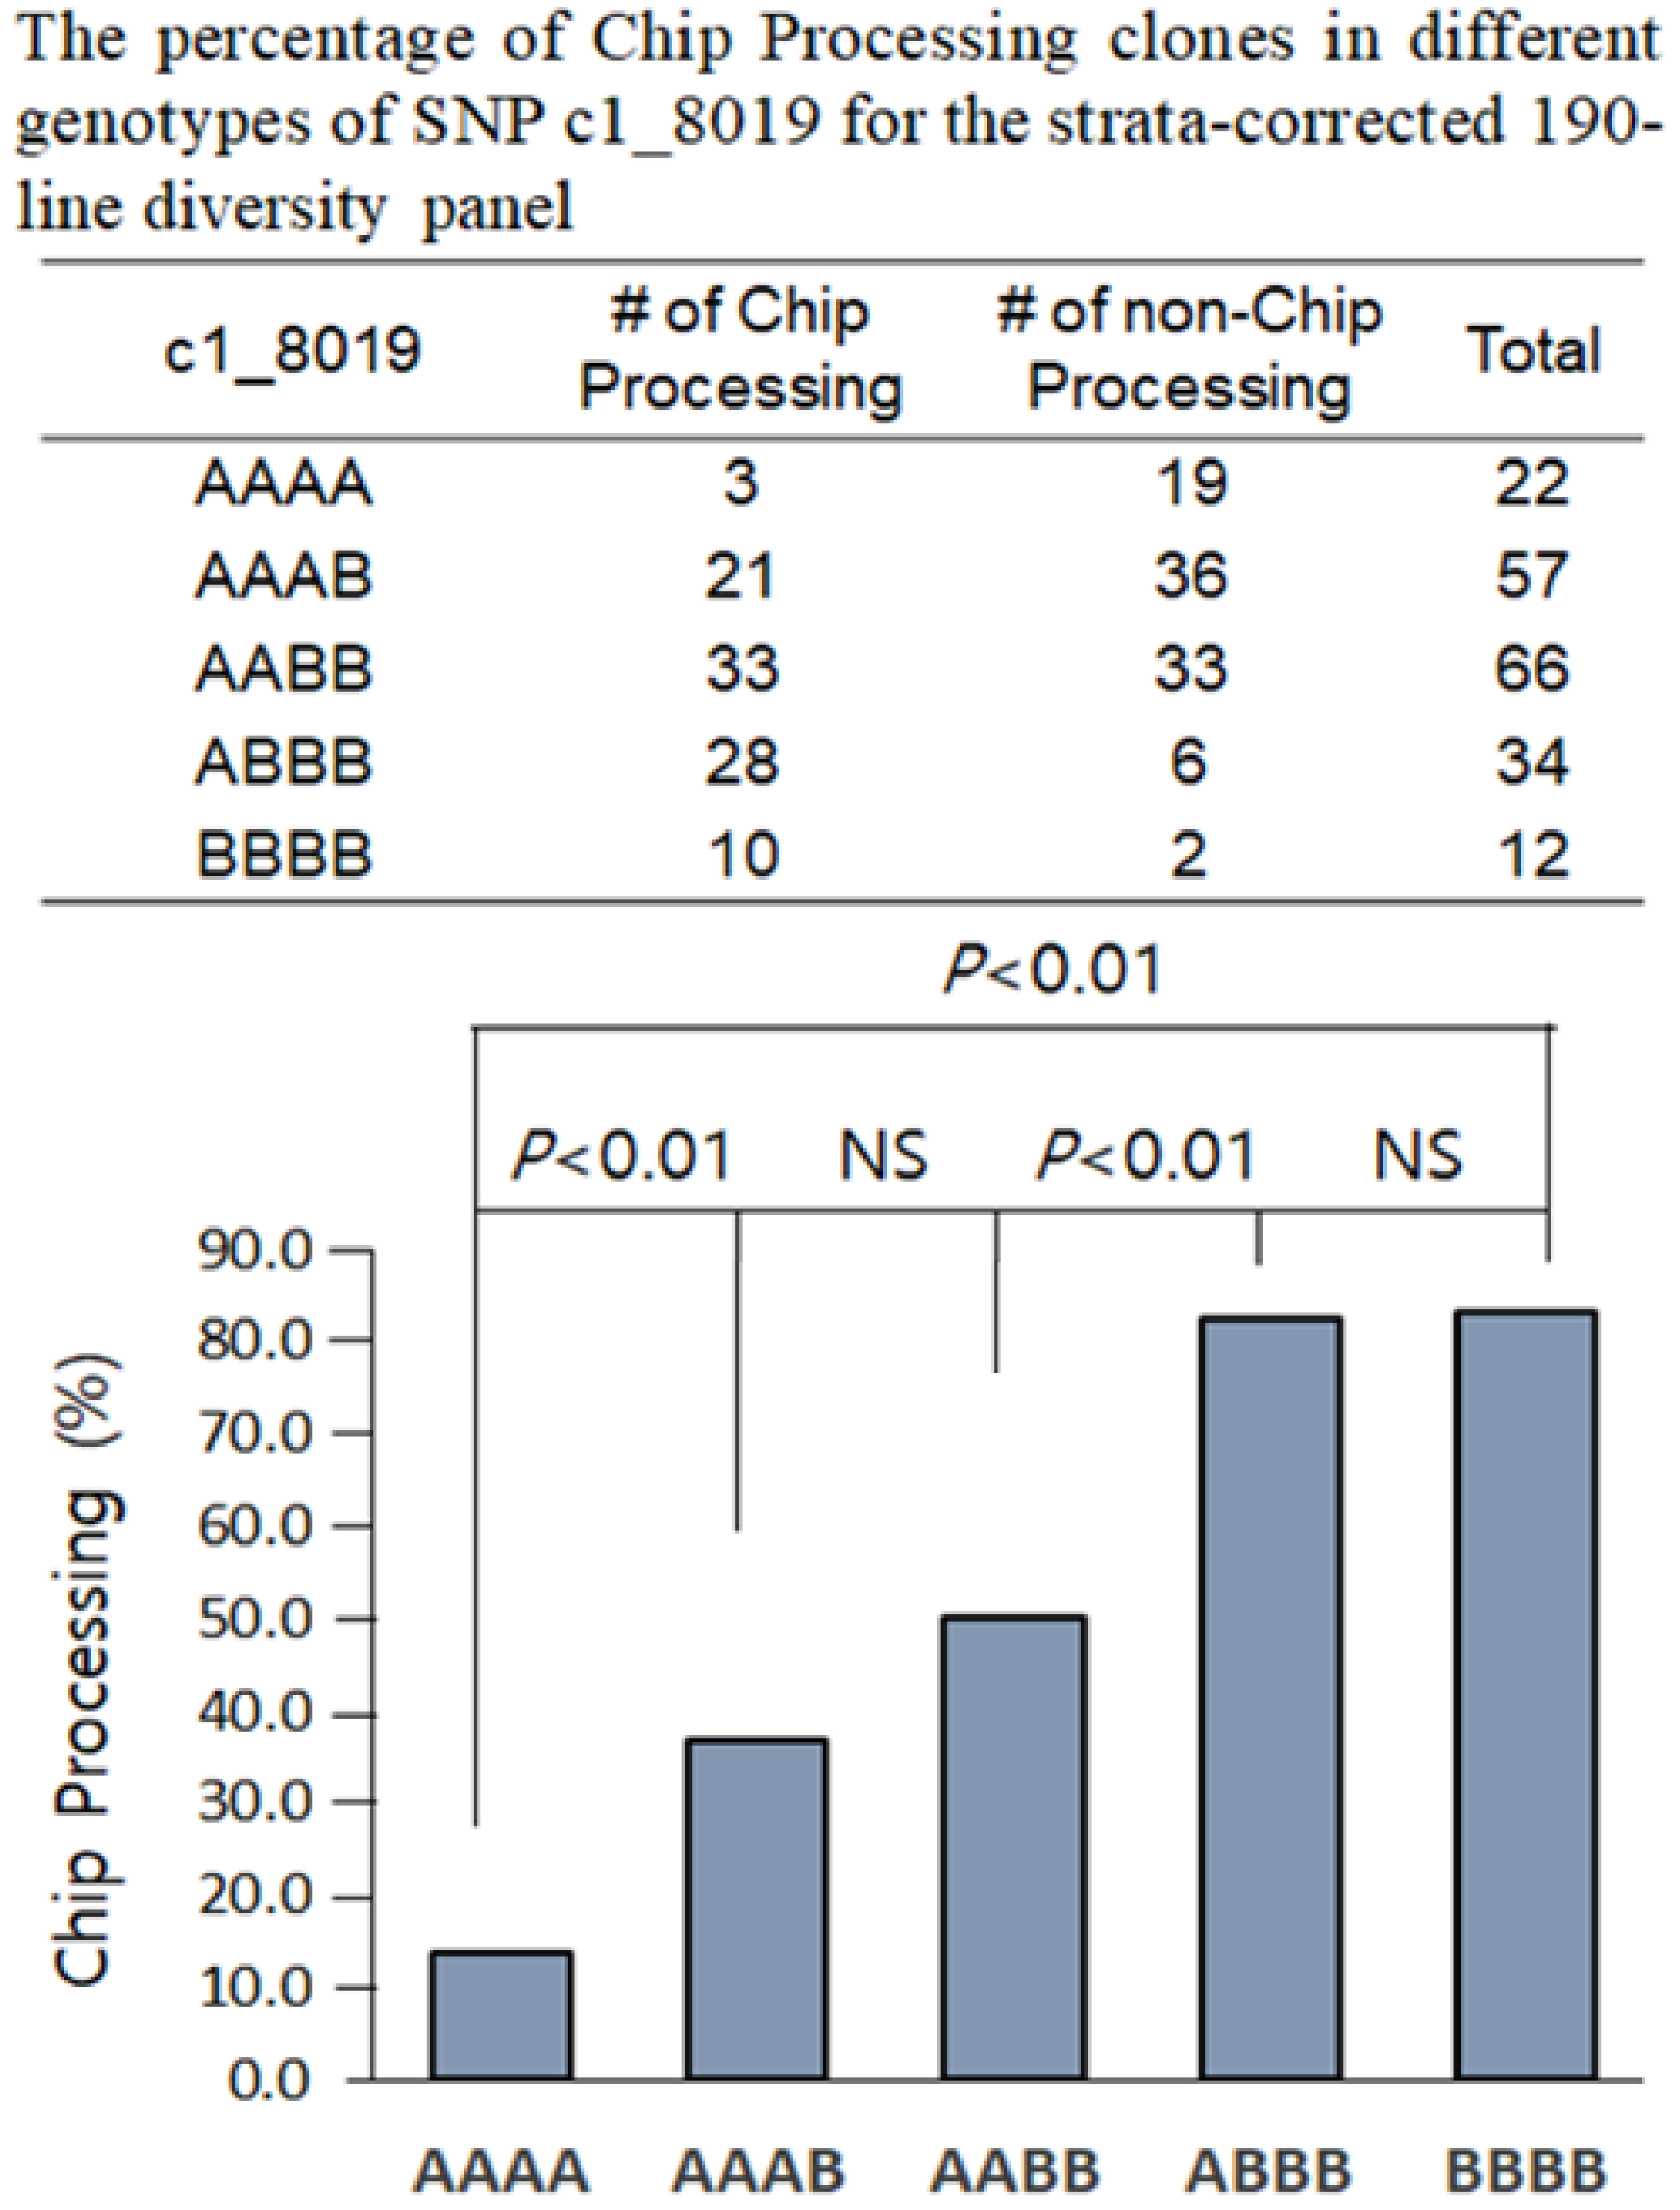
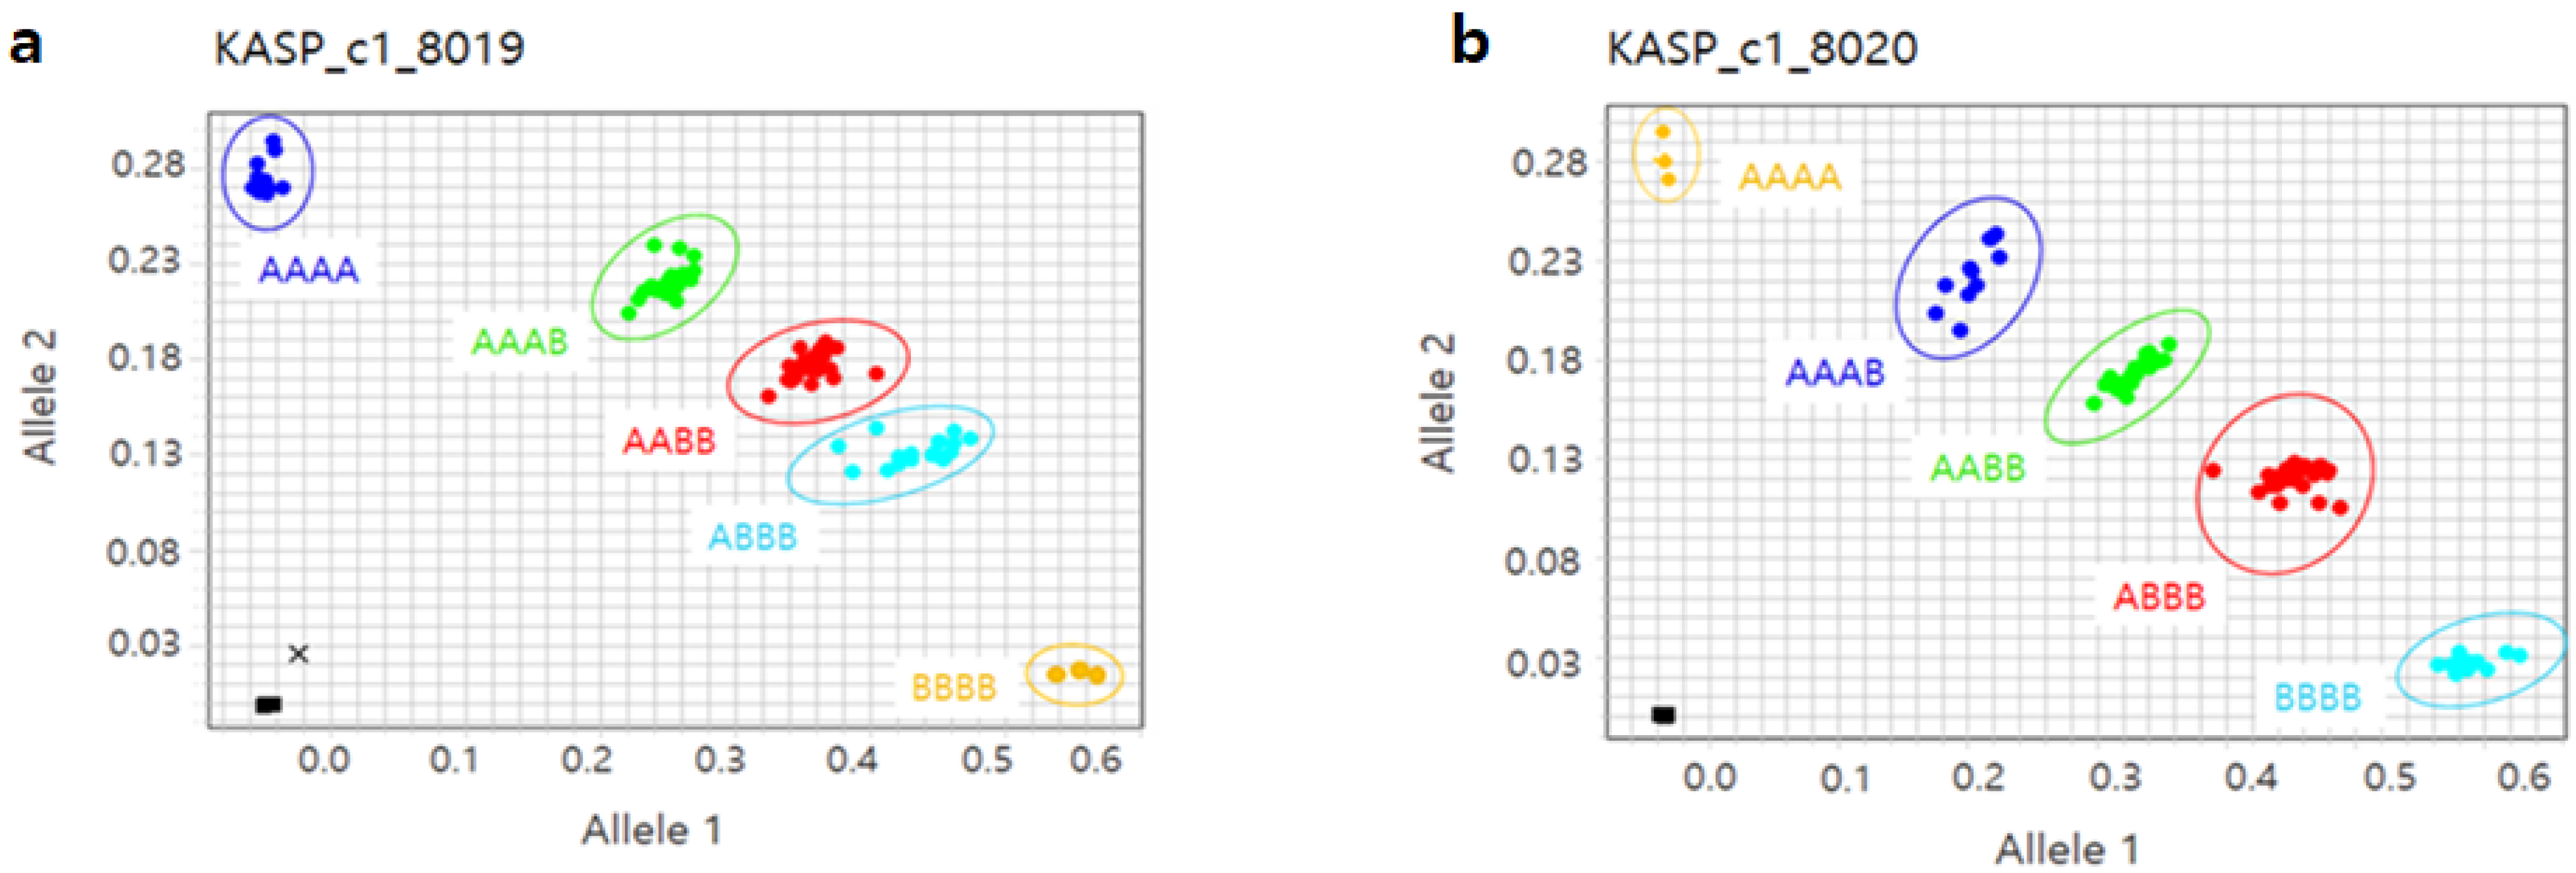
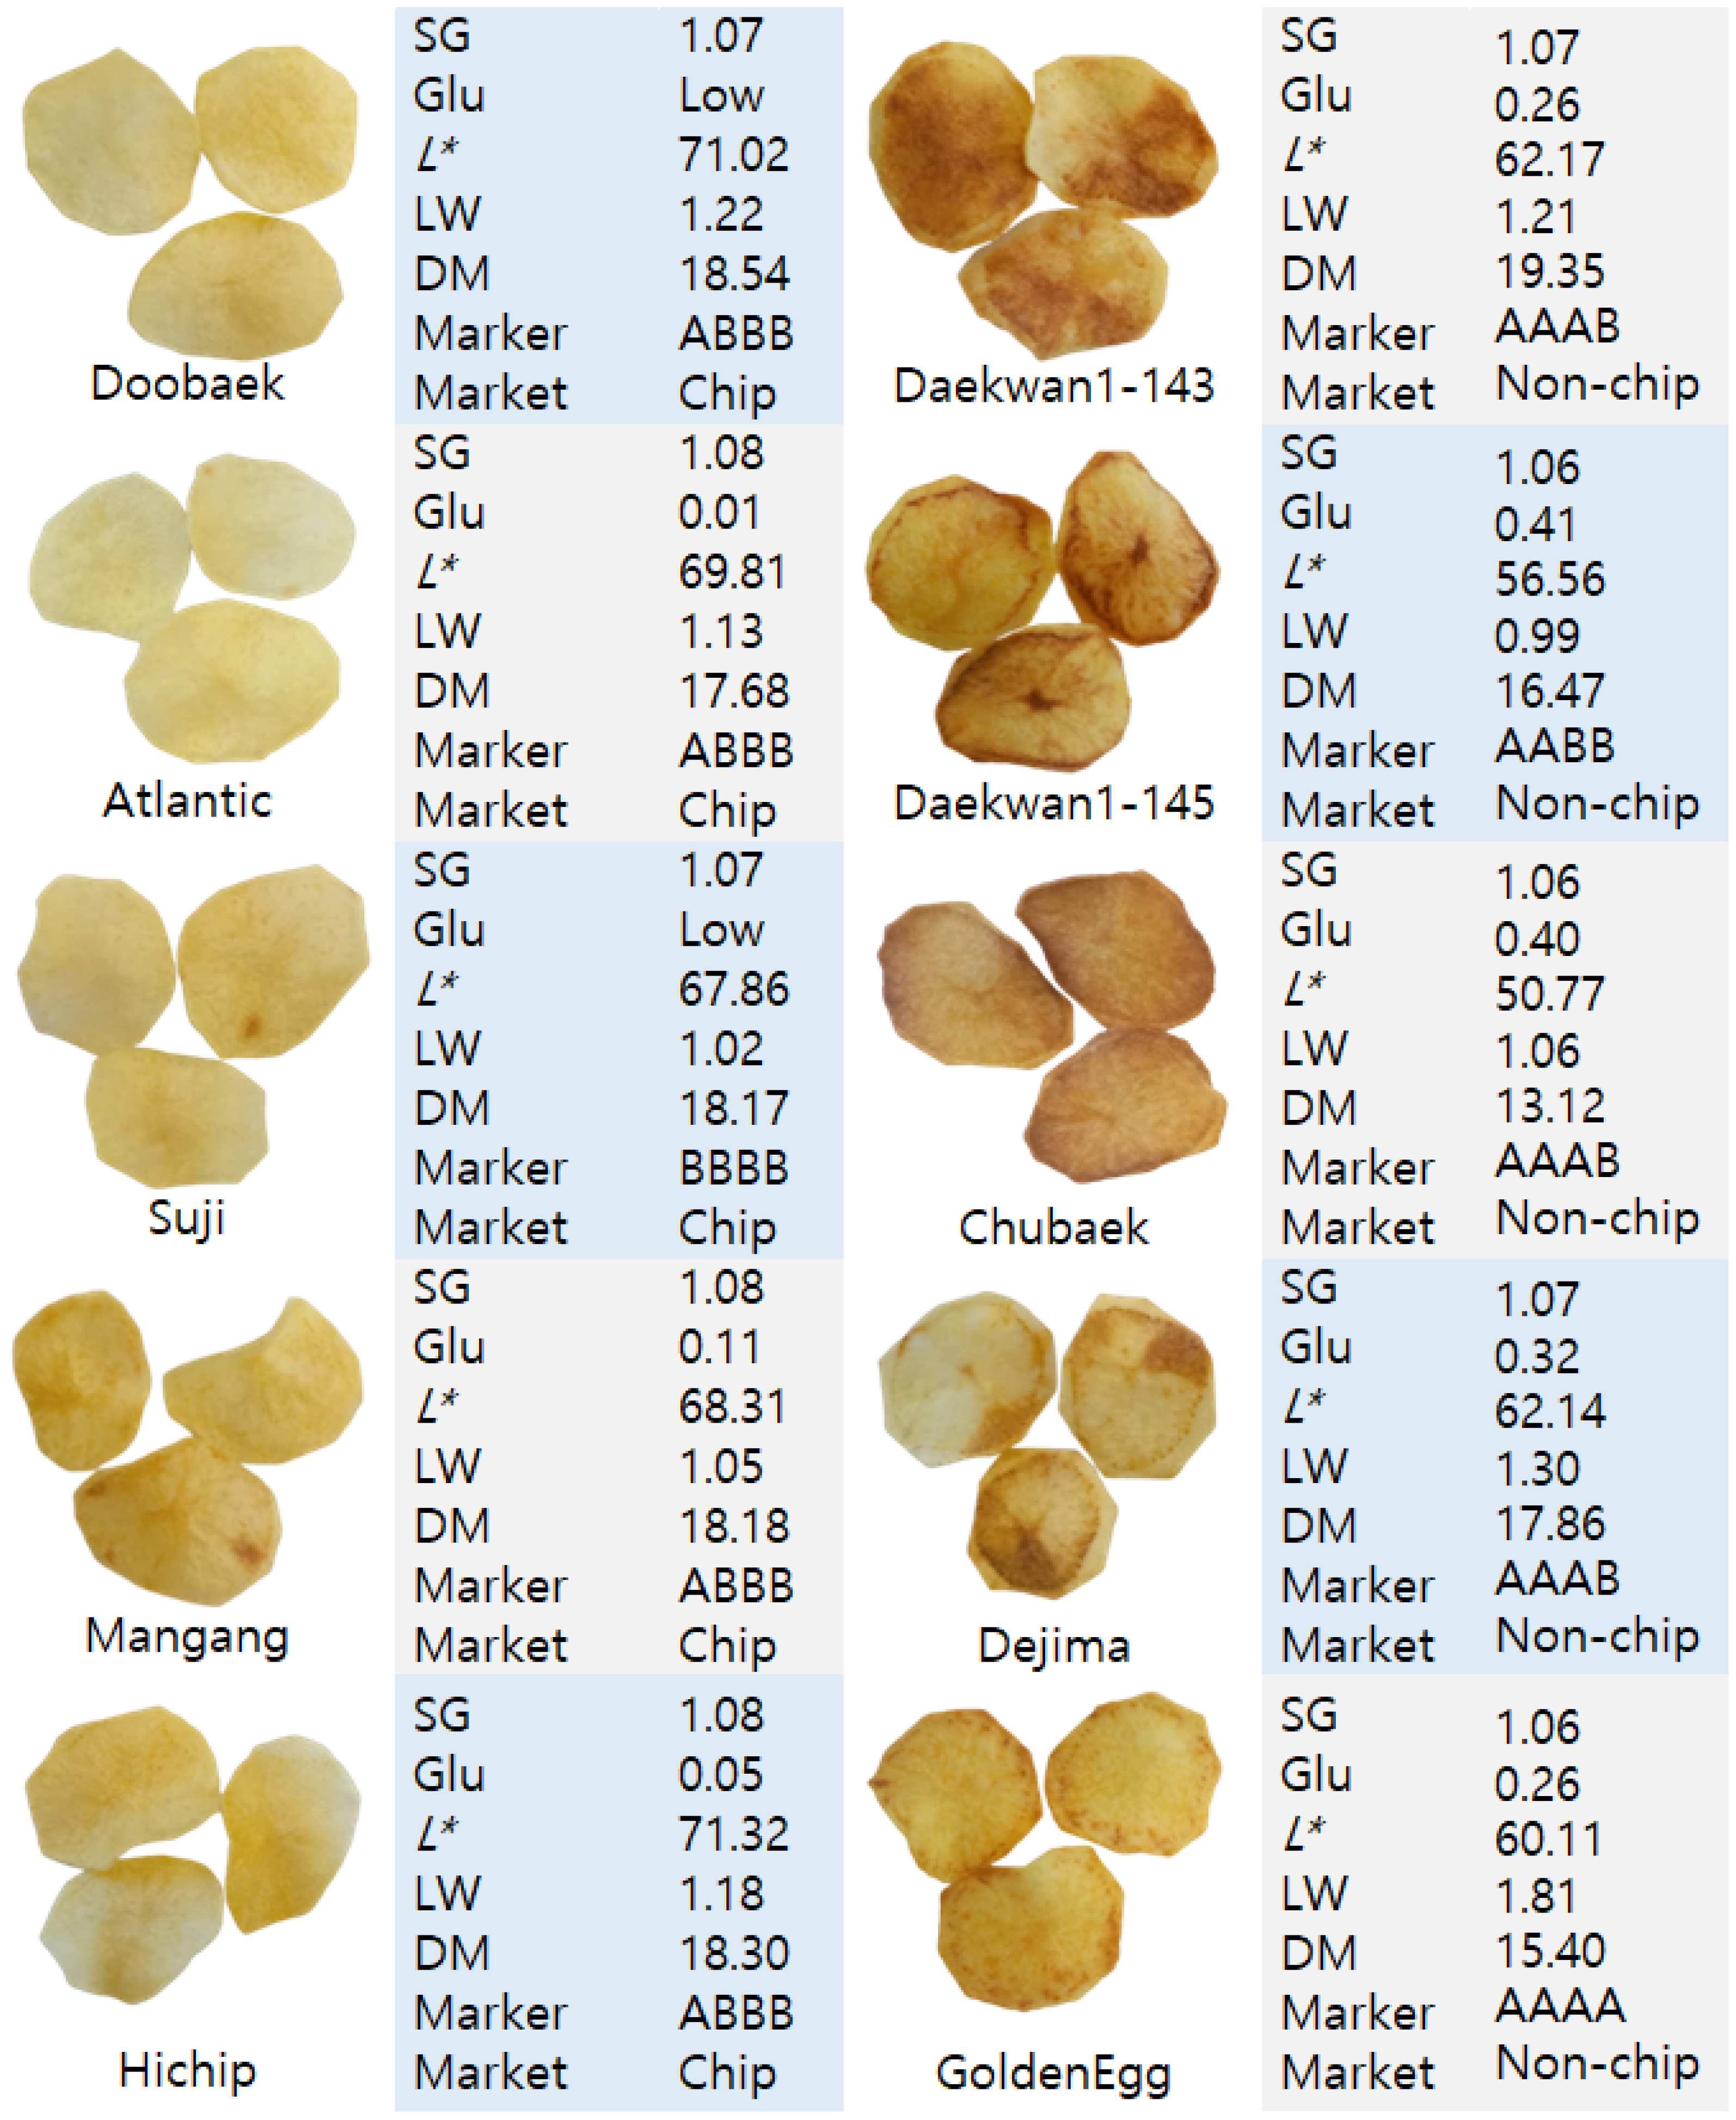
3.4. Kompetitive Allele-Specific PCR (KASP) Assays and Association with Phenotype Data

Based on the causal SNPs positioned on exon 4 of the HSI2-like gene, we developed and validated the KASP assays for the association of the HSI2-like gene with chip processing in a set of 84 diverse tetraploid potato clones coming primarily from Korean breeding programs (Supplementary Table S7). Figure 6 shows results of genotyping of the HSI2-like gene harboring the two SNPs, c1_8019 (a) and c1_8020 (b) using the KASP assay, and also groupings of 84 potato clones. The five dosage genotype calls on KASP assays in the 84-line set were consistent with those on the 8K SNP array, enabling us to apply previous genotyping data obtained with the SNP array for the remaining potatoes belonging to the 190-line panel. In terms of clear separations between the genotype groups, KASP_c1_8020 markers seemed better than KASP_c1_8019 because of the possibility of no spurious genotype calling. Although genotyping for the KASP_c1_8019 is called in reverse on that for the KASP_c1_8020, much more chip-processing clones were included in the BBBB and ABBB groups for the former and otherwise in the AAAA and AAAB groups for the latter (Figure 3). These two groups also correspond to the round tuber shape categories, low tuber glucose concentration and light chip color (Figure 7), indicating that the marker KASP_c1_8019 could be used to select chip-processing clones.

4. Discussion

While a chip-processing market for potatoes has been defined in previous studies [2,3,4], the genetic association with it had not been explored. The historical data of the dichotomous phenotype (chip processing vs. non-chip processing) are valuable as much as quantitative trait data because the market class designations for chip processing, as a multifactorial trait, were available from multi-year, multi-location data from breeding programs described in [2,3,4]. It is for the first time that this work uncovered the genetic variants associated with the chip-processing phenotype using genome-wide association study and selective sweep approaches. Previous studies involving chip-processing properties in potato ([16,17,19,20,21,23,25,26]) have researched chip-processing clones only for the respective component traits of the chip-processing phenotype. Although [17] reported rough detections of association with chip color and starch content on chromosome 10 for GWAS using genotyping by sequencing (GBS) data which were not well suited for the discovery of exact genetic variants of genes underpinning observed functional biological difference, it is interesting that the significant SNPs were mainly found on chromosome 10 for both traits. It seems to support the chip-processing phenotype definition and become suggestive evidence for the genetic architecture of the chip-processing trait on chromosome 10. In fact, the chip-processing phenotype is determined primarily by considering properties such as chip color, tuber shape, specific gravity or starch content. Through breeding efforts over sixty years, a set of chip-processing potato varieties/clones designated as the chip-processing market class [2,3,4] have been created to make great contributions to the potato chip production industry.
Our results were replicated using internal replication that shared individual clones with the discovery cohort but was ancestrally matched [55]. This phenotype revealed that using a smaller number of screened controls by population strata-correction (e.g., 95 control clones matching with 95 cases, N = 190) also can detect associations with a similar extent of significance as using a larger number of unscreened controls (95 control clones and 298 controls, N = 393). Our result highlights the need for thoughtful approaches around case and control selection and shows that a well-powered genetic study of chip processing may not require a large number of unscreened controls, as described in [56]. Due to a lack of independent cohort resources for external replication in potato we chose selective sweep approaches, as a corroborative approach ([31,57]), that footprints known as selection signatures or selective sweeps left by the intensive selection events for the chip-processing phenotype can be elucidated. Indeed, when analyzed for two populations showing clear differentiation (90 chip processing vs. 137 non-chip processing) in principal component analysis (Supplementary Figure S5e), XP-CLR and PCAdapt detected significant SNPs under selection on chromosome 10 which are the same as in GWAS tests. In terms of discovery of the significant signals in selective sweeps, it should be noted that it might be important to include no overlapping clones for the two populations and/or genetically diverse clones such as landraces in the non-chip-processing group as much as possible (Supplementary Figure S5e), most likely resulting in an increased detection power. In this study, we tested four different selective sweep detection methods for genetic characterization of chip processing, among which XP-CLR and PCAdapt detected more significant selection signatures compared with iHS and XP-EHH, with the former reflecting usefulness to detect genomic regions under selection, in particular, as a result of intensive selection in breeding processes as described in ([31,38]).
Further analysis of the detected loci or genes in tuber tissues of two tetraploid cultivars with different chip-processing properties, accounted for a high abundance of transcripts of interest as well as differential expressions between two cultivars for candidate genes including the lead SNP-containing gene HSI2-like. Soltu.DM.10G018620 (HSI2-like) belongs to the plant-specific B3 domain-type transcription inhibitors [53]. The B3 transcription factor superfamily can be classified by five subfamilies: auxin response factor (ARF), abscisic acid-insensitive 3 (ABI3), high level expression of sugar inducible (HIS), related to ABI3/VP1 (Rav), and reproductive meristem (REM), and play important roles in various growth and development processes in plants ([53,58,59]). Interestingly, it was reported that RNA sequencing data revealed Soltu.DM.10G018620 (HSI2-like) as one of five differentially expressed genes regarding the significant differences between round tuber and long tuber [60]. It suggests that the potato HSI2-like gene could be a master regulator in terms of expression of chip-processing-related traits.
Together, combining GWAS with selective sweep approaches plus transcriptome analysis for SolCAP SNP array data made the genetic variants pinpointing on chromosome 10 which may play a key role in forming chip-processing phenotype. In addition, identification of loci/genes under selection regarding carbohydrate metabolism may help provide informative clues to understand molecular mechanisms involving sugars/starch metabolism influencing traits of interest.
Moreover, the development and validation of KASP assays for the genotyping of chip-processing-associated SNPs could be helpful for breeders to select chip-processing clones efficiently in early generations and on a cost-effective manner, although we should test the associated KASP markers in segregating populations. We also developed KASP markers from the candidate genes under selection (data not shown). The combined use of these markers and KASP_c1_8019 could facilitate precision breeding for the improved chip-processing cultivars. Although the follow-up studies will be required to uncover molecular identities of the identified loci/genes using functional tools such as Clustered Regularly Interspaced Short Palindromic Repeats (CRISPR) or isoform-level transcriptome-wide analysis, our results could have implications for genomics-assisted breeding of the promising chip-processing cultivars in potato.

5. Conclusions

With the historical data of potato chip-processing market designations over sixty years, chip-processing clones were characterized using both the case-control genome-wide association study and selective sweep approaches, pinpointing the associated genetic variants on chromosome 10, as well as finding carbohydrate-related genetic variants under selection across the genome. KASP assays for the genotyping of chip-processing-associated SNPs may contribute to implementing marker-assisted breeding for the improved chip-processing performance in potatoes.

Supplementary Materials

The following supporting information can be downloaded at: https://www.mdpi.com/article/10.3390/agronomy13030642/s1, Figure S1: Genome-wide linkage disequilibrium (LD) decay (in Mb) in 393 potato clones using LD. plot function in GWASpoly. Figure S2: Miami plot of the K corrected-GWAS of chip processing for the 393-line panel (a). Figure S3: The Q + K corrected-GWAS of chip processing for the 332-line panel in which all russet clones including French fry clones were excluded. Figure S4: Scatterplot of the first two principal components (PC) for the 393-line panel used in GWAS analysis, which indicates stratification. In this panel only clones with defined phenotype for market class were considered. Figure S5: Analysis of selective sweeps for a total of 227 potato clones consisting of 90 chip processing versus 137 non-chip processing. Table S1: The binary data of chip-processing phenotype used in GWAS and subpopulation group membership (QDAPC) as a covariate by DAPC approach structure were provided for the 393-line genetic diversity panel. Table S2: The binary data of chip-processing phenotype used in GWAS were provided for the 332-line genetic diversity panel. Table S3: The binary data of chip-processing phenotype used in GWAS were provided for the 190-line genetic diversity panel. Table S4: A 227-line panel used in selective sweep analysis. Table S5: The outputs for GWAS which included the naïve GWAS, K-corrected/QK-corrected GWAS for 393-line panel, QK-corrected GWAS for russet/French fry line-excluded panel, and strata-corrected GWAS for 190-line panel created by PCAmatchR. Table S6: The outputs for the used genomic scans including XP-CLR, PCAdapt, iHS, and XP-EHH. Summary results for the five genomic scans including GWAS are also included. Table S7: Results of genotyping of c1_8019 and c1_8020 for KASP assays.

Author Contributions

K.R.J. designed research, carried out bioinformatics analysis, and wrote the manuscript. D.-H.K. and Y.-E.P. managed the Korean potato germplasm and prepared the sample. J.-G.C., Y.-E.P. and S.-J.K. performed experiments for determining the chip-processing phenotype for Korean potato clones. All authors have read and agreed to the published version of the manuscript.

Funding

Research described in this paper was funded by the Rural Development Administration (RDA), Republic of Korea, through Crop Science Research Program of NICS (Project No. PJ016751032022).

Data Availability Statement

All data are available in the Supplementary Material.

Conflicts of Interest

The authors declare no conflict of interest.

References

  1. Riaz, M.N. Snack Foods: Processing. In Encyclopedia of Food Grains, 2nd ed.; Wrigley, C., Corke, H., Seetharaman, K., Faubion, J., Eds.; Academic Press: Cambridge, MA, USA, 2016; Volume 3, pp. 414–422. ISBN 9780123947864. [Google Scholar] [CrossRef]
  2. Hirsch, C.N.; Hirsch, C.D.; Felcher, K.; Coombs, J.; Zarka, D.; Van Deynze, A.; De Jong, W.; Veilleux, R.E.; Jansky, S.; Bethke, P.; et al. Retrospective view of North American potato (Solanum tuberosum L.) breeding in the 20th and 21st centuries. G3 2013, 3, 1003–1013. [Google Scholar] [CrossRef] [Green Version]
  3. Igarashi, T.; Tsuyama, M.; Ogawa, K.; Koizumi, E.; Sanetomo, R.; Hosaka, K. Evaluation of Japanese potatoes using single nucleotide polymorphisms (SNPs). Mol. Breed. 2019, 39, 9. [Google Scholar] [CrossRef]
  4. Jo, K.R.; Cho, S.; Cho, J.H.; Park, H.J.; Choi, J.G.; Park, Y.E.; Cho, K.S. Analysis of genetic diversity and population structure among cultivated potato clones from Korea and global breeding programs. Sci. Rep. 2022, 12, 10462. [Google Scholar] [CrossRef] [PubMed]
  5. Bonierbale, M.W.; Amoros, W.R.; Salas, E.; de Jong, W. Potato Breeding. In The Potato Crop: Its Agricultural, Nutritional and Social Contribution to Humankind; Campos, H., Ortiz, O., Eds.; Springer: Dordrecht, Germany, 2020. [Google Scholar] [CrossRef] [Green Version]
  6. Jansky, S.H.; Fajardo, D.A. Tuber starch amylose content is associated with cold-induced sweetening in potato. Food Sci. Nutr. 2014, 2, 628–633. [Google Scholar] [CrossRef] [PubMed] [Green Version]
  7. Bonnel, E. Potato Breeding: A Challenge, as ever! Potato Res. 2008, 51, 327–332. [Google Scholar] [CrossRef]
  8. D’Hoop, B.B.; Keizer, P.L.C.; Paulo, M.J.; Visser, R.G.F.; van Eeuwijk, F.A.; van Eck, H.J. Identification of agronomically important QTL in tetraploid potato cultivars using a marker–trait association analysis. Theor. Appl. Genet. 2014, 127, 731–748. [Google Scholar] [CrossRef] [PubMed]
  9. Naeem, M.; Demirel, U.; Yousaf, M.F.; Caliskan, S.; Caliskan, M.E. Overview on domestication, breeding, genetic gain and improvement of tuber quality traits of potato using fast forwarding technique (GWAS): A review. Plant Breed. 2021, 140, 519–542. [Google Scholar] [CrossRef]
  10. Felcher, K.J.; Coombs, J.J.; Massa, A.N.; Hansey, C.N.; Hamilton, J.P.; Veilleux, R.E.; Bueel, C.R.; Douches, D.S. Integration of two diploid potato linkage maps with the potato genome sequence. PLoS ONE 2012, 7, e36347. [Google Scholar] [CrossRef] [PubMed] [Green Version]
  11. Vos, P.G.; Uitdewilligen, J.G.; Voorrips, R.E.; Visser, R.G.; van Eck, H.J. Development and analysis of a 20K SNP array for potato (Solanum tuberosum): An insight into the breeding history. Theor. Appl. Genet. 2015, 128, 2387–2401. [Google Scholar] [CrossRef] [PubMed] [Green Version]
  12. Voorrips, R.E.; Gort, G.; Vosman, B. Genotype calling in tetraploid species from bi-allelic marker data using mixture models. BMC Bioinform. 2011, 12, 172. [Google Scholar] [CrossRef] [Green Version]
  13. Carley, C.A.S.; Coombs, J.J.; Douches, D.S.; Bethke, P.C.; Palta, J.P.; Novy, R.G.; Endelman, J.B. Automated tetraploid genotype calling by hierarchical clustering. Theor. Appl. Genet. 2017, 130, 717–726. [Google Scholar] [CrossRef]
  14. Rosyara, U.R.; De Jong, W.S.; Douches, D.S.; Endelman, J.B. Software for genome-wide association studies in autopolyploids and its application to potato. Plant Genome 2016, 9, 1–10. [Google Scholar] [CrossRef] [PubMed] [Green Version]
  15. Endelman, J.B.; Carley, C.A.S.; Bethke, P.C.; Coombs, J.J.; Clough, M.E.; da Silva, W.L.; De Jong, W.S.; Douches, D.S.; Frederick, C.M.; Haynes, K.G.; et al. Genetic Variance Partitioning and Genome-Wide Prediction with Allele Dosage Information in Autotetraploid Potato. Genetics 2018, 209, 77–87. [Google Scholar] [CrossRef] [Green Version]
  16. Byrne, S.; Meade, F.; Mesiti, F.; Griffin, D.; Kennedy, C.; Milbourne, D. Genome-Wide Association and Genomic Prediction for Fry Color in Potato. Agronomy 2020, 10, 90. [Google Scholar] [CrossRef] [Green Version]
  17. Sverrisdóttir, E.; Byrne, S.; Sundmark, E.H.R.; Johnsen, H.; Kirk, H.G.; Asp, T.; Janss, L.; Nielsen, K.L. Genomic prediction of starch content and chipping quality in tetraploid potato using genotyping-by-sequencing. Theor. Appl. Genet. 2017, 130, 2091–2108. [Google Scholar] [CrossRef] [PubMed] [Green Version]
  18. Rak, K.; Bethke, P.C.; Palta, J.P. QTL mapping of potato chip color and tuber traits within an autotetraploid family. Mol. Breed. 2017, 37, 15. [Google Scholar] [CrossRef]
  19. Park, J.; Massa, A.N.; Douches, D.; Coombs, J.; Akdemir, D.; Yencho, G.C.; Whitworth, J.L.; Novy, R.G. Linkage and QTL mapping for tuber shape and specific gravity in a tetraploid mapping population of potato representing the russet market class. BMC Plant Biol. 2021, 21, 507. [Google Scholar] [CrossRef]
  20. Van Eck, H.J.; Jacobs, J.M.; Stam, P.; Ton, J.; Stiekema, W.J.; Jacobsen, E. Multiple alleles for tuber shape in diploid potato detected by qualitative and quantitative genetic analysis using RFLPs. Genetics 1994, 137, 303–309. [Google Scholar] [CrossRef]
  21. Śliwka, J.; Wasilewicz-Flis, I.; Jakuczun, H.; Gebhardt, C. Tagging quantitative trait loci for dormancy, tuber shape, regularity of tuber shape, eye depth and flesh colour in diploid potato originated from six Solanum species. Plant Breed. 2008, 127, 49–55. [Google Scholar] [CrossRef] [Green Version]
  22. Li, X.Q.; De Jong, H.; De Jong, D.M.; De Jong, W.S. Inheritance and genetic mapping of tuber eye depth in cultivated diploid potatoes. Theor. Appl. Genet. 2005, 110, 1068–1073. [Google Scholar] [CrossRef]
  23. Prashar, A.; Hornyik, C.; Young, V.; McLean, K.; Sharma, S.K.; Dale, M.F.B.; Bryan, G.J. Construction of a dense SNP map of a highly heterozygous diploid potato population and QTL analysis of tuber shape and eye depth. Theor. Appl. Genet. 2014, 127, 2159–2171. [Google Scholar] [CrossRef]
  24. Pandey, J.; Scheuring, D.C.; Koym, J.W.; Coombs, J.; Novy, R.G.; Thompson, A.L.; Holm, D.G.; Douches, D.S.; Miller, J.C.; Vales, M.I. Genetic diversity and population structure of advanced clones selected over forty years by a potato breeding program in the USA. Sci. Rep. 2021, 11, 8344. [Google Scholar] [CrossRef]
  25. Li, L.; Paulo, M.-J.; Strahwald, J.; Lübeck, J.; Hofferbert, H.-R.; Tacke, E.; Junghans, H.; Wunder, J.; Draffehn, A.; van Eeuwijk, F.; et al. Natural DNA variation at candidate loci is associated with potato chip color, tuber starch content, yield and starch yield. Theor Appl Genet. 2008, 116, 1167–1181. [Google Scholar] [CrossRef] [Green Version]
  26. Schönhals, E.M.; Ortega, F.; Barandalla, L.; Aragones, A.; de Galarreta, J.I.R.; Liao, J.C.; Sanetomo, R.; Walkemeier, B.; Tacke, E.; Ritter, E.; et al. Identification and reproducibility of diagnostic DNA markers for tuber starch and yield optimization in a novel association mapping population of potato (Solanum tuberosum L). Theor. Appl. Genet. 2016, 129, 767–785. [Google Scholar] [CrossRef] [PubMed] [Green Version]
  27. Bertolini, F.; Servin, B.; Talenti, A.; Rochat, E.; Kim, E.S.; Oget, C.; Palhière, I.; Crisà, A.; Catillo, G.; Steri, R.; et al. Signatures of selection and environmental adaptation across the goat genome post-domestication. Genet. Sel. Evol. 2018, 50, 57. [Google Scholar] [CrossRef]
  28. Qanbari, S.; Simianer, H. Mapping signatures of positive selection in the genome of livestock. Livest. Sci. 2014, 166, 133–143. [Google Scholar] [CrossRef]
  29. López, M.E.; Cádiz, M.I.; Rondeau, E.B.; Koop, B.F.; Yáñez, J.M. Detection of selection signatures in farmed coho salmon (Oncorhynchus kisutch) using dense genome-wide information. Sci. Rep. 2021, 11, 9685. [Google Scholar] [CrossRef]
  30. Oleksyk, T.K.; Smith, M.W.; O’brien, S.J. Genome-wide scans for footprints of natural selection. Philos. Trans. R. Soc. B 2010, 365, 185–205. [Google Scholar] [CrossRef] [Green Version]
  31. Xie, W.B.; Wang, G.W.; Yuan, M.; Yao, W.; Lv, K.; Zhao, H.; Yang, M. Breeding signatures of rice improvement revealed by a genomic variation map from a large germplasm collection. Proc. Natl. Acad. Sci. USA 2015, 112, 5411–5419. [Google Scholar] [CrossRef] [PubMed] [Green Version]
  32. Dadshani, S.; Mathew, B.; Ballvora, A.; Mason, A.S.; Léon, J. Detection of breeding signatures in wheat using a linkage disequilibrium-corrected mapping approach. Sci. Rep. 2021, 11, 5527. [Google Scholar] [CrossRef] [PubMed]
  33. Saleem, A.; Muylle, H.; Aper, J.; Ruttink, T.; Wang, J.; Yu, D.; Roldán-Ruiz, I. A Genome-Wide Genetic Diversity Scan Reveals Multiple Signatures of Selection in a European Soybean Collection Compared to Chinese Collections of Wild and Cultivated Soybean Accessions. Front. Plant Sci. 2021, 12, 631767. [Google Scholar] [CrossRef] [PubMed]
  34. Bekele, W.A.; Wight, C.P.; Chao, S.; Howarth, C.J.; Tinker, N.A. Haplotype-based genotyping-by-sequencing in oat genome research. Plant Biotechnol. J. 2018, 16, 1452–1463. [Google Scholar] [CrossRef] [PubMed] [Green Version]
  35. McLean-Rodríguez, F.D.; Costich, D.E.; Camacho-Villa, T.C.; Pè, M.E.; Dell’Acqua, M. Genetic diversity and selection signatures in maize landraces compared across 50 years of in situ and ex situ conservation. Heredity 2021, 126, 913–928. [Google Scholar] [CrossRef] [PubMed]
  36. Bauchet, G.; Munos, S.; Sauvage, C.; Bonnet, J.; Grivet, L.; Causse, M. Genes involved in floral meristem in tomato exhibit drastically reduced genetic diversity and signature of selection. BMC Plant Biol. 2014, 14, 279. [Google Scholar] [CrossRef] [PubMed] [Green Version]
  37. Franks, S.J.; Kane, N.C.; O’Hara, N.B.; Tittes, S.; Rest, J.S. Rapid genome-wide evolution in Brassica rapa populations following drought revealed by sequencing of ancestral and descendant gene pools. Mol. Ecol. 2016, 25, 3622–3631. [Google Scholar] [CrossRef]
  38. Chen, H.; Patterson, N.; Reich, D. Population differentiation as a test for selective sweeps. Genome Res. 2010, 20, 393–402. [Google Scholar] [CrossRef] [PubMed] [Green Version]
  39. Sabeti, P.C.; Varilly, P.; Fry, B.; Lohmueller, J.; Hostetter, E.; Cotsapas, C.; Xie, X.; Byrne, E.H.; McCarroll, S.A.; Gaudet, R. Genome-wide detection and characterization of positive selection in human populations. Nature 2007, 449, 913–918. [Google Scholar] [CrossRef] [Green Version]
  40. Tang, K.; Thornton, K.R.; Stoneking, M. A new approach for using genome scans to detect recent positive selection in the human genome. PLoS Biol. 2007, 5, e171. [Google Scholar] [CrossRef]
  41. Luu, K.; Bazin, E.; Blum, M.G. pcadapt: An R package to perform genome scans for selection based on principal component analysis. Mol. Ecol. Resour. 2017, 17, 67–77. [Google Scholar] [CrossRef]
  42. Pandey, J.; Scheuring, D.C.; Koym, J.W.; Vales, M.I. Genomic regions associated with tuber traits in tetraploid potatoes and identification of superior clones for breeding purposes. Front. Plant Sci. 2022, 13, 952263. [Google Scholar] [CrossRef]
  43. Ohara-Takada, A.; Matsuura-Endo, C.; Chuda, Y.; Ono, H.; Yada, H.; Yoshida, M.; Kobayashi, A.; Tsuda, S.; Takigawa, S.; Noda, T.; et al. Change in content of sugars and free amino acids in potato tubers under short-term storage at low temperature and the effect on acrylamide level after frying. Biosci. Biotechnol. Biochem. 2005, 69, 1232–1238. [Google Scholar] [CrossRef] [Green Version]
  44. Brahmakshatriya, R.D.; Donker, J.D. Five Methods for Determination of Silage Dry Matter1. J. Dairy Sci. 1971, 54, 1470–1474. [Google Scholar] [CrossRef]
  45. Alvarado, G.; Rodríguez, F.M.; Pacheco, A.; Burgueño, J.; Crossa, J.; Vargas, M.; Pérez-Rodríguez, P.; Lopez-Cruz, M.A. META-R: A software to analyze data from multi-environment plant breeding trials. Crop J. 2020, 8, 745–756. [Google Scholar] [CrossRef]
  46. Jombart, T. adegenet: A R package for the multivariate analysis of genetic markers. Bioinformatics 2008, 24, 1403–1405. [Google Scholar] [CrossRef] [PubMed] [Green Version]
  47. Brown, D.W.; Myers, T.A.; Machiela, M.J. PCAmatchR: A flexible R package for optimal case–control matching using weighted principal components. Bioinformatics 2021, 37, 1178–1181. [Google Scholar] [CrossRef]
  48. da Silva Pereira, G.; Mollinari, M.; Schumann, M.J.; Clough, M.E.; Zeng, Z.-B.; Yencho, G.C. The recombination landscape and multiple QTL mapping in a Solanum tuberosum cv. ‘Atlantic’-derived F1 population. Heredity 2021, 126, 817–830. [Google Scholar] [CrossRef]
  49. Delaneau, O.; Howie, B.; Cox, A.J.; Zagury, J.; Marchini, J. Haplotype Estimation Using Sequencing Reads. Am. J. Hum. Genet. 2013, 93, 687–696. [Google Scholar] [CrossRef] [Green Version]
  50. Gautier, M.; Vitalis, R. rehh: An R package to detect footprints of selection in genome-wide SNP data from haplotype structure. Bioinformatics 2012, 28, 1176–1177. [Google Scholar] [CrossRef] [Green Version]
  51. Sharma, S.K.; MacKenzie, K.; McLean, K.; Dale, F.; Daniels, S.; Bryan, G.J. Linkage Disequilibrium and Evaluation of Genome-Wide Association Mapping Models in Tetraploid Potato. G3 Genes Genomes Genet. 2018, 8, 3185–3202. [Google Scholar] [CrossRef] [Green Version]
  52. Li, J.; Ji, L. Adjusting multiple testing in multilocus analyses using the eigenvalues of a correlation matrix. Heredity 2005, 95, 221–227. [Google Scholar] [CrossRef] [Green Version]
  53. Tsukagoshi, H.; Morikami, A.; Nakamura, K. Two B3 domain transcriptional repressors prevent sugar-inducible expression of seed maturation genes in Arabidopsis seedlings. Proc. Natl. Acad. Sci. USA 2007, 104, 2543–2547. [Google Scholar] [CrossRef] [PubMed] [Green Version]
  54. Pham, G.M.; Newton, L.; Wiegert-Rininger, K.; Vaillancourt, B.; Douches, D.S.; Buell, C.R. Extensive genome heterogeneity leads to preferential allele expression and copy number-dependent expression in cultivated potato. Plant J. 2017, 92, 624–637. [Google Scholar] [CrossRef] [PubMed] [Green Version]
  55. Uffelmann, E.; Huang, Q.Q.; Munung, N.S.; de Vries, J.; Okada, Y.; Martin, A.R.; Martin, H.C.; Lappalainen, T.; Posthuma, D. Genome-wide association studies. Nat. Rev. Method. Prim. 2021, 1, 59. [Google Scholar] [CrossRef]
  56. Roberts, G.H.L.; Partha, R.; Rhead, B.; Knight, S.C.; Park, D.S.; Coignet, M.V.; Zhang, M.; Berkowitz, N.; Turrisini, D.A.; Gaddis, M.; et al. Expanded COVID-19 phenotype definitions reveal distinct patterns of genetic association and protective effects. Nat. Genet. 2022, 54, 374–381. [Google Scholar] [CrossRef] [PubMed]
  57. Zhang, K.; He, M.; Fan, Y.; Zhao, H.; Gao, B.; Yang, K.; Li, F.; Tang, Y.; Gao, Q.; Lin, T.; et al. Resequencing of global Tartary buckwheat accessions reveals multiple domestication events and key loci associated with agronomic traits. Genome Biol. 2021, 22, 23. [Google Scholar] [CrossRef] [PubMed]
  58. Chen, N.; Veerappan, V.; Abdelmageed, H.; Kang, M.; Allen, R.D. HSI2/VAL1 Silences AGL15 to Regulate the Developmental Transition from Seed Maturation to Vegetative Growth in Arabidopsis. Plant Cell 2018, 30, 600–619. [Google Scholar] [CrossRef] [Green Version]
  59. Jing, Y.; Guo, Q.; Lin, R. The B3-Domain Transcription Factor VAL1 Regulates the Floral Transition by Repressing FLOWERING LOCUS T. Plant Physiol. 2019, 181, 236–248. [Google Scholar] [CrossRef] [PubMed] [Green Version]
  60. Fan, G.; Wang, Q.; Xu, J.; Chen, N.; Zhu, W.; Duan, S.; Yang, X.; De Jong, W.S.; Guo, Y.; Jin, L.; et al. Fine Mapping and Candidate Gene Prediction of Tuber Shape Controlling Ro Locus Based on Integrating Genetic and Transcriptomic Analyses in Potato. Int. J. Mol. Sci. 2022, 23, 1470. [Google Scholar] [CrossRef]
Figure 1. The genome-wide association analysis for 95 chip-processing cases and 298 controls. The plot represents the Q + K corrected-GWAS of chip processing for the 393-line panel (a). The x-axis shows the chromosomal position, and the y-axis shows the significance of association (−log10(p)). The dotted horizontal line shows the genome-wide significance level (−log10(p) = 4.9) calculated by the Bonferroni method. In this study, we used the additive model and two simplex dominant models (1_dom_alt and 1_dom_ref). On the right is the quantile–quantile (Q–Q) plot for GWAS of additive model using 3977 SNPs for the 393-line panel (b). The area shaded in light blue indicates the 95% confidence interval under the null hypothesis.
Agronomy 13 00642 g001
Figure 2. The genome-wide association analysis for 95 chip-processing cases and 95 controls. (a) Manhattan plot for 3977 SNPs, with significant SNPs highlighted in red, which was obtained using the built-in K correction function of GWASpoly R package. The x-axis shows the chromosomal position, and the y-axis shows the significance of association (−log10(p)). The horizontal line shows the genome-wide significance level (−log10(p) = 4.9). In this study, we used the additive marker model and two simplex dominant marker models (1_dom_alt and 1_dom_ref). (b) Scatterplot of the first two principal components (PC) for 190 individuals derived by PCAmatchR. (c) Regional association plot, with SNPs annotated and highlighted in red, on chromosome 10. (d) Quantile-quantile plot for GWAS of additive model using 3977 SNPs. The area shaded in light blue indicates the 95% confidence interval under the null hypothesis.
Agronomy 13 00642 g002
Figure 3. Correlation between the c1_8019 and chip processing. The percentage of chip processing in different genotype of SNP c1_8019. Significant differences among different genotypes were calculated using the z-score test for two population proportions. NS; no significance.
Agronomy 13 00642 g003
Figure 4. Circular Manhattan plots of the global distribution of association signals or selection signatures across the genome for the populations under study. The circles from outside to inside illustrate: (A) −log10(p) of GWAS using additive model for strata-corrected 190-line case-control diversity panel, (B) XP-CLR scores from a genome-wide scan for the 227-line diversity panel consisting of chip processing as the object population and non-chip-processing clones as the reference population. (C) −log10(p) of PCAdapt for the 227-line diversity panel, (D) −log10(p) of XP-EHH for two populations of the 227-line diversity panel, and (E) −log10(p) of iHS for chip-processing population. Values for GWAS_additive test and XP-CLR test surpassing the threshold ≥5 are highlighted in purple. Values for each test between 5 ≥ the threshold ≥3.7 (the threshold 3.7 was set based on the Benjamini–Hochberg procedure (method = “BH”) using 1% as false discovery rate (FDR) threshold for PCAdapt) are highlighted in green. The Circular Manhattan plot was created using the R package CMplot (https://github.com/YinLiLin/CMplot (accessed on 12 June 2022)). Each SNP is plotted according to its chromosomal location (x axis) and its −log10(p) values or XP-CLR score (y axis) from the five genomic scan approaches. On the left side is shown regional association plot for the HSI2-like locus containing the lead SNP c1_8019 on chromosome 10 for the three approaches (GWAS_additive, XP-CLR and PCAdapt) from a rectangular part of the Circular Manhattan plots. The lead SNP c1_8019-containing the gene models (two isoforms, Soltu.DM.10G018620.1 and Soltu.DM.10G018620.2) and the other locus (Soltu.DM.10G018640.1) just next to it are shown on the left bottom.
Agronomy 13 00642 g004
Figure 5. Transcriptome analysis of the candidate genes under selection by more than two approaches among GWAS, XP-CLR, PCAdapt, iHS and XP-EHH. The heatmap shows candidate genes with differential expression of >3.0-fold for the Transcripts Per Kilobase Million (TPM) values between two cultivars. A_leaf; leaf tissue of cv. Atlantic, S_leaf; leaf tissue of cv. Superior, A_tuber; tuber tissue of cv. Atlantic, S_tuber; tuber tissue of cv. Superior.
Agronomy 13 00642 g005
Figure 6. Results of genotyping of the HSI2-like gene harboring the two SNPs, c1_8019 (a) and c1_8020 (b) using the Kompetitive Allele Specific PCR (KASP) assay, as well as groupings of a panel of 84 potato clones. Scatter plots show clustering of potato clones on the X- (FAM) and Y- (HEX) axes. The black dots in the plots represent the NTC (non-template control). In terms of clear separations between the genotype groups, KASP_c1_8020 markers seemed better than KASP_c1_8019 because of the possibility of no spurious genotype calling. Please note that genotyping for the KASP_c1_8019 is called in reverse compared to that for the KASP_c1_8020.
Agronomy 13 00642 g006
Figure 7. The genotype of KASP_c1_8019 is correlated with the chip-processing market. Figure shows measurements of the respective component traits consisting of the chip-processing phenotype along with their representative chip images for the selected potato cultivars. On the left are given chip-processing cultivars, whereas the non-chip-processing cultivars are on the right. SG; specific gravity, Glu; tuber glucose concentration (grams 100 g−1 fresh weight), L*; the lightness measurement of the potato chips, LW; the ratio of tuber length to width, DM; dry matter content, Marker; KASP_c1_8019, Low; out of detection limit, Market; chip processing or non-chip processing. Traits were measured 20 days after harvest from a randomized, complete block design with two replicates in two local environments.
Agronomy 13 00642 g007
Table 1. Summary of top significant SNPs associated with chip processing.
MarkerChrPosition (bp)ModelMAFInfomativeness (%) a−log10(p)
c1_80191048863165additive0.3973.07.06
c2_254711048808404additive0.3671.26.00
c2_254851048737840additive0.4172.05.80
c2_277951050458044additive0.3869.55.76
c1_115351049553136additive0.3167.95.63
c2_389171049584775additive0.3369.55.44
c1_80211048862950additive0.3270.05.13
MAF; minor allele frequency, a Jo et al., (2022) [4].
Table 2. Summary of genetic variants detected by more than two approaches among the applied five approaches including GWAS, XP-CLR, PCAdapt, iHS, and XP-EHH.
SNPCandidate GeneSelective Sweep RegionChrStatisticPutative Function
abcde
c2_52484Soltu.DM.01G029570-1 6.644.47 Translation initiation factor 3B1
c2_37836No Hits-1 3.903.55 -
c2_52656Soltu.DM.02G009060-2 3.673.08 Alpha/beta-Hydrolases
Soltu.DM.02G009030chr02:23845672..23949866 (104.2 Kb)2 UDP-Glycosyltransferase
Soltu.DM.02G009040chr02:23845672..23949866 (104.3 Kb)2 Transmembrane amino acid transporter
c2_21650Soltu.DM.02G009580-2 3.753.10 RNA-binding KH domain-containing protein
Soltu.DM.02G009480chr02:24366517..24474785 (108.27 Kb)2 UDP-glucose 6-dehydrogenase
c2_41975Soltu.DM.02G011550-2 4.784.64 Exostosin
c2_38935Soltu.DM.02G011840-2 4.793.90 Glutathione S-transferase
c1_13186Soltu.DM.02G016510-2 4.753.33 Pyruvate decarboxylase-2
c2_48783No Hits-2 4.023.96 -
c1_14419Soltu.DM.02G017460-2 4.544.18 VQ motif-containing protein
c1_5871Soltu.DM.02G020130-2 5.493.95 Peroxidase
Soltu.DM.02G020170.2chr02:34333640..34436373 (102.73 Kb)2 Starch synthase
c2_17793Soltu.DM.02G020670-2 4.367.42 Fibrillin
Soltu.DM.02G020660chr02:34822051..34879350 (57.3 Kb)2 Phosphofructokinase
c2_42085Soltu.DM.02G023660.1-2 5.455.80 Regulatory particle non-ATPase
Soltu.DM.02G023650chr02:37080051..37137350 (57.3 Kb)2 Glycosyl hydrolase family 38 protein
c1_8129Soltu.DM.02G024720-2 6.296.82 HOPZ-ACTIVATED RESISTANCE
Soltu.DM.02G024640chr02:37929951..37987250 (57.3 Kb)2 UDP-Glycosyltransferase
c2_7389Soltu.DM.02G025590-2 5.703.15 Allene oxide cyclase
Soltu.DM.02G025510chr02:38696301..38753600 (57.3 Kb)2 UDP-glucosyl transferase 72E1
c2_7425Soltu.DM.02G027100-2 6.2312.59 Leucine-rich receptor-like protein kinase
Soltu.DM.02G027090chr02:39894251..39951550 (57.3 Kb)2 Hexokinase-like
c2_54104Soltu.DM.02G027250-2 6.1911.17 Branched-chain amino acid aminotransferase 5 (BCAT5)
Soltu.DM.02G027190chr02:40025601..40082900 (57.3 Kb)2 Xyloglucan endotransglucosylase/hydrolase
c2_52087No Hits-2 6.1911.26 -
c2_43352Soltu.DM.02G029880.1-2 6.124.62 BEL1-like homeodomain
c2_54687Soltu.DM.03G013510-33.26 3.86 Protein kinase
Soltu.DM.03G013410chr03:35810742..35917929 (107.19 Kb)3 Alpha-amylase-like
c2_26799Soltu.DM.04G010300-43.033.17 Galacturonosyltransferase
Soltu.DM.04G010260.5chr04:10700737..10806774 (106.04 Kb)4 Galactosyltransferase
Soltu.DM.04G010350chr04:10800737..10906774 (106.04 Kb)4 UDP-glucosyl transferase 73B3
c2_8295Soltu.DM.05G024620-5 6.323.17 Nudix hydrolase homolog
c2_35056Soltu.DM.07G020260-7 6.1618.49 HAESA-like
Soltu.DM.07G020320chr07:50787767..50892909 (105.14 Kb)7 FASCICLIN-like arabinoogalactan
c2_25485Soltu.DM.10G018530-10 3.445.46Serine/threonine protein kinase
Soltu.DM.10G018520chr10:49577881..49600800 (22.92 Kb)10 Glycosyl hydrolase
c2_25471Soltu.DM.10G018580-10 5.165.57Lung seven transmembrane receptor
Soltu.DM.10G018520chr10:49555549..49663946 (108.4 Kb)10 Glycosyl hydrolase
c1_8019Soltu.DM.10G018620.1-10 3.714.546.6HSI2-like
Soltu.DM.10G018620.2-10 HSI2-like
Soltu.DM.10G018640chr10:49709841..49732760 (22.92 Kb)10 HSI2-like
c2_27795Soltu.DM.10G019800-10 7.236.05Mediator of RNA polymerase II transcription subunit
Soltu.DM.10G019820chr10:51395638..51504347 (108.71 Kb)10 UDP-Glycosyltransferase
Soltu.DM.10G019860chr10:51395638..51504347 (108.71 Kb)10 Cell wall/vacuolar inhibitor of fructosidase
c2_16302Soltu.DM.12G019560-12 3.645.62 Thioesterase/thiol ester dehydrase-isomerase
a; iHS, b; XP-EHH, c; PCAdapt, d; XP-CLR, e; GWAS.
Disclaimer/Publisher’s Note: The statements, opinions and data contained in all publications are solely those of the individual author(s) and contributor(s) and not of MDPI and/or the editor(s). MDPI and/or the editor(s) disclaim responsibility for any injury to people or property resulting from any ideas, methods, instructions or products referred to in the content.

