Article

Impact of Fusarium Head Blight on Wheat Flour Quality: Examination of Protease Activity, Technological Quality and Rheological Properties

1
Department of Biology, Josip Juraj Strossmayer University of Osijek, 31000 Osijek, Croatia
2
Croatian Agency for Agriculture and Food, Centre for Seed and Seedlings, 31000 Osijek, Croatia
3
Faculty of Food Technology Osijek, Josip Juraj Strossmayer University of Osijek, 31000 Osijek, Croatia
4
Department of Small Cereal Crops Breeding and Genetics, Agricultural Institute Osijek, 31000 Osijek, Croatia
*
Author to whom correspondence should be addressed.
Agronomy 2023, 13(3), 662; https://doi.org/10.3390/agronomy13030662
Submission received: 18 January 2023 / Revised: 17 February 2023 / Accepted: 22 February 2023 / Published: 24 February 2023
(This article belongs to the Special Issue Treatment and Management of Fusarium Disease in Wheat)

Abstract

:
Wheat infections caused by Fusarium represent a global agricultural problem that reduces grain yield and negatively impacts wheat’s technological and rheological quality. Although fungal proteases or an increase in endogenous proteases due to Fusarium infection could negatively influence wheat storage proteins and dough performance, little research has been performed on either of these topics. The primary objective of this study was to identify the effect of Fusarium infection on protease activity in 25 wheat cultivars grown in two distinct locations in eastern Croatia. Apart from proteolytic activity, this paper describes the impact of Fusarium head blight (FHB) infection on the technological quality parameters of wheat flour and the dough’s rheological properties. The first treatment consisted of naturally grown, healthy wheat without fungicides, while the second treatment utilized wheat varieties subjected to intense FHB infection. Protein and wet gluten content in wheat grain and flour of uninfected cultivars were heavily influenced by testing location, soil type, and quality. Fusarium infection increased the activity of nonspecific proteases by 43% in flour samples from Osijek and 125% in flour samples from Tovarnik. Estimates of effect size showed that FHB infection had twice as big an effect on protease activity in Tovarnik as in Osijek, and a similar trend was found for dough softening. Moreover, the infection significantly impacted wheat cultivars’ extensograph values, indicating a lower resistance to stretching, extensibility, and total stretching energy in infected flour samples, indicating that dough functionality and volume loss can be attributed to exogenous fungal proteases. Still, the magnitude of the effect varied depending on the growth location and the cultivar’s traits. Multivariate data analysis identified three clusters of wheat cultivars, each with varying degrees of the Fusarium infection’s effects. Some cultivars displayed consistent protease activity and flour quality across sites. In contrast, others showed variability in their responses due to environmental conditions. To conclude, genetic resistance could provide adequate control of FHB, guaranteeing the successful protection of wheat quality. However, the possibility of confounding factors influencing genetic and cultivation conditions must be considered, and further research is needed to understand their interaction.

1. Introduction

Wheat’s advantage as a crop species is mainly reflected in the quality and characteristics of the dough formed from its flour. Wheat is the most important grain in the human diet, and wheat flour is a source of essential dietary components. As a result, cultivating wheat free of numerous pollutants, such as mycotoxins, which can threaten human health, is of great interest [1]. Fusarium head blight (FHB) is one of wheat’s most economically devastating diseases and a global problem, causing a considerable loss of yield and grain quality due to reduced protein and starch content [2,3]. This disease’s primary causative agent is Fusarium graminearum, which forms the FGSC (F. graminearum species complex) with at least 16 phylogenetically different species [4,5]. Still, many species of the genus Fusarium are also considered causative, e.g., F. culmorum, F. poae, and F. avenaceum, and several species may be present simultaneously, interacting with each other and leading to infection and mycotoxin production [6].
The most susceptible period for Fusarium infection of wheat is the flowering stage, with temperatures ranging between 20 and 25 °C and a moisture content of 95%, whereas the earliest symptoms of the disease occur about ten days after flowering [7,8]. However, in warm and wet conditions, the first symptoms appear even earlier [9]. The sheer intensity of infection is affected by the causative agent’s pathogenicity, the cultivar’s susceptibility, and the timing of infection during the growing season [2,6,10,11]. Control strategies that can reduce the occurrence of FHB include various agrochemical techniques, including selective pre-crop planting, crop rotation, tillage, fungicide and biological control applications, fertilization, and the creation of FHB-resistant cultivars [1,12,13,14]. Although agrochemical measures are helpful, they are only partially efficient in preventing FHB. Integrated control of FHB spread and avoidance of mycotoxins buildup in grains [15,16] relies heavily on developing resistant cultivars, which is the most cost-effective and long-term approach. Disease resistance is linked to the plant’s hypersensitive reaction, which occurs at the site of pathogen penetration and results in the premature death of spikes or blight [17]. According to Schroeder and Christensen [18], there are two major types of FHB resistance. Type I resistance refers to the initial infection, whereas Type II resistance refers to the plant’s ability to reduce the spread of disease symptoms through a spike. Moreover, wheat plants have evolved different defense responses to fight off the invasion by Fusarium spp., involving physiological and molecular mechanisms triggered by pathogen attack [8,19]. This is supported by the fact that, until today, more than 500 quantitative trait loci (QTL) for FHB resistance have been discovered [20]. However, breeding wheat for FHB resistance is difficult due to quantitative inheritance and complicated mechanisms in wheat–pathogen interaction, and it requires a thorough understanding of the physiological and molecular mechanisms of defense responses in wheat plants to Fusarium spp.
Although there are a large number of studies on the pathogenicity and epidemiology of FHB, resistance mechanisms, mycotoxins, and measures to combat infection, the literature about the impact of Fusarium infection on the quality of wheat flour and its end products is not so abundant. Some studies have been based primarily on food safety and the possibility of avoiding wheat grain contamination with mycotoxins [12,21,22]. Nevertheless, there has been a noticeable increase in the number of studies dealing with the impact of FHB on the effectiveness of wheat milling, grain quality, flour properties, and quality of end-use products [23,24,25,26,27]. Even though the microbial load is mainly found on the grain’s surface, the dry milling process can redistribute contamination and deteriorate wheat flour quality [28]. For example, it was determined that Fusarium infection affects the product’s technological quality, including its sedimentation value and gluten index, and thus negatively impacts the dough’s rheological properties, such as stability, resistance to extension, and energy value [29].
Proteolytic cleavage of peptide bonds, as one of the essential protein modification mechanisms during the seed maturation and germination process, is greatly affected by fungal infections of cereals [30,31]. Increased protease activity was found in barley and wheat grains infected with Fusarium [31,32,33]. Moreover, when present excessively in flour, proteases alter the gluten network, thus impacting the dough’s quality, allowing considerable gas retention, and affecting bread’s quality and texture [34]. Fusarium proteases remain idle in the harvested grain but can be reactivated during the dough-making process, negatively affecting the rheological properties of dough [33,35]. It is well known that the dough’s physical properties and baking depend not only on the gluten amount but also on its strength, whereas higher protease activity reduces gluten strength by partially breaking down its polymeric form. Excessive elasticity results in insufficient dough rising because the gas pressure required to stretch the dough is too high, while extreme stretching without sufficient strength leads to the cracking of air bubbles, forming large cavities during baking. Since Fusarium protease remains active through the dough-making and kneading phases, the extension of these processes will likely result in a significant loss of dough strength and bread shape [33]. Recent studies aimed to characterize the proteases synthesized by Fusarium species and find proteins that could inhibit these enzymes, minimizing changes in the dough’s quality [36,37,38,39].
The advantage of wheat as a crop species is not only in its high level of adaptation to different climatic conditions and in maintaining a high grain yield in these conditions but is also largely reflected in the quality and characteristics of the dough produced from its flour. These properties are derived from its storage proteins. Although the wheat protein content is relatively low compared to other grains, the role of storage proteins in gluten formation makes wheat one of the most consumed grains. Thus, the content and concentration of wheat proteins become some of wheat’s leading commercial value indicators, making the research of FHB’s impact on protease activity significant. Therefore, this research primarily aimed to determine the influence of Fusarium infection on the protease activity of 25 winter wheat varieties sown in two distinct locations in Eastern Croatia. In addition to proteolytic activity, technological quality properties (grain protein content, sedimentation value, gluten index, and falling number) and rheological characteristics (water absorption, farinograph quality number, dough stability, degree of the dough softening, dough resistance to extension, extensibility, and extension energy) of the wheat flour and dough were also examined. We were curious to see how the wheat testing location affects the wheat’s ability to resist Fusarium infection and how the protease activity of infected and uninfected wheat flour samples from two distinct cultivation areas reflects the dough quality for baking. Furthermore, does the genotypic variability of wheat varieties significantly influence protease activity and other wheat grain and flour properties, or do environmental factors prevail?

2. Materials and Methods

2.1. Wheat Samples, Field Experiments, FHB Inoculations, and Disease Assessment

Twenty-five winter wheat cultivars (Table 1) were sown in a completely randomized block design in the 2019–2020 crop season at two locations in eastern Croatia (Osijek, OS, at 45°32′ N, 18°44′ E, and Tovarnik, TOV, at 45°10′ N, 19°9′ E). During the wheat growing season, Osijek had an average air temperature of 11.1 °C and a total precipitation of 408.6 mm. In Tovarnik, the average air temperature was 11.7 °C, and the total rainfall was 448.3 mm (data from the Croatian Meteorological and Hydrological Service). At both locations, standard agro-technical measures were applied, but the application of fungicides was omitted. The experiment consisted of two replicates for each cultivar of uninfected control samples (treatment 1) and two replicates of samples artificially infected with Fusarium species that cause FHB (treatment 2). Inoculum for artificial inoculation was produced by mixing two of the most common Fusarium species (1:1), F. graminearum and F. culmorum, and producing spores on autoclaved wheat and oat grains as described in previous research [40]. For inoculation, the conidium concentration was set to 105 mL−1 and sprayed on the whole plots of 7.56 m2 when >50% of plants per plot were in the full flowering stage (Zadoks scale of 65, [41]). After inoculation, plants were sprayed with water to initiate infection, thus maintaining increased moisture for 24 h.
Infection symptom assessment was performed on the 10th, 14th, 18th, 22nd, and 26th day after inoculation. Initial resistance (Type I resistance) was scored on a random sample of 30 wheat heads and represented a percentage of diseased ears per plot, while general resistance was evaluated on a linear scale as a percentage of diseased spikelets on the entire plot. Further, the area under the disease progress curve (AUDPC) for initial and general resistance (AUDPC-In and AUDPC-Gen) was calculated as follows:
AUDPC = i = 1 n Y i + Y i 1 2 × x i + 1 x i
where Yi is disease severity on the ith date; xi is ith day; n is the number of days on which FHB infection was recorded.
Final harvesting occurred when grain moisture fell below 14% in July 2020.

2.2. Specific Properties of Grain and Flour

2.2.1. Technological Properties

The protein content (PC, %) was measured in grain samples on Infratec 1241 (Foss Tecator). The white flour of each sample was produced by laboratory-scale milling using a Quadrumat mill (Brabender OHG, Duisburg, Germany). The proportion of wet gluten (WG, %) was determined according to the ICC Standard No. 155 [42] by a Perten Glutomatic® 2000 System (PerkinElmer Inc., Waltham, MA, USA), and the sedimentation value (SV, mL) was determined according to the standard method HRN EN ISO 5529 [43]. Sedimentation value indicates the ability to swell gluten proteins in lactic acid, depends on the quantity and quality of wheat proteins, and is an indicator of protein quality.

2.2.2. Amylolytic Activity

Since a certain amount of α-amylase activity is necessary for final product quality, it was estimated as a falling number (FN, s) using the Hagberg–Perten falling number system according to the standard method HRN EN ISO 3093 [44]. The FN test examines the effect of α-amylase on gelatinized starch granules in flour which are gradually broken down (cleaved) by amylase action. The test temperature maximizes enzymatic activity in the flour/water mixture. The FN refers to the time in seconds needed to stir and allow the viscometer stirrer to fall a measured distance through a hot slurry or gel of wheat flour and has an inverse relationship with the activity of α-amylase. Therefore, when the enzymatic activity is high, the starch is rapidly broken down, and the device descends fast through the relatively liquid paste. The FN is low when the viscous fluid opposes the flow with some resistance. If, on the other hand, the enzyme activity is low, the device takes longer to cover the distance of its fall. This signifies that the falling number is high. So, the larger the number, the lower the activity of α−amylase, and vice versa [44].

2.2.3. Proteolytic Activity

For the evaluation of proteolytic activity in wheat flour samples, a modified standard test for determining the activity of nonspecific proteases with phosphoprotein casein as a substrate was used [45]. This quality control procedure is based on the protease digestion of casein to form peptides soluble in trichloroacetic acid (TCA). These peptides contain the amino acids tyrosine and tryptophan residues that react with the Folin-Ciocalteu (FC) reagent to form a blue-colored chromophore, which is then quantified by a UV-VIS spectrophotometer (Analytik Jena, Specord 40).
The standard protocol was modified for micro volumes and adapted to the tested samples. The optimal incubation and reaction times, as well as temperature, were determined before testing. To extract the enzyme, flour samples were suspended in 10 mM CH3COONa and 5 mM (CH3COO)2Ca buffer (pH 7.5, 37 °C) in a ratio of 1:5 (w/v) and pre-incubated for 12 h at 37 °C. After centrifugation (15 min, 10,000× g, 20 °C), to 50 μL of enzyme extract, 20 μL of 0.5% casein in a 50 mM potassium phosphate buffer (pH 7.5, 37 °C) was added and incubated for 10 min at 37 °C. The reaction was stopped with 110 mM trichloroacetic acid (TCA, 20 μL), re-incubated for 30 min at 37 °C, and centrifuged for 5 min at 20 °C (10,000× g). The supernatant (250 μL) was then mixed with 25 μL 500 mM Na2CO3 and 125 μL 0.5 N FC reagent and incubated for 30 min at 37 °C, after which samples with developed blue chromophores were transferred to cuvettes and absorbance was measured at 660 nm.
Absorbance values generated by protease activity were compared with a standard curve obtained by reacting known quantities of tyrosine (L-Tyrosine, Sigma-Aldrich) with the FC reagent to compare changes in absorbance with the amount of tyrosine in μmol. Nonspecific protease activity was expressed as μmol of tyrosine equivalents released from casein min/mL and recalculated per gram of tested flour. All measurements were replicated three times.

2.3. Rheological Properties of Dough

In addition to the main parameters of the technological properties of wheat flour, we also determined the rheological properties of wheat flour dough with a farinograph [46] and an extensograph [47] using 50 and 300 g of flour samples, respectively. The obtained results provide information on dough behavior during kneading and the properties of gluten during dough formation. The determination of the flour quality by farinograph is based on registering changes in the physical characteristics of the dough during a specific stirring time. Using a farinograph, we determined: (1) the ability of flour to absorb water (WA, %), which indicates the proportion of water to be added to the flour to knead the dough of optimal consistency and is expressed in farinographic units (FU), where the optimal consistency is about 500 FU; (2) the farinograph quality number (FQN) as the length from the water point to the point of 30 FU below the center line of the largest consistency along the time axis; (3) dough stability (DS, min), which indicates the time from the maximum achieved optimal consistency to its decrease by 10 FU; and the (4) degree of the dough softening (DoS, FU) as the difference between the maximum resistance to mixing (i.e., the optimal consistency of the dough) and the middle of the curve at the end of mixing (12 min later).
Using extensograph, the dough resistance to extension (RtE, EU), extensibility (Ext, mm), and extension energy (E, cm2) were determined. Dough resistance to extension represents the necessary force for stretching the dough to a certain length. The resistance to extension is a curve obtained after 50 mm of stretching the dough and is expressed in extensographic units (EU). The dough extensibility (Ext) refers to the length of stretched dough from the extension beginning to the moment of cracking, while the extension energy (E) refers to the amount of energy consumed by dough extension and is obtained by calculating the area below the formed curve (cm2) on the extensograph.

2.4. Statistical Analysis

Statistical analyses and data visualizations were performed in Excel [48] and XLSTAT 2022.2.1.1304 [49]. For the comparison of mean values of all wheat flour samples from both locations (n = 50 for control and n = 50 for infected samples) and for the assessment of the impact of FHB infection and testing location, as well as their interaction on measured parameters, a two-way analysis of variance (two-way ANOVA) and the Tukey HSD as a post hoc test were used. Before testing, the Shapiro–Wilk test was used to check if the data followed normality. Levene’s test was used to check the assumption of equal variances, and their homogeneity was graphically verified (q-q plot, residuals). When the premises were not rejected, variance analysis was performed. However, when the data were shown not to be normally distributed and followed different distributions, the Kruskal–Wallis test, the non-parametric version of ANOVA, with multiple pairwise comparisons using the Conover–Iman procedure, was used. Statistical analyses were performed with untransformed data, which is why the effects of higher-order interaction were limited because of the low number of replications available for every parameter. However, percentages were replaced with proportions. All tests were performed at the p < 0.05 level of significance.
The impact of location or FHB infection on a particular measured outcome was estimated as the effect size. To better observe the differences between the FHB-infected and control groups and then among individual cultivars, the difference between the mean value of the infected and the mean value of the control group for each tested location and/or cultivar was marked as the mean difference. Since the mean difference does not consider the standard deviation within the groups, the Hedges effect size [50,51], a quantitative measure of the strength of an effect based on the overall standard deviation, was calculated by standardizing the mean difference between two groups x 1 ¯ x 2 ¯ by the pooled, weighted standard deviation S D p o o l e d of the sampled population ( n 1 + n 2 ) and Ellis’s unbiased form of effect size was used because this article focuses on data from small independent samples:
d = x 1 ¯ x 2 ¯ / S D p o o l e d
S D p o o l e d = n 1 1 S D 1 2 + n 2 1 S D 2 2 ) / ( n 1 + n 2 2
c o r r e c t e d   H e d g e s   d   d 1 ( 3 / 4 n 1 + n 2 9
A higher effect size means more impact on the measured parameter. On the other hand, negative effect size values refer to the reduction of a particular parameter compared to the control group, and the higher its absolute value is, the more significant the impact is. The statistical significance (calculated by the Welch t-test or Steel test) of the differences between the infected and control groups in most parameters coincided with a high positive or negative effect of infection on the measured outcome. Estimates of effect size and its 95% confidence intervals were graphically presented by high-low-close stock graphs. This way, a better and more informative representation of the proven values was shown.
Statistical data processing also involved applying multivariate analysis to determine the structure of the obtained results. Principal component analysis (PCA) was used to reduce the data set’s dimensionality while preserving the variables’ characteristics that account for most of the variance. Linear combination factors of initial variables reveal potential causes of correlation of the obtained results in this manner. PCA was performed on normalized data to avoid the excessive influence of one variable on the main components and was based on a Spearman correlation matrix due to previously described distributions of extensograph data. Hierarchical agglomerative clustering was then performed on principal components by grouping with the Ward method of quadrated Euclidean distances so that the degree of similarity within the group is maximized while minimizing the similarity between the groups.

3. Results

3.1. Technological Quality of Wheat Samples

By examining the impact of the interaction of FHB infection and the wheat testing location on the protein content (PC), the proportion of wet gluten content (WG), and the sedimentation value (SV), a two-way ANOVA showed a significant effect of both testing location and FHB infection (F3,96 = 21.9 for PC, 32.87 for WG, and 24.5 for SV, p < 0.0001). However, the model for PC, WG, and SV explained only 41, 51, and 43% of the dataset variability (Figure 1a,c,e). The most influential was the interaction of location and treatment. The testing location influenced the FHB infection’s effect on PC, WG, and SV differently. For example, the analysis of differences in PC proportion between uninfected (control) and FHB-infected samples cultivated at Osijek revealed a statistically significant and relevant estimate of the FHB infection effect that caused an average increase in PC by 18%. In contrast, FHB infection did not affect the proportion of PC in wheat grains grown at Tovarnik (Figure 1a,b).
Similar to the protein content proportion, WG also increased in FHB-infected samples of wheat cultivars grown at Osijek. Like PC, both FHB-infected and uninfected flour samples of wheat cultivars grown at Tovarnik had significantly greater WG values than those produced at Osijek. But, contrary to Osijek, the FHB infection of wheat at Tovarnik showed no significant influence on the WG proportion (Figure 1c,d). The sedimentation value reacted differently from PC and WG (Figure 1e,f). On average, FHB infection did not cause significant changes in the SV of wheat cultivars grown at Osijek. However, the change in SV ranged from a 20% increase to a 17% decrease, depending on the cultivar. At the same time, in flour samples of wheat cultivars grown at Tovarnik, an average 24% decrease in SV was recorded. Furthermore, depending on the cultivar, the reduction in SV ranged from 0% to 40%. Thus, the most influential variable for SV was the FHB treatment, followed hierarchically by the FHB treatment’s interaction with testing location. The analysis of differences between uninfected and infected samples confirmed both a statistically significant and relevant effect of FHB infection on the SV of flour samples from Tovarnik (Figure 1f).
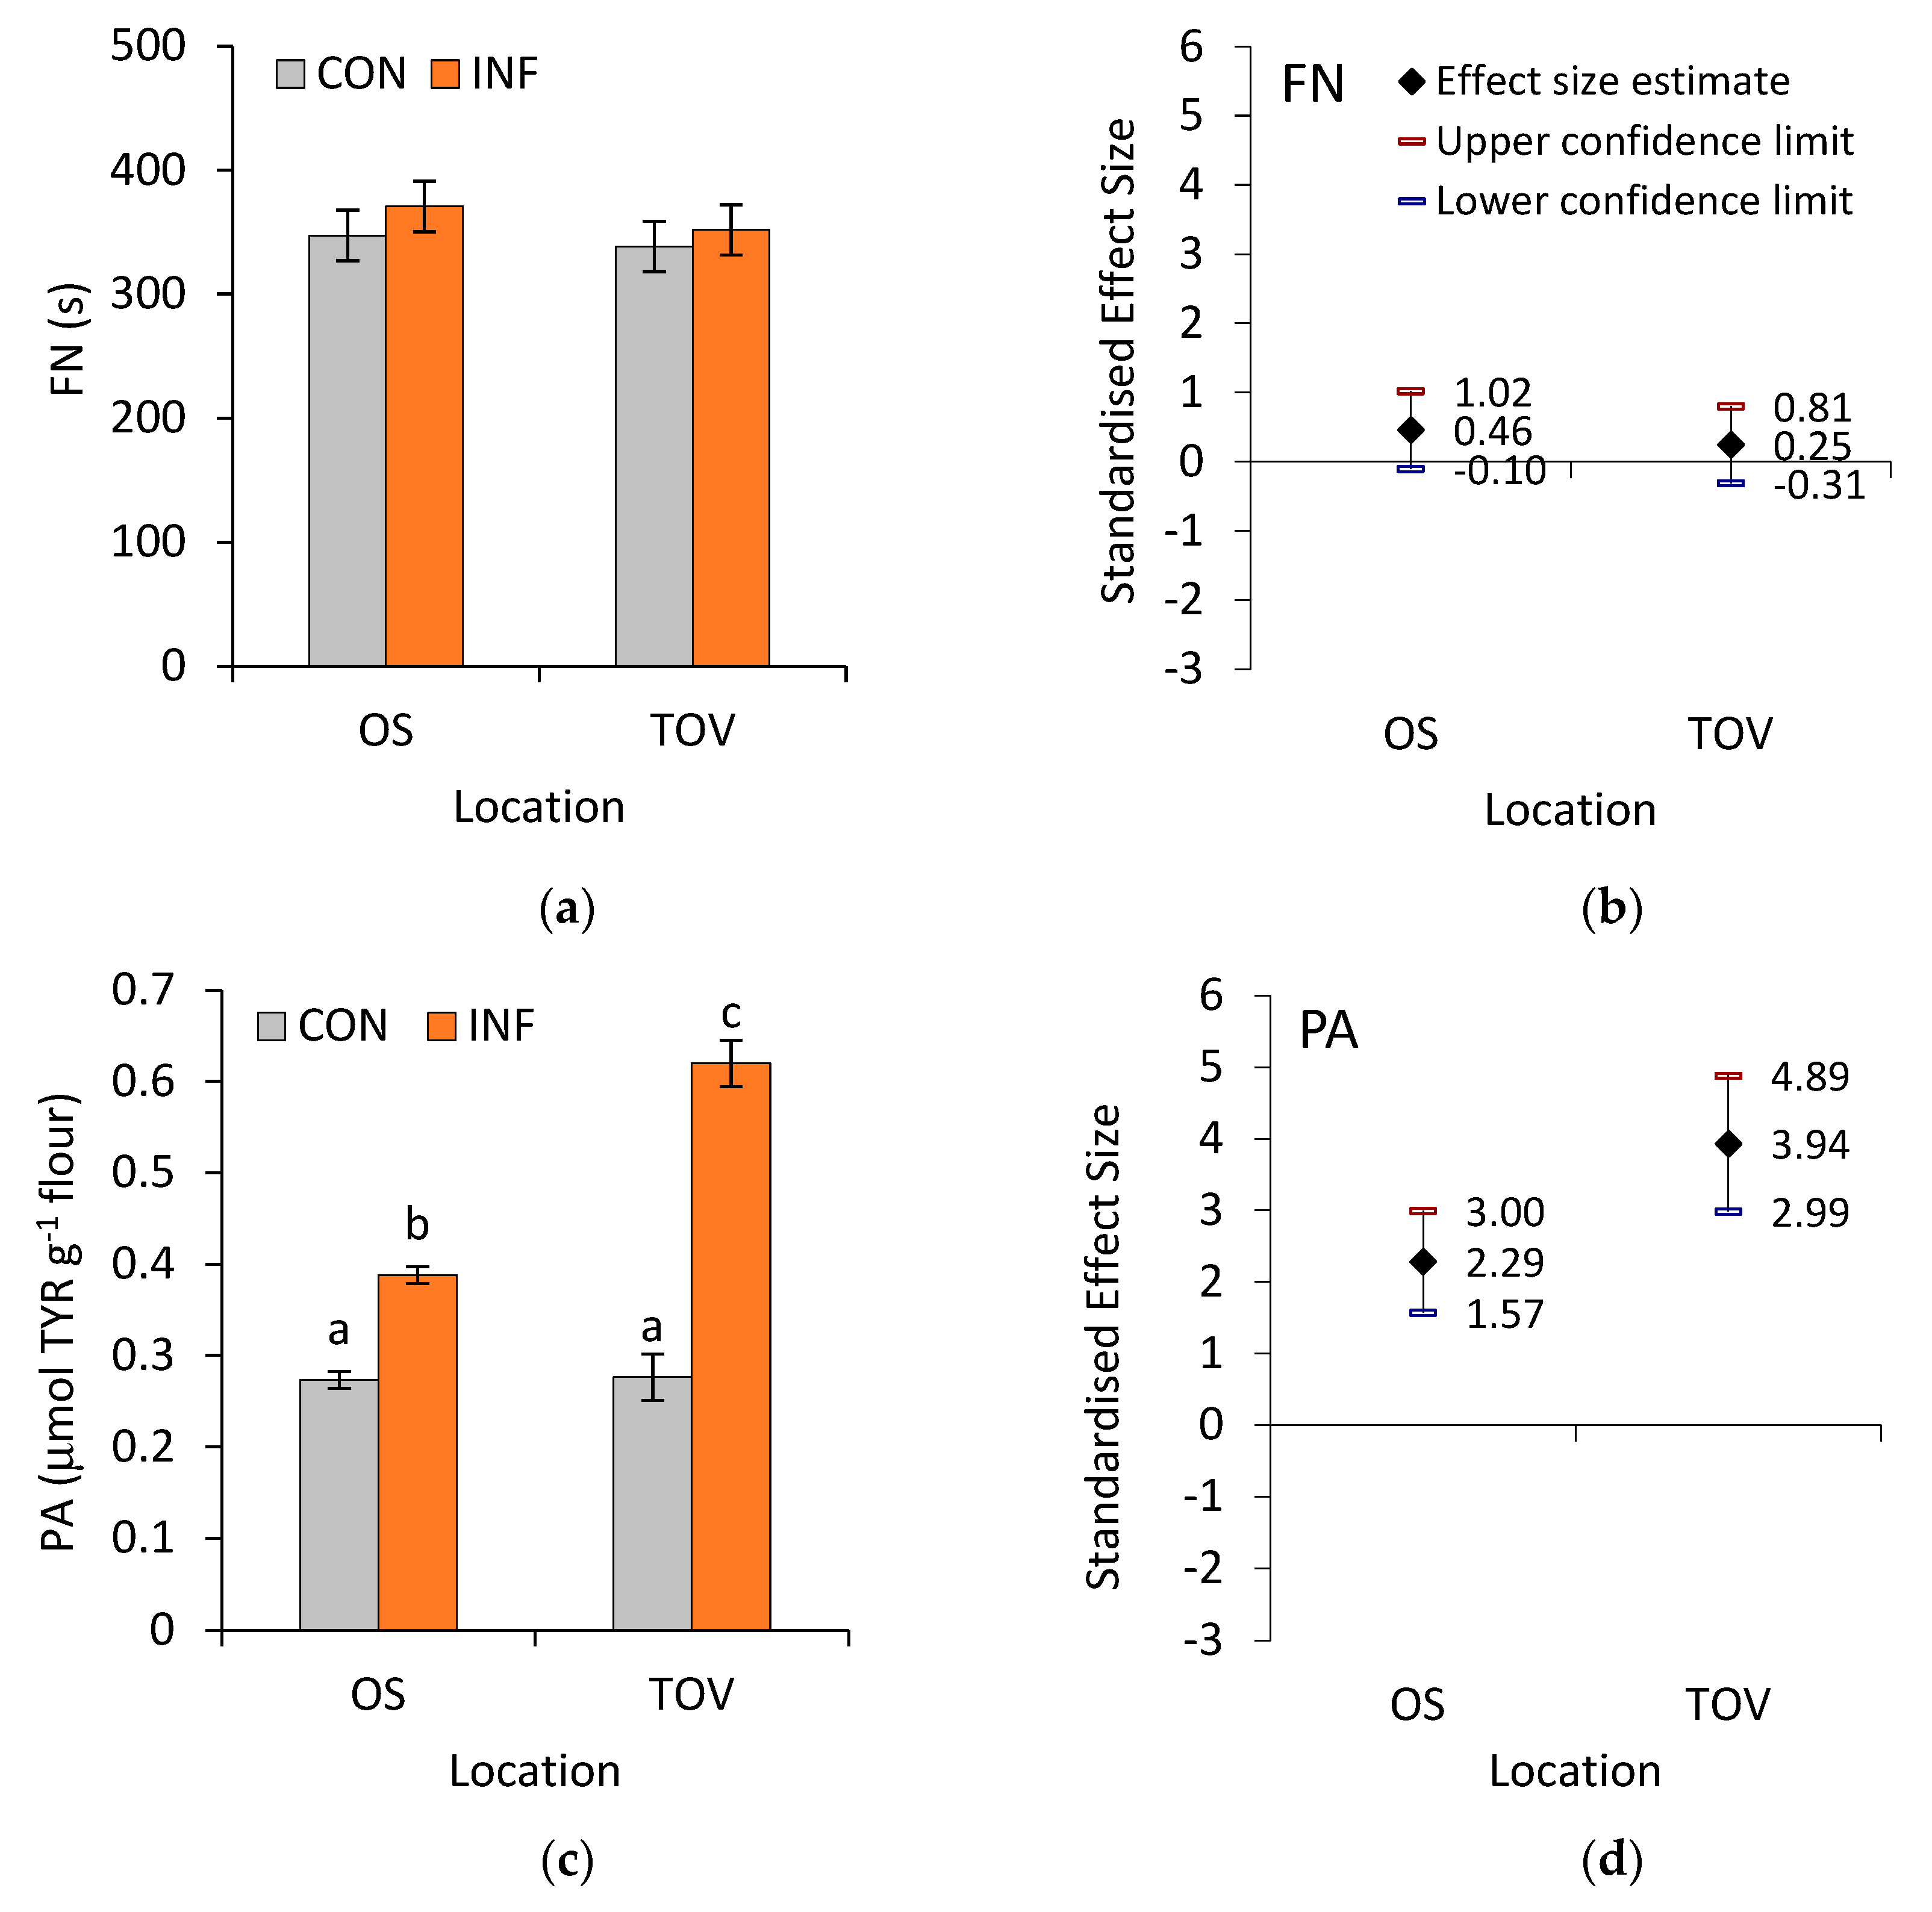
The amylolytic activity was estimated as a Hagberg falling number (FN), which, as stated before, indirectly measures the amount of α-amylase presence, and the proteolytic activity was calculated as the activity of nonspecific proteases (PA). Neither location nor FHB infection influenced FN (two-way ANOVA, F3,96 = 1.75, p = 0.16), as shown in Figure 2a,c. However, both FHB infection and wheat growing location significantly affected the proteolytic activity of flour samples, with 80% of the variability in the proteolytic activity explained by the two-way ANOVA model (F3,96 = 134.9, p < 0.0001). FHB infection caused an increase in the activity of nonspecific proteases by an average of 43% in flour samples of wheat cultivars grown at Osijek. At the same time, in flour samples of wheat cultivars grown at Tovarnik, an average of a 125 % increase in protease activity was determined. The estimates of effect size confirmed twice as strong an effect of FHB infection on increasing protease activity of the flour samples from Tovarnik compared to Osijek. This disparity in the effect size and the mean differences between uninfected and FHB-infected samples was due to a large range of increased protease activity in both Tovarnik (from 81% to 235 % increase) and Osijek samples (from 3% to 139 % increase), as shown in Figure 2b,c.

3.2. Proteolytic Activity of Wheat Samples

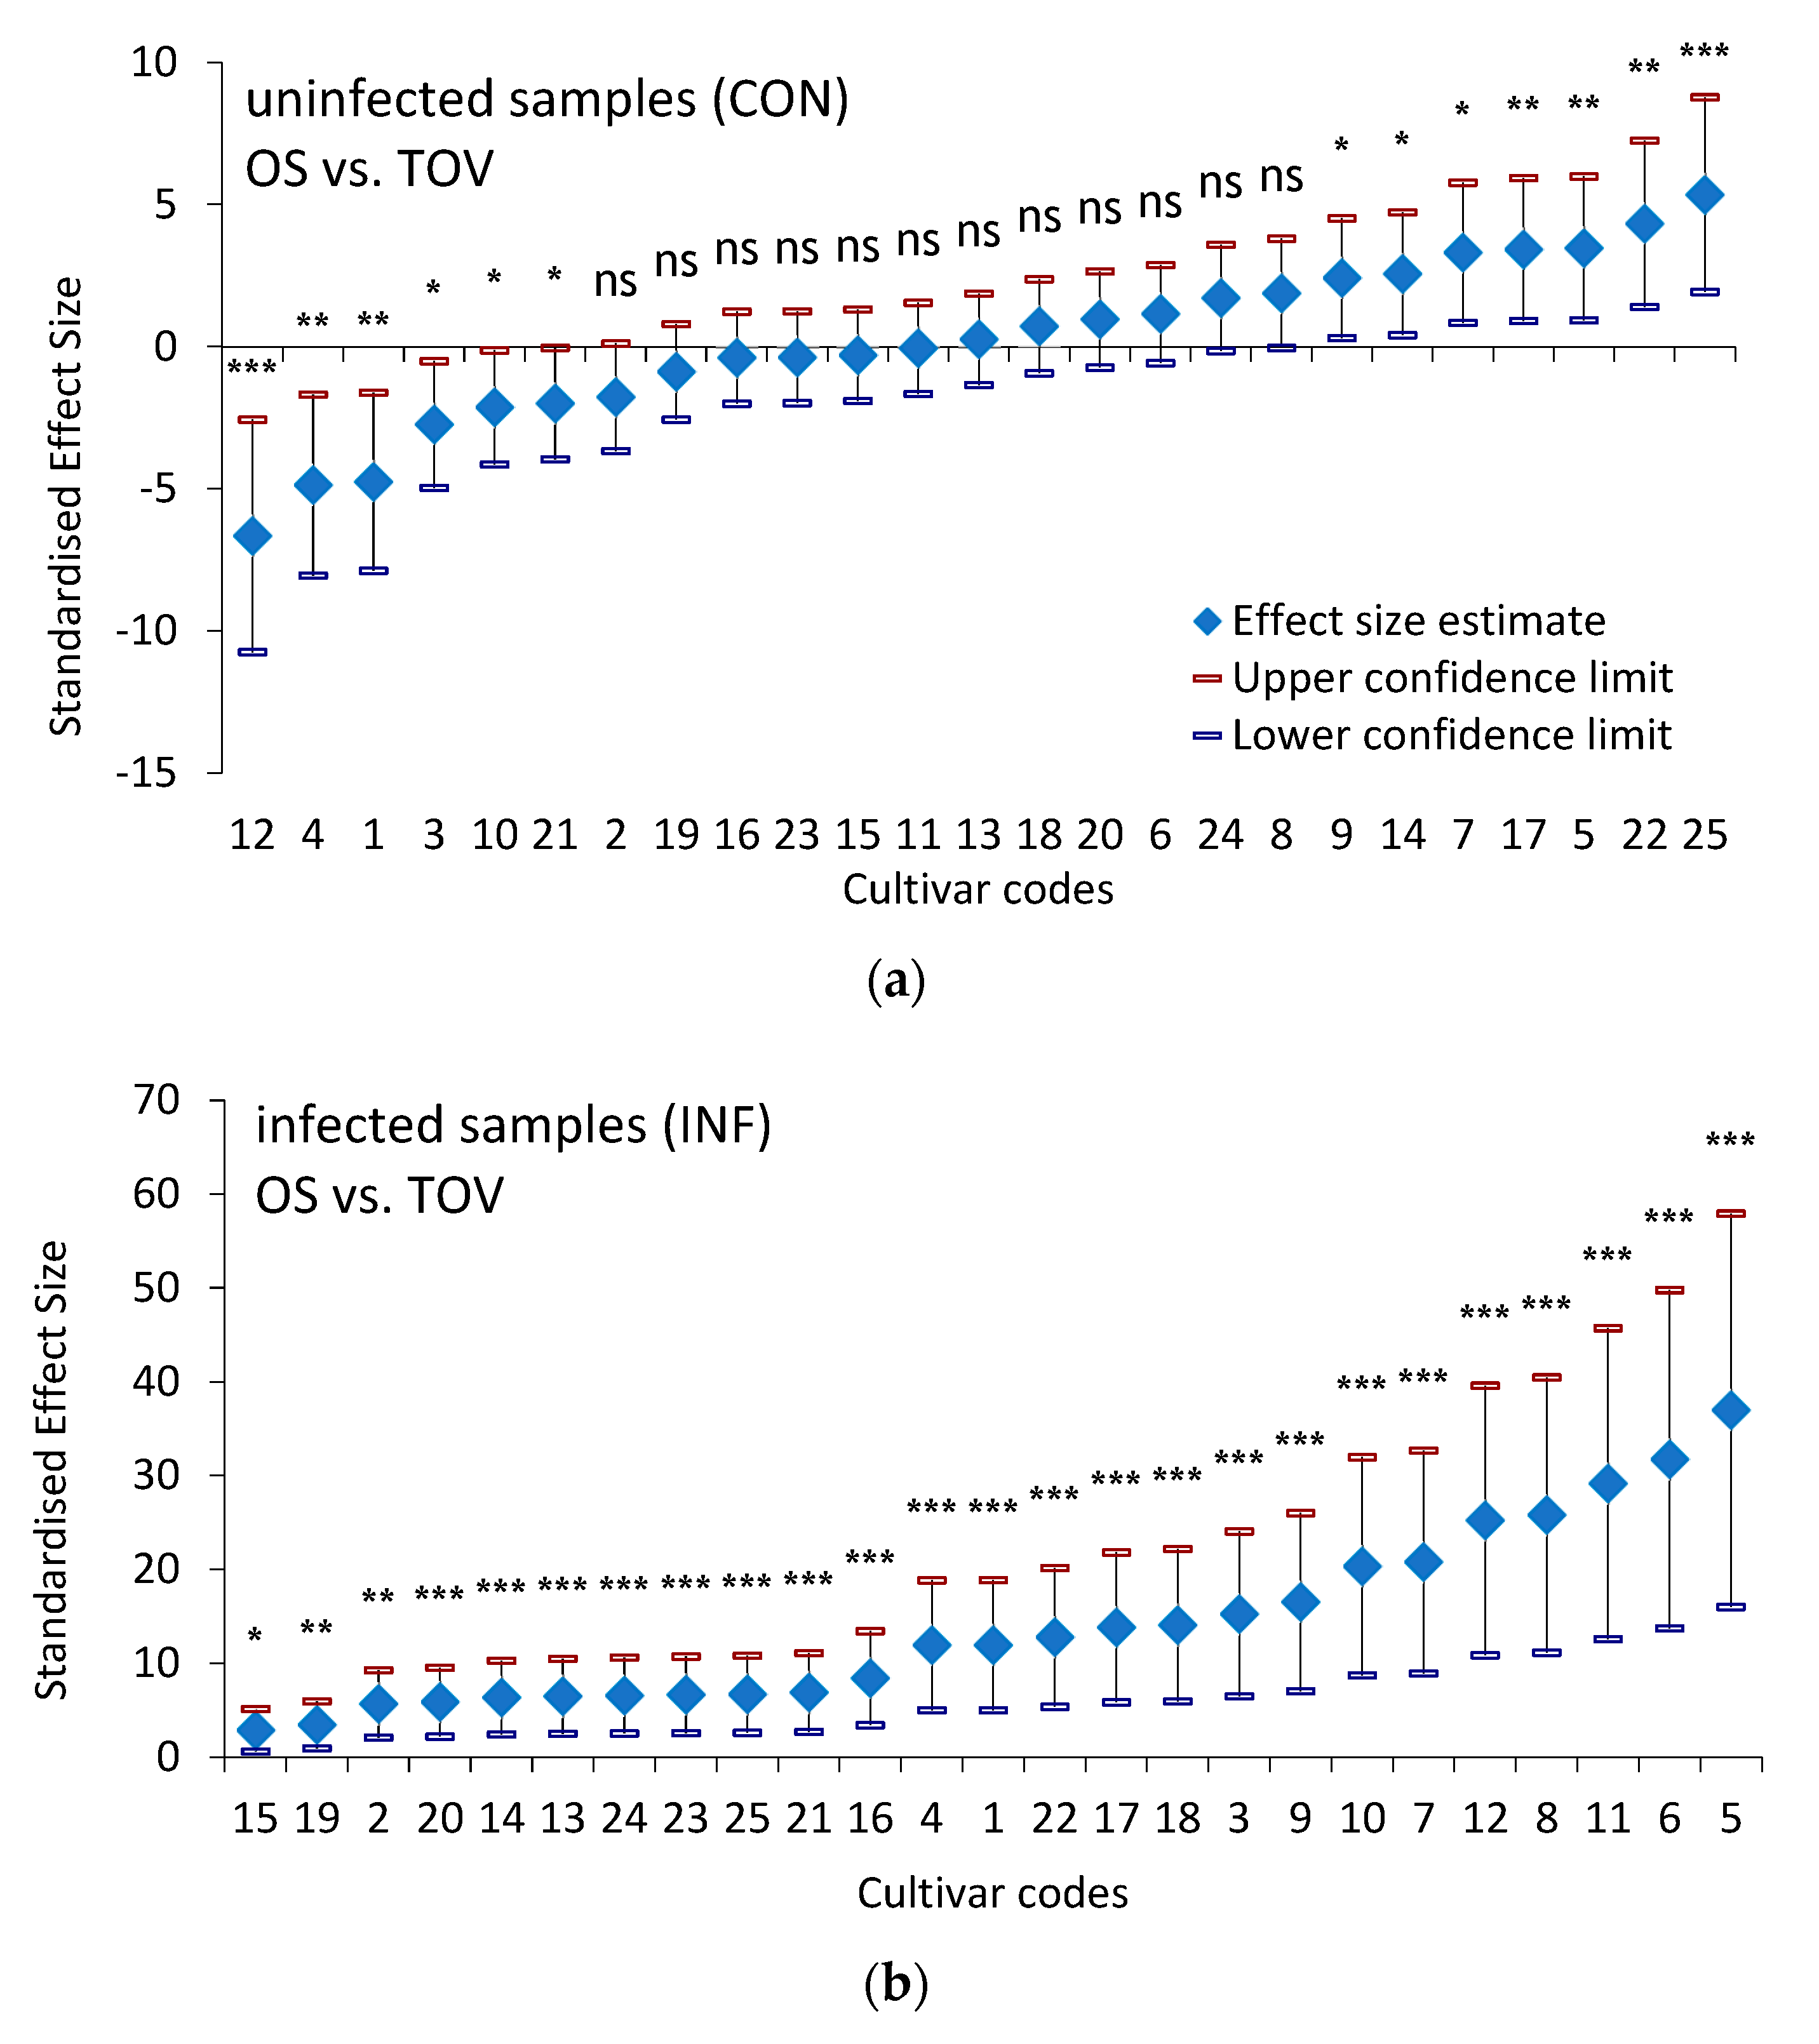
Although there were no differences in the activities of nonspecific proteases (PA) between uninfected wheat flour samples from Osijek and Tovarnik, we included genotypic variability in the model due to the high range of PA over cultivars. According to this new model (two-way ANOVA, F49,100 = 15.43, p < 0.0001, R2 = 88%), the most influential variable affecting differences in protease activity was actually genotype (based on Type III sum of squares SS = 0.052, F = 19.43, p < 0.0001), hierarchically followed by its interaction with the location (Type III SS = 0.032, F = 11.99, p < 0.0001). The analysis of differences between uninfected control samples of both locations identified three groups of samples (Figure 3a): the first group consisted of cultivars with significantly lower protease activity when grown at Tovarnik, compared to Osijek (codes 12, 4, 1, 3, 10, 21), a second group included cultivars with no significant differences in the activity of proteases no matter where they were grown at (codes 2, 19, 16, 23, 15, 11, 13, 18, 20, 6, 24 and 8), and a third group consisted of cultivars in which protease activity was significantly higher when they were grown at Tovarnik as opposed to Osijek (codes 9, 14, 7, 17, 5, 22, and 25). The same was done for infected samples. However, extracting groups of cultivars was not possible because the effect of the infection was much higher in Tovarnik than in Osijek, and the effect size of the differences between cultivars ranged from 2.76 (cultivar 15) to a maximum of 25.8 (cultivar 5), all of which fall into the category of “very high effect” (Figure 3b). Considering these very large effects depend on the context and known sources of variability, some coherence exists as the relations between individual cultivars were mirrored in the infected samples, suggesting that genetics and environment influenced PA.

3.3. Rheological Quality of Wheat Samples

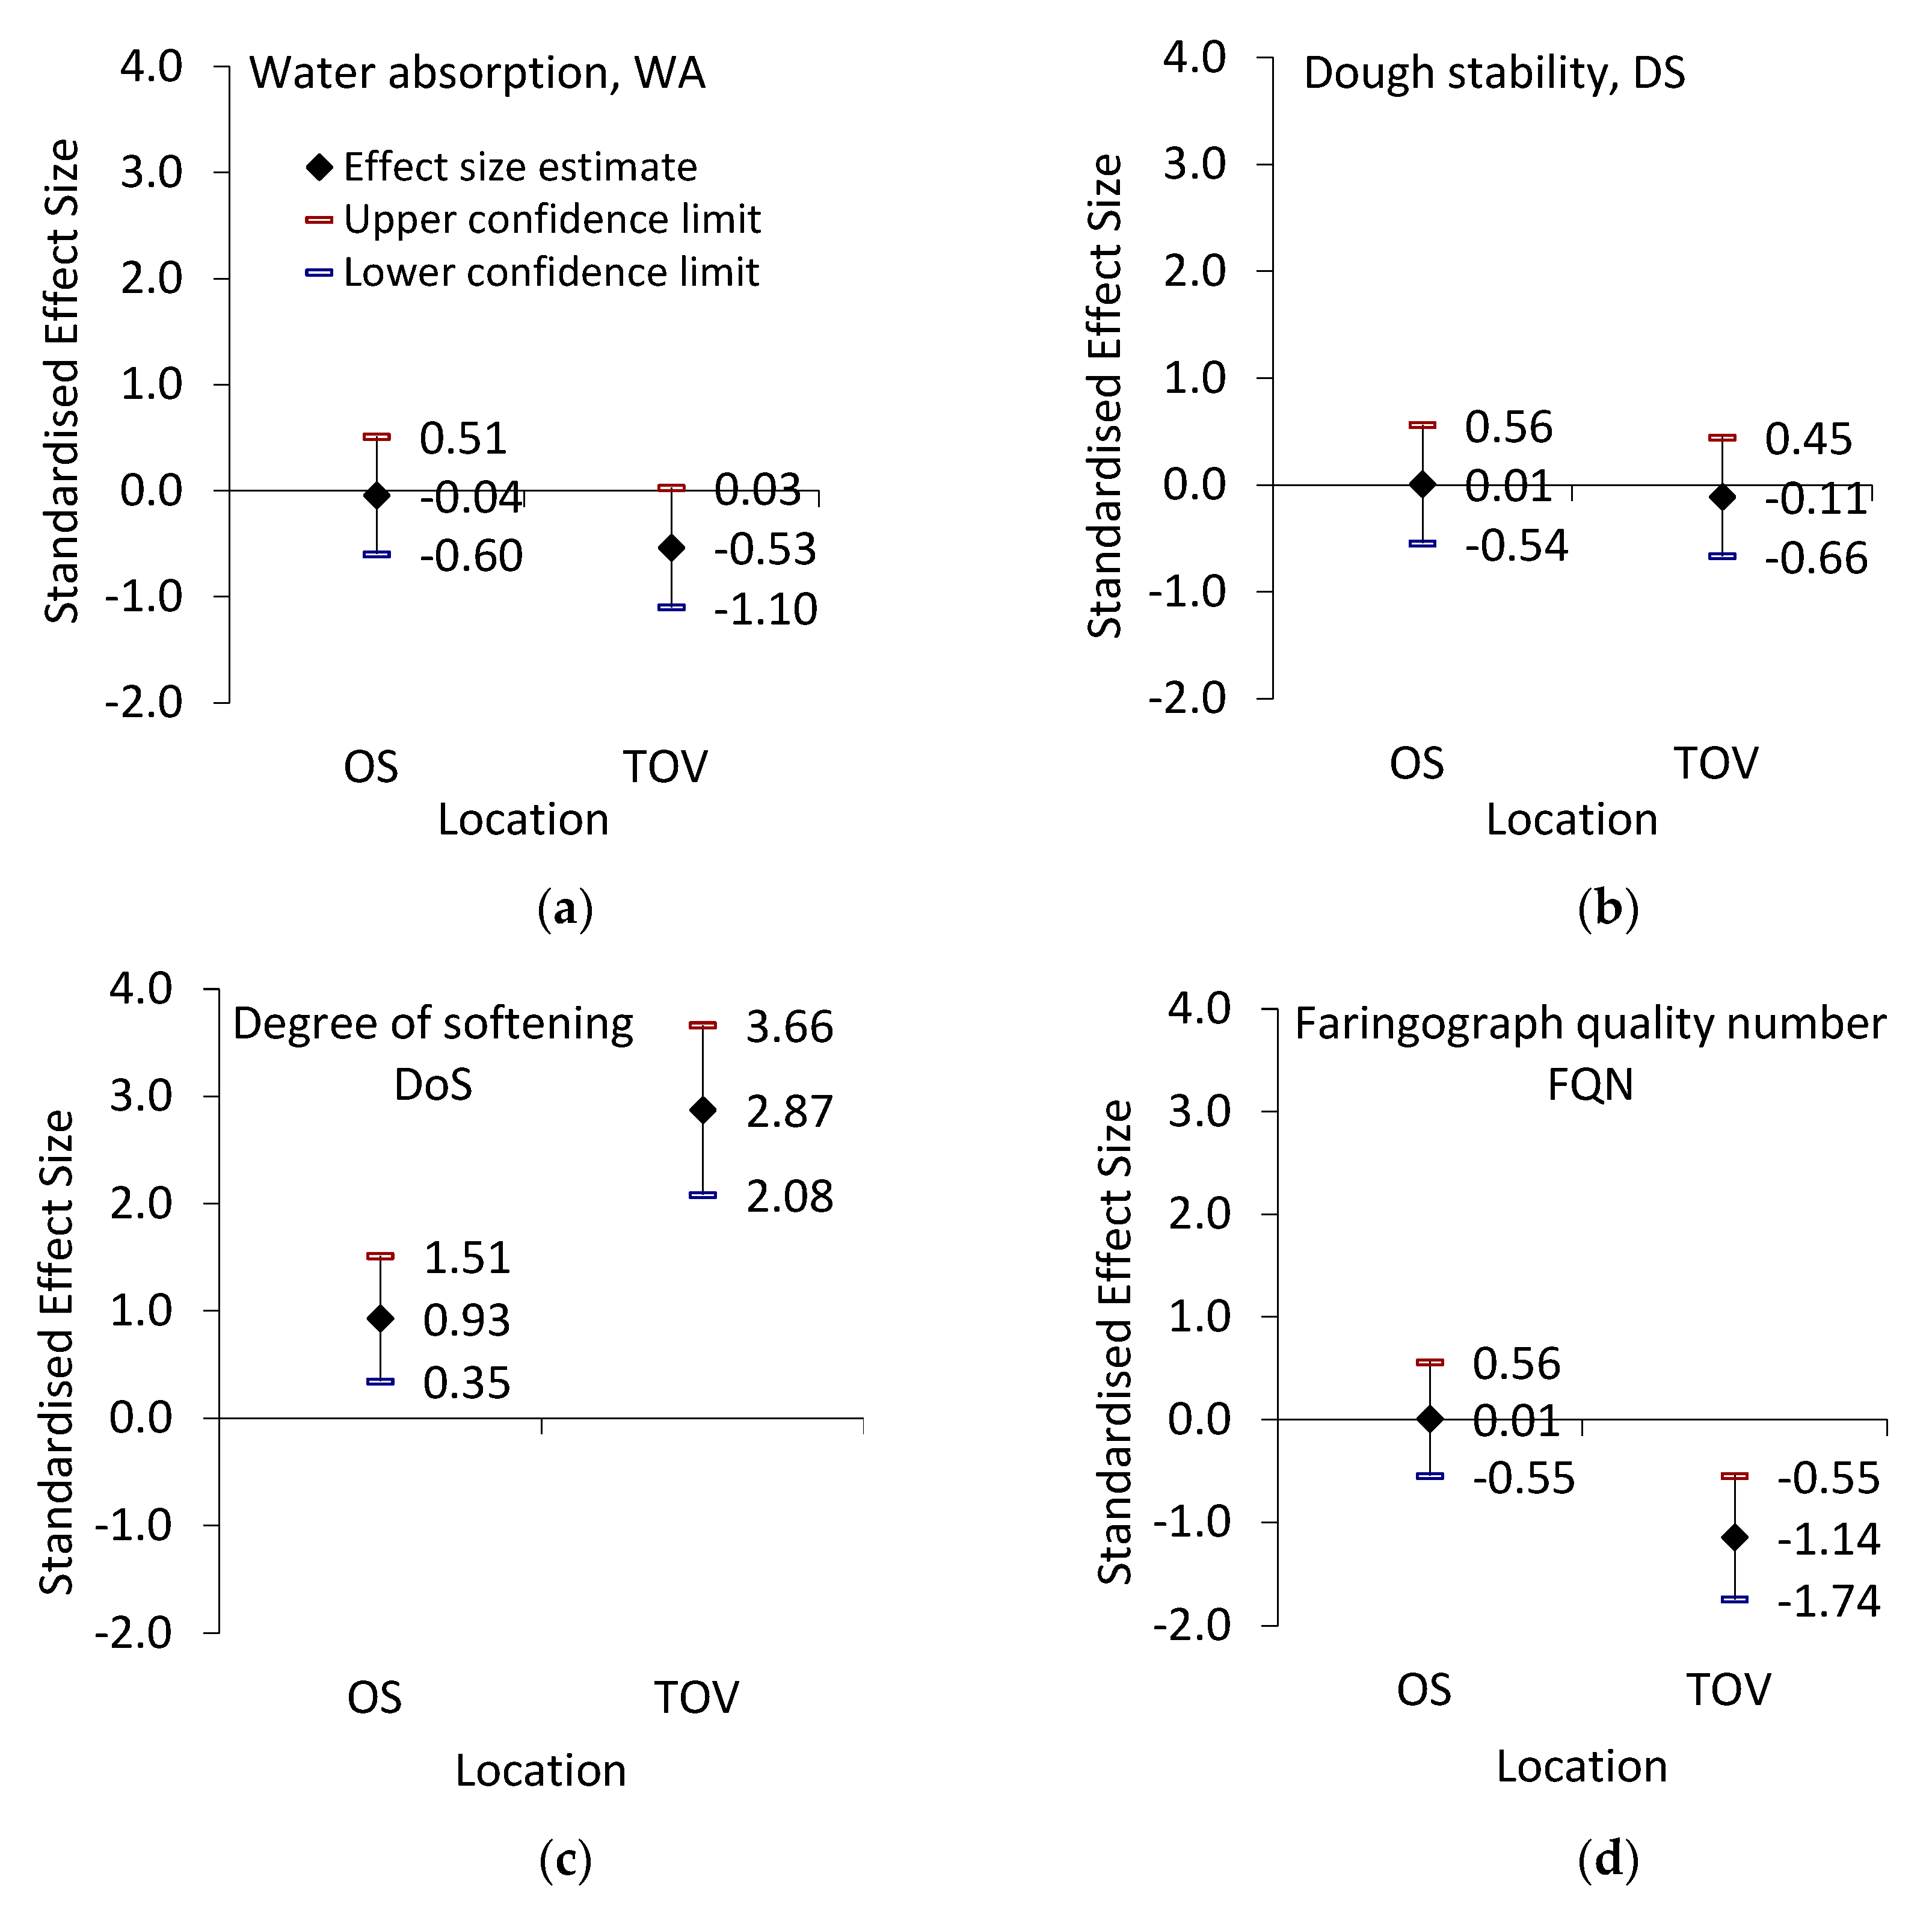
Further analysis included the farinograph and extensograph rheological properties of wheat flour samples from all cultivars grown at both locations. The ability of uninfected wheat flour to absorb water ranged from 50.5% (cultivar 20) to 61.3% (cultivar 1) at Osijek and from 52.2% (cultivar 20) to 62.7% (cultivar 1) at Tovarnik. The FHB infection did not influence the water absorption of tested wheat flour from either location (Table 2, Figure 4). The same was determined for dough stability (DS). However, the range from minimal to maximal values of DS was relatively high (1.3 and 1.5 min in uninfected samples from Osijek and Tovarnik, 1.9 and 3.1 min in infected samples from Osijek and Tovarnik), suggesting an influence of cultivar variability.
The degree of dough softening (DoS) behaved slightly differently than other rheological properties determined by farinograph. It differed significantly between cultivars, locations, and treatments (Table 2). The FHB infection caused a significant increase in DoS, on average, of more than 400% in Tovarnik samples, as opposed to Osijek, where the rise in DoS caused by the infection was around 40%. Therefore, FHB infection had the most significant impact on the variability of DoS, where the estimated effect size in samples from Tovarnik was actually three times, and not ten times, greater than the infection effect on samples from Osijek (Figure 4c). The extensive range in the DoS of uninfected samples at both Osijek (31 to 135 FU) and Tovarnik (3 to 98 FU) also suggested significant genotypic variability. The farinograph quality number (FQN), a combined value of dough development time, stability, and mixing tolerance index, expressing flour quality as a single value, showed that uninfected wheat flour samples from Tovarnik were more robust (stronger), having the highest average values and thus indicating better gluten quality. Furthermore, a significant decrease in FQN was determined in FHB-infected flour samples from Tovarnik, while in Osijek, FHB infection had no influence on the average values of the flour sample’s FQN (Table 2).
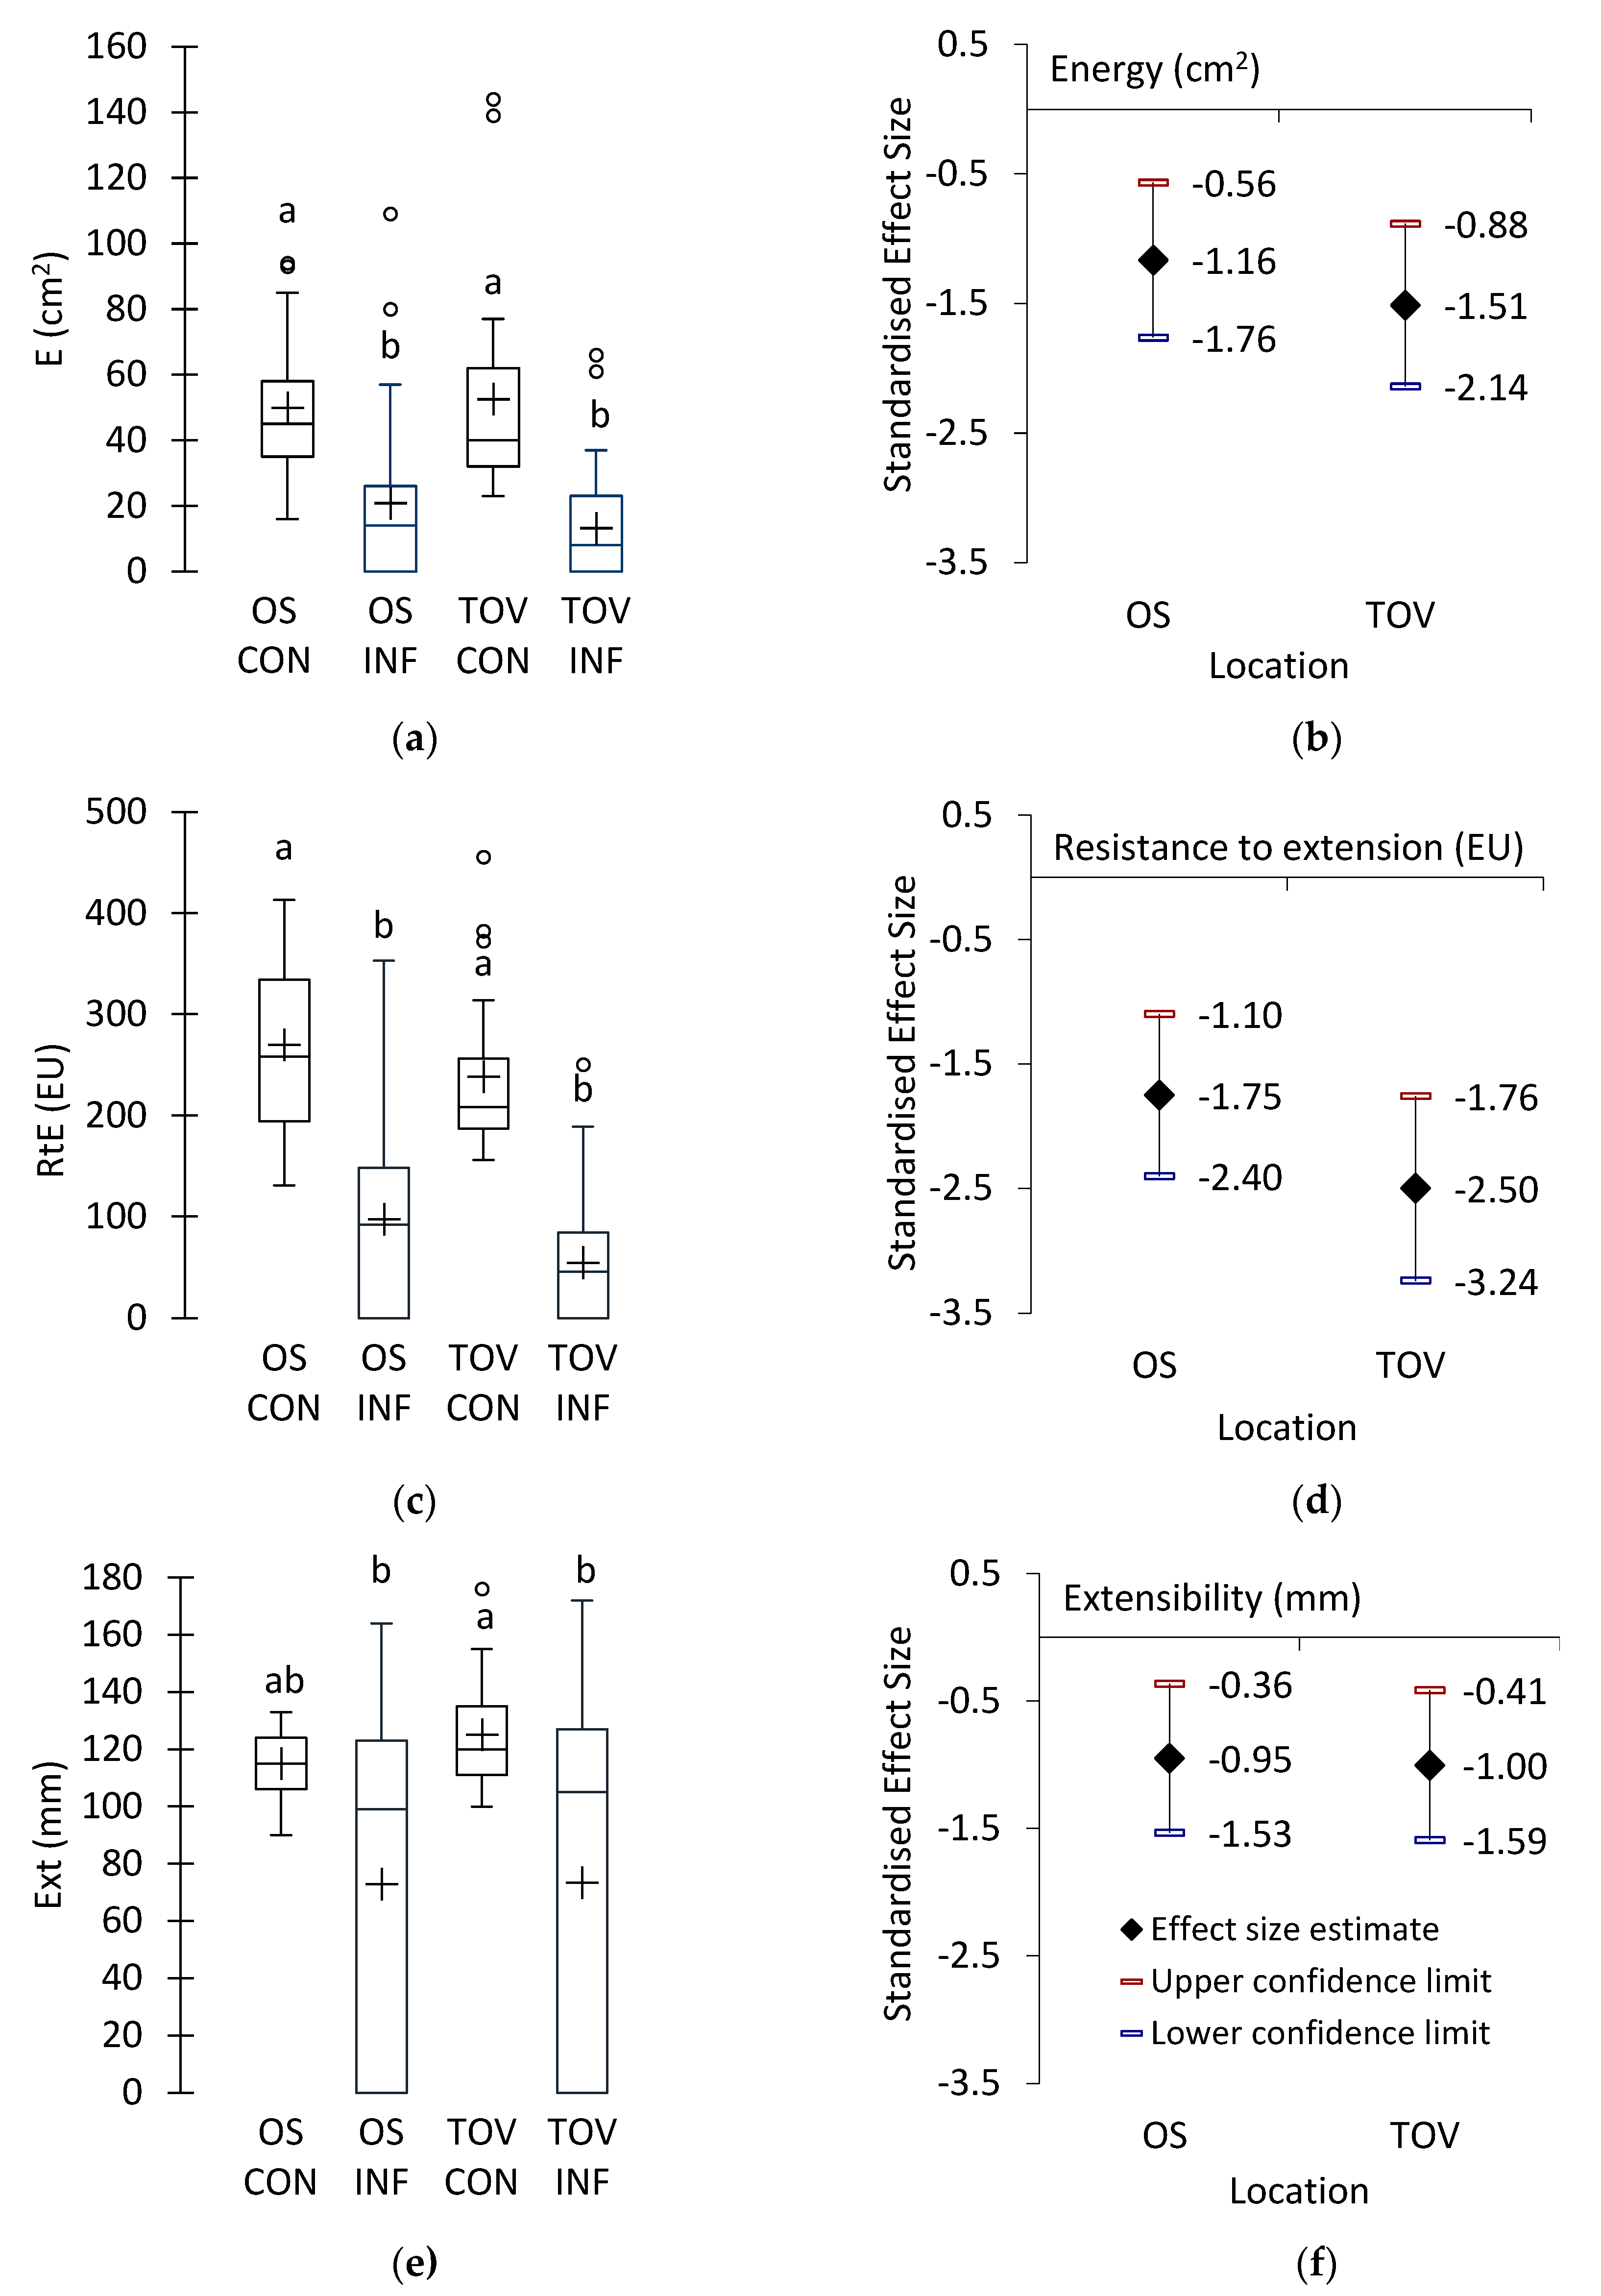
Since indices of dough processing characteristics measured on the extensograph were not normally distributed and had different distributions in uninfected and FHB-infected samples at both locations, the non-parametric Kruskal–Wallis ANOVA was used to show differences among the medians of the tested parameters (location, treatment). The results showed significant differences among tested samples for energy—E in cm2 (Kruskal–Wallis χ2 = 42.9, c = 7.815, p < 0.0001), resistance to extension—RtE in EU (Kruskal–Wallis χ2 = 55.5, c = 7.815, p < 0.0001) and extensibility—Ext in mm (Kruskal–Wallis χ2 = 11.9, c = 7.815, p = 0.007). Multiple pairwise comparisons using the Conover–Iman procedure showed no difference in E, RtE, and Ext between control samples grown at Osijek and Tovarnik locations (Figure 5a,c,e). However, FHB infection resulted in a significant decrease in the extensograph rheological quality of wheat flour in terms of E, RtE, and Ext at both locations. The effect of location on the differences was substantial, and the effect size for the FHB infection was slightly larger at Tovarnik for E and RtE but not for Ext (Figure 5b,d,e).

3.4. Multivariate Analysis

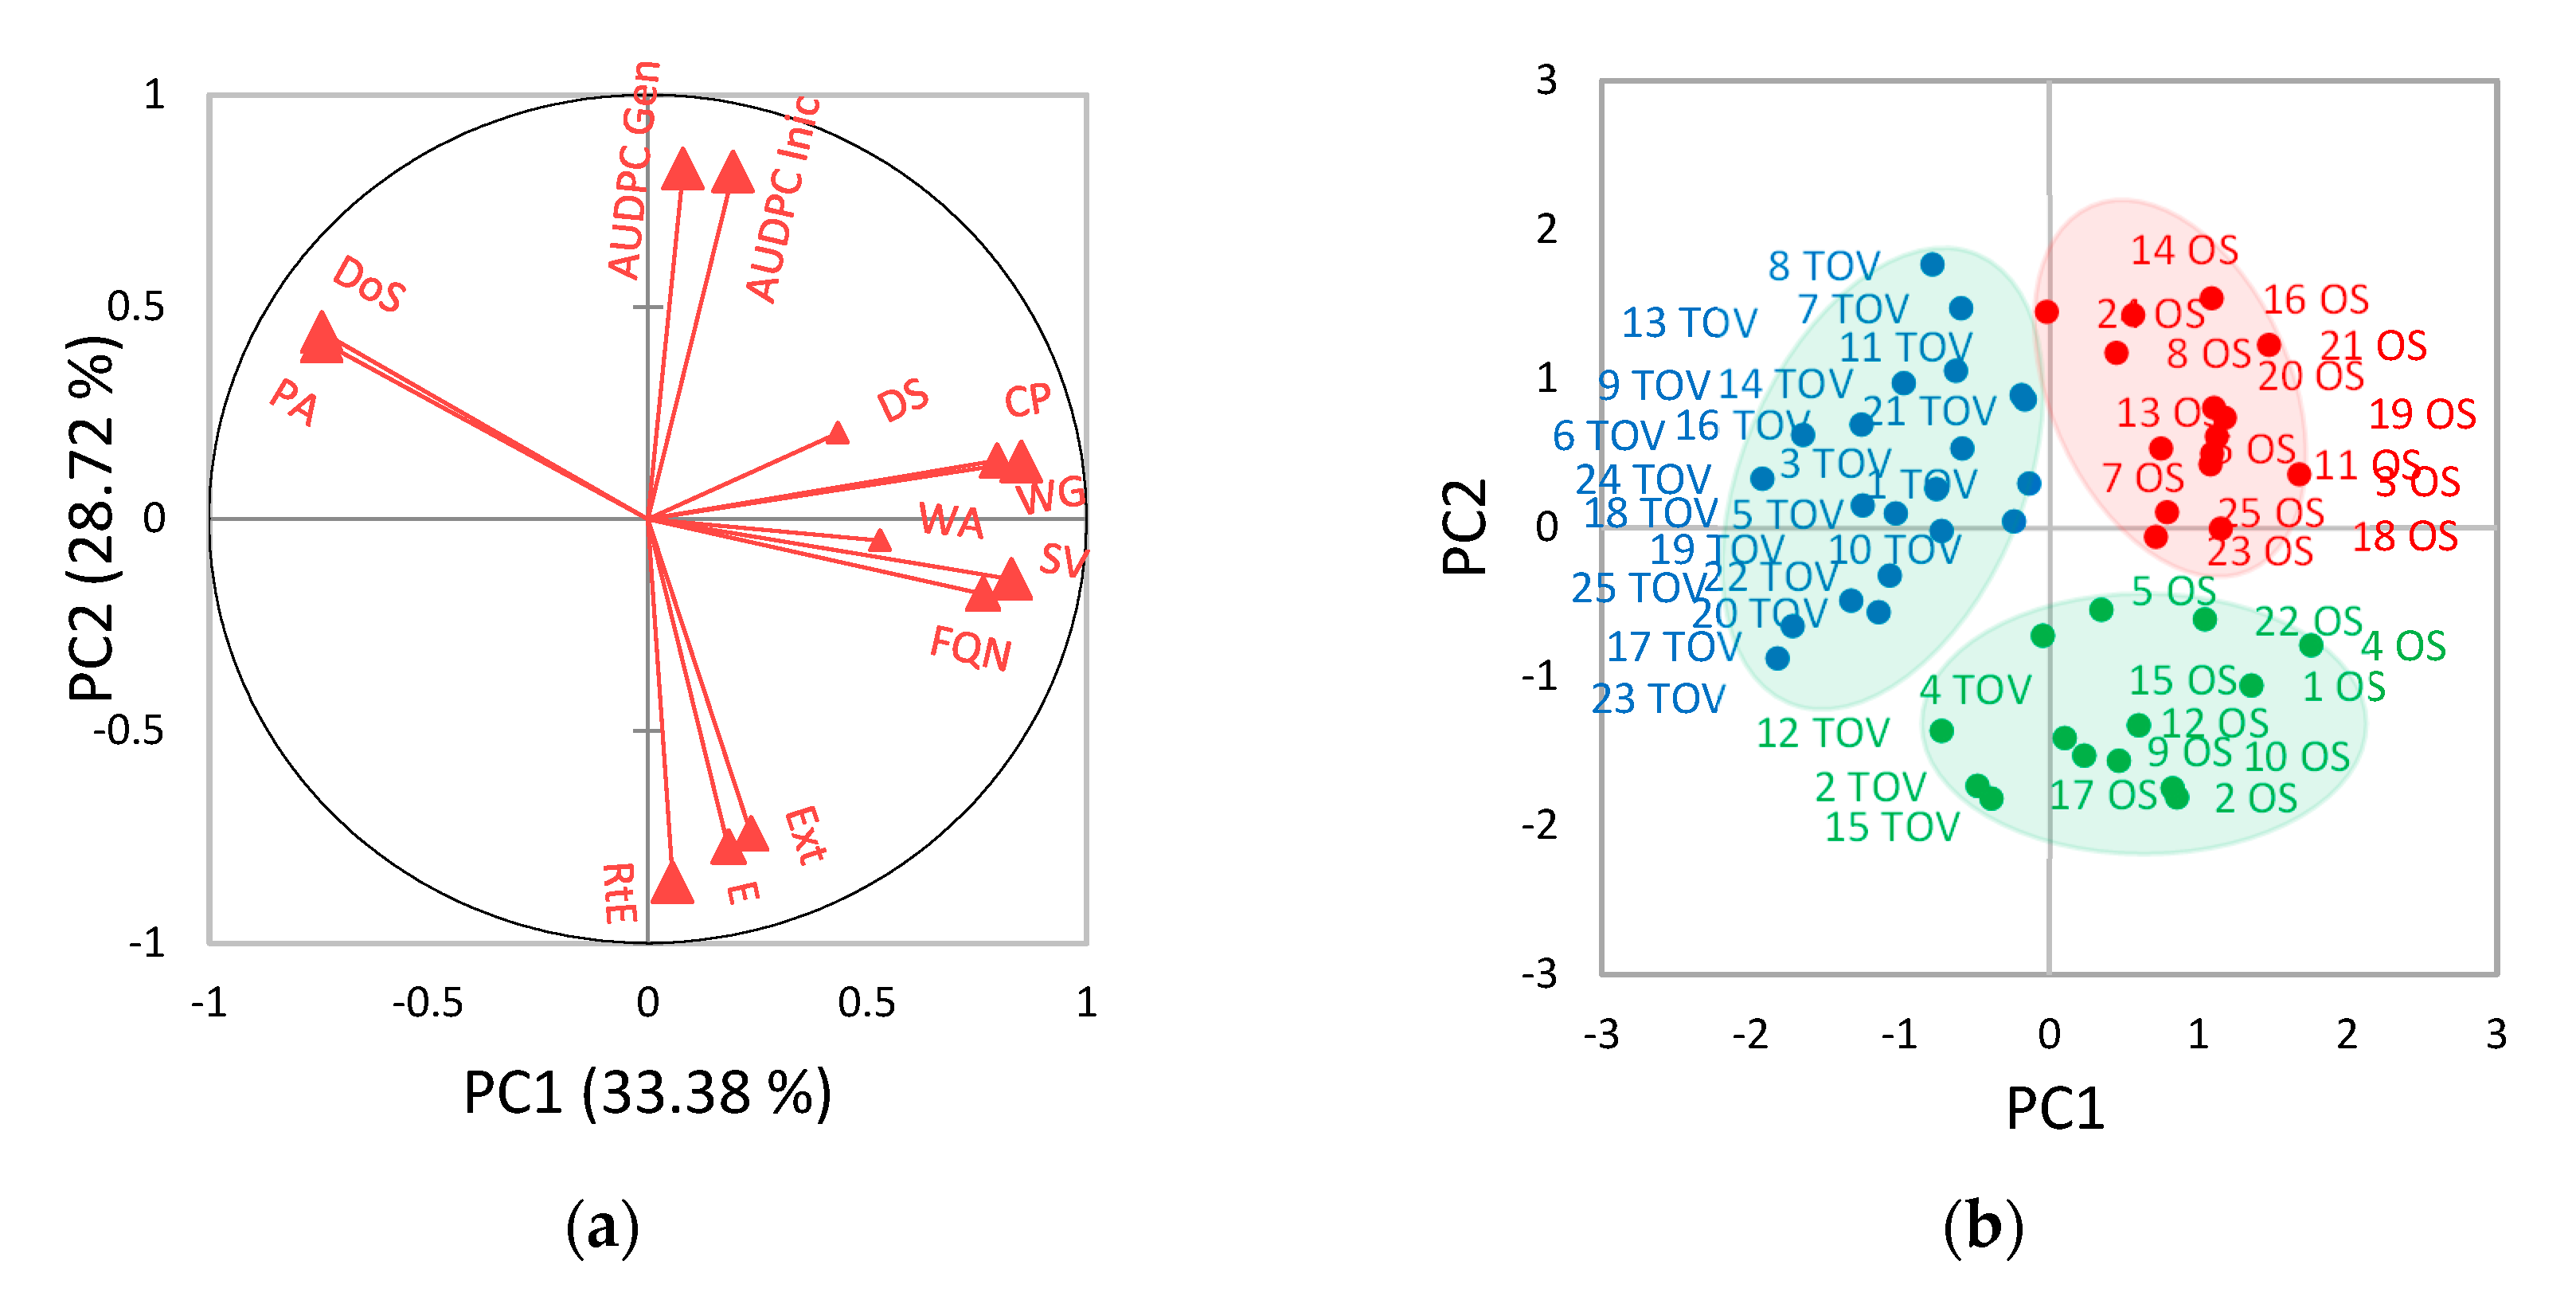
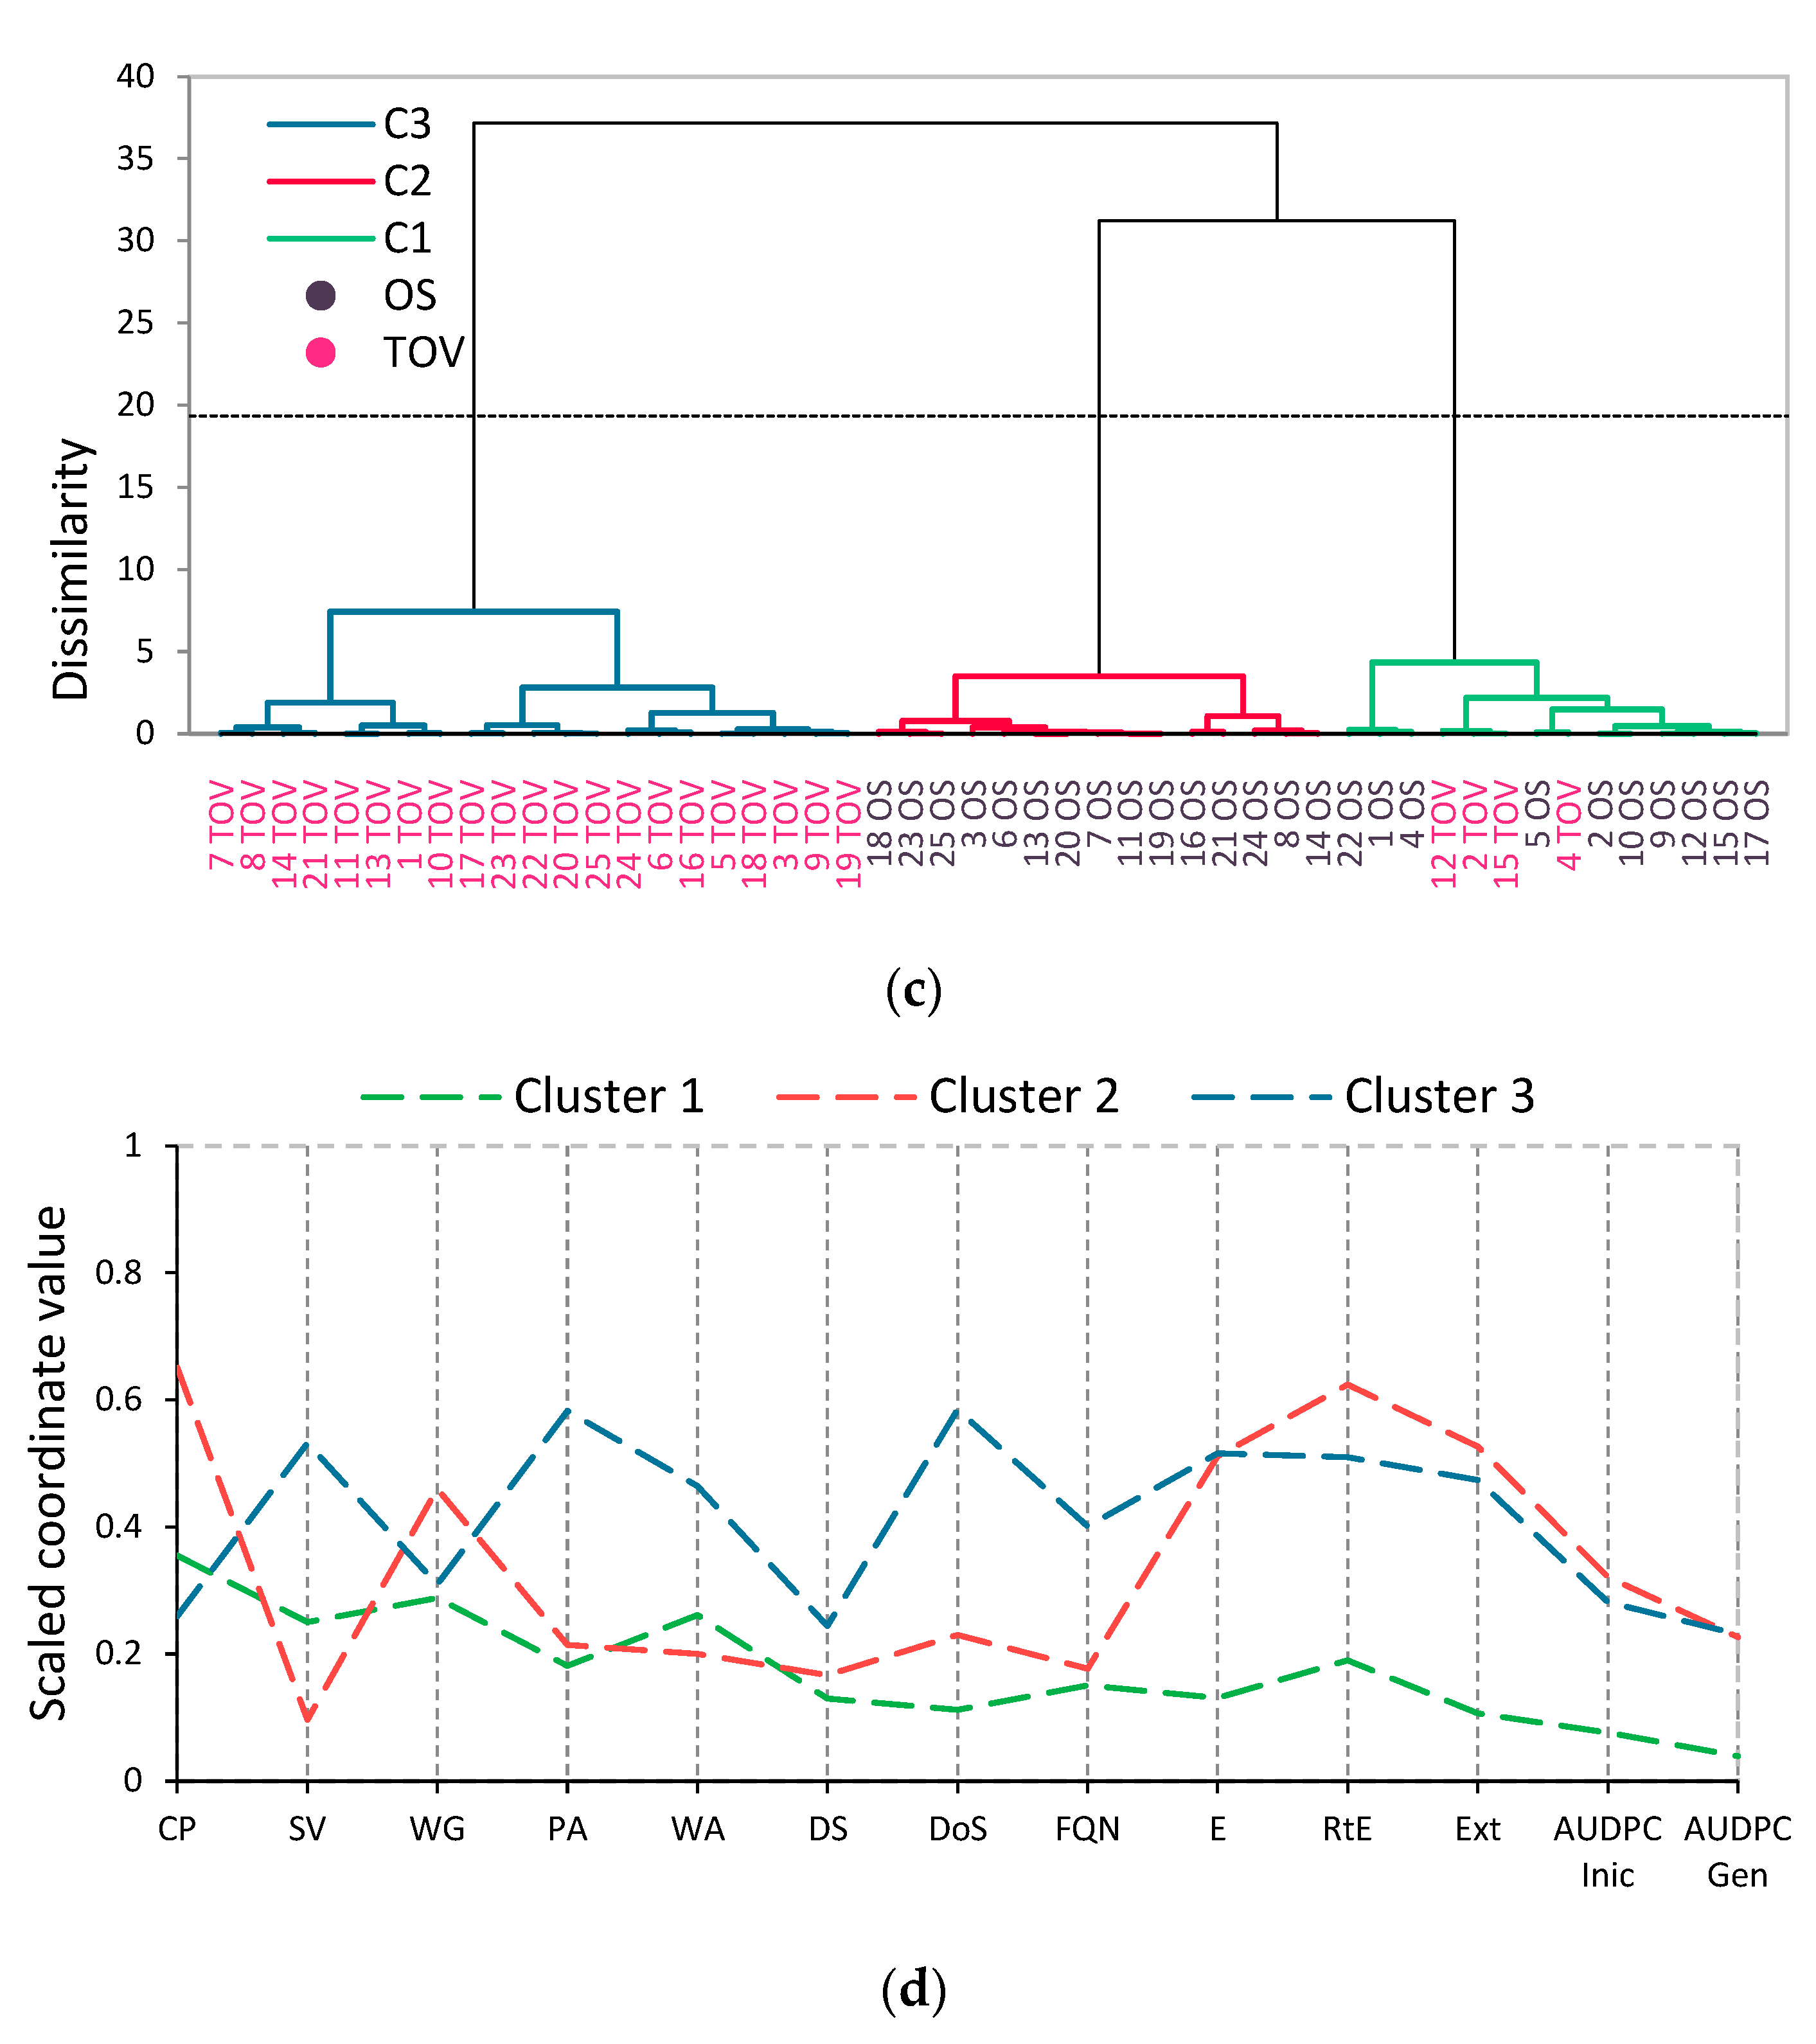
The existence of outliers and an extensive interquartile range for extensograph indices in infected samples from both locations also revealed a strong influence of genotype variability on the grains’ and flour’s technological quality due to FHB infection. Therefore, a multivariate data analysis based on projection methods was used to observe and uncover the relationships between observations and variables, as well as trends, clusters, and outliers in the data. First, we tested the factorability of 14 variables that measure the impact of Fusarium infection on wheat cultivars’ technological quality and rheological properties. The Spearman correlation matrix revealed that all variables, except FN, were correlated by at least one other variable (Supplementary Material Table S1). Therefore, FN was removed from further analysis. The Keiser–Meyer–Olkin value of 0.743 confirmed sample adequacy, and Bartlett’s test of sphericity confirmed variable suitability for structure detection, allowing factor analysis with the 13 remaining variables. Principal component analysis (PCA) without any rotations was used to group samples of winter wheat cultivars, visualize proximities, and condense the original variables into coherent factors. The first three factors had eigenvalues greater than one and explained 37.2%, 24.9%, and 9.5% of the variance in the dataset, respectively. However, the leveling of eigenvalues in the scree plot suggested a solution with two factors carrying 62.1% of the initial information (Supplementary Material Table S2 and Figure 1). Due to the complexity of variables loaded on both PCs with a loading factor greater than 0.4, we ran exploratory factor analysis with the varimax and oblimin solutions. A correlation of 0.13 between the two factors suggested choosing the varimax solution. Following rotation, PC1 was loaded with eight variables, each explaining grain and flour-specific properties (PC, SV, WG, PA) and farinograph rheological dough properties (WA, DS, DoS, FQN). Figure 6a shows six variables loaded on PC2 that explain the extensograph rheological dough properties (E, RtE, and Ext) and the level of initial and general resistance to Fusarium infection (AUDPC). Observations were then projected onto the main components of PCA, and three groups of samples were generated using agglomerative hierarchical clustering (AHC), as shown in Figure 6b,c. Figure 6c depicts a dendrogram obtained using Ward’s method of minimizing variance, from which an acceptable solution with three clusters is visible: the C1 Cluster (green), which included some samples from Osijek (codes 1, 2, 4, 5, 9, 10, 12, 15, 17, 22 OS) and a few samples from Tovarnik (codes 2, 4, 12, 15 TOV); the C2 Cluster (red), which included the remaining samples from Osijek; and the C3 Cluster (blue), which included the majority of samples from Tovarnik.
Further analysis included a parallel coordinate plot of differences with mean rescaled distance values from 0 to 1 to validate and describe each cluster (Figure 6d). As can be seen, a sharp increase in the distance measure value indicates a lower association between the clusters. The results suggested that cultivars of the first cluster (green) show the slightest changes in grain and flour technological and specific properties due to FHB infection. They also had the highest resistance to FHB infection (low AUDPC values) and the smallest changes in dough properties. Cluster 2 (red) cultivars grown in Osijek showed the greatest changes in protein and wet gluten content, as well as in extensograph dough processing characteristics, but the smallest changes in protein quality, protease activity, and farinograph rheological properties due to FHB infection. Finally, the third cluster (blue), which includes the majority of cultivars grown at Tovarnik, exhibits low changes in protein content, wet gluten content, and dough stability but significant changes in protein quality, protease activity, and farinograph dough properties as a result of FHB infection. Both red and blue clusters mainly showed lower resistance to FHB infection, but there was no significant difference between them in AUDPC values for initial and general resistance values.

4. Discussion

In plant breeding, multi-environment trials identify superior genotypes with desirable traits. This task, however, is difficult due to the prevalence of genotype-environment interaction (GEI) [52]. Understanding how genotype, environment, and GEI affect wheat grain quality is crucial because it reduces the need for quality-based selection [53]. The significance of assessment, quantification, and the degree to which elements like the environment and GEI are accountable for phenotypic variation in different quality parameters have been reported previously [54]. We used two treatments on the different types of wheat we tested at both of our experimental locations. The first treatment consisted of naturally grown wheat without the use of fungicides, while the second treatment utilized wheat varieties that had been subjected to intense FHB. The purpose of the experiment was to accurately select wheat varieties with superior traits by evaluating and quantifying the effects of genotype, environment, and GEI on wheat grain and flour quality. Predictably, the results demonstrated that the response of 25 winter wheat cultivars to FHB infection was significantly influenced by genotype variability and by the location of their growth (Osijek vs. Tovarnik).

4.1. Influence of Fusarium Infection and Nonspecific Proteolytic Activity on Technological Quality of Wheat Cultivars Grown at Two Locations

Protein and wet gluten content in wheat grain and flour of uninfected (control) cultivars were considerably influenced by testing location, with greater values in grains grown in Tovarnik. On the one hand, this may result from climatic conditions, such as temperature and precipitation during the grain-filling period. On the other hand, it can be a consequence of soil type and quality. Additionally, it is acknowledged that grains’ protein content corresponds strongly with flour’s protein content and quality [55,56]. Despite the fact that Tovarnik received slightly more rain than Osijek, particularly during the critical grain-filling stage [29], and that standard agro-technical measures were applied at both locations, we presume that the higher protein content in the control samples from Tovarnik is more likely due to the type and quality of the soil. The soil at Tovarnik is a humus-rich, dark Chernozem high in phosphorus and ammonium compounds. In comparison, the soil in Osijek is Eutric Cambisol, a slightly acidic to neutral soil with lower humus and phosphorus concentrations and a moderately higher clay content [29]. This implies that Tovarnik soil was able to provide more nutrients required for wheat growth, resulting in higher protein content. Furthermore, multiple authors [57,58,59,60,61,62] stated that nitrogen-rich soil increases protein content and influences protein composition in wheat grains. It has also been suggested that environmental factors, rather than inherited traits, have a greater impact on protein content [63].
Another quality trait reported to be highly influenced by genotype, environment, and GEI is wet gluten content [64]. Wheat flour samples from these two locations showed an intriguing correlation between FHB infection and the amount of protein and wet gluten content. Among all cultivars, wheat samples from Osijek had higher protein and gluten concentrations after being infected with FHB. Infected wheat grown in Tovarnik didn’t appear to lose any protein or the proportion of wet gluten. However, sedimentation values decreased in the Tovarnik samples while remaining unchanged in the Osijek samples. Previous research primarily indicated a decrease in the quality of Fusarium spp.-infected wheat flour, particularly in terms of protein content and total glutenin, a composition of gluten [24,31,65]. Furthermore, it has been shown that fungal protease enzymes secreted at a later stage of infection break down gluten, resulting in a deterioration of wheat flour quality and its industrial properties [66]. Protease activity was observed to be more stable when scCO2, which is utilized in the food technology industry, was introduced as compared to other enzymes [67]. Moreover, the intensity of infection influences inter-genotypic variability in specific quality measures of flour [68,69,70]. For instance, Ortega et al. [71] discovered that the greater severity and virulence of infection resulted in a more significant decrease in protein content. This is consistent with Wang et al. [33], who discovered that a more potent infection with F. culmorum resulted in a more significant glutenin reduction. Another example of the relationship between disease and protein content was explained by Eggert et al. [72], who investigated the effects of naturally occurring and artificially generated diseases and found that artificial infection leads to significantly lower protein values.
On the other hand, the not-so-strong influence of infection was determined in the work of Gärtner et al. [23]. Fungal proteins can contribute to the overall protein content, according to Boyacioǧlu and Hettiarachchy [65]. However, Eggert et al. [72] found that only 0.3% of the total protein in infected wheat was of fungal origin. We suggest that the average increase in protein content and lack of change in protein quality found in Osijek samples may be due to the activation of defense-related proteins by establishing systematic resistance in plants. This is further supported by the higher frequency of wheat samples from Osijek having lower AUDPC values during the reproductive period, which is consistent with our findings that more cultivars displayed better FHB resistance in Osijek than in Tovarnik. Moreover, the increase in protein content in infected samples may be attributable to a shift in the starch-to-protein ratio in favor of protein content [73] due to the fungal consumption of carbohydrates [33]. Even if the total amount of protein remained relatively consistent in most cultivars grown at Tovarnik, the data demonstrated that the protein quality was altered by the FHB infection. As previously indicated, increased precipitation and moisture during wheat growth could have made cultivars susceptible to FHB disease. Therefore, a slightly higher infection intensity caused an enzymatic breakdown of proteins by pathogens, which can explain the decline in wheat’s protein quality (due to increased swelling) and is consistent with the findings of Gärtner et al. [23]. This suggests that FHB infection during grain-filling reduces the availability of high-quality proteins in the grain, lowering protein quality. Protein content was shown to be somewhat affected by protease activity in severely infected wheat samples, which may have implications for dough qualities, according to another study [74]. However, because FHB infection does not always influence grain starch and protein content equally [25], the rationale may lie in the early buildup of stored proteins during the grain-filling stage.

4.2. Influence of Fusarium Infection and Nonspecific Proteolytic Activity on Rheological Quality of Wheat Cultivars Grown at Two Locations

Functional properties of dough are usually evaluated with mixograph, alveograph, and farinograph analysis [75]. The current research used a farinograph to determine water absorption, stability, and the quality number of the dough, as well as the degree of dough softening. Among the tested wheat flour samples in this study, there are no statistically significant differences in water absorption or stability of the dough, although a significant difference exists for the degree of dough softening due to FHB infection. The ability to absorb water is one of the most important indications of flour quality since it directly influences the quality and yield of the final product, and it is essential in order to establish flour strength and estimate bakery product prices [76]. Martin et al. [77] observed that infection and changes in environmental conditions had a minor impact on water absorption but a significant effect on the dough stability and the degree of softening. Regarding the water absorption capacity, Okuda et al. [78] note that the average values for the water absorption capacity of wheat flour vary from 50 to 70%, similar to the results found in this research. Some studies have demonstrated a slight increase in water absorption with an increase in the severity of Fusarium spp. infection [33] due to a larger fraction of damaged starch granules in infected wheat. Protein-rich cultivars have been found to have a greater capacity to absorb water [79]. However, this investigation confirms our prior findings that protein-rich cultivars show decreased water absorption following FHB infection [29].
The FHB infection showed the most significant influence on the degree of dough softening variability, where the estimated effect of the infection on the samples from Tovarnik was three times larger than the infection effect on the Osijek wheat samples. It was discovered that FHB infection enhanced the degree of dough softening for all wheat cultivars, which is in line with some previous research [77]. Because it interferes with grain maturation and the digestion of starch and protein in food, FHB disease lowers the quality of wheat end products [80]. The degree of softening and the stability of the dough reflect the highly elastic properties of the dough that gluten is responsible for, and a low degree of softening indicates that the gluten proteins were intact [81]. In fact, the good dough stability and lesser degree of softening imply that such dough is also suited for more extensive mechanical processing. This investigation showed a substantial positive association between the activity of proteases and the degree of softening of the dough, which is in line with previous research [76] that suggested that dough softening might be used as an indicator of proteolytic degradation of proteins. Furthermore, exogenous proteases originating from Fusarium spp. can remain dormant in stored grains but might be reactivated during dough preparation, thus influencing dough characteristics and the baking process [35]. As for the extensograph values, it was determined that only FHB infection significantly affected changes in the resistance to stretching, extensibility, and total stretching energy. Significantly lower values were discovered in samples of infected flour from both locations, with the effect of infection being slightly more pronounced in samples from the Tovarnik location.
The presence of outliers and an extensive interquartile range for extensograph indices in infected samples from both locations also revealed a strong influence of genotype variability on the grains’ and flour’s technological quality. Due to the inability to replicate technological and rheological properties, it was not possible to confirm the significance of the influence of genotype on these characteristics; therefore, the strength of the effect of genotype as a variable was determined for the activity of nonspecific proteases, considering the influence of location and intensity of FHB infection. Even though no significant differences were determined in the average activity of specific proteases between control wheat flour samples from Osijek and Tovarnik, the difference analysis indicated that some cultivars displayed consistent protease activity across sites. In contrast, others showed variability in their response due to environmental conditions. Therefore, the inclusion of genotypic variability in the model revealed that genotype significantly influences differences in protease activity.

4.3. Multivariate Analysis of Quality Parameters among 25 Winter Wheat Varieties at Two Locations under Two Treatments

A multivariate data analysis based on projection methods uncovered the relationships between observations and variables. The results showed that dough formation depends on several factors, including the initial and general resistance to Fusarium infection. Nightingale et al. [31] attributed the loss of dough functionality and volume to exogenous fungal proteases. Because Fusarium proteases remain active throughout all stages of dough processing, longer resting processes result in a greater loss of dough strength and bread shape [26]. Further analysis showed that some of the differences between cultivars were due to genetic factors and some to environmental ones. For example, the cultivars in the first cluster (green) grown at both locations provided evidence of a high degree of resistance to FHB infection. However, although cultivars from clusters 2 and 3 had no significant differences in resistance to FHB, they showed distinct responses to the infection, influencing protein quality, protease activity, and dough properties. Thus, it appears that the different geographical regions in which these cultivars were grown affected the wheat response to FHB infection. According to Scala et al. [82], soil management practices and local (micro)environmental conditions may be held responsible for the FHB outbreak. Therefore, it is suggested that the quality of grain and flour products is determined by a combination of genotype, environment, and resistance to FHB. Previous research has shown that environmental conditions, including humidity and temperature, as well as cultivar susceptibility and cultivation methods, all play a role in the likelihood of a crop being infected by Fusarium spp. [2,83]. Surma et al. [84] performed a multivariate analysis and found that genotype and treatment significantly influenced all measured traits. It should be emphasized that most investigations relied on artificial inoculation to acquire Fusarium-infected wheat and that it is anticipated that these samples will produce very high mycotoxin levels. However, specific resistant genotypes may still have some defense against FHB. Thus, we continue to study these strains. Together, these three factors highlight the critical nature of preventing Fusarium infection in the wheat crop and flour milling industry.
However, we must consider the possibility that genetic and environmental factors were influenced by confounding factors, such as the variability of the types used in the tests. Here, multivariate analysis showed that FHB had minimal effect on both technological and rheological variables in the first cluster of wheat cultivars, but this cluster contained only a small number of cultivars displaying low susceptibility to FHB. As a result, we demonstrated that genetic resistance could provide adequate control of FHB, guaranteeing the successful protection of wheat quality, similar to the results of Wegulo et al. [13].

5. Conclusions

It can be concluded that genotype variability strongly influenced the technological quality and rheological properties of wheat cultivars infected with Fusarium head blight (FHB), while testing location had a significant effect on protein content and quality. Three distinct clusters of samples were generated, each exhibiting unique changes in their properties due to FHB infection and displaying varying levels of resistance to the disease. Genotype was the most influential variable affecting differences in protease activity, followed by its interaction with the location. Therefore, we can conclude that conditions at testing locations substantially determine the direction of the FHB infection effect, whether it is an increase, a decline, or an impact without a quantifiable influence. Further research is needed to investigate the specific mechanisms behind the interaction of environmental (location conditions) and genetic factors in determining particular cultivar responses.

Supplementary Materials

The following supporting information can be downloaded at: https://www.mdpi.com/article/10.3390/agronomy13030662/s1. Table S1. Spearman correlation matrix of technical and rheological properties for uninfected and infected winter wheat cultivars (n = 50) grown at two locations (OS and TOV). The display option used is blue-red and presents a negative correlation with cold colors (blue for correlations close to −1) and positive correlations with warm colors (red for correlations close to 1). Values in bold differ from 0 with a significance level α = 0.05; * p < 0.05, ** p < 0.01, *** p < 0.001. Table S2. Eigenvalues and the proportion of explained variation by the principal components. Figure S1. The scree plot for the eigenvalues of factors arranged in descending order of magnitude with explained cumulative variability. Table S3. Correlations between variables and factors in principal component analysis before and after varimax rotation. Table S4. PCA of genotypes characteristics factor scores and contribution to the main components after Varimax rotation. Values in bold correspond for each observation to the component for which the squared cosine is the largest (data not shown) to avoid interpretation errors due to projection effects (for example, when the squared cosines associated with the axes used on a chart are low, the position of the observation in question cannot be interpreted). Yellow to green color scale is used to visualize contribution (green high, yellow low). Figure S2. Violin plot of initial and general resistance to Fusarium infection (AUDPC-In and AUDPC-Gen) of tested winter wheat cultivars grown at two distinct locations (OS—Osijek and TOV—Tovarnik). Box plots represent the interquartile range with a mean (+) and median (−), whiskers show 1.5 × IQR, and dots outliers, and the shape of the violin display frequencies of values. The broader distribution illustrates a higher frequency of data points at those values.

Author Contributions

Conceptualization, V.Š. and V.P.; methodology, V.Š., J.B., I.V. and V.P.; software, V.Š. and V.P.; validation, V.Š. and V.P.; formal analysis I.B.; investigation, V.Š., I.B., J.B., I.V. and V.P.; resources, V.Š.; data curation, V.Š. and V.P.; writing—original draft preparation, V.P.; writing—review and editing, V.Š. and V.P.; visualization, V.P.; supervision, V.Š.; project administration, V.Š.; funding acquisition, V.Š. All authors have read and agreed to the published version of the manuscript.

Funding

This research was funded by the European Union, which provided the EUROPEAN REGIONAL DEVELOPMENT FUND, grant number KK.01.1.1.04.0067.

Data Availability Statement

Not applicable.

Acknowledgments

We acknowledge Kristina Lutrov, dipl. ing., for technical help during the quality assessment.

Conflicts of Interest

The authors declare no conflict of interest. The funders had no role in the design of the study; in the collection, analyses, or interpretation of data; in the writing of the manuscript; or in the decision to publish the results.

References

  1. Leslie, J.F.; Moretti, A.; Mesterházy, Á.; Ameye, M.; Audenaert, K.; Singh, P.K.; Richard-Forget, F.; Chulze, S.N.; Ponte, E.M.; del Chala, A.; et al. Key Global Actions for Mycotoxin Management in Wheat and Other Small Grains. Toxins 2021, 13, 725. [Google Scholar] [CrossRef]
  2. Alconada, T.M.; Moure, M.C.; Ortega, L.M. Fusarium Infection in Wheat, Aggressiveness and Changes in Grain Quality: A Review. Vegetos 2019, 32, 441–449. [Google Scholar] [CrossRef]
  3. Bellesi, F.J.; Arata, A.F.; Martínez, M.; Arrigoni, A.C.; Stenglein, S.A.; Dinolfo, M.I. Degradation of Gluten Proteins by Fusarium Species and Their Impact on the Grain Quality of Bread Wheat. J. Stored Prod. Res. 2019, 83, 1–8. [Google Scholar] [CrossRef]
  4. O’Donnell, K.; Kistler, H.C.; Tacke, B.K.; Casper, H.H. Gene Genealogies Reveal Global Phylogeographic Structure and Reproductive Isolation among Lineages of Fusarium graminearum, the Fungus Causing Wheat Scab. Proc. Natl. Acad. Sci. USA 2000, 97, 7905–7910. [Google Scholar] [CrossRef] [Green Version]
  5. Goswami, R.S.; Kistler, H.C. Heading for Disaster: Fusarium Graminearum on Cereal Crops. Mol. Plant Pathol. 2004, 5, 515–525. [Google Scholar] [CrossRef] [PubMed]
  6. Xu, X.-M.; Nicholson, P.; Thomsett, M.A.; Simpson, D.; Cooke, B.M.; Doohan, F.M.; Brennan, J.; Monaghan, S.; Moretti, A.; Mule, G.; et al. Relationship between the Fungal Complex Causing Fusarium Head Blight of Wheat and Environmental Conditions. Phytopathology 2008, 98, 69–78. [Google Scholar] [CrossRef] [Green Version]
  7. Marček, T.; Vuletić, M.V.; Bakula, I.; Alivojvodić, S.; Španić, V. Time-Course Experiment of Fusarium Infestation of Wheat Genotypes with the Emphasis on the Physiological Response. Croat. J. Food Sci. Technol. 2018, 10, 58–63. [Google Scholar] [CrossRef]
  8. Španić, V.; Zdunić, Z.; Drezner, G.; Vuletić, M. Differences in Physiological Traits at the Initial Stage of Fusarium Head Blight Infection in Wheat. Biol. Plant 2020, 64, 174–181. [Google Scholar] [CrossRef]
  9. Martínez, M.; Biganzoli, F.; Arata, A.; Dinolfo, M.I.; Rojas, D.; Cristos, D.; Stenglein, S. Warm Nights Increase Fusarium Head Blight Negative Impact on Barley and Wheat Grains. Agric. For. Meteorol. 2022, 318, 108909. [Google Scholar] [CrossRef]
  10. Siou, D.; Gélisse, S.; Laval, V.; Repinçay, C.; Canalès, R.; Suffert, F.; Lannou, C. Effect of Wheat Spike Infection Timing on Fusarium Head Blight Development and Mycotoxin Accumulation. Plant Pathol. 2014, 63, 390–399. [Google Scholar] [CrossRef]
  11. del Ponte, E.M.; Fernandes, J.M.C.; Bergstrom, G.C. Influence of Growth Stage on Fusarium Head Blight and Deoxynivalenol Production in Wheat. J. Phytopathol. 2007, 155, 577–581. [Google Scholar] [CrossRef] [Green Version]
  12. Schaafsma, A.W.; Tamburic-Ilincic, L.; Hooker, D.C. Effect of Previous Crop, Tillage, Field Size, Adjacent Crop, and Sampling Direction on Airborne Propagules of Gibberella Zeae/Fusarium Graminearum, Fusarium Head Blight Severity, and Deoxynivalenol Accumulation in Winter Wheat. Can. J. Plant Pathol. 2005, 27, 217–224. [Google Scholar] [CrossRef]
  13. Wegulo, S.N.; Baenziger, P.S.; Hernandez Nopsa, J.; Bockus, W.W.; Hallen-Adams, H. Management of Fusarium Head Blight of Wheat and Barley. Crop Protection 2015, 73, 100–107. [Google Scholar] [CrossRef]
  14. Champeil, A.; Fourbet, J.F.; Doré, T.; Rossignol, L. Influence of Cropping System on Fusarium Head Blight and Mycotoxin Levels in Winter Wheat. Crop Protection 2004, 23, 531–537. [Google Scholar] [CrossRef]
  15. Kollers, S.; Rodemann, B.; Ling, J.; Korzun, V.; Ebmeyer, E.; Argillier, O.; Hinze, M.; Plieske, J.; Kulosa, D.; Ganal, M.W.; et al. Whole Genome Association Mapping of Fusarium Head Blight Resistance in European Winter Wheat (Triticum Aestivum L.). PLoS ONE 2013, 8, e0057500. [Google Scholar] [CrossRef] [Green Version]
  16. Zhu, Z.; Hao, Y.; Mergoum, M.; Bai, G.; Humphreys, G.; Cloutier, S.; Xia, X.; He, Z. Breeding Wheat for Resistance to Fusarium Head Blight in the Global North: China, USA, and Canada. Crop J. 2019, 7, 730–738. [Google Scholar] [CrossRef]
  17. Wu, F.; Zhou, Y.; Shen, Y.; Sun, Z.; Li, L.; Li, T. Linking Multi-Omics to Wheat Resistance Types to Fusarium Head Blight to Reveal the Underlying Mechanisms. Int. J. Mol. Sci. 2022, 23, 2280. [Google Scholar] [CrossRef]
  18. Schroeder, H.W.; Christensen, J.J.; Christensen, J.D.; Platz-Christensen, J.; Schroeder, H.W. Factors Affecting Resistance of Wheat to Scab Caused by Gibberella zeae. Phytopathology 1963, 53, 831–838. [Google Scholar]
  19. Steiner, B.; Lemmens, M.; Griesser, M.; Scholz, U.; Schondelmaier, J.; Buerstmayr, H. Molecular Mapping of Resistance to Fusarium Head Blight in the Spring Wheat Cultivar Frontana. Theor. Appl. Genet. 2004, 109, 215–224. [Google Scholar] [CrossRef]
  20. Buerstmayr, M.; Wagner, C.; Nosenko, T.; Omony, J.; Steiner, B.; Nussbaumer, T.; Mayer, K.F.X.; Buerstmayr, H. Fusarium Head Blight Resistance in European Winter Wheat: Insights from Genome-Wide Transcriptome Analysis. BMC Genom. 2021, 22, 470. [Google Scholar] [CrossRef]
  21. Drakopoulos, D.; Kägi, A.; Six, J.; Zorn, A.; Wettstein, F.E.; Bucheli, T.D.; Forrer, H.-R.; Vogelgsang, S. The Agronomic and Economic Viability of Innovative Cropping Systems to Reduce Fusarium Head Blight and Related Mycotoxins in Wheat. Agric. Syst. 2021, 192, 103198. [Google Scholar] [CrossRef]
  22. Magan, N.; Aldred, D. Post-Harvest Control Strategies: Minimizing Mycotoxins in the Food Chain. Int. J. Food Microbiol. 2007, 119, 131–139. [Google Scholar] [CrossRef] [PubMed] [Green Version]
  23. Gärtner, B.H.; Munich, M.; Kleijer, G.; Mascher, F. Characterisation of Kernel Resistance against Fusarium Infection in Spring Wheat by Baking Quality and Mycotoxin Assessments. Eur. J. Plant Pathol. 2007, 120, 61–68. [Google Scholar] [CrossRef]
  24. Kreuzberger, M.; Limsuwan, S.; Eggert, K.; Karlovsky, P.; Pawelzik, E.; Eggert, M. Impact of Fusarium Spp. Infection of Bread Wheat (Triticum Aestivum L.) on Composition and Quality of Flour in Association with EU Maximum Level for Deoxynivalenol. J. Appl. Bot. Food Qual. 2015, 88, 177–185. [Google Scholar] [CrossRef]
  25. Matthäus, K.; Dänicke, S.; Vahjen, W.; Simon, O.; Wang, J.; Valenta, H.; Meyer, K.; Strumpf, A.; Ziesenib, H.; Flachowsky, G. Progression of Mycotoxin and Nutrient Concentrations in Wheat after Inoculation with Fusarium Culmorum. Arch. Anim. Nutr. 2004, 58, 19–35. [Google Scholar] [CrossRef] [PubMed]
  26. Bacala, R.; Fu, B.X.; Cordova, K.; Hatcher, D.W. Wheat Fusarium Protease Specificity and Effect on Dough Properties. Foods 2021, 10, 1585. [Google Scholar] [CrossRef]
  27. Horvat, D.; Španić, V.; Dvojković, K.; Šimić, G.; Magdić, D.; Nevistić, A. The Influence of Fusarium Infection on Wheat (Triticum Aestivum L.) Proteins Distribution and Baking Quality. Cereal Res. Commun. 2015, 43, 61–71. [Google Scholar] [CrossRef] [Green Version]
  28. Berghofer, L.K.; Hocking, A.D.; Miskelly, D.; Jansson, E. Microbiology of Wheat and Flour Milling in Australia. Int. J. Food Microbiol. 2003, 85, 137–149. [Google Scholar] [CrossRef]
  29. Španić, V.; Dvojković, K.; Babić, J.; Drezner, G.; Zdunić, Z. Fusarium Head Blight Infestation in Relation to Winter Wheat End-Use Quality—A Three-Year Study. Agronomy 2021, 11, 1648. [Google Scholar] [CrossRef]
  30. Diaz-Mendoza, M.; Diaz, I.; Martinez, M. Insights on the Proteases Involved in Barley and Wheat Grain Germination. Int. J. Mol. Sci. 2019, 20, 2087. [Google Scholar] [CrossRef] [Green Version]
  31. Nightingale, M.J.; Marchylo, B.A.; Clear, R.M.; Dexter, J.E.; Preston, K.R. Fusarium Head Blight: Effect of Fungal Proteases on Wheat Storage Proteins. Cereal Chem. J. 1999, 76, 150–158. [Google Scholar] [CrossRef]
  32. Eggert, K.; Rawel, H.M.; Pawelzik, E. In Vitro Degradation of Wheat Gluten Fractions by Fusarium Graminearum Proteases. Eur. Food Res. Technol. 2011, 233, 697–705. [Google Scholar] [CrossRef] [Green Version]
  33. Wang, J.; Wieser, H.; Pawelzik, E.; Weinert, J.; Keutgen, A.J.; Wolf, G.A. Impact of the Fungal Protease Produced by Fusarium Culmorum on the Protein Quality and Breadmaking Properties of Winter Wheat. Eur. Food Res. Technol. 2005, 220, 552–559. [Google Scholar] [CrossRef]
  34. van Oort, M. Enzymes in Bread Making. In Enzymes in Food Technology; Wiley-Blackwell: Oxford, UK, 2009; pp. 103–143. [Google Scholar]
  35. Koga, S.; Rieder, A.; Ballance, S.; Uhlen, A.K.; Veiseth-Kent, E. Gluten-Degrading Proteases in Wheat Infected by Fusarium Graminearum—Protease Identification and Effects on Gluten and Dough Properties. J. Agric. Food Chem. 2019, 67, 11025–11034. [Google Scholar] [CrossRef] [PubMed]
  36. Pekkarinen, A.I.; Jones, B.L. Purification and Identification of Barley (Hordeum Vulgare L.) Proteins That Inhibit the Alkaline Serine Proteinases of Fusarium Culmorum. J. Agric. Food Chem. 2003, 51, 1710–1717. [Google Scholar] [CrossRef] [PubMed]
  37. Xu, L.; Wang, H.; Zhang, C.; Wang, J.; Chen, A.; Chen, Y.; Ma, Z. System-Wide Characterization of Subtilases Reveals That Subtilisin-like Protease FgPrb1 of Fusarium Graminearum Regulates Fungal Development and Virulence. Fungal Genet. Biol. 2020, 144, 103449. [Google Scholar] [CrossRef]
  38. Elagamey, E.; Abdellatef, M.A.E.; Arafat, M.Y. Proteomic Insights of Chitosan Mediated Inhibition of Fusarium Oxysporum f. Sp. Cucumerinum. J. Proteomics 2022, 260, 104560. [Google Scholar] [CrossRef]
  39. Pekkarinen, A.I.; Longstaff, C.; Jones, B.L. Kinetics of the Inhibition of Fusarium Serine Proteinases by Barley (Hordeum Vulgare L.) Inhibitors. J. Agric. Food Chem. 2007, 55, 2736–2742. [Google Scholar] [CrossRef]
  40. Snijders, C.H.A.; van Eeuwijk, F.A. Genotype x Strain Interactions for Resistance to Fusarium Head Blight Caused by Fusarium Culmorum in Winter Wheat. Theor. Appl. Genet. 1991, 81, 239–244. [Google Scholar] [CrossRef]
  41. Zadoks, J.C.; Chang, T.T.; Konzak, C.F. A Decimal Code for the Growth Stages of Cereals. Weed Res. 1974, 14, 415–421. [Google Scholar] [CrossRef]
  42. ICC Standard No. 155; Determination of Wet Gluten Quantity and Quality (Gluten Index Ac. to Perten) of Whole Wheat Meal and Wheat Flour (Triticum Aestivum). International Association for Cereal Science and Technology: Vienna, Austria, 1994.
  43. HRN EN ISO 5529; Wheat—Determination of the Sedimentation Index—Zeleny Test (ISO 5529:2007). ISO: Geneva, Switzerland, 2010.
  44. HR EN ISO 3093; Wheat, Rye and Their Flours, Durum Wheat and Durum Wheat Semolina—Determination of the Falling Number According to Hagberg-Perten. ISO: Geneva, Switzerland, 2009.
  45. Cupp-Enyard, C. Sigma’s Nonspecific Protease Activity Assay—Casein as a Substrate. J. Vis. Exp. 2008, 17, e899. [Google Scholar] [CrossRef]
  46. HRN EN ISO 5530-1; Wheat Flour—Physical Characteristics of Doughs—Part 1: Determination of Water Absorption and Rheological Properties Using a Farinograph. ISO: Geneva, Switzerland, 2015.
  47. HRN EN ISO 5530-2; Wheat Flour—Physical Characteristics of Doughs—Part 2: Determination of Rheological Properties Using an Extensograph. ISO: Geneva, Switzerland, 2015.
  48. Microsoft Corporation Microsoft Excel 2019. Available online: https://office.microsoft.com/excel (accessed on 17 January 2023).
  49. Addinsoft XLSTAT Statistical and Data Analysis Solution 2022. Available online: https://www.xlstat.com (accessed on 17 January 2023).
  50. Hedges, L.V.; Olkin, I. Estimation of a Single Effect Size: Parametric and Nonparametric Methods. In Statistical Methods for Meta-Analysis; Elsevier: Amsterdam, The Netherlands, 1985; pp. 75–106. [Google Scholar]
  51. Ellis, P.D. The Essential Guide to Effect Sizes: Statistical Power, Meta-Analysis, and the Interpretation of Research Results; Cambridge University Press: Cambridge, UK, 2010. [Google Scholar]
  52. Eltaher, S.; Baenziger, P.S.; Belamkar, V.; Emara, H.A.; Nower, A.A.; Salem, K.F.M.; Alqudah, A.M.; Sallam, A. GWAS Revealed Effect of Genotype × Environment Interactions for Grain Yield of Nebraska Winter Wheat. BMC Genom. 2021, 22, 2. [Google Scholar] [CrossRef]
  53. Surma, M.; Adamski, T.; Banaszak, Z.; Kaczmarek, Z.; Kuczyńska, A.; Majcher, M.; Ługowska, B.; Obuchowski, W.; Salmanowicz, B.; Krystkowiak, K. Effect of Genotype, Environment and Their Interaction on Quality Parameters of Wheat Breeding Lines of Diverse Grain Hardness. Plant Prod. Sci. 2012, 15, 192–203. [Google Scholar] [CrossRef]
  54. Nehe, A.; Akin, B.; Sanal, T.; Evlice, A.K.; Ünsal, R.; Dinçer, N.; Demir, L.; Geren, H.; Sevim, I.; Orhan, Ş.; et al. Genotype x Environment Interaction and Genetic Gain for Grain Yield and Grain Quality Traits in Turkish Spring Wheat Released between 1964 and 2010. PLoS ONE 2019, 14, e0219432. [Google Scholar] [CrossRef] [Green Version]
  55. Williams, R.M.; O’Brien, L.; Eagles, H.A.; Solah, V.A.; Jayasena, V. The Influences of Genotype, Environment, and Genotypeenvironment Interaction on Wheat Quality. Aust. J. Agric. Res. 2008, 59, 95–111. [Google Scholar] [CrossRef]
  56. Abedi, T.; Alemzadeh, A.; Kazemeini, S.A. Wheat Yield and Grain Protein Response to Nitrogen Amount and Timing. Aust. J. Crop Sci. 2011, 5, 330. [Google Scholar]
  57. Wang, R.; Wang, H.; Jiang, G.; Yin, H.; Che, Z. Effects of Nitrogen Application Strategy on Nitrogen Enzyme Activities and Protein Content in Spring Wheat Grain. Agriculture 2022, 12, 1891. [Google Scholar] [CrossRef]
  58. Ghimire, D.; Das, S.; Mueller, N.D.; Creech, C.F.; Santra, D.; Baenziger, P.S.; Easterly, A.C.; Maust, B.; Maharjan, B. Effects of Cultivars and Nitrogen Management on Wheat Grain Yield and Protein. Agron. J. 2021, 113, 4348–4368. [Google Scholar] [CrossRef]
  59. Stupar, V.; Paunović, A.; Madić, M.; Knežević, D.; Đurović, D. Influence of Genotype, Nitrogen Fertilisation, and Weather Conditions on Yield Variability and Grain Quality in Spring Malting Barley. J. Cent. Eur. Agric. 2021, 22, 86–95. [Google Scholar] [CrossRef]
  60. Xue, C.; Matros, A.; Mock, H.-P.; Mühling, K.-H. Protein Composition and Baking Quality of Wheat Flour as Affected by Split Nitrogen Application. Front. Plant Sci. 2019, 10, 642. [Google Scholar] [CrossRef] [PubMed]
  61. Xue, C.; Schulte auf’m Erley, G.; Rücker, S.; Koehler, P.; Obenauf, U.; Mühling, K.H. Late Nitrogen Application Increased Protein Concentration but Not Baking Quality of Wheat. J. Plant Nutr. Soil Sci. 2016, 179, 591–601. [Google Scholar] [CrossRef]
  62. Xue, C.; Erley, G.S.A.; Rossmann, A.; Schuster, R.; Koehler, P.; Mühling, K.H. Split Nitrogen Application Improves Wheat Baking Quality by Influencing Protein Composition Rather than Concentration. Front. Plant Sci. 2016, 7, 738. [Google Scholar] [CrossRef] [PubMed] [Green Version]
  63. Malik, A.H.; Kuktaite, R.; Johansson, E. Combined Effect of Genetic and Environmental Factors on the Accumulation of Proteins in the Wheat Grain and Their Relationship to Breadmaking Quality. J. Cereal Sci. 2013, 57, 170–174. [Google Scholar] [CrossRef]
  64. Zecevic, V.; Knezevic, D.; Boskovic, J.; Madic, M. Effect of Genotype and Environment on Wheat Quality. Genetika 2009, 41, 247–253. [Google Scholar] [CrossRef]
  65. Boyacioǧlu, D.; Hettiarachchy, N.S. Changes in Some Biochemical Components of Wheat Grain That Was Infected with Fusarium Graminearum. J. Cereal Sci. 1995, 21, 57–62. [Google Scholar] [CrossRef]
  66. Barneix, A.J. Physiology and Biochemistry of Source-Regulated Protein Accumulation in the Wheat Grain. J. Plant Physiol. 2007, 164, 581–590. [Google Scholar] [CrossRef]
  67. Leitgeb, M.; Knez, Ž.; Hojnik Podrepšek, G. Effect of Green Food Processing Technology on the Enzyme Activity in Spelt Flour. Foods 2022, 11, 3832. [Google Scholar] [CrossRef]
  68. Tóth, B.; Mesterházy, Á.; Horváth, Z.; Bartók, T.; Varga, M.; Varga, J. Genetic Variability of Central European Isolates of the Fusarium Graminearum Species Complex. Eur. J. Plant Pathol. 2005, 113, 35–45. [Google Scholar] [CrossRef]
  69. Akinsanmi, O.A.; Backhouse, D.; Simpfendorfer, S.; Chakraborty, S. Mycelial Compatibility Reactions of Australian Fusarium Graminearum and F. Pseudograminearum Isolates Compared with AFLP Groupings. Plant Pathol. 2008, 57, 251–261. [Google Scholar] [CrossRef]
  70. Malbrán, I.; Mourelos, C.A.; Girotti, J.R.; Aulicino, M.B.; Balatti, P.A.; Lori, G.A. Aggressiveness Variation of Fusarium Graminearum Isolates from Argentina Following Point Inoculation of Field Grown Wheat Spikes. Crop Prot. 2012, 42, 234–243. [Google Scholar] [CrossRef]
  71. Ortega, L.M.; Moure, M.C.; González, E.M.; Alconada, T.M. Wheat Storage Proteins: Changes on the Glutenins after Wheat Infection with Different Isolates of Fusarium Graminearum. Int. Microbiol. 2019, 22, 289–296. [Google Scholar] [CrossRef] [PubMed]
  72. Eggert, K.; Wieser, H.; Pawelzik, E. The Influence of Fusarium Infection and Growing Location on the Quantitative Protein Composition of (Part I) Emmer (Triticum Dicoccum). Eur. Food Res. Technol. 2010, 230, 837–847. [Google Scholar] [CrossRef] [Green Version]
  73. Pawelzik, E.; Permady, H.H.; Weinert, J.; Wolf, G.A. Effect of Fusarium Contamination on Selected Quality Criteria of Wheat. Getreide Mehl. Brot. 1998, 52, 264–266. [Google Scholar]
  74. Juodeikiene, G.; Basinskiene, L.; Vidmantiene, D.; Bartkiene, E.; Bakutis, B.; Baliukoniene, V. Acoustic Sensing of Deoxynivalenol in Co-Occurrence with Zearalenone and T-2/HT-2 Toxin in Winter Wheat Cultivar Sirvinta from Lithuania. World Mycotoxin J. 2011, 4, 395–404. [Google Scholar] [CrossRef]
  75. Khatkar, B.S.; Bell, A.E.; Schofield, J.D. A Comparative Study of the Inter-Relationships Between Mixograph Parameters and Bread-Making Qualities of Wheat Flours and Glutens. J. Sci. Food Agric. 1996, 72, 71–85. [Google Scholar] [CrossRef]
  76. Hadnađev, T.D.; Torbica, A.; Hadnađev, M. Rheological Properties of Wheat Flour Substitutes/Alternative Crops Assessed by Mixolab. Procedia Food Sci. 2011, 1, 328–334. [Google Scholar] [CrossRef] [Green Version]
  77. Martin, C.; Schöneberg, T.; Vogelsgang, S.; Vincenti, J.; Bertossa, M.; Mauch-Mani, B.; Mascher, F. Factors of Wheat Grain Resistance to Fusarium Head Blight. Phytopathol. Mediterr. 2017, 56, 154–166. [Google Scholar] [CrossRef]
  78. Okuda, R.; Tabara, A.; Okusu, H.; Seguchi, M. Measurement of Water Absorption in Wheat Flour by Mixograph Test. Food Sci. Technol. Res. 2016, 22, 841–846. [Google Scholar] [CrossRef] [Green Version]
  79. Zaidul, I.; Karim, A.A.; Manan, D.; Ariffin, A.; Norulaini, N.N.; Omar, A.M. A Farinograph Study on the Viscoelastic Properties of Sago/Wheat Flour Dough Systems. J. Sci. Food Agric. 2004, 84, 616–622. [Google Scholar] [CrossRef]
  80. Martínez, M.; Ramírez Albuquerque, L.; Arata, A.F.; Biganzoli, F.; Pinto, V.F.; Stenglein, S.A. Effects of Fusarium Graminearum and Fusarium Poae on Disease Parameters, Grain Quality and Mycotoxins Contamination in Bread Wheat (Part I). J. Sci. Food Agric. 2020, 100, 863–873. [Google Scholar] [CrossRef]
  81. Aydoğan, S.; Şahin, M.; Akçacık, A.; Sümerya, A.; Seyfi, H.; Bahri, T.; Uluslararası, D.; Araştırma, T.; Müdürlüğü, E. Relationships between Farinograph Parameters and Bread Volume, Physicochemical Traits in Bread Wheat Flours. J. Bahri Dagdas. Crop Res. 2015, 3(1), 14–18. [Google Scholar]
  82. Scala, V.; Aureli, G.; Cesarano, G.; Incerti, G.; Fanelli, C.; Scala, F.; Reverberi, M.; Bonanomi, G. Climate, Soil Management, and Cultivar Affect Fusarium Head Blight Incidence and Deoxynivalenol Accumulation in Durum Wheat of Southern Italy. Front. Microbiol. 2016, 7, 1014. [Google Scholar] [CrossRef] [PubMed] [Green Version]
  83. Havrlentová, M.; Šliková, S.; Gregusová, V.; Kovácsová, B.; Lančaričová, A.; Nemeček, P.; Hendrichová, J.; Hozlár, P. The Influence of Artificial Fusarium Infection on Oat Grain Quality. Microorganisms 2021, 9, 2108. [Google Scholar] [CrossRef] [PubMed]
  84. Surma, M.; Adamski, T.; Wiśniewska, H.; Kaczmarek, Z.; Mejza, I.; Mejza, S.; Kuczyńska, A.; Krystkowiak, K.; Mikołajczak, K.; Ogrodowicz, P. Uni- and Multivariate Approaches to Evaluating the Susceptibility of Wheat Hybrids to Fusarium Head Blight. Czech J. Genet. Plant Breed. 2016, 52, 132–138. [Google Scholar] [CrossRef] [Green Version]
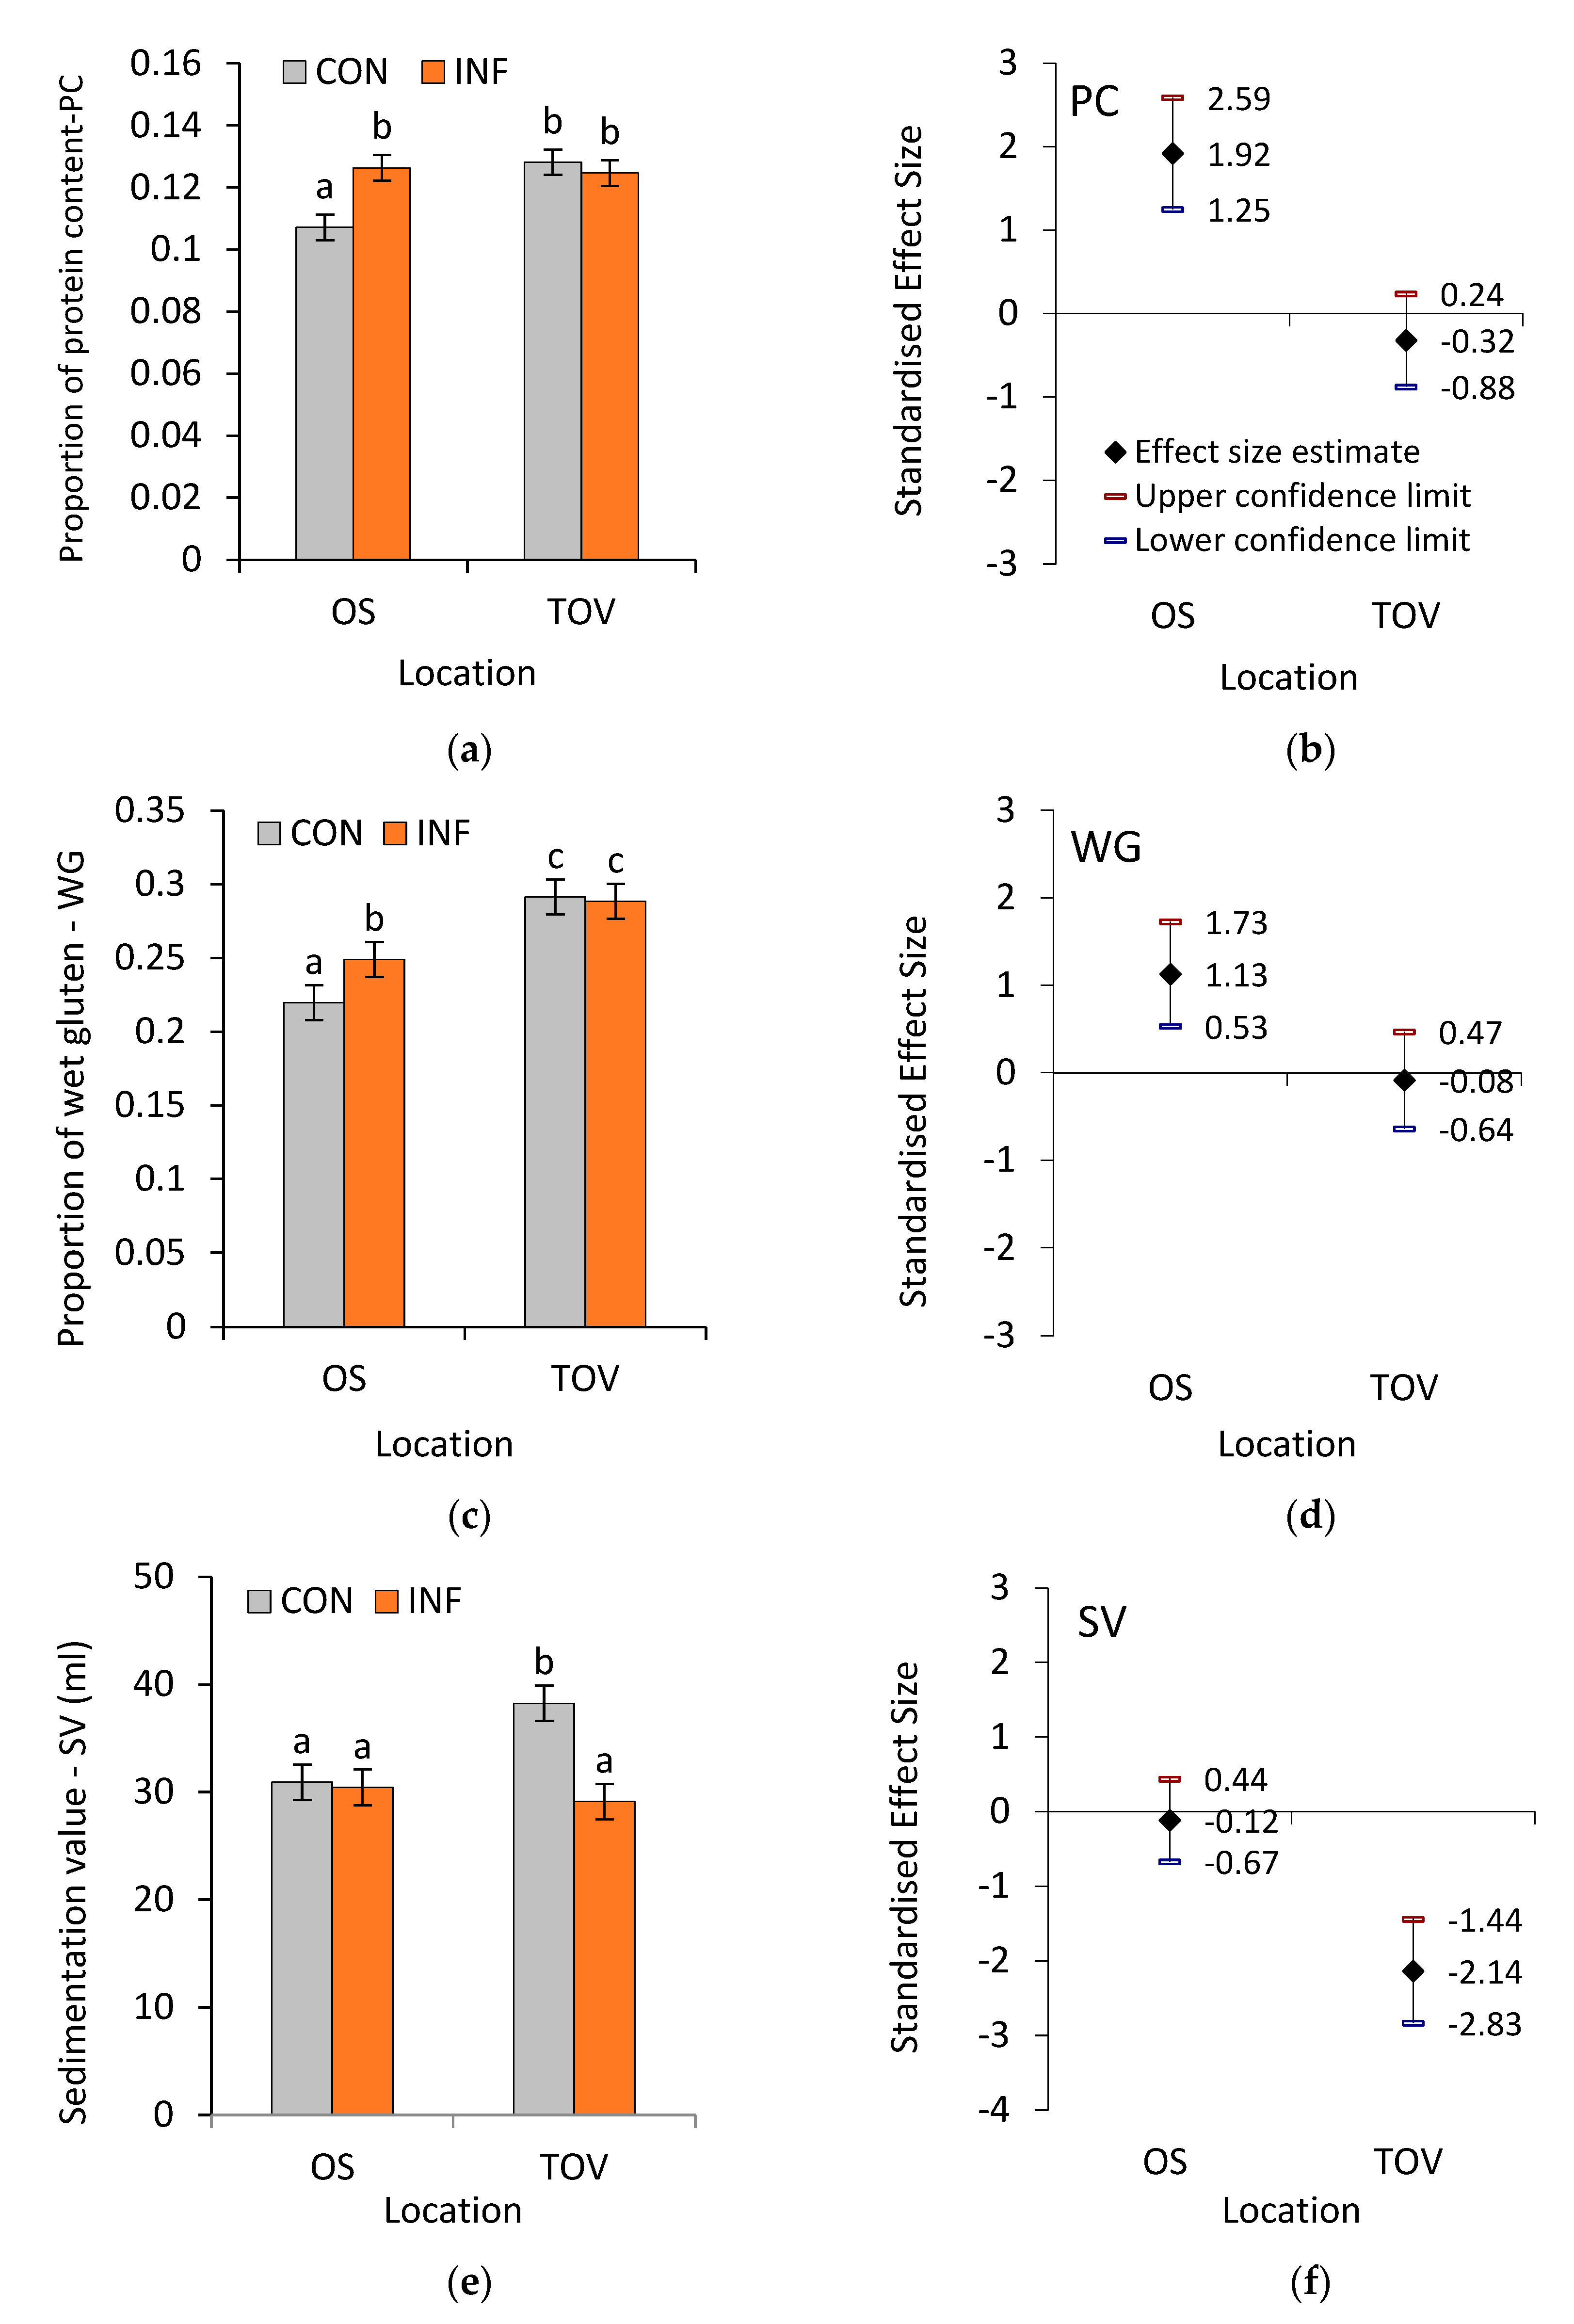
Figure 1. Average values and 95% confidence interval of (a) protein content (PC) proportion in wheat grains, (c) proportion of wet gluten content (WG), (e) sedimentation value (SV, mL) in control (uninfected, CON) (n = 25) and infected (INF) (n = 25) flour samples of winter wheat cultivars grown at Osijek (OS) and Tovarnik (TOV) locations. An estimate of standardized effect size with a 95% confidence interval of Fusarium infection on PC (b), WG (d), and SV (f) of winter wheat cultivars grown at OS and TOV. For all variables with the same letter, the difference in means is not statistically significant (at p < 0.05, Tukey HSD).
Agronomy 13 00662 g001
Figure 2. Average values and 95% confidence interval of (a) falling number (FN, s) and (c) proteolytic activity (PA, μmol TYR g−1 flour) in control (uninfected, CON) (n = 25) and infected (INF) (n = 25) flour samples of winter wheat cultivars grown at Osijek (OS) and Tovarnik (TOV) locations. An estimate of standardized effect size with a 95% confidence interval of Fusarium infection on FN (b) and PA (d) of winter wheat cultivars grown at Osijek (OS) and Tovarnik (TOV). For all variables with the same letter, the difference in means is not statistically significant (at p < 0.05, Tukey HSD).
Agronomy 13 00662 g002
Figure 3. Estimates of the standardized effect size with a 95% confidence interval of the Fusarium infection impact on proteolytic activity (PA, μmol TYR g−1 flour) of 25 winter wheat cultivars grown at (a) OS—Osijek and (b) TOV—Tovarnik locations. Signification codes: 0 < *** < 0.001 < ** < 0.01 < * < 0.05, ns–non significant.
Agronomy 13 00662 g003
Figure 4. Estimates of standardized effect size with a 95% confidence interval of Fusarium infection impact on farinograph rheological properties: water absorption (a), dough stability (b), degree of dough softening (c), and farinograph quality number (d) of winter wheat cultivars grown at Osijek (OS) and Tovarnik (TOV) locations.
Agronomy 13 00662 g004
Figure 5. Boxplot plots of extensographic dough properties for investigated control (uninfected, CON) (n = 25) and infected (INF) (n = 25) winter wheat cultivars grown at different locations (OS, TOV): (a) energy (E, cm2), (c) resistance to extension (RtE, EU) and (e) extensibility (Ext, mm), and estimates of standardized effect size with a 95% confidence interval of Fusarium infection impact on the same properties: E (b), RtE (d), and Ext (f). The box represents the middle 50% of observed values; the bottom of the box is the 25th percentile and the top of the box is the 75th percentile of the data; the line in the middle of the box is the median (50th percentile) and the plus sign (+) is the mean value; the whiskers extend to the lowest and greatest non-outliers’ value, and circles are used to represent outliers. Boxplots marked with the same letter are not significantly different according to multiple pairwise comparisons using the Conover-Iman procedure/two-tailed test at a p < 0.05 significance level.
Agronomy 13 00662 g005
Figure 6. Principal component analysis of measured quality variables derived as the mean difference between infected and control (uninfected) samples of 25 winter wheat cultivars cultivated at two locations (Osijek-OS and Tovarnik-TOV). (a) Correlations between measured variables and the two principal components; (b) Projections of cultivars on the PCA coordinate plot; “green points” represent Cluster 1 (C1), “red points” represent Cluster 2 (C2), “blue points” represent Cluster 3 (C3) displayed and sorted by (c) Agglomerative hierarchical cluster analysis; (d) Parallel coordinate plot of differences representing mean rescaled value (0,1) of distances for validating each cluster. (CP—crude protein, SV—sedimentation value, WG—wet gluten, PA—proteolytic activity, WA—water absorption, DS—dough stability, DoS—degree of dough softening, FQN—farinograph quality number, E—energy, RtE—resistance to extension, Ext—extensibility, AUDPC Inic—initial and AUDPC Gen—general resistance).
Agronomy 13 00662 g006aAgronomy 13 00662 g006b
Table 1. Code names of tested winter wheat cultivars with different resistance levels to FHB used in tables and figures. Letters indicate cultivars’ resistance to Fusarium infection: R—resistant, MR—moderately resistant, MS—moderately susceptible, S—Susceptible.
Code Winter Wheat CultivarsCodeWinter Wheat Cultivars
1Osk.107/15 MS/S14Imported * W2 S
2Osk. 51/15 R15Imported * W3 R
3Osk. 54/15 MS/MR16Osk. 108/04 S
4Osk. 84/15 MR/R17Imported * W4 R
5Osk. 251/02 MR/R18Osk. 106/03 S
6Osk.111/08 MR/R19Osk. 44/11 MS/MR
7Osk. 70/14 S20Osk.116/09 MR
8Osk. 78/14 S21Osk. 4.40/7–82 S
9Osk.138/14 MR/R22Osk. 381/06 MR
10Osk. 52/13 R23Osk. 114/08 MR
11Osk. 89/05 S/MS24Osk. 10287 S
12Imported * W1 R25Osk 120/06 MS/MR
13 Osk.7733 S/MS
* imported cultivars—data can be provided by the Agricultural Institute Osijek, Department for breeding and genetics of small cereal crops (Osijek, Croatia).
Table 2. Average values and standard error of rheological properties obtained using Farinograph for uninfected (control, CON) and FHB-infected (INF) flour samples of winter wheat cultivars grown at Osijek (OS) and Tovarnik (TOV) locations: water absorption—WA (%); dough stability—DS (min); degree of dough softening—DoS (FU); Fischer F statistics, p values, and regression coefficients (R2) of two-way variance analysis model (ANOVA) for differences between locations, treatments, and their interaction. The letters are used to group mean values according to the analysis of the differences between categories, where values indicated by the same letter do not differ significantly (Tukey-HSD test at the significance level of p < 0.05).
Location OSLocation TOV
CON
(n = 25)
INF
(n = 25)
CON
(n = 25)
INF
(n = 25)
WA (%)ANOVA (F3, 96 = 3.02, p = 0.03, R2 = 0.09)
56.28 ± 0.49
ab
56.18 ± 0.47
a
57.91 ± 0.48
b
56.74 ± 0.37
ab
DS (min)ANOVA (F3, 96 = 0.69, p = 0.56, R2 = 0.02)
0.46 ± 0.07
a
0.46 ± 0.09
a
0.63 ± 0.09
a
0.57 ± 0.13
a
DoS (FU)ANOVA (F3, 96 = 46.99, p < 0.0001, R2 = 0.59)
83.88 ± 4.54
b
107.96 ± 5.42
c
56.08 ± 4.81
a
150.04 ± 7.51
d
FQNANOVA (F3, 96 = 8.71, p < 0.0001, R2 = 0.214)
42.68 ± 6.8
a
42.92 ± 4.9
a
78.92 ± 8.4
b
41.40 ± 3.6
a
Disclaimer/Publisher’s Note: The statements, opinions and data contained in all publications are solely those of the individual author(s) and contributor(s) and not of MDPI and/or the editor(s). MDPI and/or the editor(s) disclaim responsibility for any injury to people or property resulting from any ideas, methods, instructions or products referred to in the content.