Abstract
Glyphosate, the most applied herbicide globally, offers effective non-selective and post-emergent weed control. Evolution of herbicide-resistant weeds is commonly associated with the recurrent application of herbicides with the same mode of action. Native to South America, hairy fleabane (Erigeron bonariensis L.) is the most problematic weed in this sub-continent and has previously been confirmed glyphosate resistant. This research aimed at characterizing glyphosate-resistant populations, thus estimating the frequency of resistance, resistance levels and identifying effective herbicide alternatives to control glyphosate-resistant populations. Glyphosate resistance characterization was initially conducted on ten suspected populations collected in plantain, banana, cassava, passionfruit, papaya, and drybean crops. Two resistant populations were selected and further characterized through dose-response tests; in addition, response to alternative herbicides (paraquat, glufosinate, 2,4-D, pyraflufen-ethyl, and mesotrione) was determined. All surveyed hairy fleabane populations survived (≥80% of individuals) the recommended glyphosate rate of 1080 g ae ha−1; conversely, five populations collected from non-cropping areas were effectively controlled at this same rate. Dose-response tests estimated resistance factors of 3.15- to 22.3-fold versus the most susceptible population. Interestingly, resistance profile and dose-response tests detected hormesis responses at field-recommended rates. The most effective herbicide alternatives to control glyphosate-resistant hairy fleabane were pyraflufen-ethyl and mesotrione.
Keywords:
dose response; venadillo; rama negra; hormesis; log-logistic; buva; Conyza; herbicide resistance; ERIBO 1. Introduction
Chemical weed control revolutionized agriculture worldwide in the 20th century. Advancements in cost-effective agricultural production systems, assisted by agrochemicals, have, in part, sustained the demand for food in an increasing human population in recent decades [1,2]. Glyphosate has become the world’s most successful herbicide since its introduction in 1974; this molecule offers non-selective, systemic, and effective post-emergence weed control [3,4]. In Colombia, glyphosate is also the most commercialized and commonly used agrochemical [5]. Thus, growers frequently spray glyphosate prior to crop sowing as a broadcast application or directed to weeds in a postemergence spray within several annual and perennial crops. Other common uses include over-the-top applications on glyphosate-resistant crops, such as maize and soybean, directed spray on waysides, and non-crop industrial applications.
Glyphosate acts by disrupting the shikimate pathway in the chloroplast, ultimately resulting in the arrest of aromatic amino acid biosynthesis via inhibition of the enzyme 3-phosphoshikimate 1-carboxyvinyltransferase (EPSP synthase; EC 2.5.1.19) [3,6]. The shikimate pathway is responsible for processing circa 20% of the carbon fixed by plants, biosynthesizing essential precursors and metabolic compounds such as vitamins, lignins, alkaloids, and flavonoids. Thus, glyphosate inhibition of EPSP synthase impacts several fundamental processes in the plant, chiefly photosynthesis and carbohydrate metabolism [3,7].
The Asteraceae species, commonly known as hairy fleabane (Erigeron bonariensis L.) (synonym: Conyza bonariensis [L.] Cronquist), represents a cosmopolitan native from South America [8]. It was initially described in Argentina and, subsequently, has further naturalized to warm areas worldwide [9]. This species possesses a weedy, aggressive, and invasive behavior, characterized by noxiousness as well as resilience to environmental stress [10]. Competition by Erigeron species in soybean may result in >50% yield loss, and it is currently considered to be the most problematic glyphosate-resistant broadleaf weed in South America [11]. Under tropical Colombian weather conditions, hairy fleabane is well-adapted to a wide range of temperature, precipitation, and altitude conditions ranging from sea level to above 3900 m above sea level (MASL) [8,10]. Moreover, in Colombia, hairy fleabane has been reported as an important weed species in annual and perennial crops, such as banana, plantain, cassava, vegetables, coffee, rice, corn, and diverse fruits; it is also commonly found in roadsides, irrigation channels, and waste areas [12,13,14].
The world’s first glyphosate-resistant hairy fleabane was reported in grape orchards in South Africa [3,15]. In Colombia, the first report was in 2006 in coffee bean groves [12,15] and more recently, a research report characterized glyphosate resistance in a hairy fleabane population from banana plantations in Magdalena province [16].
This research aimed at estimating the frequency and level of resistance in hairy fleabane populations collected from perennial and annual crops in Colombia (i.e., banana, plantain, papaya, passionfruit, cassava, and red beans) and to evaluate alternative herbicide control options for the effective management of glyphosate-resistant hairy fleabane.
2. Materials and Methods
2.1. Plant Material
A total of 10 locations were surveyed for the presence of hairy fleabane, including annual and perennial crops, and a roadside in Colombia (Table 1). Locations were selected based on the anecdotal reports of the weed by growers, citing putative glyphosate resistance. As a resistance reference, two previously confirmed glyphosate-resistant populations [17] collected on railway sides in Cordoba (Spain) were used; these accessions were kindly conveyed by Dr. Rafael de Prado. A third glyphosate-resistant and one glyphosate-susceptible population collected in banana plantations, previously characterized by Dr. Irma Quintero, were also used in the study [16]. Three putative glyphosate-susceptible populations were collected from the understory in rainforests, and a fourth from a farm where glyphosate had not been used for over ten years. The coordinates and altitude of locations where collections occurred were recorded using Garmin® 12 (Garmin International, Olathe, KS, United States) (Table 1). The taxonomical identification of flowered individuals originating from the collected populations, was performed by the botany experts at the Instituto Nacional de Ciencias Naturales of the Universidad Nacional de Colombia (UNAL).

Table 1.
Hairy fleabane populations tested.
Hairy fleabane achenes were planted in plastic pots filled with peat moss, watered, and covered with plastic film. Pots were then placed in a germination chamber at 28–32 °C, a 16 h photoperiod, and fertilized bi-weekly with 0.1 g per pot of the water-soluble fertilizer Soluplant® Inicio (Agafert, Bari, Italy). After 45 days of planting, 2 cm height seedlings were transplanted by placing one plant per pot. The substrate was peat and organic soil, in a 1:1 proportion mixture. Plants were grown under glasshouse conditions at the Universidad Nacional de Colombia (4°38′10.8″ N; 74°5′19.4″ W, altitude 2610 m). Conditions were day/night temperature of 36/28 °C, relative humidity of 47%, and photoperiod of 12 h. Plants were fertilized bi-weekly using the same fertilizer solution as used in the germination chamber. Glyphosate was sprayed at the rosette stage (BBCH 19), with diameter plants ranging from 9 to 12 cm. The application equipment was a spray chamber equipped with a flat-fan nozzle Tee-Jet® 80-02 (Spray Systems Co., Aurora, IL, USA) at 275 KPa pressure and 200 L ha−1 application volume.
2.2. Resistance Profile Test
The experimental design was a completely randomized, factorial arrangement with three replicates. The first factor was population (accession) with 18 levels; the second factor was glyphosate rate with 3 levels: zero, X, and 2X, where X was equal to the recommended glyphosate rate of 1080 g acid equivalents (ae) ha−1 [18,19]. Round Up® Activo SL (Monsanto, St. Louis, MO, USA) was the commercial product used in the study, containing 363 g ae L−1 as glyphosate monopotassium salt.
Assessments were performed 21 days after treatment (DAT). The evaluations included percent visual control (PVC), percent survival (PS), and fresh biomass in grams (FW); dry weight (DW) determinations were conducted after drying at 40 °C for 48 h. Relative biomass for FW and DW were calculated as percent in comparison vs. untreated for each population. Plant survival assessment was based on visual appearance, leaf coloration, and meristem turgidity, which are indicators purporting the plant’s potential to recover, reach maturity and produce achenes. Percent visual control was based on a scale of 0 to 100%, where zero was equivalent to no-observable damage in plants, and 100% was equivalent to dry or necrotic, brown, and non-phototactically active plants.
2.3. Dose-Response Tests
Based on results from the resistant profile test, two confirmed resistant (R) populations with different resistance levels were chosen for further characterization via dose-response tests. In addition, one R population from Spain (P5) and two confirmed glyphosate-susceptible (S) populations (P3 and P7) were used as reference. Glyphosate application timing was identical, as indicated in the resistance profile test. The experiment was conducted under a completely randomized design with a factorial structure possessing four biological replicates (plants). The first factor was population with five levels (three R and two S) and the second factor was glyphosate rate with seven levels: 0, 102, 276, 750, 2039, 5542, and 15,064 g ae ha−1. PVC and PS were assessed at 21 DAT based on the aforementioned criteria. Dose-response experiments were repeated in time to better estimate, characterize and corroborate the unexpected hormesis observed response.
2.4. Alternative Chemical Control Options for Glyphosate-Resistant Populations
The efficacy of five herbicide alternatives of different mode of action to glyphosate, according to the Herbicide Resistance Action Committee (HRAC), were assessed over three R populations (P10 from plantain; P15 from papaya; P20 from passionfruit). These alternative herbicides were sprayed using the rates and adjuvant systems recommended in the respective commercial product labels as described in Table 2. The application timing was rosette (BBCH: 19), as indicated in the Plant Material Section, and plants were sprayed with a 200 L ha−1 spray volume. Populations P10 and P15 were previously characterized using dose-response tests, whilst the third population, P20, was classified as R2 in the resistance profile test. The experiment was comprised of a complete randomized design in a factorial arrangement with four biological replicates (plants). The first factor was population with three levels (P10, P15, and P20) and the second factor was herbicide with six levels (paraquat, 2,4-D, mesotrione, glufosinate, and pyraflufen-ethyl). Assessment variables were DW at 28 DAT and PVC using the same aforementioned criteria at 14 and 28 DAT.
Table 2.
Alternative herbicides tested, mode of action, and doses [15].
2.5. Statistical Analyses
Statistical analyses were performed using R-Studio version 1.1.463 (R-Studio, Inc., Boston, MA, USA). For the resistance profile test, data were analyzed through the Effect Model with Restricted Maximum Likelihood (REML) using the nlme package [20,21]. This tool permitted the selection of the most parsimonious model considering the log-likelihood ratio, the lowest Akaike information criterion (AIC), and the Bayesian information criterion (BIC) [22,23]. For each of the variables, a comparison of the fixed and random effects was conducted using the function in the ghlt package [24]. Further, the response to glyphosate was scored independently for each variable, segregating into susceptible (S) and resistant (R) populations using the most repeated value or mode (see criteria in Table 3) [22,25,26].
Table 3.
Criteria for susceptibility and resistance level in the resistance profile test.
For the dose-response test, analyses were performed using the drc package in R [27,28,29]. The model with the best fit was selected using the mselect function, which considers the higher log-likelihood and lack-of-fit, and the lower AIC and residual variance [28,29].
Regression was performed using the four-parameter log-logistic model [29,30], which is a curve that is symmetric at the inflection point “e”, or ED50, in the formula:
where “y” is the response (PVC, PS, FW, or DW); “c” and “d” are lower and upper limits, respectively; “e” is Euler’s number; “b” is the slope at the parameter “e”; “x” the herbicide rate. Parameter “e” is also called ED50 or GR50 corresponding to LD50 in the case of mortality [27,28,29,30]. Resistance factors (RFs) were calculated by the division of the R/S ratio, considering the GR50 estimate for each resistant (R) and the susceptible (S) population, respectively. Estimation of R/S ratios is instrumental in determining the magnitude of resistance of different populations to a particular herbicide [31,32].
Hormesis was evaluated by fit to the Brain–Cousens model with the formula:
where “c” and “d” are the lower and upper asymptotes; “b” and “e” do not have interpretation; and “f” is the size of the hormesis effect which must be different from zero for the model to have meaning [28,29,33].
Statistical analyses for the study of alternative herbicides were performed through variance analyses and the Tukey test, utilizing the function HSD test in the agricolae package of R [22,25,34].
3. Results
3.1. Resistance Profile Test
Consistently, PVC, PS, FW, and DW data parameters had better fit to the mixed model using dose as a fixed effect and population as a random effect, as described in Table 4. The interaction between populations and replicates was not significant and the mixed model had higher explanatory power than using a linear model. The dose effect was significant (p-value ≤ 0.05) for all variables assessed (HSD test) and the mixed model was effective in removing the variation caused by the population factor. Importantly, this allowed separation of the response to glyphosate, for each population, utilizing the criteria described in Table 3 and segregating groups into: glyphosate-susceptible (S) and two resistant population levels (R1 and R2).
Table 4.
Explanatory power and random effects importance in the mixed model for percent visual control (PVC), percent survival (PS), fresh weight (FW), and dry weight (DW) in 18 hairy fleabane populations.
3.1.1. Reference and Putative Susceptible Populations
The reference-susceptible population (P3) collected from the understory in a rainforest was confirmed glyphosate-susceptible according to the characterization by Quintero-Pertuz et al. [16]. In addition, four putative susceptible populations were classified as S and these included two rainforest accessions (P7, P8), a shrubland (P17), and one from a farm where glyphosate had not been sprayed for over ten years (P2). Conversely, three R accessions (P5, P6, and P16) were classified as glyphosate-resistant (R2) in concordance to their respective previous reports [16,17]; the sub-categories for the reference populations are summarized in Table 5.
Table 5.
Hairy fleabane response to glyphosate in reference resistant (R) and susceptible (S) populations evaluated with the resistance profile test.
3.1.2. Surveyed Populations
All sampled populations were confirmed resistant to glyphosate, including nine from agricultural systems where glyphosate was routinely sprayed and one population collected on the roadside near a banana plantation; see Table 1.
Based on the four efficacy parameters evaluated, PVC, PS, FW, and DW, populations had differential responses to the commercial glyphosate rate of 1080 g ae ha−1, when comparing both sub-categories of glyphosate-resistance (R1 and R2), as well as in comparison with the susceptible populations as described in Figure 1. Consistently, all five S populations were effectively controlled with the 1X glyphosate rate (1080 g ae ha−1), resulting in an average visual control of 89.2% (SE ± 5.92) (Figure 2a). In these five S populations the 2X rate resulted in an average visual control of 96% (SE ± 2.45). Conversely, the R1 populations (low resistance) had a PVC value of 67.5% (SE ± 5.81) at the 1X rate and 80% (SE ± 3.87) at the 2X field rate. A low PVC value of 16.82% (SE ± 6.96) was recorded at the 1X rate for the R2 group, and only 43.03% PVC (SE ± 9.54) materialized at the 2X rate (Figure 2a). Please refer to the pictures in Figure A1 and further detail provided in the Supplementary Table S2.
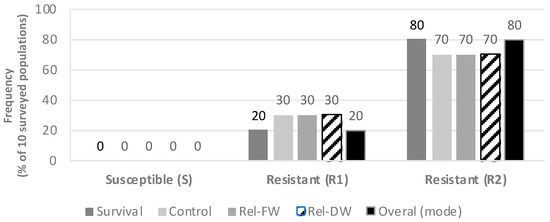
Figure 1.
Response to glyphosate in hairy fleabane collected from different agroecosystems. Rel-FW = Relative fresh weight 21 DAT; Rel-DW = Relative dry weight 21 DAT. R1 = Low resistance level; R2 = High resistance level, according to Table 3. PS = Percent survival; PVC = Percent visual control.
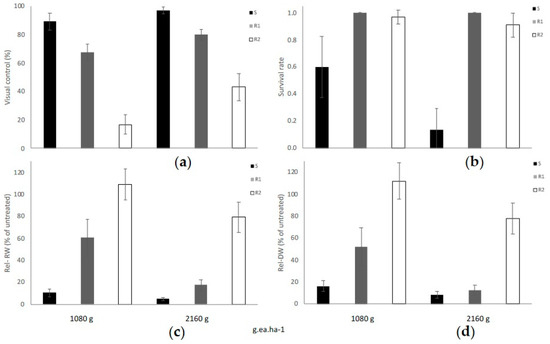
Figure 2.
(a) Percent visual control (PVC), (b) percent survival (PS), (c) relative fresh weight (Rel-FW), and (d) relative dry weight (Rel-DW) in hairy fleabane measured 21 days after treatment with glyphosate. Bar size = Average per class, S (n = 5), R1 (n = 2) and R2 (n = 11), error bars = ± Standard Error (SE).
When glyphosate was sprayed at a 1X rate, 60% of plants within susceptible populations survived, and only 20% survived to the 2X glyphosate rate. Conversely, >90% of plants comprised in the R1 and R2 categories survived the 1X or 2X glyphosate rates as plotted in Figure 2b.
The calculated relative fresh biomass (Rel-FW) and the relative dry weight (Rel-DW) suggested significant differences between 1X and 2X rates (Figure 2c,d). Furthermore, in S populations, the Rel-FW was only an average of 10.49% (±3.51) at the dose the 1X and was reduced to only 4.68% (±1.62) at 2X (Figure 2c).
The Rel-FW average for the R1 group treated with the recommended glyphosate rate was less affected compared to the S populations, where the mean was 60.63% (±1.62). When the 2X glyphosate rate was sprayed, the FW was also higher in R1 compared to S with an estimated value of 17.36% (±5.04).
The R2 populations demonstrated an Rel-FW average of 109.16% (±13.99) at a 1X rate, which implied that these R2 populations had more biomass when sprayed with the recommended glyphosate rate, thus suggesting a hormesis response versus the untreated plants. Interestingly, several populations classified as R2 plants had greater plant height than the untreated plants and tended to flower earlier when compared with untreated plants. Hormesis occurs when a dose-response relationship has a uncharacteristic effect at low doses compared to high doses, with stimulatory responses at a subtoxic level of toxin and, thus, enhanced growth parameters [35,36]. A geographical description of resistance and susceptibility for each population and surveyed locations is described in Figure 3.

Figure 3.
Map of Colombia showing hairy fleabane populations surveyed (P2–P20) and their response to glyphosate to glyphosate.  = Confirmed susceptible;
  = Confirmed resistant.
= Confirmed susceptible; = Confirmed resistant.
3.2. Dose-Response Test for Glyphosate to Control Hairy Fleabane
3.2.1. Models Fitted and Resistance Factors
PS and PVS data were fitted to the four-parameter log-logistic model using p-values > 0.05 in a lack-of-fit test for all five populations tested [29] (see summary in Table 6 and detailed analyses in Supplementary Table S3). Two were S populations collected from the understory in Colombia (P3–P7) whilst three were classified as R: the first was collected in a plantain grove (P10), the second P15 from a papaya orchard, and the third P5, from a railway in Spain and used as R-reference.
Table 6.
Models fitted and parameters in dose-response test on hairy fleabane populations.
Susceptibility to glyphosate was higher in P7, compared to P3, in all the variables evaluated; accordingly, calculated R/S ratios or resistance factors (RF) were higher in the P7 population.
In R populations, the four-parameter log-logistic model for the PS parameter predicted the highest lethal dose (LD50) in the railroad population from Spain (P5; LD50 = 45,454.9 g ae ha−1), which was appreciably higher than populations collected in plantain (P10) or papaya (P15). As anticipated, the lowest attained values for PS were found in S populations; LD50 estimates were only 326.6 and 651.3 g ae ha−1, respectively, for P7 and P3.
The estimated ED50 for PVC indicated that 50% visual control was attained in S populations when sprayed with 129.5~152 g ae glyphosate ha−1, while, in the reference resistant population (P5), 1278.1 g ae ha−1 was required to achieve the same level of control. In the population collected from a plantain area (P10), a higher rate of 1581.6 g ae glyphosate ha−1 was required, and an even higher dose was required to attain 50% visual control in the population collected from a papaya crop (P15), where the calculated ED50 was 4490 g ae ha−1.
3.2.2. Models for Biomass
Dry biomass (DW and Rel-DW) in the R population P5, as well as the S populations (P3 and P7), had the best fit to the log-logistic model with four parameters described in Table 6. Considering population P7, the ED50 for dry biomass (DW) was 109 g ae ha−1, whereas that estimate for P3 was higher and quantified at 165.7 g ae ha−1. The reference R population (P5) required a rate of 1950.3 g ae ha−1 to reduce dry biomass population by 50% and this resulted in a resistance factor of 17.9 (vs. P7).
In contrast, the dry biomass evaluations in R populations P10 and P15 had best fit to the five parameters Brain–Cousens model because of the hormesis response curve, calculating an f parameter that was significatively different from zero (p-value < 0.05 in the t-test).
Compared to the most susceptible population P7, the resistance factor (R/S ratio) calculated for the R population collected from a papaya orchard (P15) was >10 (22.3 for Rel-DW). In comparison, the population collected from a plantain grove (P10) had an intermediate resistance factor (3.15 for Rel-DW) [32].
3.2.3. Graphical Output
Figure 4 shows the graphical outputs for Rel-DW data modeled for P3, P5, P7, P10, and P15. For additional analyzed variables, please refer to Figure A2. Considering the S populations (P3 and P7), curves possessed steeper slopes and faster responses to glyphosate rates compared to R accessions. The Rel-DW variable fitted to the four-parameter log-logistic model described the typical “s-shape” curves (Figure 4a; however, curves for biomass in R populations had a similar pattern but less pronounced and skewed to the right (Figure 4a,b).

Figure 4.
Glyphosate dose-response curves in five hairy fleabane populations estimated on relative biomass (% vs. untreated) (Rel-DW). (a) Relative dry weight P3, P7, and P5; (b) relative dry weight P7, P10, and P15.
Two populations demonstrating hormesis (P10 and P15) and fitted to the Brain–Cousens model for biomass. The modeled data reveals an increase in biomass within lower rates, followed by a peak in increased response and then a decrease in plant biomass (Figure 4b). The hormesis response found in P10 vs. P15 was a similar to a non-monotonic response; however, the asymptote dose in P10 occurred at a lower rate compared to P15 (i.e., ~750 vs. ~2039 g ae ha−1). In addition, the second trial repeated in time demonstrated that the hormesis effect was consistent across trials for the population collected from a papaya area (P15); see Figure 5 and Figure A3.
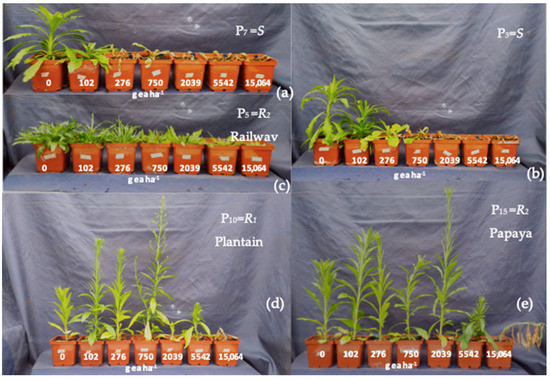
Figure 5.
Dose response in hairy fleabane test at 21 DAT. (a) P3 = S reference; (b) P7 = S from understory; (c) P5 = R-reference from railway in Spain; (d) P10: Low resistance (R1) from a plantain area; (e) P15 = High resistance (R2) from a papaya farmland.
3.3. Alternative Herbicides Evaluation
The study used populations P10 (low resistance level), P15, and P20 (high resistance). The factorial ANOVA analyses for Rel-DW at 28 DAT demonstrated that population, herbicide, and their interaction were highly significant (p-value < 0.001); see Supplementary Table S4. Therefore, the performance and response to each herbicide active ingredient differ depending on the target population evaluated.
Biomass (Rel-DW) assessment in the population from a plantain area (P10) indicated that the best alternatives for effective weed management were 2,4-D and pyraflufen-ethyl (Figure 6a), followed by mesotrione and glufosinate, and, lastly, paraquat. Conversely, P15 collected from a papaya farmland, the most effective herbicide alternatives were 2,4-D, glufosinate, mesotrione, and pyraflufen-ethyl (Figure 6b). Population P20 from a passionfruit orchard had the highest dry biomass values. Importantly for P20, application of 2,4-D, glufosinate, and paraquat had the lowest biomass reductions compared to pyraflufen-ethyl and mesotrione (Figure 6c).
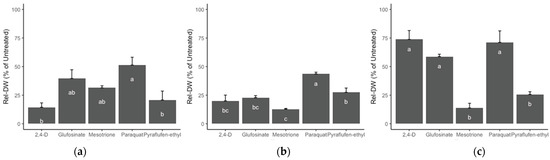
Figure 6.
Effect of five alternative herbicide modes of action on the reduction of relative biomass (Rel-DW) at 28 DAT in three R hairy fleabane populations of: (a) P10 from a plantain area; (b) P15 from a papaya farmland; (c) P20 from a passionfruit grove. Rates: 2,4-D (700 g ai ha−1), glufosinate (225 g ai ha−1), mesotrione (100 g ai ha−1), paraquat (600 g ai ha−1), and pyraflufen-ethyl (8 g ai ha−1). Letters = Tukey test. Error bars = +SE. Different lower cases indicate significant differences among treatments.
For the PVC evaluation, ANOVA estimated significant effects for all factors (herbicide, population, and time) and concomitant interactions at the 14 and 28 DAT evaluation times. The effect on evaluation over time is explained by the speed and mode of action for each herbicide, as summarized in Table 7. The pyridinium herbicide paraquat was the least effective of the evaluated treatments, it had the highest biomass across R populations and the lowest visual control effect.
Table 7.
Visual control of glyphosate-resistant hairy fleabane populations with different herbicides at 14 and 28 days after treatment (DAT).
Pyraflufen-ethyl and mesotrione demonstrated the best overall performance for PVC across all three populations and across assessment times, whereas 2,4-D only effectively controlled the P10 and P15 populations. Interestingly, the auxin herbicide 2,4-D had a satisfactory control (82.5%), of the population from the passionfruit field (P20) at the 14 DAT assessment; however, at 28 DAT, the control was reduced significantly and only delivered 25% visual control. Glufosinate offered acceptable control levels (>80%) at the 14 DAT in only one population (P15), but the control declined over time, and plants recovered from the application at the end of the trial (28 DAT).
4. Discussion
4.1. Resistance to Glyphosate in Hairy Fleabane Is Widespread
Consistent with expected results, the resistance profile test demonstrated that the three S populations (non-exposed to glyphosate) were effectively controlled with the field-recommended glyphosate rate of 1080 g ae ha−1. Furthermore, resistance in low and high levels, was present in 100% of the locations where collections were made in areas of prior glyphosate use. A high resistance level (R2) was detected in 80% of the surveyed fields. A survey performed in Erigeron sp. populations in Brazil between 2014 and 2018 detected glyphosate-resistance in 71.2% out of 1184 samples collected [37]. Previously, in the United States, 100% of the E. canadensis from agricultural areas had high levels of resistance in Ohio, whereas, in Iowa, more than 90% were sites with varying levels of R at the plant level.
These results purport the seriousness of the glyphosate resistance problem in Colombia, suggesting that resistance has achieved similar hairy fleabane prevalence levels as those found in other countries within agricultural landscapes.
Resistance was also present in the P13 population, collected in a street near a banana plantation, which also scored a high level of resistance (R2) in the resistance profile test. Similarly, in Spain, hairy fleabane populations were R in 41.7% of populations from railways [17]. In our study, the confirmed R resistance populations P5 and P6 were also included. Furthermore, the estimated ED50 on relative biomass (Rel-DW) in P5, which was 1950.3 g ae ha−1, was very close to that estimated in the population reported by Amaro-Blanco [17], who found that this value was 1972.4 g ae ha−1.
In Iowa and Ohio, US, researchers found that 45% of the non-agricultural sampled places were R and that these accounted for high survival (>80%), even at 40 times the recommended field rate (i.e., 33,600 g ae ha−1) [26]. These results confirmed that non-agricultural areas also serve as a refuge for R genes and enhance the chance of resistance spreading to other areas.
4.2. Levels of Susceptibility and Resistance to Glyphosate in Hairy Fleabane in Colombia
The dose-response test allowed estimation of the susceptibility levels found in two S populations, which resulted in intermediate and similar values when comparing ED50 with the values reported by other studies in the same species [16,17,18,19,38,39,40,41,42,43,44]. In summary, these studies report ED50 values based on dry biomass in S biotypes from 34.8 to 335 g ae ha−1.
Our results estimated values of 165.7 and 109 g ae ha−1 for ED50 in P3 and P7, respectively (over biomass). These values are comparable with the aforementioned studies referenced in this publication. For detailed benchmark values, please refer to Supplementary Table S5.
For all assessments (survival, control, and biomass), we found that ED50 values contrasted between the R and S populations. Population P15 (from the passionfruit grove) had the highest ED50 values considering control and biomass and were the most resistant according to tests for biomass and visual control. Population P5 (the reference from the railway) had the highest ED50 for survival rate. P10 (from plantain crop) had the lower ED50 values. Dry biomass ED50 values are also comparable with the values reported previously; thus, for R populations, the ED50 values may vary from 1129.9 to 14,261 g ae ha−1 [16,17,18,19,38,39,40,41,42,43,44].
For the variate survival in the R-reference P5 from the railway in Spain, the model estimated a very high LD50 (45,454.9 g ae ha−1). This was similar to one R biotype described in the United States by Moretti et al., 2016 [41], for which LD50 was 40,862 g ae ha−1; that particular biotype had an estimated ED50 for DW of 1279 g ae ha−1, which was similar to the one estimated for P5 in our study (1935.5 g ae ha−1).
These extremely different estimates (survival vs. biomass) suggest clearly that the rate to kill 50% of these R plants can be much higher than the rate to decrease 50% of the biomass. Those high field rates to control R biotypes can be unaffordable for growers using only glyphosate. In the case of both hairy fleabane populations from Colombia, the estimated LD50 values were much lower: 6857.9 and 6638 g ae ha−1 for P10 and P15, respectively. This means, on average, six times the field rate for glyphosate, which also results in a soaring extra cost.
The resistance factors (R/S ratios) found in the populations from papaya (P15) and the reference from the railway (P5) were 22.3-fold and 17.8-fold, and are considered high resistance, whereas the population from plantain RF was 3.15-fold, which is considered low resistance [32,43]. These RFs values are, in addition, similar to the results of other authors [16,17,18,19,38,39,40,41,42,43,44].
4.3. Hormesis Triggered by Glyphosate-Resistant Hairy Fleabane
Biomass data in two populations from Colombia fitted to the Brain–Cousens model for hormesis [27,28,29,33] and the response were consistent across trials. Hormetic response to glyphosate has been largely documented to occur in more than 20 species at doses from 1.9 to 730 g ae ha−1 [37,45], and has been also previously documented in hairy fleabane.
In South Africa, hairy fleabane accessions classified as R showed hormesis when the trials were performed under 27 °C conditions but not at 15 °C [43]. In five out of nine E. canadensis R populations from Indiana (USA), dose-response trials revealed hormesis when assessing FW [46].
A study in Brazil found that a glyphosate dose of 90 to 360 g ae ha−1 in E. sumatrensis increased plant height and had earlier flowering, while there was no effect on the number of capitula per plant after treatment [39]. Our results found a hormesis response with an increase in biomass at the recommended rate in the dose profile test (Figure 2c,d), as well as in the dose-response test (Figure 4b and Figure A2). In addition, we found earlier flowering and an increase in plant height, indicating that some Colombian biotypes may have a larger tolerance to glyphosate applications than those reported by the aforementioned studies in South Africa, Brazil, or United States.
Other cases reporting a hormesis effect using the recommended doses of the herbicide have been published in ACCase-target-site-resistant (Alopercus myosuroides Huds.) biotypes; this resulted in a 147% increase in shoot fresh weight after exposure to rates similar to those recommended for the field [47]. Such an increase in biomass at recommended doses results in a higher ability for weeds to compete with the crop and an enhancement of the reproductive potential for resistance biotypes [36].
4.4. Herbicidal Alternatives for Effective Control of Glyphosate-Resistant Hairy Fleabane
Based on biomass reduction and visual control, the best alternatives tested to control R hairy fleabane were pyraflufen-ethyl and mesotrione. In contrast, paraquat had the highest biomass and the lowest PVC, and was the least effective herbicide tested on all three populations. The opposite results were reported with the same mode of action (HRAC: 22), and diquat achieved 80% control on R populations from Spain [19].
Our results suggest that multiple resistance mechanisms, including vacuolar sequestration by ABC-transporters, may have conferred resistance to both paraquat and glyphosate in these populations, as reported in hairy fleabane populations from the United States [42]. Further research is needed to confirm multiple resistance in these populations from Colombia. So, paraquat (and subsequently diquat) can be discarded as an alternative and effective control method for the cases reported in Colombia.
Glufosinate applied at the rate recommended on the label in Colombia (150 g ai ha−1) offered acceptable control levels (>80%) at 14 DAT in only one population, but the control declined over time and, at 28 DAA, plants recovered from the application and the reduction in biomass was similar to that of paraquat. In populations from Spain, glufosinate offered effective control (>80%) when using a much higher dose of 750 g ai ha−1 [19], so glufosinate could be evaluated with higher doses to set a control alternative with it.
Interestingly, in the case of the auxin herbicide 2,4-D, the population from the passionfruit field (P20) had a satisfactory control (82.5%) in the 14 DAT assessment; however, the control reduced significantly to only 25% at 28 DAT. Multiple resistance in hairy fleabane including 2,4-D and glyphosate has been recently discovered [48,49], so it is necessary to investigate if P20 is 2,4-D resistant or if 2,4-D may also require a higher dose to prevent plant recovery.
Pyraflufen, mesotrione, or 2,4-D can also be tank-mixed with glyphosate to improve the synergistic effect on either resistant or susceptible populations, as found in Spain [19]. In addition, mixtures can be sprayed in pre-plant-burndown or in post-emergence to crop on those crops where selectivity can be achieved and when crop growth and competition may complete effective control of weeds [50].
Tank-mixing glyphosate with pyraflufen-ethyl, glufosinate, or mesotrione also widens the control spectrum. However, tank mixes would increase production cost, a common consequence of resistance [3].
5. Conclusions
A high prevalence of glyphosate resistance was found in hairy fleabane biotypes from Colombia. Populations collected in non-cropping areas, not exposed to glyphosate, remained susceptible to the herbicide. Resistance factor estimates varied from low (3.5-fold) resistance levels in one population collected from plantain (P10) areas to high (22.3-fold) resistance in a population collected from a papaya (P15) farmland, which incidentally had higher levels of resistance compared to the reference population from Spain (17.8-fold). Furthermore, a hormesis response was detected at the recommended glyphosate rates, purporting the ability of hairy fleabane to adapt to adverse environments, including chemical weed control. Two alternative modes of action, pyraflufen-ethyl (8 g ai ha−1) and mesotrione (100 g ai ha−1), delivered circa 80% control of three glyphosate-resistant hairy fleabane biotypes, representing resistance management options in solo applications or in a mixture with glyphosate. Unexpectedly, paraquat (600 g ai ha−1), 2,4-D (720 g ae ha−1) and glufosinate (100 g ai ha−1) offered only inconsistent and partial control of glyphosate resistant hairy fleabane populations. Evolved herbicide resistance is certainly a modern concern in agriculture, calls for attention from the crop protection industry, researchers, and growers to continue pursuing solutions to prevent crop and food losses.
Supplementary Materials
The following supporting information can be downloaded at: https://www.mdpi.com/article/10.3390/agronomy13030683/s1, Table S1: Statistical analyses of resistance profile test; Table S2: E. bonariensis response to glyphosate from different agroecosystems; Table S3: Statistical analyses of dose-response test; Table S4: Studies on resistance to glyphosate levels in E. bonariensis; Table S5: Statistical analyses of alternative herbicide evaluations.
Author Contributions
Conceptualization, I.Z. and G.P.; methodology, I.Z. and G.P.; software, E.G.; validation, I.Z. and G.P.; formal analysis, E.G. investigation, E.G.; resources, G.P. and E.G.; data curation, E.G.; writing—original draft preparation, E.G.; writing—review and editing, E.G., I.Z. and G.P.; visualization, E.G.; supervision, G.P.; project administration, E.G.; funding acquisition, G.P. All authors have read and agreed to the published version of the manuscript.
Funding
This research was funded by Universidad Nacional De Colombia (Code 46398).
Data Availability Statement
Supporting data can be found as Supplementary Materials.
Acknowledgments
Special thanks to Rafael de Prado and Irma Quintero for providing reference populations and Alejandro Montaña for his support of the population survey. To Diana Zabala for support on mixed model data analyses. To the students Maria Vanegas, Bruno Oliveira, and Jonathan Garcia from Universidad Nacional for their help on the greenhouse trial and a special mention to Diana Torres, whose support and help were definitive to achieving this research.
Conflicts of Interest
The authors declare no conflict of interest. The funders had no role in the design of the study; in the collection, analysis, or interpretation of data; in the writing of the manuscript, or in the decision to publish the results.
Appendix A

Figure A1.
The effect of two glyphosate rates on susceptible and resistant hairy fleabane populations. UTC = Untreated check; X = 1080 g ae ha−1; 2X = 2160 g ae ha−1. (a) Susceptible P3 from rainforest; (b) Susceptible P7 from rainforest; (c) Resistant P10 from plantain; (d) Resistant P5 from railway; (e) Ressistant P13 from urban area near to banana plantations; (f) Resistant P15 from papaya.


Figure A2.
Dose-response curve to glyphosate response in five hairy fleabane populations. (a) Survival rate; (b) visual control (%); (c) dry biomass (g plant−1) P3, P7 and P5; (d) dry biomass (g plant−1) P7, P10 and P15.
Figure A2.
Dose-response curve to glyphosate response in five hairy fleabane populations. (a) Survival rate; (b) visual control (%); (c) dry biomass (g plant−1) P3, P7 and P5; (d) dry biomass (g plant−1) P7, P10 and P15.


Figure A3.
Dose-response for glyphosate in one hairy fleabane glyphosate-resistant population (P15) collected from papaya orchard across two trials showing hormesis effect.
Figure A3.
Dose-response for glyphosate in one hairy fleabane glyphosate-resistant population (P15) collected from papaya orchard across two trials showing hormesis effect.

References
- Heap, I. Global perspective of herbicide-resistant weeds. Pest Manag. Sci. 2014, 70, 1306–1315. [Google Scholar] [CrossRef] [PubMed]
- Kaushansky, A.; Hedstrom, L.; Goldman, A.; Singh, J.; Yang, P.L.; Rathod, P.K.; Schiffer, C.A. A call to arms: Unifying the fight against resistance. Sci. Signal. 2018, 11, eaav0442. [Google Scholar] [CrossRef] [PubMed]
- Heap, I.; Duke, S.O. Overview of glyphosate-resistant weeds worldwide. Pest Manag. Sci. 2017. [CrossRef] [PubMed]
- Duke, S.O. The history and current status of glyphosate. Pest Manag. Sci. 2018, 74, 1027–1034. [Google Scholar] [CrossRef]
- Valbuena, D.; Cely-Santos, M.; Obregón, D. Agrochemical pesticide production, trade, and hazard: Narrowing the information gap in Colombia. J. Environ. Manag. 2021, 286. [Google Scholar] [CrossRef]
- Morell, H.; Clark, M.; Knowles, P.; Sprinson, D.B. The enzymic synthesis of chorismic and prephenic acids from 3-enolpyruvylshikimic acid 5-phosphate. J. Biol. Chem. 1967, 242, 82–90. [Google Scholar] [CrossRef]
- Cobb, A.H.; Reade, J.P.H. Herbicides and Plant Physiology, 2nd ed.; Wiley-Blackwell: Newport, UK, 2010; ISBN 978-1-4443-2780-9. [Google Scholar]
- Fuentes, C.; Eraso, E.; Sequeda, O.; Piedrahita, W. Flora Arvense del Altiplano Cundiboyacense de Colombia; Facultad de Agronomía Bayer CropScience; Universidad Nacional de Colombia: Bogota, Colombia, 2011. [Google Scholar]
- Wu, H.; Walker, S.; Robinson, G.; Coombes, N. Control of Flaxleaf Fleabane (Conyza bonariensis) in Wheat and Sorghum. Weed Technol. 2010, 24, 102–107. Available online: http://www.jstor.org/stable/40801088 (accessed on 1 February 2023). [CrossRef]
- Bajwa, A.A.; Sadia, S.; Ali, H.; Jabran, K.; Peerzada, A.; Chauhan, B.S. Biology and management of two important Conyza weeds: A global review. Environ. Sci. Pollut. Res. 2016, 23, 24694–24710. [Google Scholar] [CrossRef]
- Peterson, M.A.; Collavo, A.; Ovejero, R.; Shivrain, V.; Walsh, M.J. The challenge of herbicide resistance around the world: A current summary. Pest Manag. Sci. 2018, 74, 2246–2259. [Google Scholar] [CrossRef]
- Menza-Franco, H.D.; Salazar-Gutierrez, L.F. Estudios de resistencia al glifosato en tres arvenses de la zona cafetera colombiana y alternativas para su manejo. Av. Téc. Cenicafé 2006, 350, 1–12. Available online: http://biblioteca.cenicafe.org/handle/10778/344 (accessed on 1 February 2023).
- Quintero-Pértuz, I.; Carbonó-DelaHoz, E. Panorama del manejo de malezas en cultivos de banano en el departamento del Magdalena, Colombia. Rev. Colomb. Cienc. Hortíc. 2016, 9, 329. [Google Scholar] [CrossRef]
- Montealegre, F.A. Morfología de Plántulas de Malezas de Clima Cálido; Ed. Produmedios: Bogota, Colombia, 2011; ISBN 978-958-99277-4-8. [Google Scholar]
- Heap, I. The International Herbicide-Resistant Weed Database. Available online: www.weedscience.org (accessed on 11 April 2021).
- Quintero-Pertuz, I.; Hoyos, V.; Carbonó-Delahoz, E.; Plaza, G. Susceptibility of weed populations to glyphosate in banana plantations of the Department of Magdalena, Colombia. Chil. J. Agric. Res. 2021, 81, 172–181. [Google Scholar] [CrossRef]
- Amaro-Blanco, I.; Osuna, M.D.; Romano, Y.; Roldán-Gómez, R.; Palma-Bautista, C.; Portugal, J.; De Prado, R. Selection for glyphosate resistance in Conyza spp. Occurring in the railway network of Southern Spain. Can. J. Plant Sci. 2019, 99, 413–419. [Google Scholar] [CrossRef]
- Puricelli, E.; Faccini, D.; Metzler, M.; Torres, P. Differential Susceptibility of Conyza bonariensis Biotypes to Glyphosate and ALS-Inhibiting Herbicides in Argentina. Agric. Sci. 2015, 6, 22–30. [Google Scholar] [CrossRef]
- Tahmasebi, B.K.; Alebrahim, M.T.; Roldán-Gómez, R.A.; da Silveira, H.M.; de Carvalho, L.B.; Alcántara-de la Cruz, R.; De Prado, R. Effectiveness of alternative herbicides on three Conyza species from Europe with and without glyphosate resistance. Crop Prot. 2018, 112, 350–355. [Google Scholar] [CrossRef]
- Pinheiro, J.; Bates, D. Package ‘nlme’. 2020. Available online: https://cran.r-project.org/web/packages/nlme/nlme.pdf (accessed on 1 February 2023).
- R Core Team. R: A Language and Environment for Statistical Computing; R Foundation for Statistical Computing: Viena, Austria, 2023; Available online: https://www.r-project.org/ (accessed on 1 February 2023).
- Zabala, D.; Carranza, N.; Darghan, A.; Plaza, G. Spatial distribution of multiple herbicide resistance in Echinochloa colona (L.) link. Chil. J. Agric. Res. 2019, 79, 576–585. [Google Scholar] [CrossRef]
- Aho, K.; Derryberry, D.; Peterson, T. Model selection for ecologists: The worldviews of AIC and BIC. Ecology 2014, 95, 631–636. [Google Scholar] [CrossRef]
- Hothorn, T.; Bretz, F.; Westfall, P. Simultaneous inference in general parametric models. Biom. J. 2008, 50, 346–363. [Google Scholar] [CrossRef]
- Panozzo, S.; Scarabel, L.; Collavo, A.; Sattin, M. Protocols for Robust Herbicide Resistance Testing in Different Weed Species. J. Vis. Exp. 2015, 101, e52923. [Google Scholar] [CrossRef]
- Beres, Z.T.; Ernst, E.; Ackley, B.; Loux, M.; Owen, M.; Snow, A.A. High levels of glyphosate resistance in conyza canadensis from agricultural and non-agricultural sites in Ohio and Iowa. Sci. Rep. 2018, 8, 10483. [Google Scholar] [CrossRef]
- Knezevic, S.Z.; Streibig, J.; Ritz, C. Utilizing R Software Package for Dose-Response Studies: The Concept and Data Analysis. Weed Technol. 2007, 21, 840–848. [Google Scholar] [CrossRef]
- Ritz, C.; Baty, F.; Streibig, J.; Gerhard, D. Dose-Response Analysis Using R. PLoS ONE 2015, 10, e0146021. [Google Scholar] [CrossRef] [PubMed]
- Ritz, C.; Strebig, J.C. Package ‘drc’: Analysis of Dose-Response Curves. R Proj. 2016, p. 149. Available online: https://cran.r-project.org/web/packages/drc/drc.pdf (accessed on 1 February 2023).
- Seefeldt, S.S.; Jensen, J.; Fuerst, E.P. Log-Logistic Analysis of Herbicide Dose-Response Relationships. Weed Technol. 1995, 9, 218–227. Available online: http://www.jstor.org/stable/3987736 (accessed on 1 February 2023). [CrossRef]
- Burgos, N.R.; Tranel, P.J.; Streibig, J.C.; Davis, V.M.; Shaner, D.; Norsworthy, J.K.; Ritz, C. Review: Confirmation of Resistance to Herbicides and Evaluation of Resistance Levels. Weed Sci. 2013, 61, 4–20. [Google Scholar] [CrossRef]
- Heap, I. Criteria for Confirmation of Herbicide-Resistant Weeds—With Specific Emphasis on Confirming Low Level Resistance. 2005. Available online: http://www.weedscience.org/Pages/ResistanceCriterion.pdf (accessed on 1 February 2023).
- Brain, P.; Cousens, R. An equation to describe dose responses where there is stimulation of growth at low doses. Weed Res. 1989, 29, 93–96. [Google Scholar] [CrossRef]
- de Mendiburu, F. Agricolae: Statistical Procedures for Agricultural Research. 2022. Available online: https://cran.r-project.org/package=agricolae (accessed on 1 February 2023).
- Kendig, E.L.; Le, H.; Belcher, S.M. Defining hormesis: Evaluation of a complex concentration response phenomenon. Int. J. Toxicol. 2010, 29, 235–246. [Google Scholar] [CrossRef]
- Belz, R.; Duke, S.O. Herbicides and plant hormesis. Pest Manag. Sci. 2014, 70, 698–707. [Google Scholar] [CrossRef]
- Mendes, R.R.; Takano, H.K.; Gonçalves Netto, A.; Picoli Junior, G.J.; Cavenaghi, A.L.; Silva, V.F.; Ovejero, R.F.L. Monitoring glyphosate-and chlorimuron-resistant Conyza spp. Populations in Brazil. An. Acad. Bras. Cienc. 2021, 93. [Google Scholar] [CrossRef]
- Amaro-Blanco, I.; Fernández-Moreno, P.; Osuna-Ruiz, M.; Bastida, F.; De Prado, R. Mechanisms of glyphosate resistance and response to alternative herbicide-based management in populations of the three Conyza species introduced in southern Spain. Pest Manag. Sci. 2018, 74, 1925–1937. [Google Scholar] [CrossRef]
- Gomes, G.L. Caracterização Bioquímica e Morfofisiológica de Populações de Buva (Conyza spp.) Resistentes ao Glyphosate. Ph.D. Thesis, Universidade Estadual Paulista “Júlio De Mesquita Filho”, Sao Paulo, Brazil, 2014. Available online: https://repositorio.unesp.br/handle/11449/116041 (accessed on 1 February 2023).
- González-Torralva, F.; Cruz-Hipolito, H.; Bastida, F.; Mülleder, N.; Smeda, R.; De Prado, R. Differential susceptibility to glyphosate among the Conyza weed species in Spain. J. Agric. Food Chem. 2010, 58, 4361–4366. [Google Scholar] [CrossRef]
- Moretti, M.; Sosnoskie, L.M.; Shrestha, A.; Wright, S.D.; Hembree, K.J.; Jasieniuk, M.; Hanson, B.D. Distribution of Conyza sp. in Orchards of California and Response to Glyphosate and Paraquat. Weed Sci. 2016, 64, 339–347. [Google Scholar] [CrossRef]
- Moretti, M.L.; Hanson, B.D. Reduced translocation is involved in resistance to glyphosate and paraquat in Conyza bonariensis and Conyza canadensis from California. Weed Res. 2017, 57, 25–34. [Google Scholar] [CrossRef]
- Okumu, M.N.; Vorster, B.; Reinhardt, C.F. Growth-stage and temperature influence glyphosate resistance in Conyza bonariensis (L.) Cronquist. South Afr. J. Bot. 2019, 121, 248–256. [Google Scholar] [CrossRef]
- González-Torralva, F.; Rojano-Delgado, A.; de Castro, M.L.; Mülleder, N.; De Prado, R. Two non-target mechanisms are involved in glyphosate-resistant horseweed (Conyza canadensis L. Cronq.) biotypes. J. Plant Physiol. 2012, 169, 1673–1679. [Google Scholar] [CrossRef]
- Brito, I.P.F.S.; Tropaldi, L.; Carbonari, C.; Velini, E.D. Hormetic effects of glyphosate on plants. Pest Manag. Sci. 2018, 74, 1064–1070. [Google Scholar] [CrossRef]
- Davis, V.M.; Kruger, G.; Hallett, S.; Tranel, P.; Johnson, W.G. Heritability of Glyphosate Resistance in Indiana Horseweed (Conyza canadensis) Populations. Weed Sci. 2010, 58, 30–38. [Google Scholar] [CrossRef]
- Petersen, J.; Neser, J.-M.; Dresbach-Runkel, M. Resistant factors of target-site and metabolic resistant black-grass (Alopecurus myosuroides Huds.) biotypes against different ACC-ase-inhibitors. J. Plant Dis. Prot. 2008, 21, 25–29. Available online: https://www.researchgate.net/publication/288171834_Resistant_factors_of_target-site_and_metabolic_resistant_black-grass_Alopecurus_myosuroides_Huds_biotypes_against_different_ACC-ase-inhibitors (accessed on 1 February 2023).
- Moretti, M.; Bobadilla, L.; Hanson, B. Cross-resistance to diquat in glyphosate/paraquat-resistant hairy fleabane (Conyza bonariensis) and horseweed (Conyza canadensis) and confirmation of 2,4-D resistance in Conyza bonariensis. Weed Technol. 2021, 35, 554–559. [Google Scholar] [CrossRef]
- Palma-Bautista, C.; Vazquez-Garcia, J.G.; Domínguez-Valenzuela, J.A.; Ferreira Mendes, K.; Alcantara De la Cruz, R.; Torra, J.; De Prado, R. Non-Target-Site Resistance Mechanisms Endow Multiple Herbicide Resistance to Five Mechanisms of Action in Conyza bonariensis. J. Agric. Food Chem. 2021, 69, 14792–14801. [Google Scholar] [CrossRef]
- Håkansson, S. Weeds and Weed Management on Arable Land: An Ecological Approach; Department of Ecology and Crop Production Science Swedish University of Agricultural Sciences Uppsala, Sweden, Ed.; CABI Publishing: Oxfordshire, UK, 2003; Available online: https://www.cabidigitallibrary.org/doi/book/10.1079/9780851996516.0000 (accessed on 14 January 2023)ISBN ISBN 0-85199-651-5.


Disclaimer/Publisher’s Note: The statements, opinions and data contained in all publications are solely those of the individual author(s) and contributor(s) and not of MDPI and/or the editor(s). MDPI and/or the editor(s) disclaim responsibility for any injury to people or property resulting from any ideas, methods, instructions or products referred to in the content. |
© 2023 by the authors. Licensee MDPI, Basel, Switzerland. This article is an open access article distributed under the terms and conditions of the Creative Commons Attribution (CC BY) license (https://creativecommons.org/licenses/by/4.0/).