Article

Grazing Regulates Changes in Soil Microbial Communities in Plant-Soil Systems

1
Institute of Agricultural Resources and Regional Planning, Chinese Academy of Agricultural Sciences, No 12, Zhonguancun South Street, Haidian District, Beijing 100081, China
2
Institute of Grassland Science, Northeast Normal University, Changchun 130024, China
3
Beijing Digital Agriculture Rural Promotion Center, Beijing 100010, China
4
Environmental Online Monitoring Center of Inner Mongolia, No 39 Tengfei Road, Saihan District, Hohhot 010011, China
5
College of Resources and Environmental Sciences, Nanjing Agricultural University, Nanjing 210095, China
6
Erguna Forest-Steppe Ecotone Research Station, Institute of Applied Ecology, Chinese Academy of Sciences, Shenyang 110016, China
*
Authors to whom correspondence should be addressed.
Agronomy 2023, 13(3), 708; https://doi.org/10.3390/agronomy13030708
Submission received: 28 January 2023 / Revised: 17 February 2023 / Accepted: 24 February 2023 / Published: 27 February 2023

Abstract

:
Soil microorganisms promote material transformation and energy flow in the entire ecological environment and play a key role in the stability and development of grassland ecosystems. Studies on the impacts of grazing on the soil microbial community and the establishment of a reasonable grazing intensity are crucial to improve our knowledge of the mechanisms underlying grassland degradation and to accurately assess the influence of grazing management on grassland functions and the nutrient cycle. Based on the grassland grazing control experimental platform, we compared the structure and diversity characteristics of soil microbial communities under six grazing intensities (0.00, 0.23, 0.34, 0.46, 0.69, and 0.92 AU ha−1) (1 AU = 500 kg of adult cattle) on the Hulunbuir Leymus chinensis meadow steppe. The results showed that soil microbial biomass carbon (MBC) and nitrogen (MBN) decreased with increasing soil depth. The 0–10 cm soil layer of G0.34 had the highest MBC and MBN, and the G0.92 treatment had the lowest MBC and MBN. Heavy grazing significantly decreased the MBC and MBN contents in the soil surface layer. The soil bacterial diversity under light grazing treatment (0.23 AU ha−1) was higher than that under heavy grazing, and the fungal diversity under the no-grazing treatment was higher than that under the grazing treatment. Overgrazing reduced the bacterial species in the soil. The plant belowground biomass significantly (p = 0.039) influenced the bacterial community structure, and the soil pH (p = 0.032), total nitrogen (p = 0.011), and litter (p = 0.007) significantly influenced the fungal community. The effects of grazing on microbial communities were primarily driven by vegetation productivity, litter mass, and soil geophysical and chemical characteristics. This study deepened our understanding of the impacts of grazing practices on soil microbial communities on the meadow steppe, suggesting that moderate-disturbance grazing can promote the sustainable development of grassland vegetation-soil microorganisms.

1. Introduction

Soil microorganisms play an important role in maintaining the stability and development of grassland ecosystems by driving the flow of material and energy transfer in the entire environment [1]. Soil microorganisms are extremely sensitive to changes in the environment [2]. Grazing is a major management practice for grassland ecosystems [3], and long-term unreasonable grazing affects the vegetation community structure and soil properties [4,5,6], which changes the soil microbial community. In turn, changes in the soil microbial community structure act on the vegetation in the community, thereby affecting the entire grassland ecosystem [7]. Studies have shown that greater microbial diversity indicates stronger soil biological activity, which is more conducive to plant growth [8]. However, many studies show the contrary. Therefore, examining the impacts of grazing intensities on soil microbial community composition and diversity, soil properties, and vegetation characteristics is of great significance for revealing the mechanisms underlying the succession direction of grazing grasslands.
An increasing number of studies have been performed in recent years to evaluate the impact of grazing on soil microbial community traits, including quantity [9], biomass [10], enzymatic activity [11], community structure [12] and diversity [13]. These studies showed that light grazing significantly increased the soil microbial population and microbial biomass [14], while overgrazing reduced the soil microbial biomass carbon [15]. Moderate grazing usually improves microbial diversity, changes the microbial community structure, improves soil quality, and maximizes grassland productivity [16]. Sun et al. (2018) [17] showed that changes in the available nitrogen content caused by grazing led to significant changes in the ammonia-oxidizing microbial community structure. Xun et al. (2018) [18] showed that grazing changed the microbial composition of meadow grasslands from slow-growing fungi to fast-growing bacteria-dominated communities. On the Qinghai–Tibet Plateau, it was observed that soil bacterial diversity was the highest in moderate grazing areas, and the soil bacterial diversity changed with the migration of grazing [19,20]. Grazing may affect the distribution of alpine grassland microorganisms on a small spatial scale and may change the effect of water on the microbial community [21]. These results also reflect the inconsistent response patterns of soil microorganisms to grazing due to different geographical locations and seasonal climates [22,23]. Therefore, the complex relationship between grazing and soil microorganisms presents different changing trends under the influence of environmental factors.
As an important part of the Eurasian steppe, the Hulunbuir steppe is not only an important ecological barrier in the north, but also an important animal husbandry production base in China and the basis for the survival of herdspeople. It plays an extremely important role in maintaining global and regional ecosystem balance. Therefore, it is vital to study the relationship between grazing and microorganisms in this area and to establish a reasonable grazing intensity.
In this study, high-throughput sequencing was used to sequence some bacterial 16S rRNA and fungal 18S rRNA genes to evaluate the structure of the soil microbial community under six grazing intensities. The microbial biomass carbon and nitrogen, as well as the soil physical and chemical properties, were measured under different grazing intensities to investigate grazing-induced changes in the composition, diversity, and microbial biomass carbon and nitrogen and their interaction with the physical and chemical properties of vegetation and soil. To fulfil these objectives, the soil microbial community composition and diversity under six grazing intensities were examined in this study, in combination with soil properties and vegetation characteristics, and the response mechanism of soil microbial changes to grazing intensity was explored from an ecological perspective.

2. Materials and Methods

2.1. Study Site and Sampling

The experimental sites belong to the National Field Scientific Observation and Research Station of the Hulunbuir Grassland Ecosystem (49°19′349″~20′ 173″ N, 119°56′521″~57′854″ E, altitude of 666 and 680 m), located in the Inner Mongolia Autonomous Region, China. This region has a temperate semiarid continental climate. The average annual temperature wass −3.5 and −0.5 °C from the year 2010 to the year 2018 [24]. The average annual precipitation is 350 and 400 mm, and the highest precipitation period is from July to September [24]. The grassland at the study sites is Leymus chinensis meadow steppe, and chestnut soil is one of the predominant soil types, which corresponds to Kastanozems in the soil taxonomic system of the FAO and calcic-orthic Aridisols in the US soil classification system.
The grazing experiment was carried out in 2009 using a randomized block design with six grazing intensities and three replicates. Different grazing intensities were controlled by the number of grazing cattle of 250–300 kg, and the number of grazing cattle of six grazing intensities was 0, 2, 3, 4, 6, 8, respectively. The stocking rates were 0.00, 0.23, 0.34, 0.46, 0.69, and 0.92 AU ha−1 (1 AU = 500 kg adult cattle; these intensities were named G0.00, G.23, G.34, G.46, G.69, and G.92, respectively). Each grazing plot had an area of 5 ha, with a total of 18 plots and a total area of 90 ha (Figure 1). Grazing started on June 1 and ended on October 1 of each year. In this study, soil samples were collected in August 2018 to determine the soil microbial community structure and physicochemical properties.
Five quadrats (1 m × 1 m) were randomly selected in each plot to measure plant height, coverage, and density by species. The plants in the quadrat were divided into two parts: aboveground green plants and litter. The plants were cut at ground level, placed in an envelope, and transported to the laboratory to measure the fresh weight, after which they were then dried at 85 °C for 12 h. Then, the dry weight was measured to calculate the aboveground biomass and litter amount of the community. The belowground biomass sampling was synchronized with the aboveground biomass sampling in August during the vigorous growth period. Three replicates of a 30 cm × 30 cm excavation method were used to sample the 0–10, 10–20, and 20–30 cm layers. The samples were transported to the laboratory and washed with a soil sieve (1 mm). The roots were dried at a constant temperature (105 °C) for 24 h, and their dry weight was measured to calculate the belowground biomass.

2.2. Determination of the Physical and Chemical Properties of the Soil

Soil samples were drilled using a 5 cm diameter auger (per 10 cm soil layer, from a 0 to 30 cm soil depth), and a composite sample of 10 random points per unit was obtained to analyze the physical and chemical properties of the soil. The soil temperature (ST) of the 0–10 cm layer was measured by a portable thermometer, with 9 replicates in each test area. Soil moisture was measured by the drying method, and soil bulk density was measured by the cutting ring method, repeated three times [24]. The soil samples were weighed (fresh weight) and then dried to a constant weight at 105 °C. Soil pH was measured by a multiparameter water quality analyzer (DZS-706A, Shanghai Lei Magnetic Co., LTD., Shanghai, China), the air-dried soil samples were dissolved in 0.01 M CaCl2 solution, and the soil-water ratio was 1:2.5.
The soil total nitrogen (TN) concentration was measured by the semimicro Kjeldahl method. The dichromate oxidation and sodium hydroxide alkali-molybdenum-antimony colorimetric methods were used to determine the SOC and TP concentrations, respectively. The soil total potassium (TK), available phosphorus (AP), and available potassium (AK) concentrations were measured by a spectrophotometer. Soil ammonium and nitrate concentrations were determined using a flow injection autoanalyzer (FIAstar 5000 Analyzer, Foss Tecator, Hillerød, Denmark). Soil microbial biomass carbon (MBC) and nitrogen (MBN) were measured using fumigation-volumetric analysis and fumigation-ninhydrin colorimetric methods, respectively [25].

2.3. DNA Collection and High-Throughput Sequencing

Genomic DNA was isolated from 0.5 g of soil using the Power Soil DNA Isolation Kit (Mo Bio Laboratories, Solana Beach, CA, USA), according to the manufacturer’s instructions. The extracts of three technical repeats were mixed into a single DNA sample. Extracted genomic DNA was detected using 1% agarose gel electrophoresis. PCR assays were carried out on a Gene Amp 9700 PCR system (Applied Biosystems, Foster City, CA, USA). Primers (Biosciences, Union City, CA, USA) were washed with Tris-HCl and verified using 2% agarose gel electrophoresis. PCR products were quantified using Quanti Fluor TMs 338F-806R [26] and 817F-1196R [27] for the 16S rRNA and 18S rRNA genes, respectively. Amplified products were detected using 2% agarose gel electrophoresis and recovered from the gel using the Axy Prep DNA gel extraction kit (Axygen -ST Fluorometer, Promega Biotech, Beijing, China), and the samples were adjusted as needed for sequencing. Sequencing was performed by Shanghai Majorbio Biopharm Technology (Shanghai, China) using an Illumina MiSeq platform (San Diego, CA, USA).
The microbial species richness was represented by the number of unique OTUs (16S rRNA gene) or the number of gene probes detected by Geochip (functional genes). The nonparametric Shannon diversity index [28] was also calculated based on 16S rRNA gene and functional gene datasets for the comparison of the alpha diversity. For microbial beta diversity, Bray-Curtis distances were computed using the BVegan^ R package, based on either the 16S rRNA gene matrix or the functional gene matrix.

2.4. Statistical Analysis

The data were sorted and analyzed by Excel 2013, SPSS 19.0, and R 3.5.1 software and plotted by Origin 2017 and R 3.5.1 software. To compare the impacts of grazing intensity on soil factors and vegetation traits, one-way ANOVA was used to analyze the variance in the vegetation community factors, soil factors, and microbial communities, and the LSD test was used for multiple comparisons between the average values, with a significance level of 0.05. Redundancy analysis (RDA) and the variance inflation factor (VIF) were used to analyze the relationship between the soil microbial community structure and its influential factors. Linear discriminant analysis (LDA), combined with effect size measurement (LEfSe) analysis, was used to identify microbial markers with significant differences between groups [29]. The correlations between soil microorganisms and plant communities and soil factors were analyzed using Pearson correlation analysis.

3. Results

3.1. Soil Factors and Vegetation Traits under Different Grazing Intensities

The soil physical and chemical properties and plant characteristics under different grazing intensities are shown in Table 1. The soil water content decreased significantly with increasing grazing intensity (p < 0.05). The nitrate content of G.69 was significantly higher than that of the other grazing intensities (p < 0.05), while the other factors showed no significant differences under the different grazing intensities. The belowground biomass (BGB) under no grazing and light grazing (0.23 and 0.34 AU ha−1) was significantly higher than that under moderate and heavy grazing (0.46 and 0.69 AU ha−1). The aboveground plant litter decreased significantly with increasing grazing intensity; more litter was observed in the non-grazed plots, and less litter was observed in the overgrazed plots.

3.2. Changes in the Soil Microbial Biomass Carbon and Nitrogen under Different Grazing Intensities

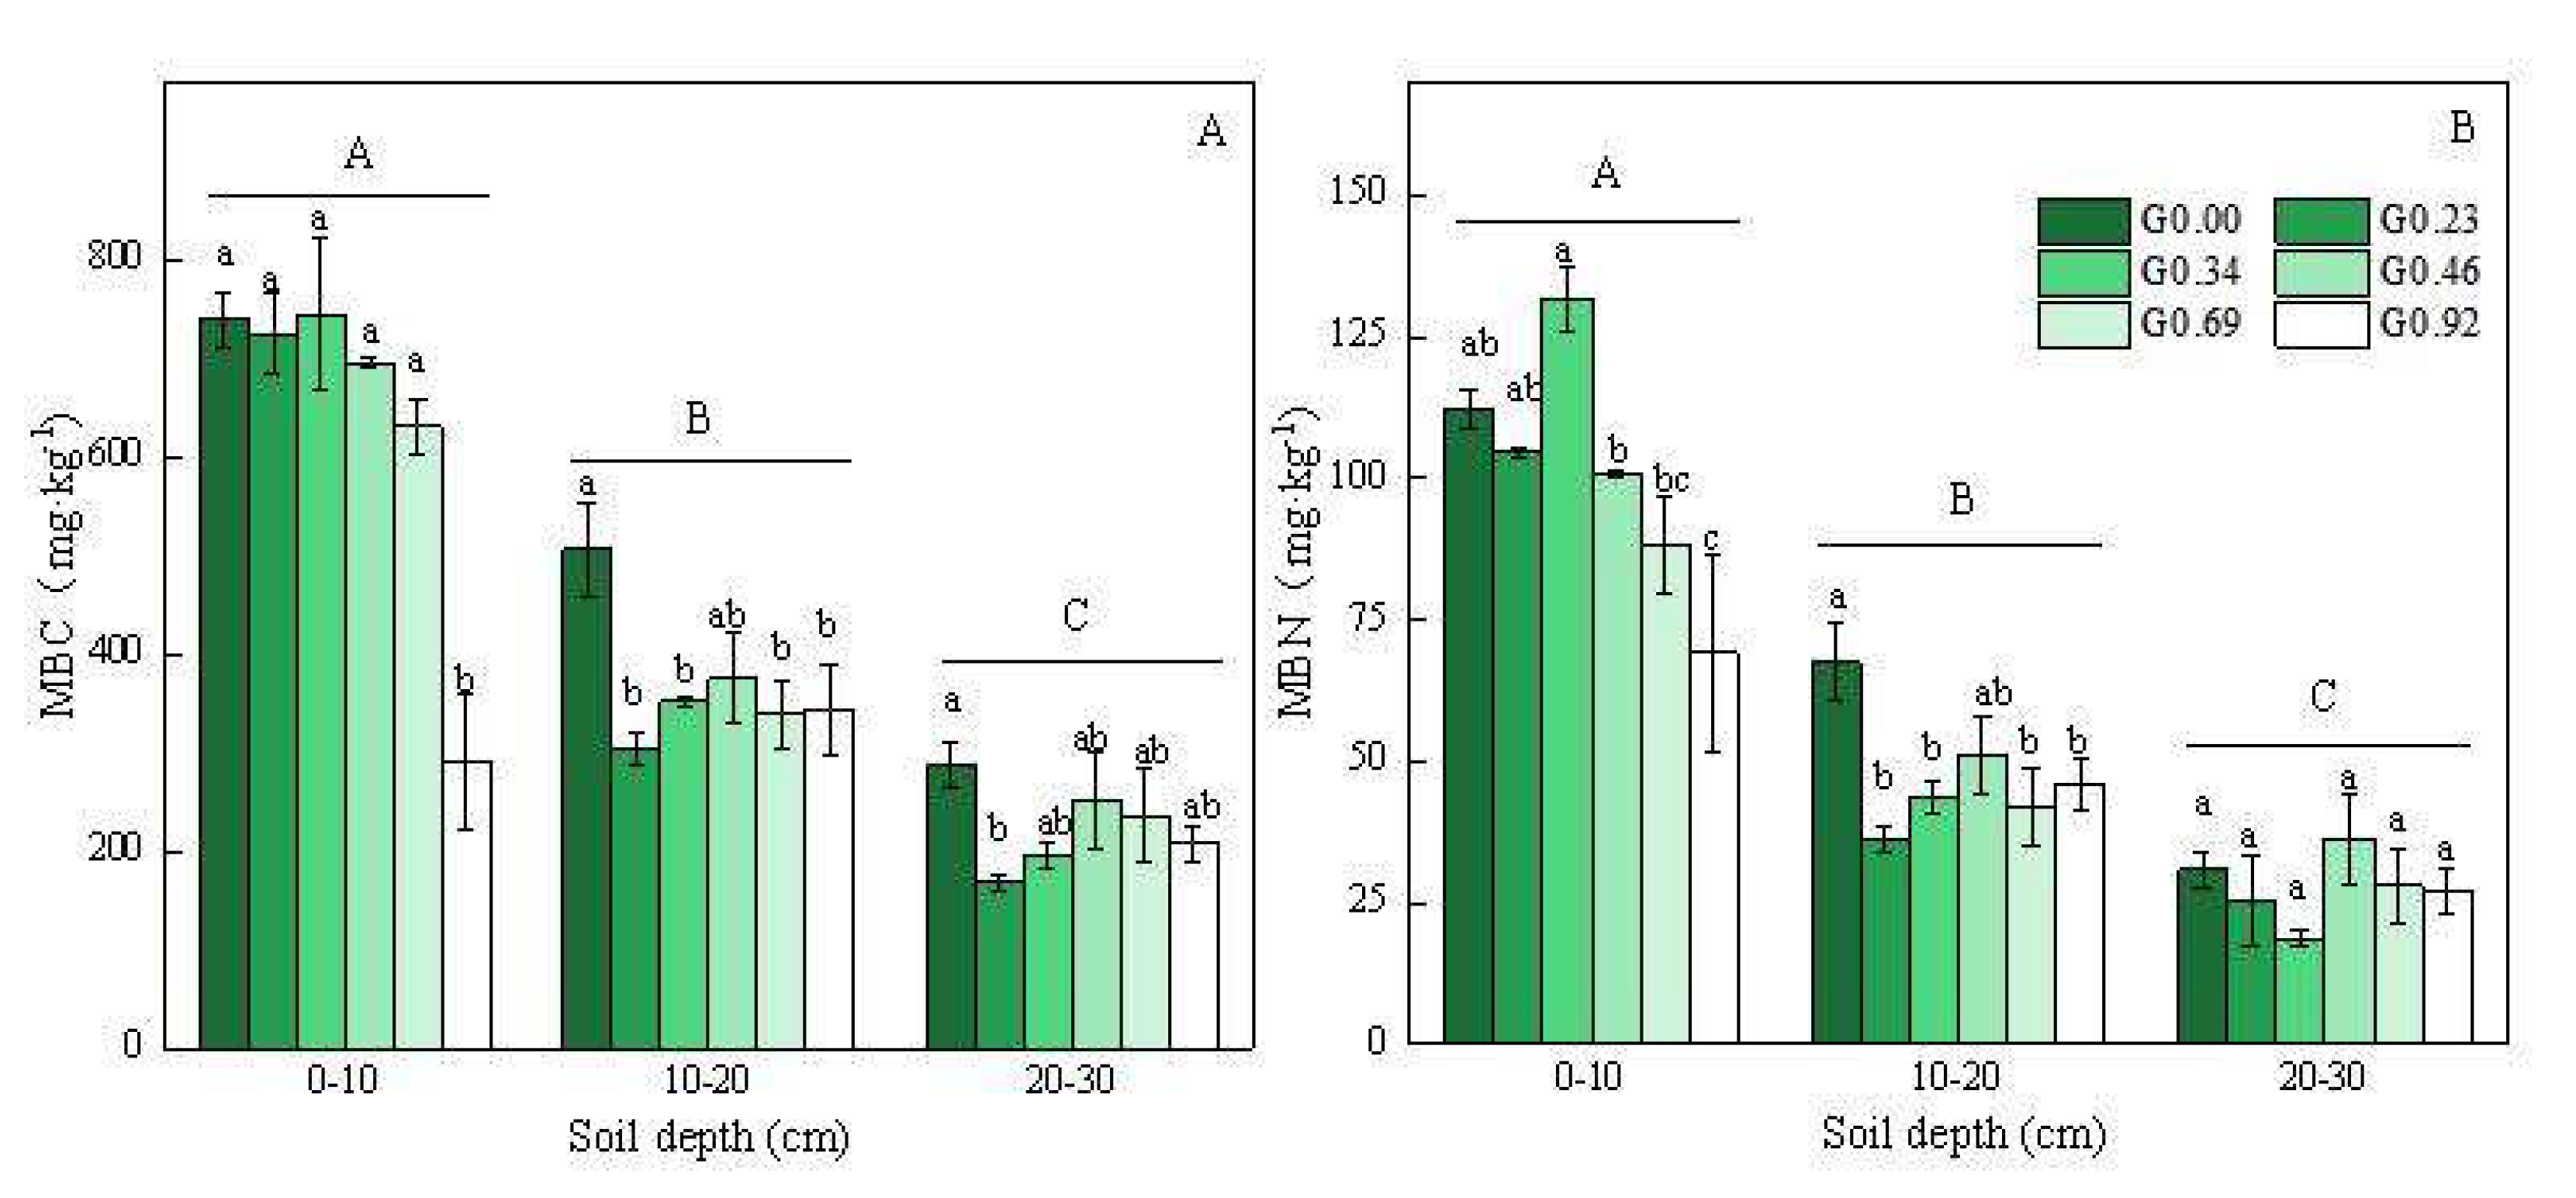
The soil microbial biomass carbon (MBC) and microbial biomass nitrogen (MBN) of the 0–10 cm soil layer were the highest in the G0.34 plots and the lowest in the G0.92 plots (Figure 2), and heavy grazing significantly decreased the MBC and MBN contents. The MBC and MBN contents in the 10–20 cm and 20–30 cm soil layers of G0.00, without grazing, were higher than those under the other grazing intensities. The vertical distribution of the soil MBC and MBN contents showed that they decreased with increasing soil depth.

3.3. Changes in Soil Microbial Diversity in Response to Different Grazing Intensities

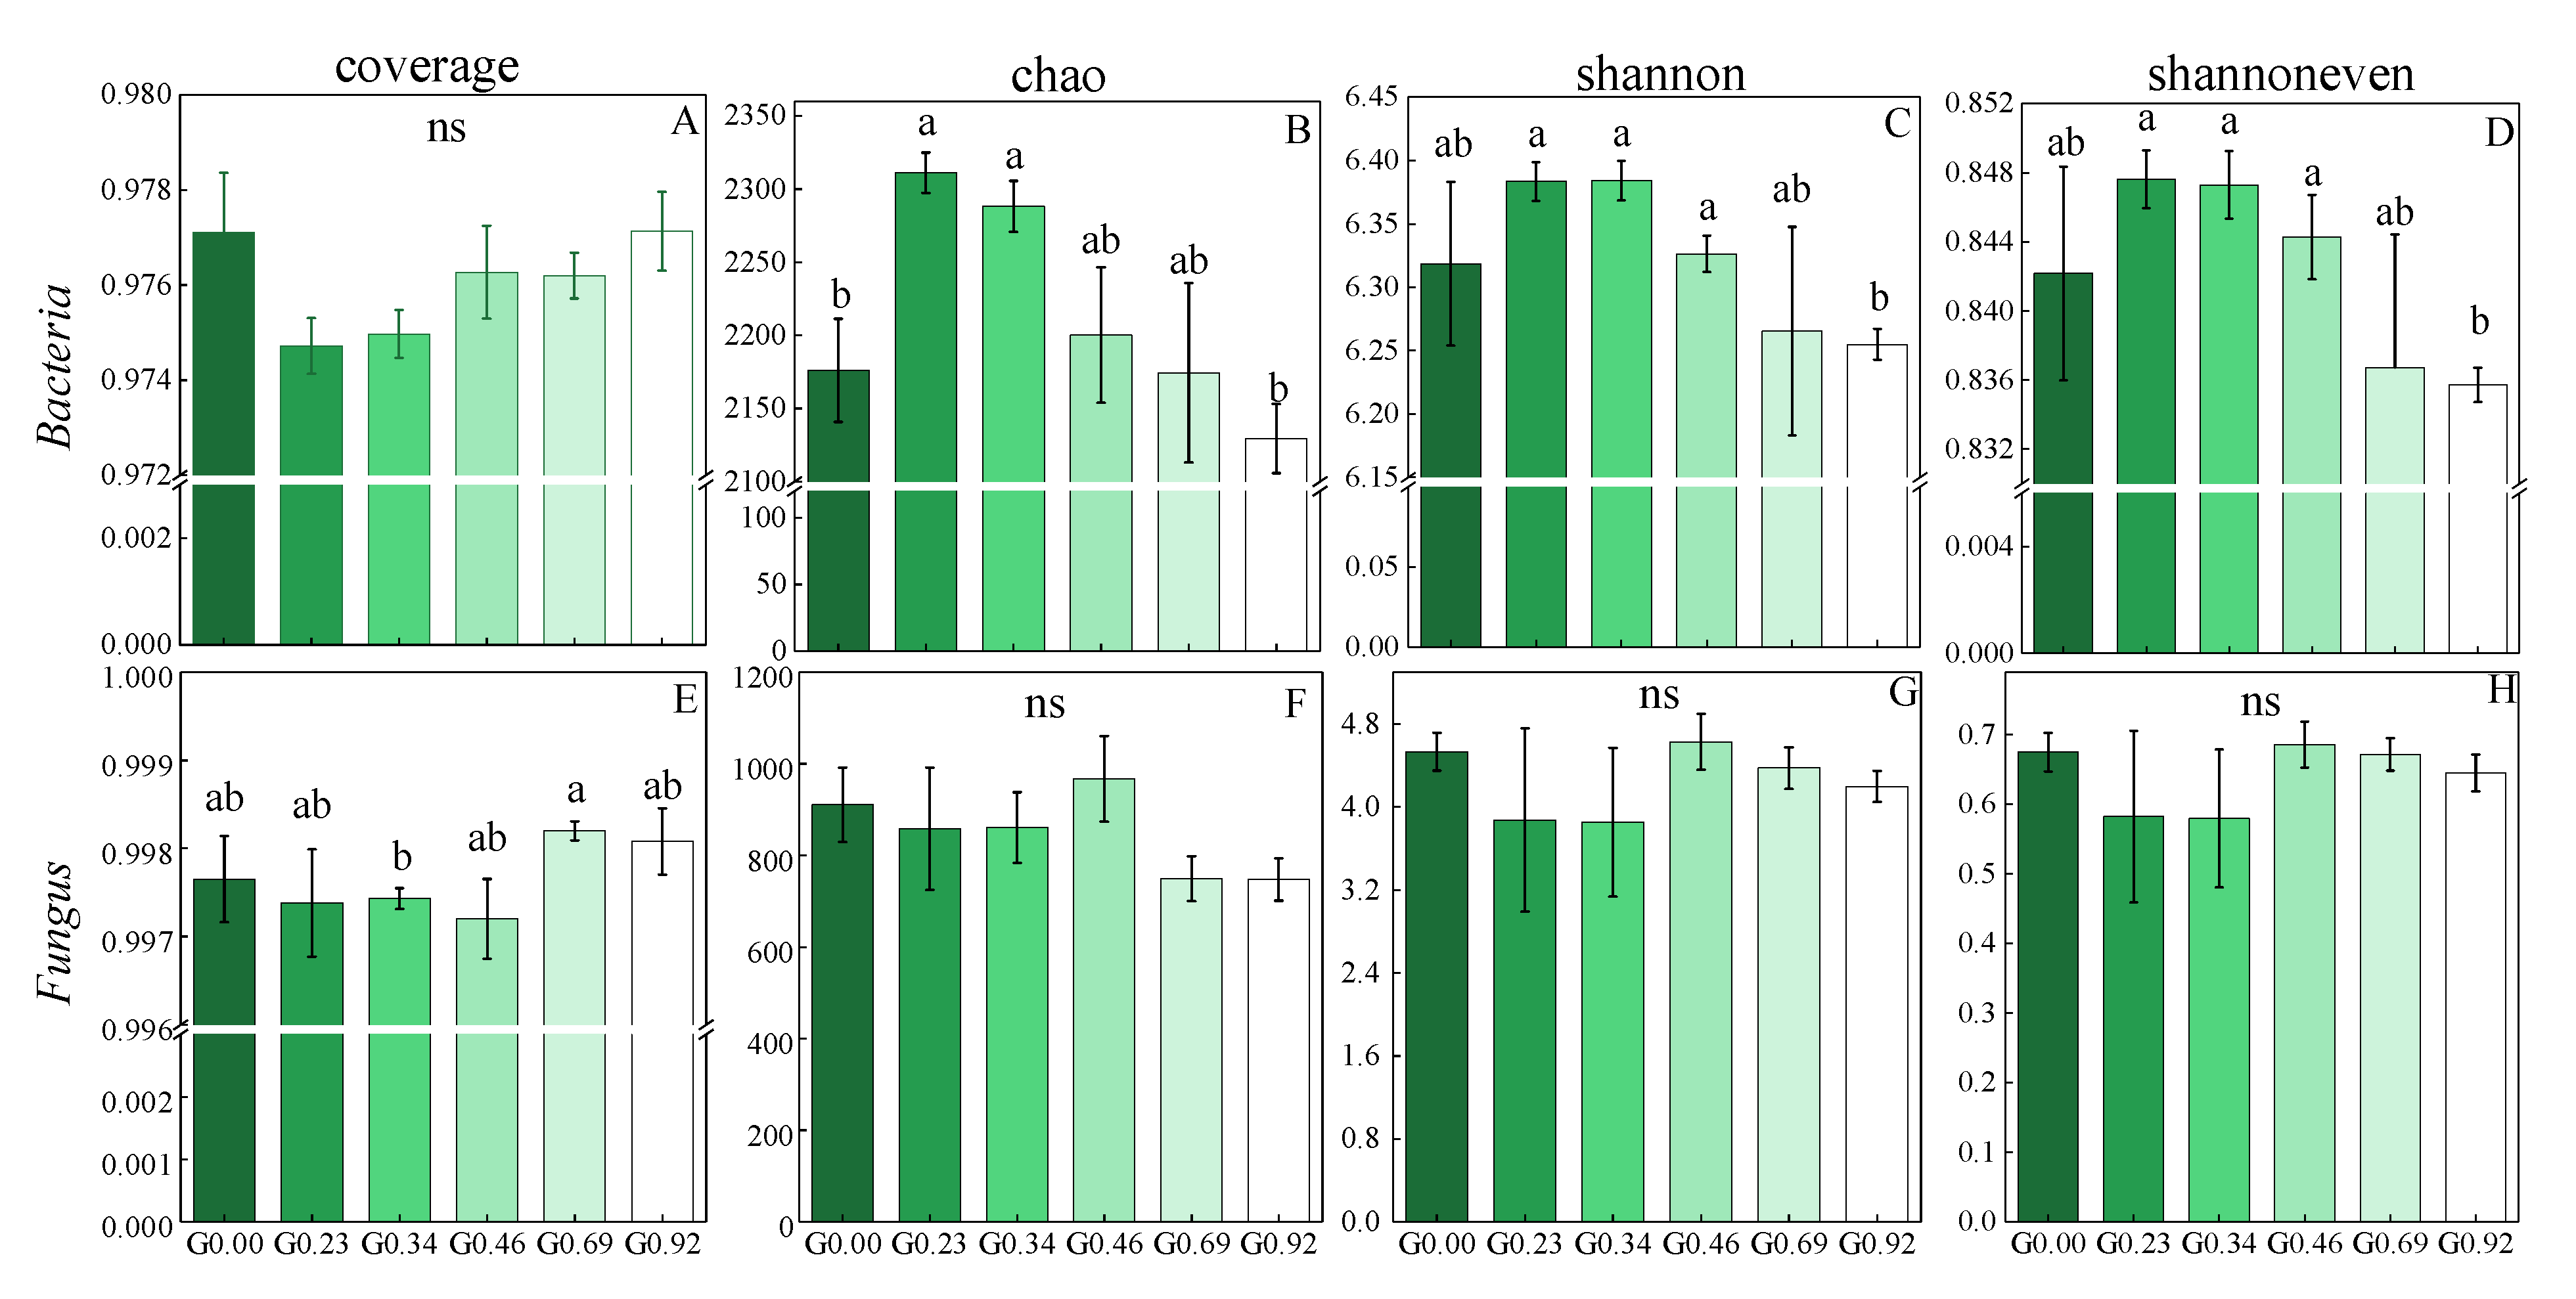
The soil microbial diversity indexes of the different grazing treatments are shown in Figure 3. The coverage value of each sample was higher than 0.97, which indicates that the sequences obtained by sequencing had a high coverage degree and good representativeness. The α-diversity indexes of G0.23 and G0.34 bacteria were higher than those of G0.00 and G0.92 grasses, consistent with the intermediate disturbance hypothesis. The Chao index of the fungus in the heavy grazing area was lower than that in the other treatments, while the Shannon and Shannon evenness indexes of the fungal communities were not significantly different among the grazing treatments.

3.4. The Relative Abundance of Dominant Microbial Taxa under Different Grazing Intensities

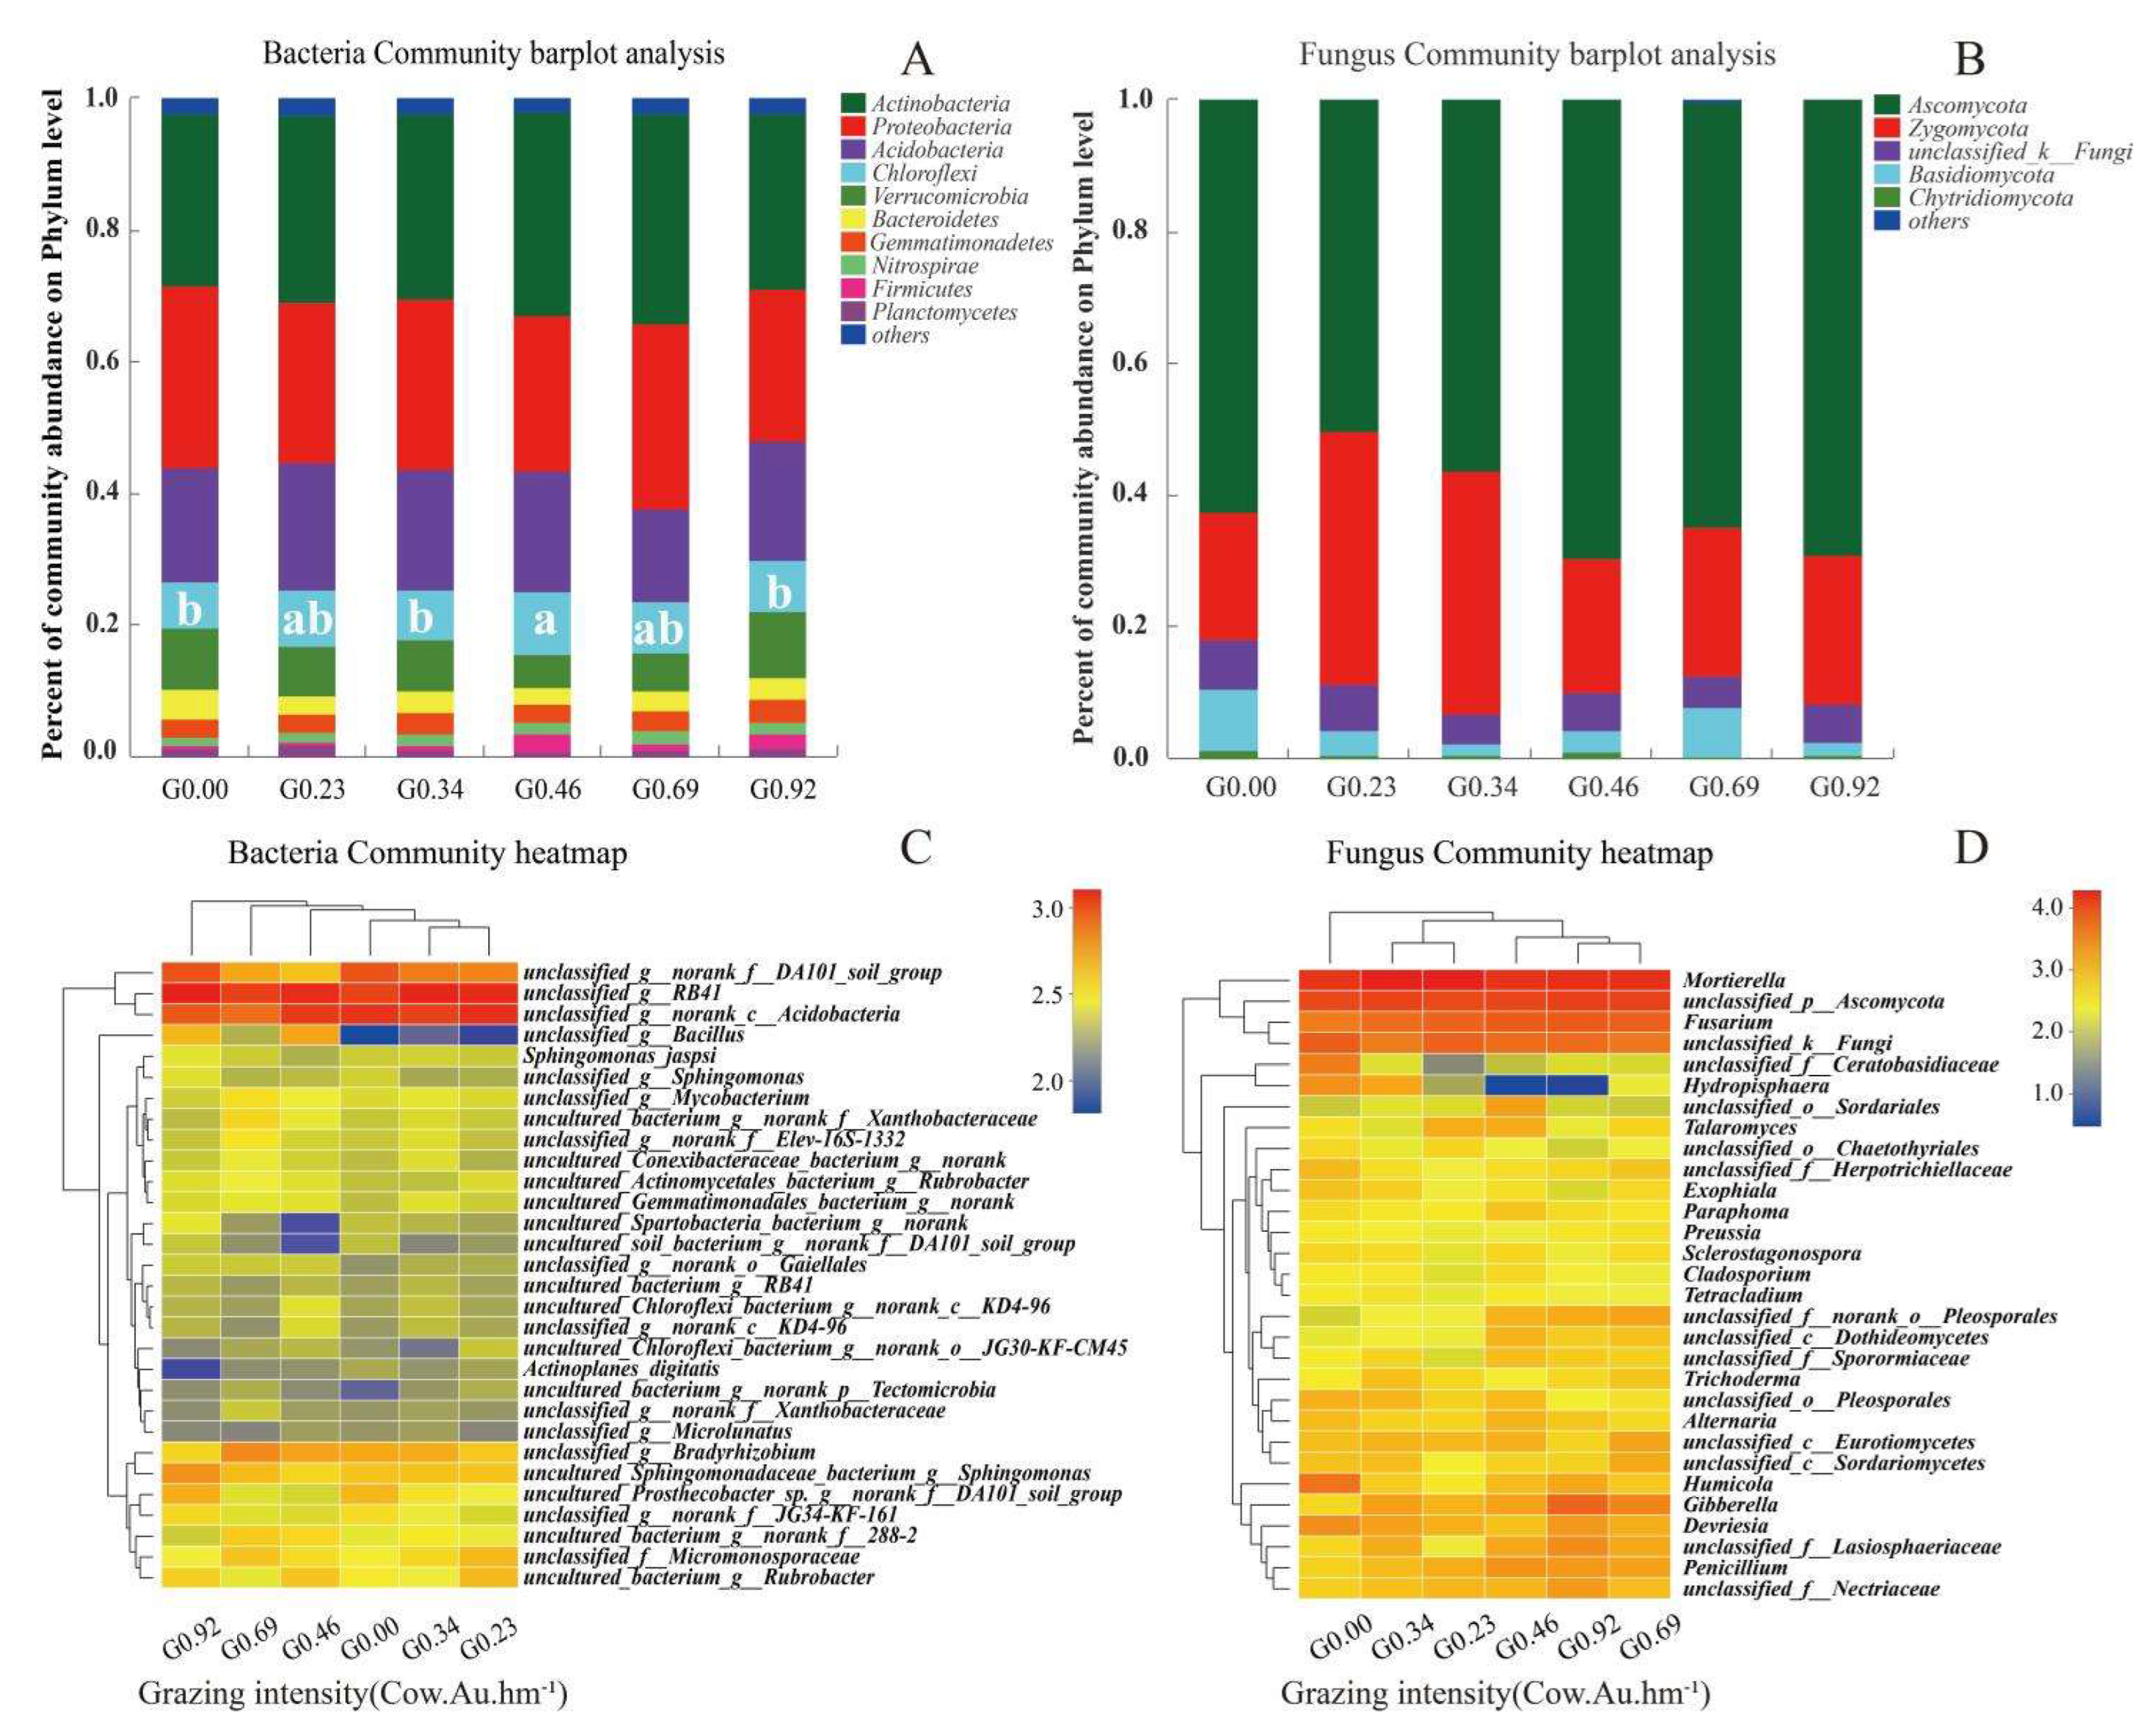
Histograms showing the dominant (abundance greater than 1%) soil bacterial (Figure 4A) and fungal (Figure 4B) phyla were drawn. The 10 most dominant (abundance values greater than 1%) bacterial phyla were Actinobacteria, Proteobacteria, Acidobacteria, Chloroflexi, Verrucomicrobia, Bacteroidetes, Gemmatimonadetes, Nitrospirae, Firmicutes, and Planctomycetes. Among these phyla, Chloroflexi differed significantly between different grazing intensities (p < 0.05), with the lowest abundance in the nongrazing plots and the heavy grazing plots, and the highest abundance in the medium grazing treatment (G0.46). The fungal community was dominated by the phyla Ascomycota, Zygomycota, Basidiomycota, and Chytridiomycota, and the abundance of Ascomycota in G0.46 was higher than that in the other treatments.

3.5. Microbial Taxa with Statistically Significant Differences

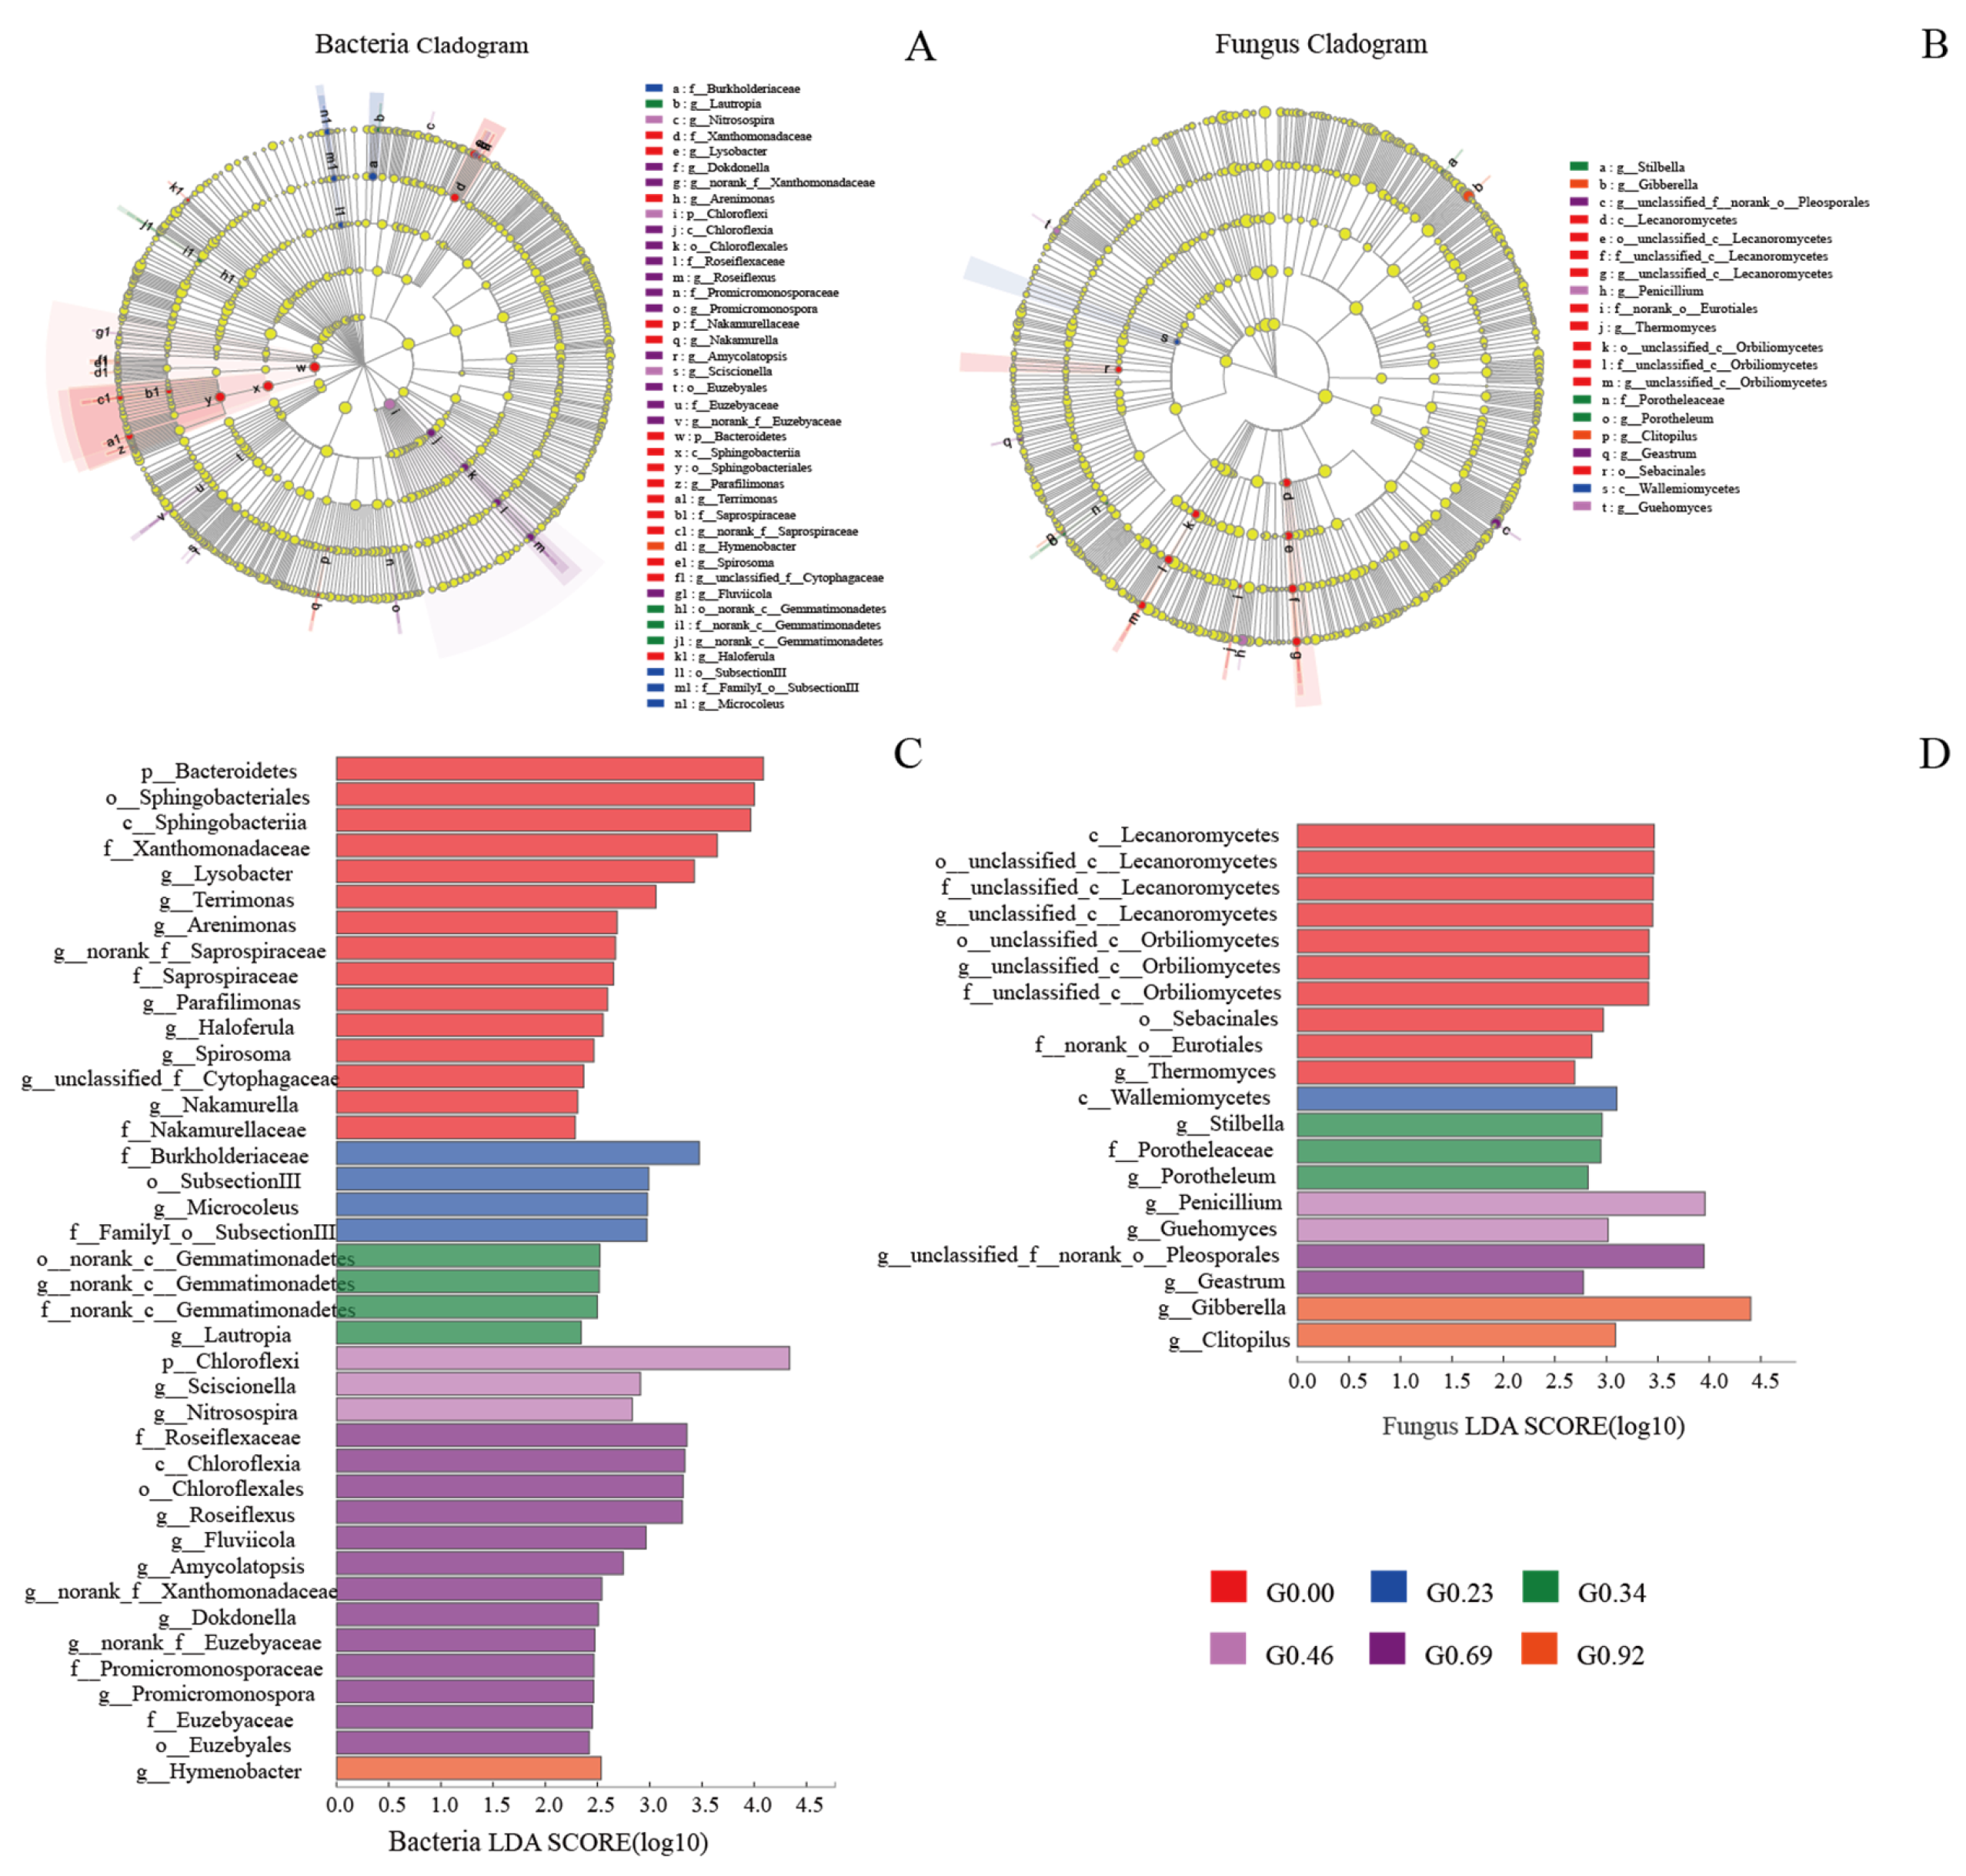
Microbial taxa with statistically significant differences were determined by using the LEfSe tool. Because the analysis of the large number of OTUs detected in the present study would be too computationally complex, statistical analysis was performed only from the domain to the genus level. Groups are shown in cladograms, and LDA scores of 2 or higher were confirmed via LEfSe (Figure 5A,B). Fifteen bacterial taxa were significantly enriched in G0.00, with p_Bacteroidetes, o_Sphingobacteriales, and c_Sphingobacteriia as the most important taxa (LDA >3.5) (Figure 5C). Four bacterial taxa were significantly enriched in G0.23, with f_Burkholderiaceae being the most important (LDA = 3.5). Four bacterial taxa were enriched in G0.34, of which o_norank_c_Gemmatimonadetes, g_norank_c_Gemmatimonadetes, and f_norank_c_Gemmatimonadetes were the most important (LDA = 2.5). Three bacterial taxa were significantly enriched in G0.46, and p_Chloroflexi was the most important (LDA >4.0). Thirteen species of bacteria were significantly enriched in G0.69, and f_Roseiflexaceae, c_Chloroflexia, o_Chloroflexales, and g_Roseiflexus were the most important (LDA >3.0). Only g_Hymenobacter microbes were significantly enriched in G0.92 (LDA >2.5). Ten fungi were significantly enriched in G0.00, and F_unclassified_CetesOrbiliomy cetes was the most important (LDA >3.0) (Figure 5D). Only c_Wallemiomycetes was significantly enriched in G0.23 (LDA >3.0). Three fungal taxa were significantly enriched in G0.34, with g_Stilbella, f_Porotheleaceae, and g_Porotheleum being more important (2.5 < LDA < 3). Two fungal taxa were significantly enriched in G0.46, and g_Penicillium was the most important (LDA >3.5). Two fungal taxa were significantly enriched in G0.69, and g_unclassified_f_norank_o_Pleosporales was the most important (LDA >3.5). Two fungal taxa were significantly enriched in G0.69, and g_Glitopilus was the most important (LDA >4.0).

3.6. Relationship between the Microbial Community Structure and Environmental Characteristics

3.6.1. Correlation between Plant and Soil Properties and the Relative Abundance of the Microbial Community

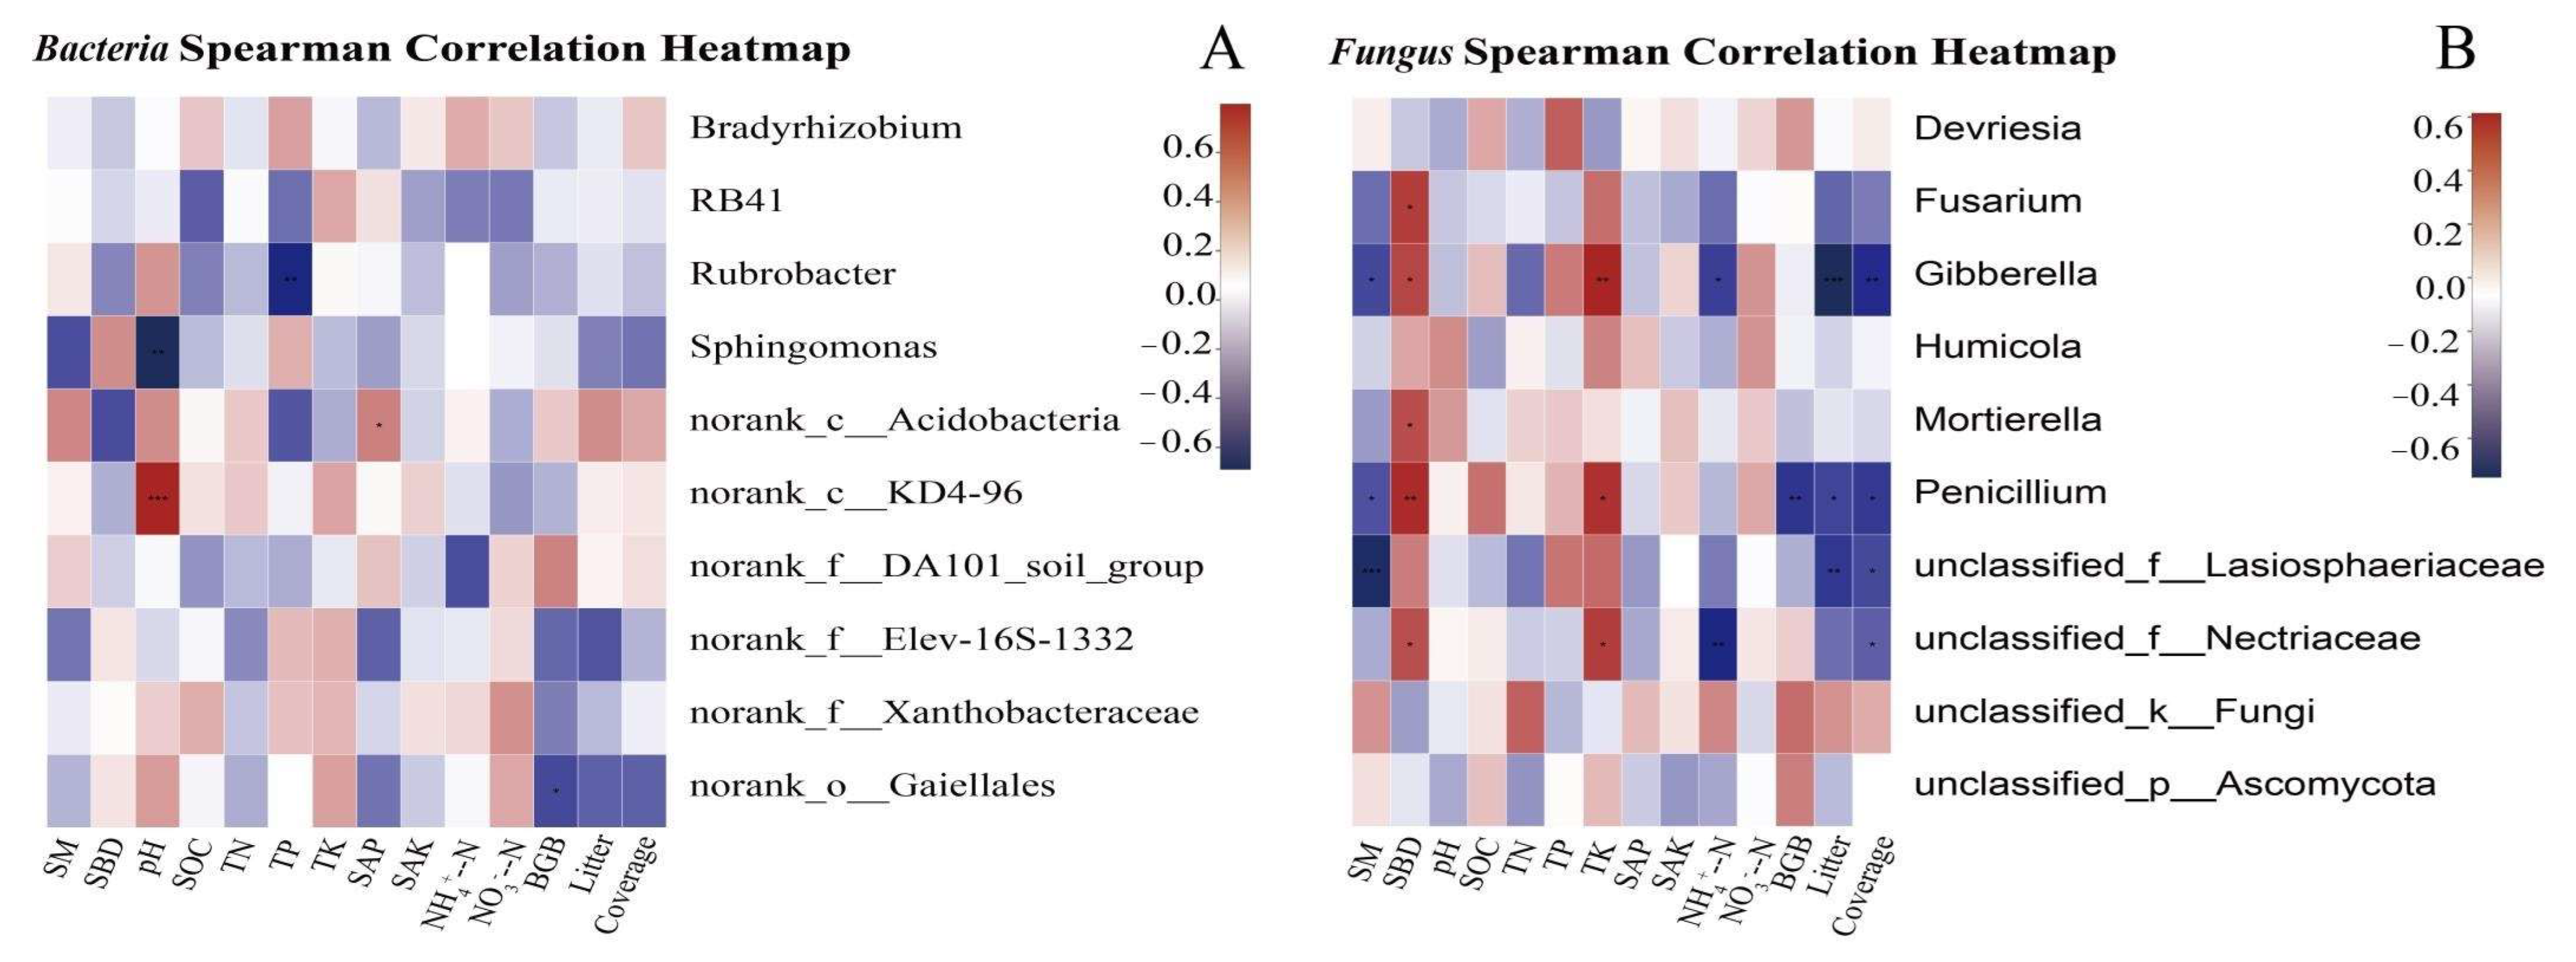
Spearman’s correlation analysis was used to evaluate the relationships between the environmental factors and the relative abundance of species. Norank_c_KD4-96 was significantly positively correlated with pH (Figure 6A). Norank_cacidobacteria was significantly positively correlated with SAP. Rubrobacter was significantly negatively correlated with TP, and norank_o_Gaiellales was significantly negatively correlated with BGB. Spearman correlation analysis showed that Fusarium, Mortierella and SBD were significantly positively correlated (p < 0.05). Gibberella was significantly correlated with SM (p < 0.05), SBD (p < 0.05), TK (p < 0.01), NH4+-N (p < 0.05), Mull (p < 0.001), and coverage (p < 0.01). The results showed a significant correlation between Penicillium and SM (p < 0.05), SBD (p < 0.01), and TK (p < 0.05). Unclassified_Fasiosphaeriaceae was significantly correlated with SM (p < 0.001), Mull (p < 0.01), and coverage (p < 0.05). A significant correlation was observed between unclassified_ f_ Nectriaceae and SBD (p < 0.05), TK (p < 0.05), NH4+-N (p < 0.05), and coverage (p < 0.05) (Figure 6B).
The correlations between the soil microbial community, community biomass, and soil nitrogen content are shown in Table 2. The analysis showed that soil microbial carbon and nitrogen were significantly positively correlated with the soil total nitrogen and ammonium nitrogen contents (p < 0.05), and the correlation coefficients (r) with total nitrogen were 0.78 and 0.71, respectively. The correlation coefficients (r) with the ammonium content were 0.53 and 0.55, respectively.

3.6.2. Major Environmental Factors Driving the Overall Changes in the Microbial Community Composition

Grazing changes microbial community structures and environmental characteristics. The present study investigated whether the microbial community structure and environmental characteristics were related. RDA revealed that the microbial community structure was formed by primary environmental characteristics, including SM, SBD, pH, SOC, TN, TP, TK, SAP, SAK, NH4+-N, NO3-N, BGB, litter, and coverage. After removal of the redundant variables, 14 environmental characteristics were chosen for RDA. As shown in (Figure 7A,B, BGB (p = 0.001) significantly affected the bacterial community structure, and pH (p = 0.032), TN (p = 0.011) and litter (p = 0.007) significantly affected the fungal community structure. The first two axes of the RDA of the bacterial community (Figure 7A) accounted for 71.56% of the total variation in the bacterial community composition, and the first axis accounted for 60.33% of the variation. The G0.23 samples were distributed together, although the sample distribution patterns of the other grazing intensities were discrete. The first two axes of the RDA of the fungal community (Figure 7B) accounted for 25.96% of the total variation in the fungal community composition, and the first axis accounted for 22.73% of the variation. The G0.00 and G0.92 samples were grouped together, although the sample distribution patterns of the other grazing intensities were discrete.
Variance partitioning analysis was performed to dissect the contributions of soil and plant characteristics to the variations in the overall microbial community composition. Together, these selected characteristics explained 46.98 and 61.77% of the bacterial and fungal community changes, respectively (Figure 7C,D). The contributions of soil and plant characteristics explained 45.35 and 0.75%, respectively, of the bacterial community changes and 55.26 and 4.69%, respectively, of the fungal community changes. The combined contribution of soil and plant characteristics explained 0.88 and 1.82% of the respective bacterial and fungal community changes, which revealed a very close interaction between soil and plant characteristics.

4. Discussion

Vegetation, soil, and microorganisms do not change in isolation, but form a feedback mechanism and interact with each other. Grazing livestock changes the growth of community plants, and soil trampling and excretion affect the nutrient cycles in the soil. Changes in plant growth patterns and the soil environment indirectly affect the microbial environment in the soil, which leads to changes in the microbial community. Soil provides a living environment for microbial communities, and soil characteristics affect microbial communities [30].
In this study, although the dominant phyla in the bacterial communities of Hulunbuir grassland soil were generally consistent under the six grazing intensities, differences were observed in the relative abundance, and each grazing treatment had its own unique fungal population. Bacterial diversity was the highest in the light grazing treatment, but fungal diversity was the highest in the no grazing treatment. Similarly, Lienhard et al. (2013) [31] reported that the greatest diversity of bacteria and fungi is likely to occur in different utilization practices. Soil microbial biomass or diversity might increase, decrease, or remain constant, depending on the type of grassland, geographical location, grazing system, and grazing intensity [9,10,14,16,23,32,33,34]. The microbial biomass carbon and nitrogen produced by beef cattle grazing decreased significantly in 2018 at all grazing intensities, consistent with a decrease in microbial biomass due to livestock grazing noted in a similar study by Li et al. (2020) [35].
The number of bacteria in the soil was the highest under the light grazing treatment, similar to the results observed in a semiarid natural grassland [36] and alpine meadow [18,37,38]. This suggests that the moderate grazing of herbivores increases soil bacterial abundance to a certain extent, and this increase may be related to the improvement of soil aeration by slight trampling of the litter layer and manure input [36]. Although the diversity of the bacterial and fungal communities responded differently to grazing intensity, the soil microbial community structure changed significantly along the grazing gradient, which was consistent with the changes in the soil and plant characteristics. We found that environmental changes with grazing intensity contributed differently to different microbial communities (Figure 4). Zhou et al. (2010) [14] found that livestock feeding affected the aboveground biomass and community structure and indirectly changed the soil physical and chemical properties, which was the result of microbial-plant interactions [39]. The fungal community structure in our study area was not as sensitive as the bacterial community structure to vegetation biomass changes. This may be because fungi are more likely than bacteria to degrade the lignocellulose of different plants, which allows fungi to first obtain resources from many related available substances [40]. We also found significant direct relationships between the bacterial and fungal community structures and soil total nitrogen. Soil nitrogen storage decreases with increasing grazing intensity [41,42]. Nitrogen is one of the most important nutrients for life. Therefore, plant and microbial activities may gradually reduce the content of nitrogen in soil [7]. However, correlations between the microbial communities and environmental factors must be carefully explained because it is usually difficult to determine the relationship between microbial communities and soil nutrient cycling [43]. The soil characteristic factors evaluated explained more than 45% of the shift in the microbial communities in this study, which suggested that soil characteristic factors were the primary factors influencing the microbial community structure. However, the factors affecting the dynamic changes in 40–55% of microbial communities could not be determined. Multiple studies have shown that light or moderate grazing has a relatively small impact on grassland soil, and these grazing intensities are conducive to dry matter production, nutrient cycling, and carbon and nitrogen storage [44,45]. The microbial community structure plays a crucial role in this process [46,47,48,49]. Soil microorganisms promote the material transformation and energy flow of the whole ecosystem and play a key role in maintaining the stability and development of grassland ecosystems, especially in the process of soil nitrogen transformation. At the same time, the microbial community structure will also be fed back by nitrogen transformation [50,51]. Our results showed that there was a strong correlation between microbial biomass carbon and nitrogen in the soil and the total nitrogen and ammonium nitrogen contents in the soil. Similar results were obtained in previous studies [52,53]. A large number of research results have showed that soil microorganisms change under different environments, thus affecting soil nitrogen transformation. For example, Yergeau et al. [54] found that seasonal freeze-thaw cycles affect soil microorganisms, which in turn affect the process of nitrogen transformation, and nitrogen transformation affects the soil microbial community.

5. Conclusions

It was observed that bacterial and fungal communities were extremely sensitive to grazing and varied with the grazing intensity. The diversity of soil bacteria in the light grazing test area was higher than that in the heavy grazing area, and the diversity of fungi in the non-grazing area was higher than that in the grazing plots. Heavy grazing reduced the diversity of soil bacteria and fungi. The belowground biomass of the plant community significantly influenced the bacterial community structure, and the pH, total nitrogen, and litter significantly influenced the fungal community. In conclusion, heavy grazing reduced the diversity of the belowground communities and is not conducive to the development of Hulunbuir meadow grassland. The disruptive effect of grazing on microbial communities occurred primarily through the removal of vegetation and litter mass, which changed the geophysical and chemical characteristics of the soil. The grazing intensity of 0.23 cows AU ha-1 had a relatively positive effect on the grassland soil and plant characteristics, which is conducive to promoting the sustainable development of grassland vegetation-soil microorganisms.

Author Contributions

Conceptualization, Y.Z. and R.Y.; methodology, Y.Z.; investigation, Y.Z., and M.W.; data curation, M.W., W.X., R.L., and R.Y.; writing—original draft preparation, Y.Z.; writing—review and editing, Y.Z., H.L., R.Z., X.W. and R.Y.; and funding acquisition, R.Y. and X.X. All authors have read and agreed to the published version of the manuscript.

Funding

This work was funded by the National Natural Science Foundation of China (31971769, 32130070), the National Key Research and Development Program of China (2021YFD1300503, 2021YFF0703904), the Special Funding for Modern Agricultural Technology Systems from the Chinese Ministry of Agriculture (CARS-34), and the Fundamental Research Funds Central Non-Profit Scientific Institution (1610132021016).

Data Availability Statement

Not applicable.

Acknowledgments

The authors thank the reviewers and editor for their insightful comments and constructive suggestions.

Conflicts of Interest

The authors declare no conflict of interest.

Abbreviations

SMsoil moisture
SBDsoil bulk density
SOCsoil organic carbon
TNtotal nitrogen
TPtotal phosphorus
TKtotal potassium
SAPsoil available phosphorus
SAKsoil available potassium
NH4+-Nsoil ammonium nitrogen
NO3-Nsoil nitrate nitrogen
BGBbelowground biomass

References

  1. Yang, Y.; Wu, L.; Lin, Q. Responses of the functional structure of soil microbial community to livestock grazing in the Tibetan alpine grassland. Glob. Change Biol. 2013, 19, 637–648. [Google Scholar] [CrossRef] [PubMed]
  2. Nielsen, M.N.; Winding, A. Microorganisms as Indicators of Soil Health; Technical Report No. 388; National Environmental Research Institute: Roskilde, Danmark, 2002. [Google Scholar]
  3. Lecain, D.R.; Morgan, J.A.; Schuman, G.E.; Reeder, J.D.; Hart, R.H. Carbon exchange and species composition of grazed pastures and exclosures in the shortgrass steppe of colorado. Agric. Ecosyst. Environ. 2002, 93, 421–435. [Google Scholar] [CrossRef]
  4. Branson, F.A.; Miller, R.F. Effects of increased precipitation and grazing management on northeastern montana rangelands. J. Range Manag. 1981, 34, 3–10. [Google Scholar] [CrossRef]
  5. Sheng, H.Y.; Cao, G.M.; Li, G.R.; Zhou, J.J.; Jiao, W.Y.; Li, J.P.; Zhan, P. Effect of grazing disturbance on plant community of alpine meadow dominated by Potentilla froticosa shrub on Qilian Mountain. Ecol. Environ. Sci. 2009, 18, 235–241. [Google Scholar]
  6. Yan, R.R.; Xin, X.P.; Yan, Y.C. Impacts of Differing Grazing Rates on Canopy Structure and Species Composition in Hulunber Meadow Steppe. Rangel. Ecol. Manag. 2015, 68, 54–64. [Google Scholar] [CrossRef]
  7. Hu, H.; Chen, X.; Hou, F.; Wu, Y.; Cheng, Y. Bacterial and fungal community structures in loess plateau grasslands with different grazing intensities. Front. Microbiol. 2017, 8, 606. [Google Scholar]
  8. Na, X.F.; Zheng, G.Q.; Peng, L. Changes of microbial diversity in the rhizosphere of Lycium barbarum l. from Ningxia. Chin. J. Soil Sci. 2016, 53, 241–252. [Google Scholar]
  9. Ford, H.; Rousk, J.; Garbutt, A.; Jones, L.; Jones, D.L. Grazing effects on microbial community composition, growth and nutrient cycling in salt marsh and sand dune grasslands. Biol. Fert. Soils. 2013, 49, 89–98. [Google Scholar] [CrossRef]
  10. Qi, S.; Zheng, H.; Lin, Q.; Li, G.; Xi, Z.; Zhao, X. Effects of livestock grazing intensity on soil biota in a semiarid steppe of inner mongolia. Plant Soil 2011, 340, 117–126. [Google Scholar] [CrossRef]
  11. Shan, G.L.; Chen, G.; Ning, F. Dynamic changes of soil microbial and enzyme activities in typical grassland during restoration and succession. Grassl. J. 2012, 20, 292–297. [Google Scholar]
  12. Wakelin, S.A.; Gregg, A.L.; Simpson, R.J.; Li, G.D.; Riley, I.T.; Mckay, A.C. Pasture management clearly affects soil microbial community structure and Ncycling bacteria. Pedobiologia 2009, 52, 237–251. [Google Scholar] [CrossRef]
  13. Zhou, X.; Wang, J.; Hao, Y.; Wang, Y. Intermediate grazing intensities by sheep increase soil bacterial diversities in an Inner Mongolian steppe. Biol. Fertil. Soils 2010, 46, 817–824. [Google Scholar] [CrossRef] [Green Version]
  14. Zhang, W.W.; Gan, J.G.; Han, Z.W. Carbon and Nitrogen content of microbial biomass in artificial grassland under different grazing intensities. Acta Grassl. Sin. 2003, 11, 343–345. [Google Scholar]
  15. Cao, C.Y.; Shao, J.F.; Jiang, D.M.; Cui, Z.B. Effects of Fence Enclosure on Soil Nutrients and Biological Activities in Highly Degraded Grasslands. J. Northeast. Univ. (Nat. Sci.) 2011, 32, 427–430. [Google Scholar]
  16. Gou, Y.N.; Nan, Z.B. Effects of grazing on soil microorganisms in grassland. Acta. Ecol. Sin. 2015, 24, 194–205. [Google Scholar]
  17. Sun, Y.F.; Shen, J.P.; Zhang, C.J. Changes of soil ammonia oxidation and denitrifying microorganisms under different grazing intensities. Acta. Ecol. Sinica. 2018, 38, 1–10. [Google Scholar]
  18. Xun, W.; Yan, R.; Ren, Y.; Jin, D.; Xiong, W.; Zhang, G. Grazing-induced microbiome alterations drive soil organic carbon turnover and productivity in meadow steppe. Microbiome 2018, 6, 170. [Google Scholar] [CrossRef] [Green Version]
  19. Hu, Y.F.; Peng, J.J.; Yuan, S. Influence of ecological restoration on vegetation and soil microbiological properties in Alpine-cold semi-humid desertified land. Ecol. Eng. 2016, 94, 88–94. [Google Scholar] [CrossRef]
  20. Zhang, Y.; Dong, S.; Gao, Q. Soil bacterial and fungal diversity differently correlated with soil biochemistry in alpine grassland ecosystems in response to environmental changes. Sci. Rep. 2017, 7, 43077. [Google Scholar] [CrossRef] [Green Version]
  21. Zhao, Q.; Niu, H.; Wang, Y.; Cui, X.; Li, Y.; Yu, Z. Response of soil bacterial communities to moisture and grazing in the Tibetan alpine steppes on a small spatial scale. Geomicrobiol. J. 2019, 36, 559–569. [Google Scholar] [CrossRef]
  22. Regan, K.M.; Nunan, N.; Boeddinghaus, R.S.; Baumgartner, V.; Marhan, S. Seasonal controls on grassland microbial biogeography: Are they governed by plants, abiotic properties or both. Soil Biol. Biochem. 2014, 71, 21–30. [Google Scholar] [CrossRef]
  23. Wang, K.H.; Mcsorley, R.; Bohlen, P.; Gathumbi, S.M. Cattle grazing increases microbial biomass and alters soil nematode communities in subtropical pastures. Soil Biol. Biochem. 2006, 38, 1956–1965. [Google Scholar] [CrossRef]
  24. Zhang, Y.; Zhao, J.; Xin, X.P.; Wang, M.; Pan, F.J.; Yan, R.R.; Li, L.H. Effects of stocking rate on interannual ecosystem biomass and soil nitrogen processes in a meadow steppe of northeast China. Plant Soil 2022, 473, 9–31. [Google Scholar] [CrossRef]
  25. Vance, E.D.; Brookes, P.C.; Jenkinson, D.S. An extraction method for measuring soil microbial biomass C. Soil Biol. Biochem. 1987, 19, 703–707. [Google Scholar] [CrossRef]
  26. Huws, S.A.; Edwards, J.E.; Kim, E.J.; Scollan, N.D. Specificity and sensitivity of eubacterial primers utilized for molecular profiling of bacteria within complex microbial ecosystems. J. Microbiol Meth. 2007, 70, 565–569. [Google Scholar] [CrossRef] [PubMed]
  27. Rousk, J.; Baath, E.; Brookes, P.C. Soil bacteria and fungal communities across a pH gradient in an arable soil. ISME J. 2010, 4, 1340–1351. [Google Scholar] [CrossRef]
  28. Shannon, C.E. A mathematical theory of communication. Bell Syst. Tech. J. 1948, 27, 379–423, 623–656. [Google Scholar] [CrossRef] [Green Version]
  29. Segata, N.; Izard, J.; Waldron, L. Metagenomic biomarker discovery and explanation. Genome Biol. 2011, 12, 60. [Google Scholar] [CrossRef] [Green Version]
  30. Yang, Y.; Jia, L.X.; Qiao, J.R.; Li, M.R.; Zhang, F.; Chen, D.L. Effects of heavy grazing on soil nutrient and microbial diversity in desert steppe. Chin. J. Grassl. 2019, 41, 72–79. [Google Scholar]
  31. Lienhard, P.; Tivet, F.; Chabanne, A. No-till and cover crops shift soil microbial abundance and diversity in Laos tropical grassland. Agron. Sustain. Dev. 2013, 33, 375–384. [Google Scholar] [CrossRef] [Green Version]
  32. Ruess, R.W.; Mc Naughton, S.J. Grazing and the dynamics of nutrient and energy regulated microbial processes in the Serengeti grasslands. Oikos 1987, 49, 101–110. [Google Scholar] [CrossRef]
  33. Jangid, K.; Williams, M.A.; Franzluebbers, A.J.; Sanderlin, J.S.; Reeves, J.H.; Jenkins, M.B.; Endale, D.M.; Coleman, D.C.; Whitman, W.B. Relative impacts of land-use, management intensity and fertilization upon soil microbial community structure in agricultural systems. Soil Biol. Biochem. 2008, 40, 2843–2853. [Google Scholar] [CrossRef]
  34. Death, R.G.; Barquín, J. Geographic location alters the diversity-disturbance response. Freshw Sci. 2012, 31, 636–646. [Google Scholar] [CrossRef]
  35. Li, L.H.; Chen, J.Q.; Han, X.G.; Zhang, W.H.; Shao, C.L. Grassland Ecosystems of China; Springer: Singapore, 2020. [Google Scholar]
  36. Bardgett, R.D.; Wardle, D.A.; Yeates, G.W. Linking above-ground and belo-wground interactions: How plant responses to foliar herbivory influence soil organisms. Soil Biol. Biochem. 1998, 30, 1867–1878. [Google Scholar] [CrossRef]
  37. Hu, J.; Wu, J.; Ma, M.; Nielsen, U.N.; Wang, J.; Du, G. Nematode communities response to long-term grazing disturbance on Tibetan plateau. Eur. J. Soil Biol. 2015, 69, 24–32. [Google Scholar] [CrossRef]
  38. Wang, X.; Nielsen, U.N.; Yang, X.; Zhang, L.; Zhou, X.; Du, G.; Li, G.; Chen, S.; Xiao, S. Grazing induces direct and indirect shrub effects on soil nematode communities. Soil Biol. Biochem. 2018, 121, 193–201. [Google Scholar] [CrossRef]
  39. Randy, O.C.; Contreras-Cornejo, H.A.; Lourdes, M.R.; José, L.B. The role of microbial signals in plant growth and development. Plant Signal. Behav. 2009, 4, 701–712. [Google Scholar]
  40. Chapin, F.S., III; Matson, P.A.; Vitousek, P. Principles of Terrestrial Ecosystem Ecology, 2nd ed.; Springer: New York, NY, USA, 2011. [Google Scholar]
  41. Cui, X.; Wang, Y.; Niu, H.; Wu, J.; Wang, S.; Schnug, E.; Rogasik, J.; Fleckenstein, J.; Tang, Y.H. Effect of long-term grazing on soil organic carbon content in semiarid steppes in inner mongolia. Ecol. Res. 2005, 20, 519–527. [Google Scholar] [CrossRef]
  42. He, N.P.; Yu, Q.; Wu, L.; Wang, Y.; Han, X.G. Carbon and nitrogen store and storage potential as affected by land-use in a Leymus chinensis grassland of northern China. Soil Biol. Biochem. 2008, 40, 2952–2959. [Google Scholar] [CrossRef]
  43. Bardgett, R.D. The Biology of Soil, a Community and Ecosystem Approach; Oxford University Press: New York, NY, USA, 2005. [Google Scholar]
  44. Li, C.L.; Hao, X.Y.; Zhao, M.L.; Han, G.D.; Willms, W.D. Influence of historic sheep grazing on vegetation and soil properties of a desert steppe in Inner Mongolia. Agric. Ecosyst. Environ. 2008, 128, 109–116. [Google Scholar] [CrossRef]
  45. Chen, Y.P.; Li, Y.Q.; Zhao, X.Y.; Luo, Y.Q.; Shang, W. Light fraction and total organic carbon and nitrogen stores in desertified sandy grassland soil as affected by grazing and livestock exclusion. J. Soil Water Conserv. 2010, 24, 182–186. [Google Scholar]
  46. Björsne, A.K.; Rütting, T.; Ambus, P. Combined climate factors alleviate changes in gross soil nitrogen dynamics in heathlands. Biogeochemistry 2014, 120, 191–201. [Google Scholar] [CrossRef]
  47. Cheng, Y.; Wang, J.; Wang, S.Q.; Zhang, J.B.; Cai, Z.C. Effects of soil moisture on gross N transformations and N2O emission in acid subtropical forest soils. Biol. Fert. Soils 2014, 50, 1099–1108. [Google Scholar] [CrossRef]
  48. Zhang, X.Z.; Shen, Z.X.; Fu, G. A meta-analysis of the effects of experimental warming on soil carbon and nitrogen dynamics on the Tibetan Plateau. Appl. Soil Ecol. 2015, 87, 32–38. [Google Scholar] [CrossRef]
  49. Zhu, T.B.; Zeng, S.M.; Qin, H.L.; Zhou, K.X.; Yang, H.; Lan, F.N.; Huang, F.; Cao, J.H.; Müller, C. Low nitrate retention capacity in calcareous soil under woodland in the karst region of southwestern China. Soil Biol. Biochem. 2016, 97, 99–101. [Google Scholar] [CrossRef]
  50. Castellano, H.A.; Chart’eris, A.F.; Müller, C.; Jansen-Willems, A.; González-López, J.; Bedmar, E.J.; Carrillo, P.; Cárdenas, L.M. Occurrence and 15N-quantification of simultaneous nitrification and denitrification in N-fertilised soils incubated under oxygen-limiting conditions. Soil Biol. Biochem. 2020, 143, 107757. [Google Scholar] [CrossRef]
  51. Lafftte, A.; Florio, A.; Andrianarisoa, K.S.; Chatelliers, C.C.D.; Schloter, H.B.; Ndaw, S.M.; Periot, C.; Schloter, M.; Zeller, B.; Poly, F.; et al. Biological inhibition of soil nitrification by forest tree species affects Nitrobacter populations. Environ. Microbiol. 2020, 22, 1141–1153. [Google Scholar] [CrossRef]
  52. Bengtsson, G.; Bengtson, P.; Mnsson, K.F. Gross nitrogen mineralization-, immobilization, and nitrification rates as a function of soil C/N ratio and microbial activity. Soil Biol. Biochem. 2003, 35, 143–154. [Google Scholar] [CrossRef]
  53. Hossain, A.K.M.A.; Raison, R.J.; Khanna, P.K. Effect of fertilize application and fire regime on soil mineralization in an Australia subalpine eucalypt forest. Biol. Fert. Soils 1995, 19, 246–252. [Google Scholar] [CrossRef]
  54. Yergeau, E.; Kowalchuk, G.A. Responses of Antarctic soil microbial communities and associated functions to temperature and freeze-thaw cycle frequency. Environ. Microbiol. 2008, 10, 2223–2235. [Google Scholar] [CrossRef]
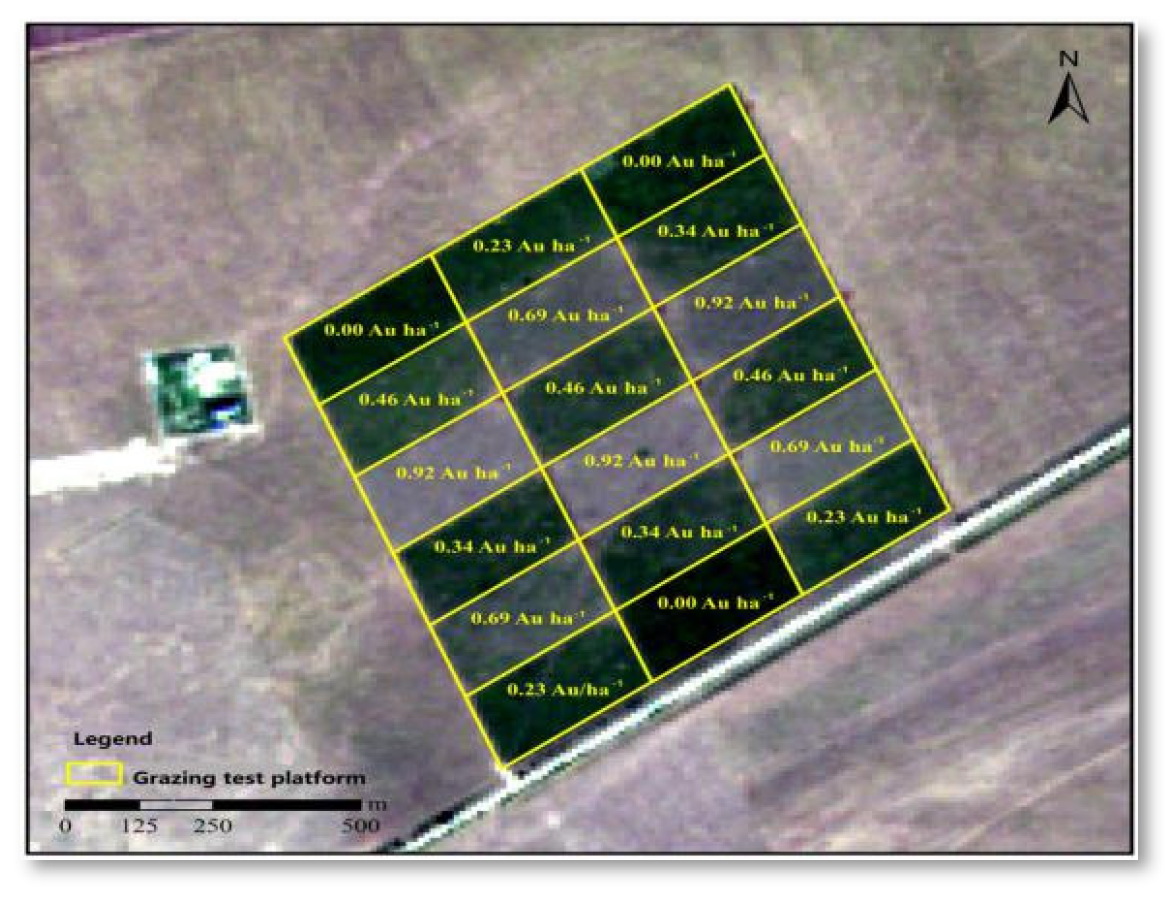
Figure 1. Geographic location of the study site and design diagram of different cattle grazing intensities. The values 0.00, 0.23, 0.34, 0.46, 0.69, and 0.92 AU ha−1 correspond to different livestock rates (1 AU = 500 kg of adult cattle). Stocking rates were achieved using 0, 2, 3, 4, 6, and 8 young cattle (250–300 kg) per plot.
Agronomy 13 00708 g001
Figure 2. Microbial carbon (MBC) (A) and nitrogen (MBN) (B) contents in August 2018 under different grazing intensities. Lowercase letters represent significant differences between different grazing intensities (p < 0.05); Capital letters represent significant differences between different soil depth (p < 0.05).
Agronomy 13 00708 g002
Figure 3. Estimated diversity indexes of bacterial and fungal communities. (AD) are the diversity indexs of bacteria; (EH) are the diversity indexs of fungal. Significant differences are indicated by different letters.
Agronomy 13 00708 g003
Figure 4. Relative abundance of dominant bacterial (A) and fungal (B) phyla. Heatmaps of bacteria (C) and fungi (D). In panels (A,B), different column colors represent different species, and the column length represents the proportion of the species. In (C,D), the ordinate is the species name, and the variation in abundance of different species in the sample is shown by the color gradient of the color block. Color gradients are used to represent the data values in a two-dimensional matrix or table and to present information about community species composition and species abundance. Clustering was carried out according to the similarity of the abundance between species or samples, and the results are presented in the heatmap, which groups the species with high- and low-abundance clusters in blocks and reflects the similarities and differences in the community composition of different groups (or samples) at each taxonomic level through color changes and similarity degrees. Significant differences are indicated by different letters.
Agronomy 13 00708 g004
Figure 5. Phylogenetic distribution of the bacterial and fungal lineages associated with soils from different grazing intensities (cladogram) (A,B). Indicator bacteria with LDA scores of 2 or greater in bacterial and fungal communities associated with soils from different grazing intensities (C,D). Different-colored regions represent different constituents. Circles indicate phylogenetic levels from the domain to the genus. The diameter of each circle is proportional to the abundance of the group. Different-colored regions represent different grazing intensities.
Agronomy 13 00708 g005
Figure 6. Heatmap analyses of the correlations between bacterial and fungal species abundance and environmental factors. (A) is the Heatmap of bacteria; (B) is the Heatmap of fungal. The Spearman correlation coefficient was calculated between the environmental factors and the abundance of the top 10 species to obtain the numerical matrix that is visually displayed in the heatmap. The X-axis and the Y-axis are the environmental factors and species, respectively. Color changes reflect the data in the two-dimensional matrix or table. The color depth represents the data values. The legend on the right is the color interval of different R values. * 0.01 < p ≤0.05, ** 0.001 < p ≤ 0.01, *** p ≤ 0.001.
Agronomy 13 00708 g006
Figure 7. Redundancy analysis (RDA) of MiSeq data (symbols) and environmental characteristics (arrows) for the bacterial (A) and fungal (B) communities. Different shapes represent groups of samples under different grazing intensities. The values of axes 1 and 2 are the percentages explained by the corresponding axis. Analysis of the level of contribution of soil and plant characteristics to changes in bacterial (C) and fungal (D) communities.
Agronomy 13 00708 g007
Table 1. Soil properties and vegetation characteristics (mean ± s.e.) under different grazing intensities after ten years of grazing.
Soil PropertiesVegetation Characteristics
FactorsSM (%)SBD (g/cm3)pHSOC (g/kg)TN (g/kg)TP (g/kg)TK (g/kg)AP (mg/kg)AK (mg/kg)NH4+-N (mg/kg)NO3-N(mg/kg)BGB (g/m2)Litter (g/m2)Coverage (%)
G0.0020.81 ± 1.00 a0.96 ± 0.02 a6.94 ± 0.45 a39.23 ± 0.07 a3.37 ± 0.11 ab0.43 ± 0.03 a15.85 ± 0.45 b3.73 ± 0.17 a309.80 ± 77.40 a5.72 ± 0.95 a20.09 ± 3.21 b1,162.38 ± 145.85 a206.28 ± 27.41 a84.65 ± 0.63 a
G0.2320.34 ± 0.57 ab0.99 ± 0.03 a6.59 ± 0.16 a41.26 ± 1.14 a3.39 ± 0.08 ab0.38 ± 0.01 a17.28 ± 0.44 ab3.80 ± 0.17 a314.44 ± 12.46 a5.38 ± 0.66 a16.08 ± 1.20 b972.48 ± 69.38 ab135.48 ± 15.77 b80.25 ± 1.16 ab
G0.3419.53 ± 0.65 ab1.01 ± 0.01 a6.59 ± 0.12 a42.72 ± 2.52 a3.34 ± 0.09 ab0.44 ± 0.00 a17.62 ± 0.28 a3.74 ± 0.55 a279.32 ± 35.12 a6.22 ± 1.17 a18.91 ± 2.28 b1,011.36 ± 112.08 ab105.36 ± 31.84 b80.12 ± 1.80 ab
G0.4618.47 ± 0.90 bc1.02 ± 0.04 a6.89 ± 0.10 a44.07 ± 3.15 a3.41 ± 0.03 a0.41 ± 0.04 a18.84 ± 0.59 a3.70 ± 0.73 a354.71 ± 73.45 a5.85 ± 1.48 a17.94 ± 2.39 b605.31 ± 59.90 c67.02 ± 27.94 bc78.01 ± 1.34 b
G0.6918.01 ± 0.19 c1.03 ± 0.01 a6.47 ± 0.09 a43.78 ± 4.63 a3.18 ± 0.04 ab0.48 ± 0.05 a18.93 ± 0.89 a3.46 ± 0.28 a307.49 ± 56.78 a4.66 ± 1.08 a34.97 ± 8.63 a790.75 ± 70.41 bc0.00 ± 0.00 c78.23 ± 10.49 b
G0.9217.94 ± 0.59 c1.05 ± 0.04 a6.59 ± 0.05 a38.32 ± 1.80 a3.13 ± 0.09 b0.46 ± 0.08 a18.69 ± 0.42 a3.24 ± 0.12 a330.37 ± 25.75 a3.22 ± 0.00 a21.31 ± 1.47 b849.41 ± 96.75 abc0.00 ± 0.00 c68.84 ± 2.87 c
Note: Values followed by different lowercase letters in a row indicate significant differences (p < 0.05) between treatments; SM, soil moisture; SBD, soil bulk density; SOC, soil organic carbon; TN, total nitrogen; TP, total phosphorus; TK, total potassium; AP, soil available phosphorus; AK, soil available potassium; NH4+-N, soil ammonium; NO3-N, soil nitrate; and BGB, belowground biomass.
Table 2. Relationship between soil microorganisms and nitrogen conversion.
TN
(g/kg)
SAN
(mg/kg)
NH4+-N
(mg/kg)
NO3-N
(mg/kg)
MBC (mg/kg)0.78 **−0.060.53 *−0.12
MBN (mg/kg)0.71 **−0.020.55 *−0.11
BacteriaShannon0.07−0.020.40−0.32
Shannon evenness−0.02−0.080.40−0.33
FungusShannon−0.36−0.150.010.15
Shannon evenness−0.40−0.16−0.050.19
Note: **, significant (p < 0.05); *, significant (p < 0.05).
Disclaimer/Publisher’s Note: The statements, opinions and data contained in all publications are solely those of the individual author(s) and contributor(s) and not of MDPI and/or the editor(s). MDPI and/or the editor(s) disclaim responsibility for any injury to people or property resulting from any ideas, methods, instructions or products referred to in the content.