Article

Optimization of Fluidized-Bed Process Parameters for Coating Uniformity and Nutrient-Release Characteristics of Controlled-Release Urea Produced by Modified Lignocellulosic Coating Material

by
Arshid Mahmood Ali
1,*,
Babar Azeem
2,*,
Ahmad M. Alghamdi
3,
Khurram Shahzad
4,
Abdulrahim Ahmad Al-Zahrani
1,
Muhammad Imtiaz Rashid
4,
Aishah Binti Mahpudz
5 and
Asif Jamil
6
1
Department of Chemical & Materials Engineering, Faculty of Engineering, King Abdulaziz University, Jeddah 21589, Saudi Arabia
2
Department of Chemical Engineering, Faculty of Engineering, Universiti Teknologi PETRONAS, Seri Iskandar 32610, Perak Darul Ridzuan, Malaysia
3
Department of Chemical Engineering, College of Engineering, Imam Mohammad Ibn Saud Islamic University, Riyadh 11432, Saudi Arabia
4
Center of Excellence in Environmental Studies (CEES), King Abdulaziz University, Jeddah 21589, Saudi Arabia
5
HICoE-Center for Biofuel and Biochemical Research, Universiti Teknologi PETRONAS, Seri Iskandar 32610, Perak Darul Ridzuan, Malaysia
6
Department of Chemical, Polymer and Composite Materials Engineering, University of Engineering and Technology (New Campus), Lahore 39021, Pakistan
*
Authors to whom correspondence should be addressed.
Agronomy 2023, 13(3), 725; https://doi.org/10.3390/agronomy13030725
Submission received: 6 February 2023 / Revised: 23 February 2023 / Accepted: 26 February 2023 / Published: 28 February 2023

Abstract

:
Controlled-release fertilizers are employed in precision agriculture to optimize technology-enabled farming without environmental deterioration. In this study, almond-shell lignocellulosic waste particles are chemically processed to synthesize a coating suspension for the production of controlled-release urea (CRU) in a Wurster fluidized-bed reactor. The interactive effect of process parameters such as atomizing air pressure (Pair), fluidized-bed temperature (Tfb), spray rate (Rspray), and fluidizing-air flow rate (Qair) on the (i) coating-film uniformity of CRU particles and (ii) longevity of nutrient-release from CRU is reported. CCRD is used with RSM to design the experiments for the optimization of nutrient-release performance and coating-film uniformity in terms of a coefficient-of-variance (CoV) of film thickness. The regression models indicate a good prediction of coating-film uniformity and nutrient-release time, with R2 = 0.971 and R2 = 0.98, respectively. The optimum conditions for coating-film uniformity are determined to be Pair = 3.5 bar, Tfb = 80 °C, Rspray = 0.15 mL/s, and Qair = 72 m3/h, with a predicted CoV film thickness of 11.5%. Similarly, Pair = 3.2 bar, Tfb = 78 °C, Rspray = 0.125 mL/s, and Qair = 75 m3/h are the optimum conditions for nutrient-release performance, with a prediction nutrient-release time = 56 h. The experimental validation yields a CoV of film thickness = 12.6% and a nutrient-release time = 49.5 h, indicating good agreement between predicted and experimental values. In addition, Tfb appears to be the most significant parameter.

1. Introduction

The development of sustainable processes in the modern agriculture sector while maintaining a balanced ecosystem is direly needed because of the exponential rise in the global population and rapidly increasing urbanization, industrialization, and land degradation that consequently reduce the cultivable agricultural land [1]. Precision agriculture is one such concept that is becoming increasingly popular worldwide with every passing year. It is a farming management system consisting of several intelligence-based smart processes aimed at increasing crop yield and process efficiency while minimizing economic losses and environmental impact [2]. The targeted spray of pesticides on selected blocks of the field after the precise assessment of spatial variations, drip irrigation, and the use of controlled-release fertilizers are a few of the salient features of precision agriculture [3].
Controlled-release fertilizers (CRFs) such as controlled-release urea (CRU) provide nutrients to the plants in a controlled manner and are manufactured via the coating of fertilizer granules by a polymer (organic/inorganic/biopolymer) that offers cost-effective and promising nutrient-release characteristics without a harmful effect on the environment [4]. Most of the previous studies have reported the use of synthetic polymer-based membranes that offer good results in regard to the longevity of nutrient release. However, many of these polymer membranes are non-biodegradable and have the tendency to stay intact in the soil for tens of years, or even more, while deteriorating soil conditions [5]. Alternatively, many studies have reported the use of environmentally benign biopolymers based on chemically-modified precursors such as starch [6], lignin [7], plant oil-based polyurethane [8], chitosan, cellulose derivatives, guar gum, carrageenan, xanthan gum, natural rubber [9], etc. Although these materials are biodegradable and environmentally friendly, many of them demonstrate poor nutrient-release characteristics mainly due to the augmented heterogeneities on the surface of the CRU granules [9]. The study of coating uniformity and its dependence on the process parameters, therefore, bears a great deal of significance.
Jiang et al. [9] employed the Monte Carlo simulation to study inter- and intra-particle coating uniformity with regard to the variance of the coating film thickness of microcrystalline cellulose particles using sodium benzoate as coating solution in a Wurster fluidized-bed reactor. Their study suggests that the drying capacity of fluidizing air must be high enough to overcome the negative effects of capillary forces on the coating quality. In addition, it was reported that coating uniformity could be enhanced by precisely controlling the size distribution of spray droplets [9]. Another study employed a CFD-DEM simulation and the Monte Carlo approach to investigate the coating uniformity of microspheres in terms of the variation in coating mass and coating film thickness. Their results indicated that a thicker coating film developed on the surface of relatively smaller particles due to their being closer to the spray zone of the spray nozzle. The study also suggested that the use of core beads with a narrower particle size distribution could reduce inter-particle coating heterogeneities. In addition, it was revealed that the spray rate had a more significant impact on the inter-particle coating uniformity as compared to the fluidizing-air flow rate; a relatively lower spray rate was reported to yield a uniform coating film. In this case, however, an extended processing time could potentially lead to spray loss due to the drying of droplets [9]. Furthermore, a modeling study employed the combination of CFD, DEM, and DDM to simulate the coating of Cellets® in a Wurster Fluidized-bed machine. The spray dynamics were found to have a significant impact on coating quality. It was reported that widening the spray angle for constant droplet size did not only result in a mass distribution of uniform coating but also augmented the coating film thickness [10].
After the extraction of the kernel, broken almond shells are either thrown away uselessly or incinerated. A few studies, however, have reported the practical application of almond shell biomass for renewable energy, activated carbon, adsorption of dyes and heavy metals, organic biopesticides, and growing media [11]. However, the potential of biopolymers based on almond shells’ lignocellulosic particles has not yet been systematically explored for their applications as coating materials for the production of CRFs and, in particular, CRU. A thorough literature review revealed that no studies have so far been published reporting on the application of a chemically-modified almond shell lignocellulosic coating suspension for (i) the production of CRU in a Wurster fluidized-bed (WFB) reactor and (ii) the interactive effect of fluidized-bed parameters on the coating uniformity and nutrient-release efficacy of controlled-release urea in a WFB. In this study, almond shell lignocellulosic microparticles are chemically modified to synthesize a spray suspension that is used for the production of CRU in a WFB. Response surface methodology and the analysis of variance are used for the design of experiments, statistical analysis, empirical modeling, optimization of process parameters, and the investigation of the interactive effect of process parameters on the coating uniformity and nutrient-release characteristics of the CRU product. The novel part of this study is that it investigates the optimum process parameters for the coating uniformity of almond-shell lignocellulosic composite film on the surface of urea granules in a Wurster fluidized-bed coater. Thus, the valorization of almond shell biomass for the production and characterization of a smart fertilizer contributes towards the development of a sustainable and eco-friendly agriculture sector.

2. Materials and Methods
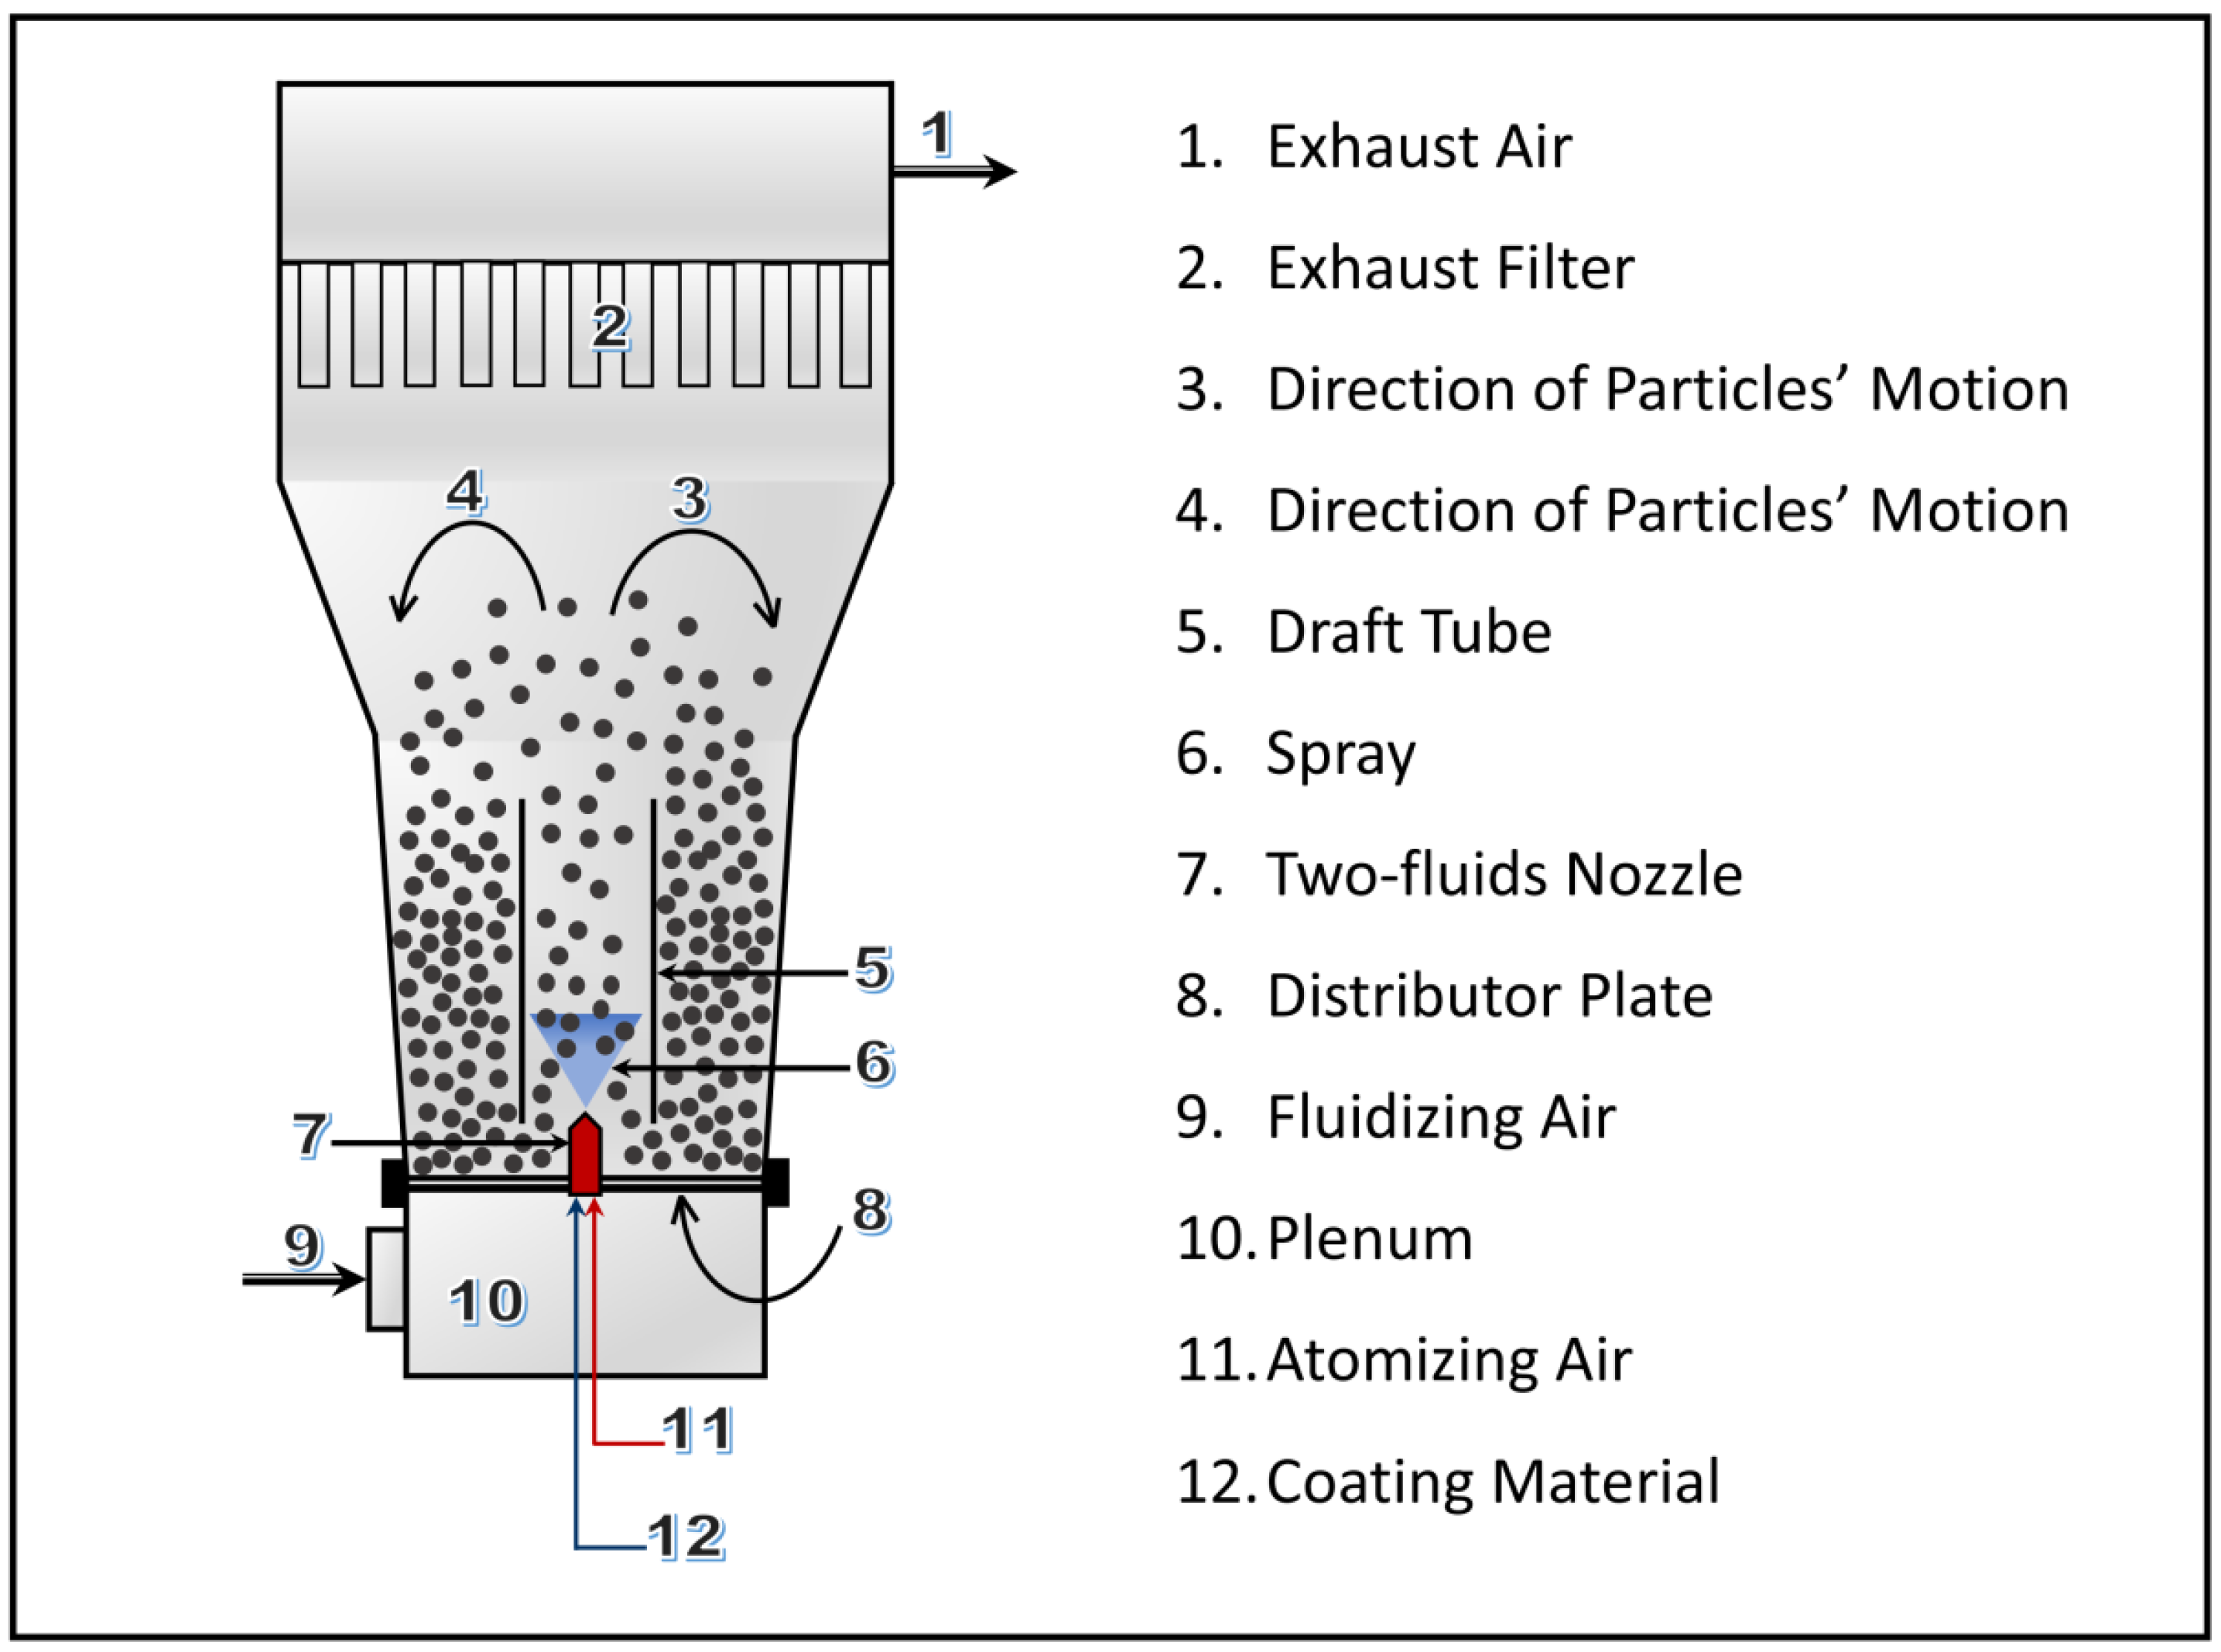
2.1. Materials

The almonds were purchased from the local market. The almond shells were separated after the extraction of the nuts. The shells were subjected to air drying, pulverization, and sieve analysis as per the methods described in our previous work [11]. The almond-shell lignocellulosic microparticles (mean particle size = 3.5 ± 0.01 µm) thus obtained were used as a precursor for the synthesis of the spray suspension. Analytical grade urea granules (mean size = 2.5 ± 0.01 mm) were procured from BASF Chemicals®, Dubai, UAE. Other analytical grade chemicals such as chloroform, absolute ethanol, acetic acid, ethanol (95%), and dichloromethane were procured from Merck®, Berlin, Germany.

2.2. Methods

2.2.1. Synthesis and Characterization of Spray Suspension

The spray suspension for the urea coating was synthesized as per our previous work [11]. Chloroform and absolute ethanol were agitated for 24 h with lignocellulosic particles for dewaxing, followed by washing with distilled water, drying, and acetylation by the acetic acid to reduce the hydrophilic character of the particles. The acetylation was carried out at 80 °C for 18 h with four agitation sessions (1 h each). This was followed by the precipitation of particles, washing with deionized water, and oven-drying at 35–40 °C. The final spray suspension was prepared by mixing the pre-processed dried particles with the solvent, that is, ethanol or dichloromethane. The thermal (TGA-DTG), structural (FTIR), rheological (temperature vs. viscosity), and morphological (FESEM) properties of the spray suspension have already been reported in our previous study [11]. To summarize, the thermal decomposition profile ranges between 250–350 °C and the acetylation improves the hydrophobic character of the spray suspension. The FTIR spectrum vindicates the acetylation of lignocellulosic particles, the rheological analysis reveals that the flowability of spray droplets increases with an increase in temperature, and the morphological analysis provides micrographs that indicate the development of coating films on the surface of pristine granules.

2.2.2. Urea Coating Experiments

The coating of substrate granules was accomplished in a Wurster fluidized-bed reactor (WFB). Figure 1 illustrates the schematic diagram of the WFB used in this study. The specifications of the equipment are presented in Table 1. The pristine urea granules were air dried before introduction into the WFB to remove any traces of moisture; gravimetric analysis was employed to ensure the complete removal of moisture.
Before the actual experiments, trial runs were performed to define the minimum and maximum magnitudes of the process parameters under investigation, in addition to the minimum fluidization velocity. Then, 100 g of the air-dried substrate granules were introduced into the WFB and the hot fluidizing air that passed through the distributor orifices, thereby fluidizing the urea granules, was switched on. Upon reaching thermal equilibrium, the atomizing air was switched on and the hot coating suspension was sprayed onto the fluidized granules by using a peristaltic pump. The spray suspension was continuously homogenized and kept at a constant temperature by using an electromagnetic hot plate and a Teflon agitator. The fluidized-bed temperature and thermal equilibrium were monitored by installing a thermocouple at the top of the fluidized bed.
Since the spray rate for different coating runs varies, the spray time varies likewise. However, every coating run was followed by a 10 min drying session in which the spray supply was cut off and only fluidizing air was introduced to complete the coating run. A total of 150 mL of coating suspension was sprayed in every experimental run. All the process parameters were adjusted from the control panel. The process parameters under investigation included the fluidizing-air flow rate, spray rate, fluidized-bed temperature, and atomizing-air pressure.

2.2.3. Evaluation of Urea Coating Uniformity

Coating uniformity in this study was reported in terms of the coefficient of variance (CoV) of film thickness on the surface of granules. For this purpose, 30 granules were randomly chosen from each sample, then cut into two pieces by an ultra-sharp knife and subjected to microscopic analysis by a field emission scanning electron microscope (FESEM) to measure the mean coating film thickness and subsequent CoV of the granule. The coating film thickness at 20 different locations on each cross-section of a granule was measured. Since 30 granules were chosen from one sample, 600 data points were obtained to report the mean CoV of film thickness for that particular sample. This method of the determination of CoV of film thickness was adopted from a previous study reported elsewhere [12].

2.2.4. Efficacy of Nutrient Release

The efficacy of coated urea was determined in terms of the longevity of nitrogen release in distilled water. For this purpose, the nitrogen release time was determined using a method reported in one of our previous studies [13]. For the determination of time for a 100% release of nutrients from the manufactured controlled-release urea, 2.0 ± 0.01 g of coated granules from each sample were immersed in distilled water. After specific time intervals, the aliquots were gently stirred for homogenization and 3.0 mL solution was taken out for an absorbance measurement using a UV-Vis Spectrophotomet (Shimadzu UV-2600i). An equal quantity of distilled water was added to the aliquots to make up the overall volume. Triplicates were performed for each absorbance measurement. Upon the receipt of constant absorbance for five consecutive measurements, the time was noted and reported as the time for the 100% release of urea from the coated granules.

2.2.5. Statistical Analysis and Optimization

For the systematic analysis of the integrated effect of the fluidized-bed parameters on the response objectives, it is imperative to employ the most relevant statistical technique. In this study, the design of experiments and analysis of variance (ANOVA) was performed using a central composite rotatable design (CCRD). To evaluate the impact of various process parameters, response surface methodology (RSM) was used. In addition, empirical modeling and process-parametric optimization were carried out. All of the aforementioned statistical analysis was performed using the trial version of Design Expert® 13, downloaded from statease.com. Trial runs were performed before the actual experiments to define the upper and lower limits of the process parameters. Data normalization was performed to avoid the issue of dimensional consistency in the developed empirical models. After the evaluation of the optimum process parameters, the confirmatory runs were performed to determine the magnitude of the response objective for the optimum values of process parameters. Triplicates were performed and the % standard error was also reported. Table 2 lists the min. and max. values of the process parameters determined during the trial experiments.
After incorporating the above minimum and maximum values into Design Expert® 13, while choosing the central composite rotatable design (CCRD), the randomized experimental matrix (design of experiments) was determined and is presented in Table 3.

3. Results and Discussion

3.1. Interactive Effect of Process Parameters on Coating Uniformity

Figure 2 illustrates micrographs received from the morphological analysis of coated granules from various samples (only a few are shown here as a reference). The coating quality in terms of CoV of film thickness and its dependence on the interaction of process parameters are discussed in the following subsections of 3.1. The ANOVA results for the interactive effect of process parameters on coating-film uniformity in terms of CoV of film thickness are presented in Table 4. Since the p-values of the (i) statistical model, (ii) process parameters (A, B, C, and D), and (iii) interactive parameters (AB, AC, AD, BC, and BD) were less than 0.05, they meet the requirement of a 95% confidence level and they are statistically significant. The interaction of atomizing air pressure and spray rate (CD), however, was not significant because of the higher p-value (0.106). With the lowest p-value (0.0002), fluidized-bed temperature appears to be the most influential and statistically significant process parameter in this particular case, followed by the spray rate (p-value = 0.0007).
Based on the R2 value, the regression model was used to validate the experimental results. The empirical correlation that relates coating uniformity (CoV of the film thickness) with the process parameters and their interactions after data normalization is given in Equation (1). Only statistically significant terms were included in this equation and the rest, including squared terms, were ignored.
CoV of film thickness   ( Normalized ) = 0.12 0.07 A 0.005 B + 0.31 C + 0.17 D 0.02 AB + 0.06 AC 0.003 AD + 0.007 BC + 0.11 BD
where A, B, C, and D refer to the fluidized-bed temperature, fluidizing air flow rate, atomizing air pressure, and spray rate, respectively. The F-test was used to check the statistical significance of the regression model (Equation (1)). The significance of the F value implies that the regression model was predictive and, therefore, response surfaces can be generated.

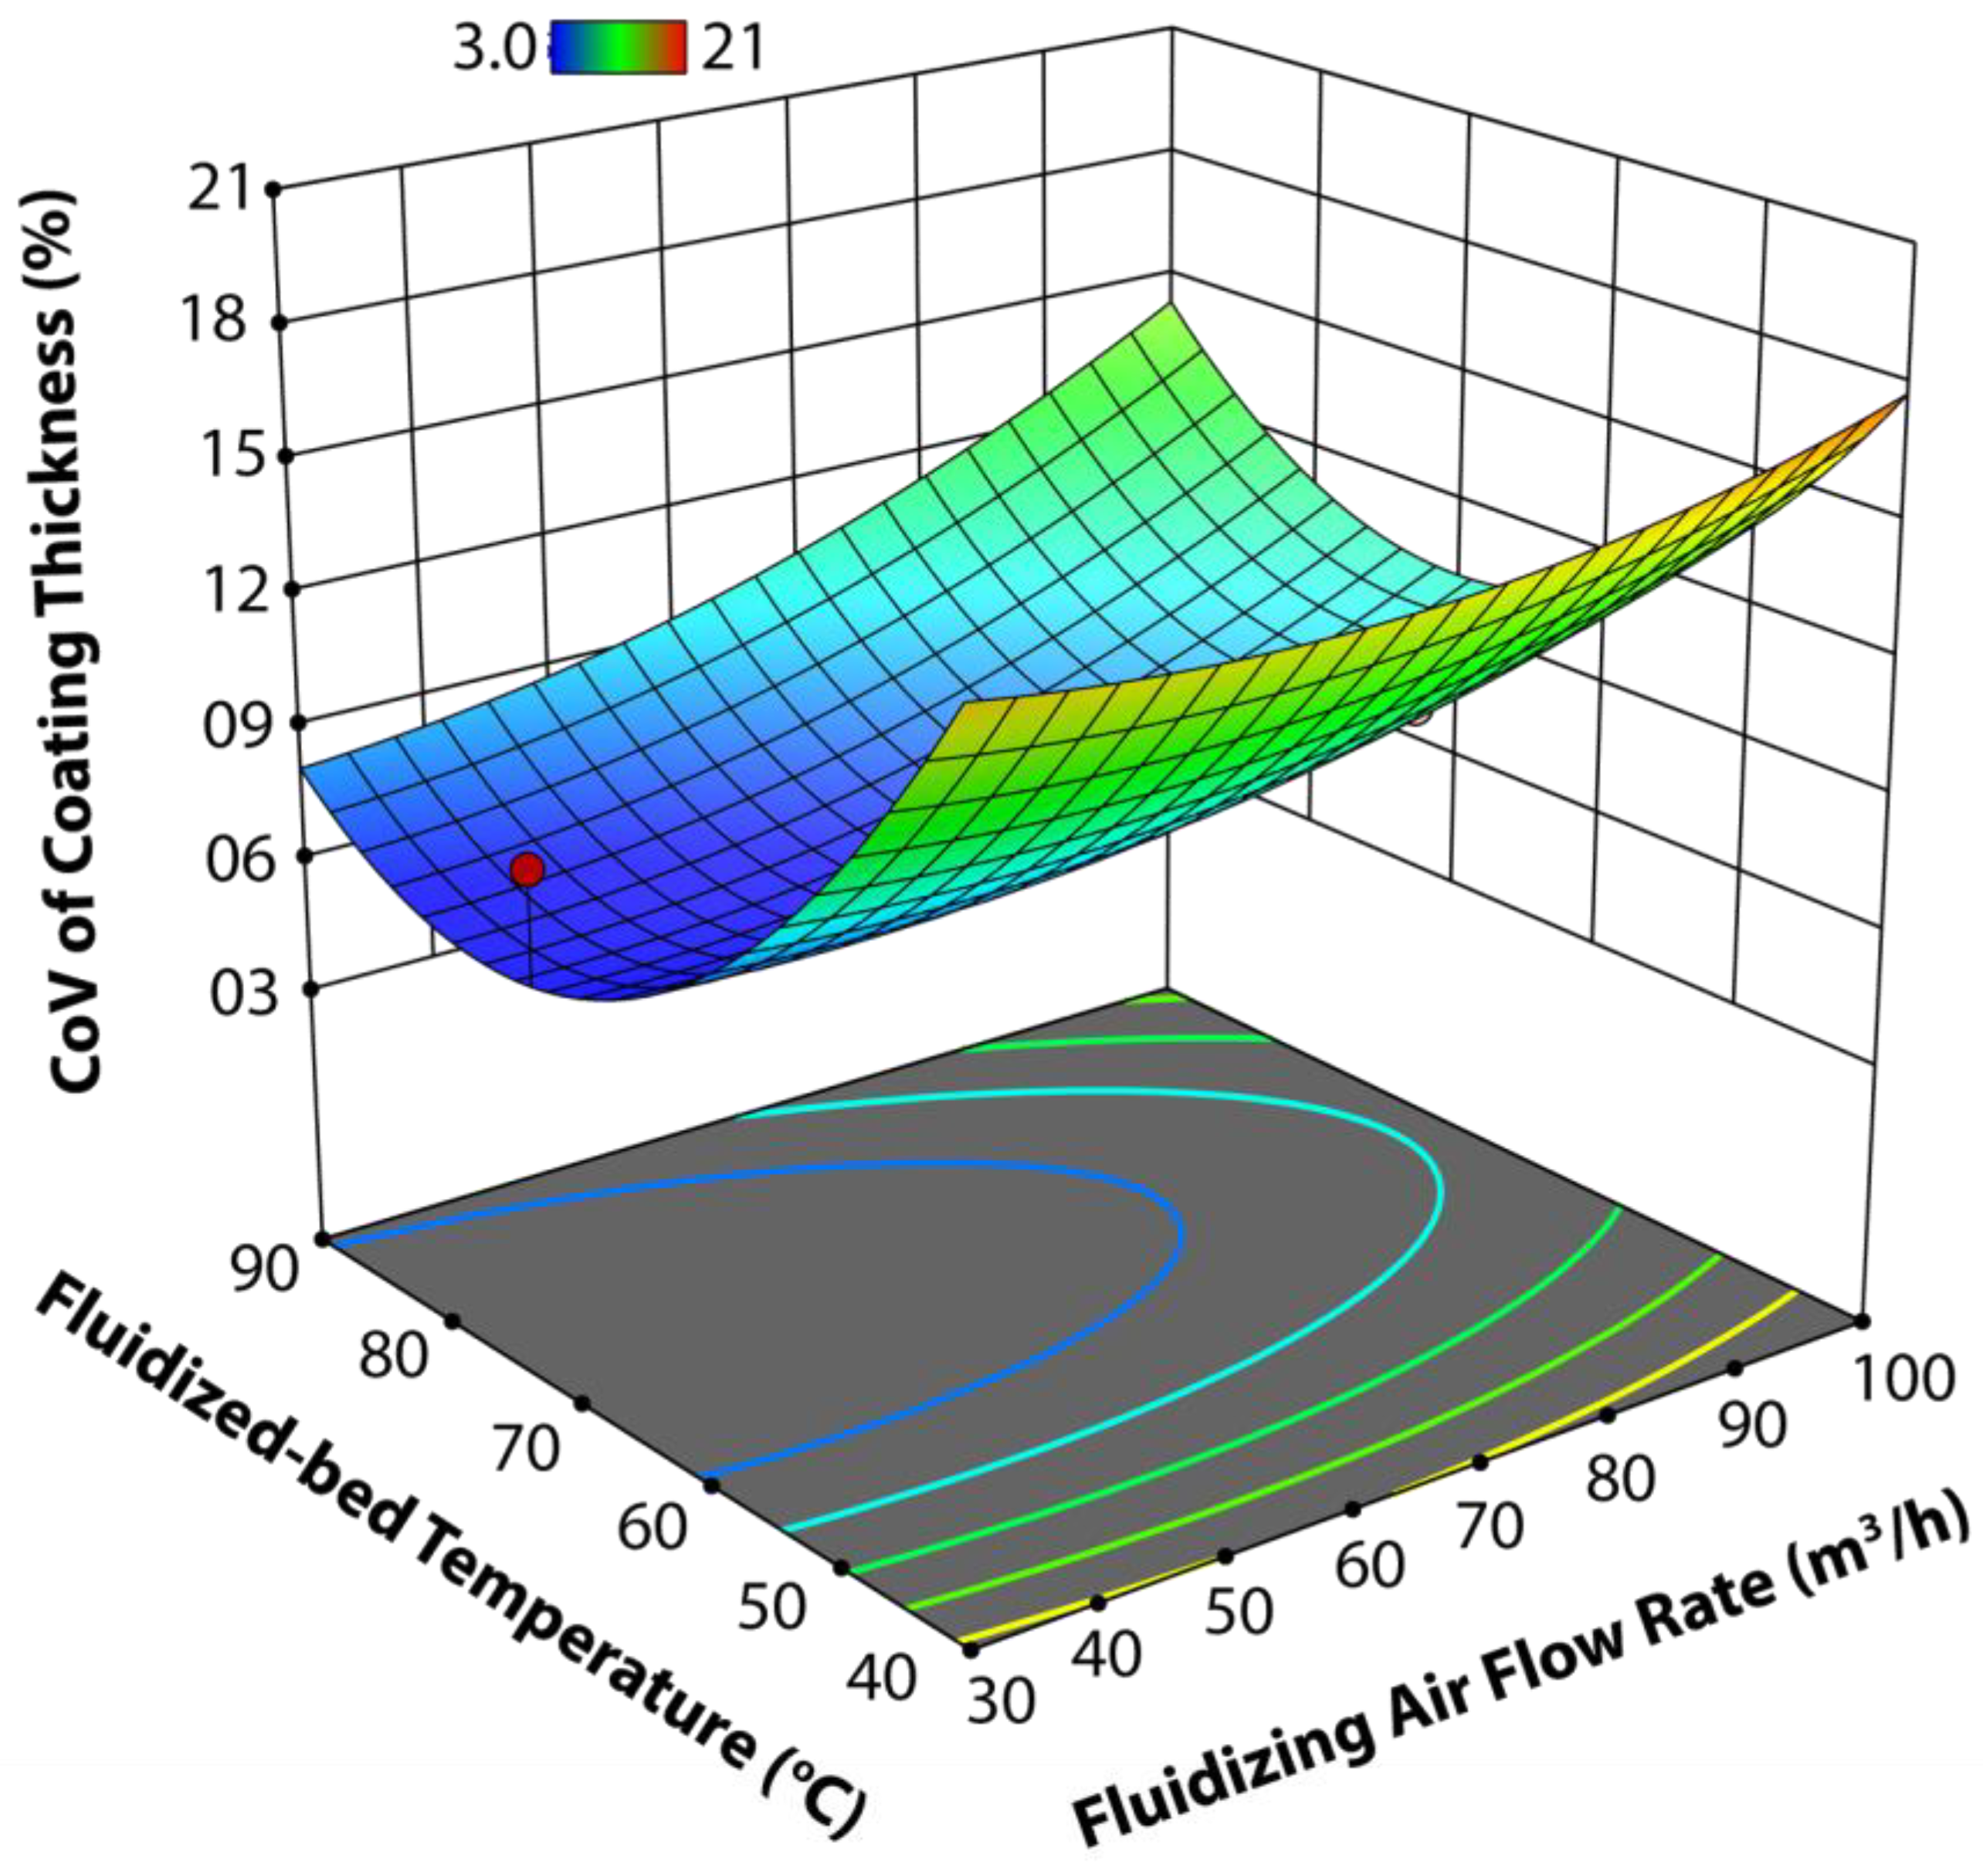
3.1.1. Interactive Effect of Tfb and Qair on CoV of Film Thickness

Figure 3 illustrates the interactive effect of Tfb and Qair on the coating uniformity of the deposited film in terms of the CoV of the coating thickness. It was observed that the CoV of the coating thickness had a high value at a lower Tfb and Qair. For a good coating quality, the bed mobility and circulation rate should be high enough for all the granules to come across the spray zone and experience an optimum coating-per-pass distribution (CPPD) [14]. At a lower Tfb, the solvent from spray droplets undergoes sluggish evaporation and, therefore, experiences poor spreading, thereby causing a polarized accumulation of coating suspension on the surface of granules. The local accumulation of spray droplets and the delayed evaporation of the solvent develop liquid bridges between the granules, creating temporary (and sometimes permanent) aggregates. The development of temporary (or permanent) aggregates affects the coating quality in so many ways. For instance, it affects the bed mobility and circulation rate, disturbs the pattern of CPPD, and gives rise to the preferential coating that ultimately results in intra- and inter-particle coating inconsistencies (See Figure 3). The flow rate of fluidizing air (Qair) was characterized as the process parameter responsible not only for keeping the granules fluidized but also for controlling the circulation of granules in the draft tube and annuli between the draft tubes and the coater walls [15].
Taking into consideration the integrated effect of Tfb and Qair, it is evident from Figure 3 that a higher CoV is observed at the lower magnitudes of these two interacting process parameters. A lower Qair reduces the circulation of granules which is further reduced by a lower Tfb due to the sluggish evaporation of the solvent and poor spreading of spray droplets, thereby causing the emergence of temporary aggregates, preferential coating, haphazard CPPD, and, consequently, a higher CoV of coating thickness. A higher CoV was also observed for the combination of a lower Tfb and higher Qair. The circulation and suspension of granules in the fluidized bed, as aforementioned, was governed by Qair. However, a higher Qair creates turbulence, and an abnormal trajectory of the granules’ flow was observed that also disturbed the CPPD [16]. In addition, it is believed that augmented Qair also interrupts the hydrodynamics of the fluidized-bed [17] such that the impingement of spray droplets distracts, and a portion of them are deposited on the walls. In other words, the shape of the spray cone deteriorates. All these factors contribute towards the development of coating heterogeneities and therefore an escalated CoV of coating thickness. A promising coating quality was achieved (lower CoV) with a combination of the optimum values of Tfb and Qair (Figure 3). A deep dip in the curvature of the response surface in Figure 3 indicates that a CoV as low as ~3.0% was achieved for moderately high values of both of these parameters, that is, Tfb = 75 °C and Qair = 65 m3/h. In addition, the ANOVA revealed that Tfb was statistically a more significant and influential parameter in comparison to Qair because it had a p-value (0.0002) lower than the p-value (0.001) of Qair (Table 4).

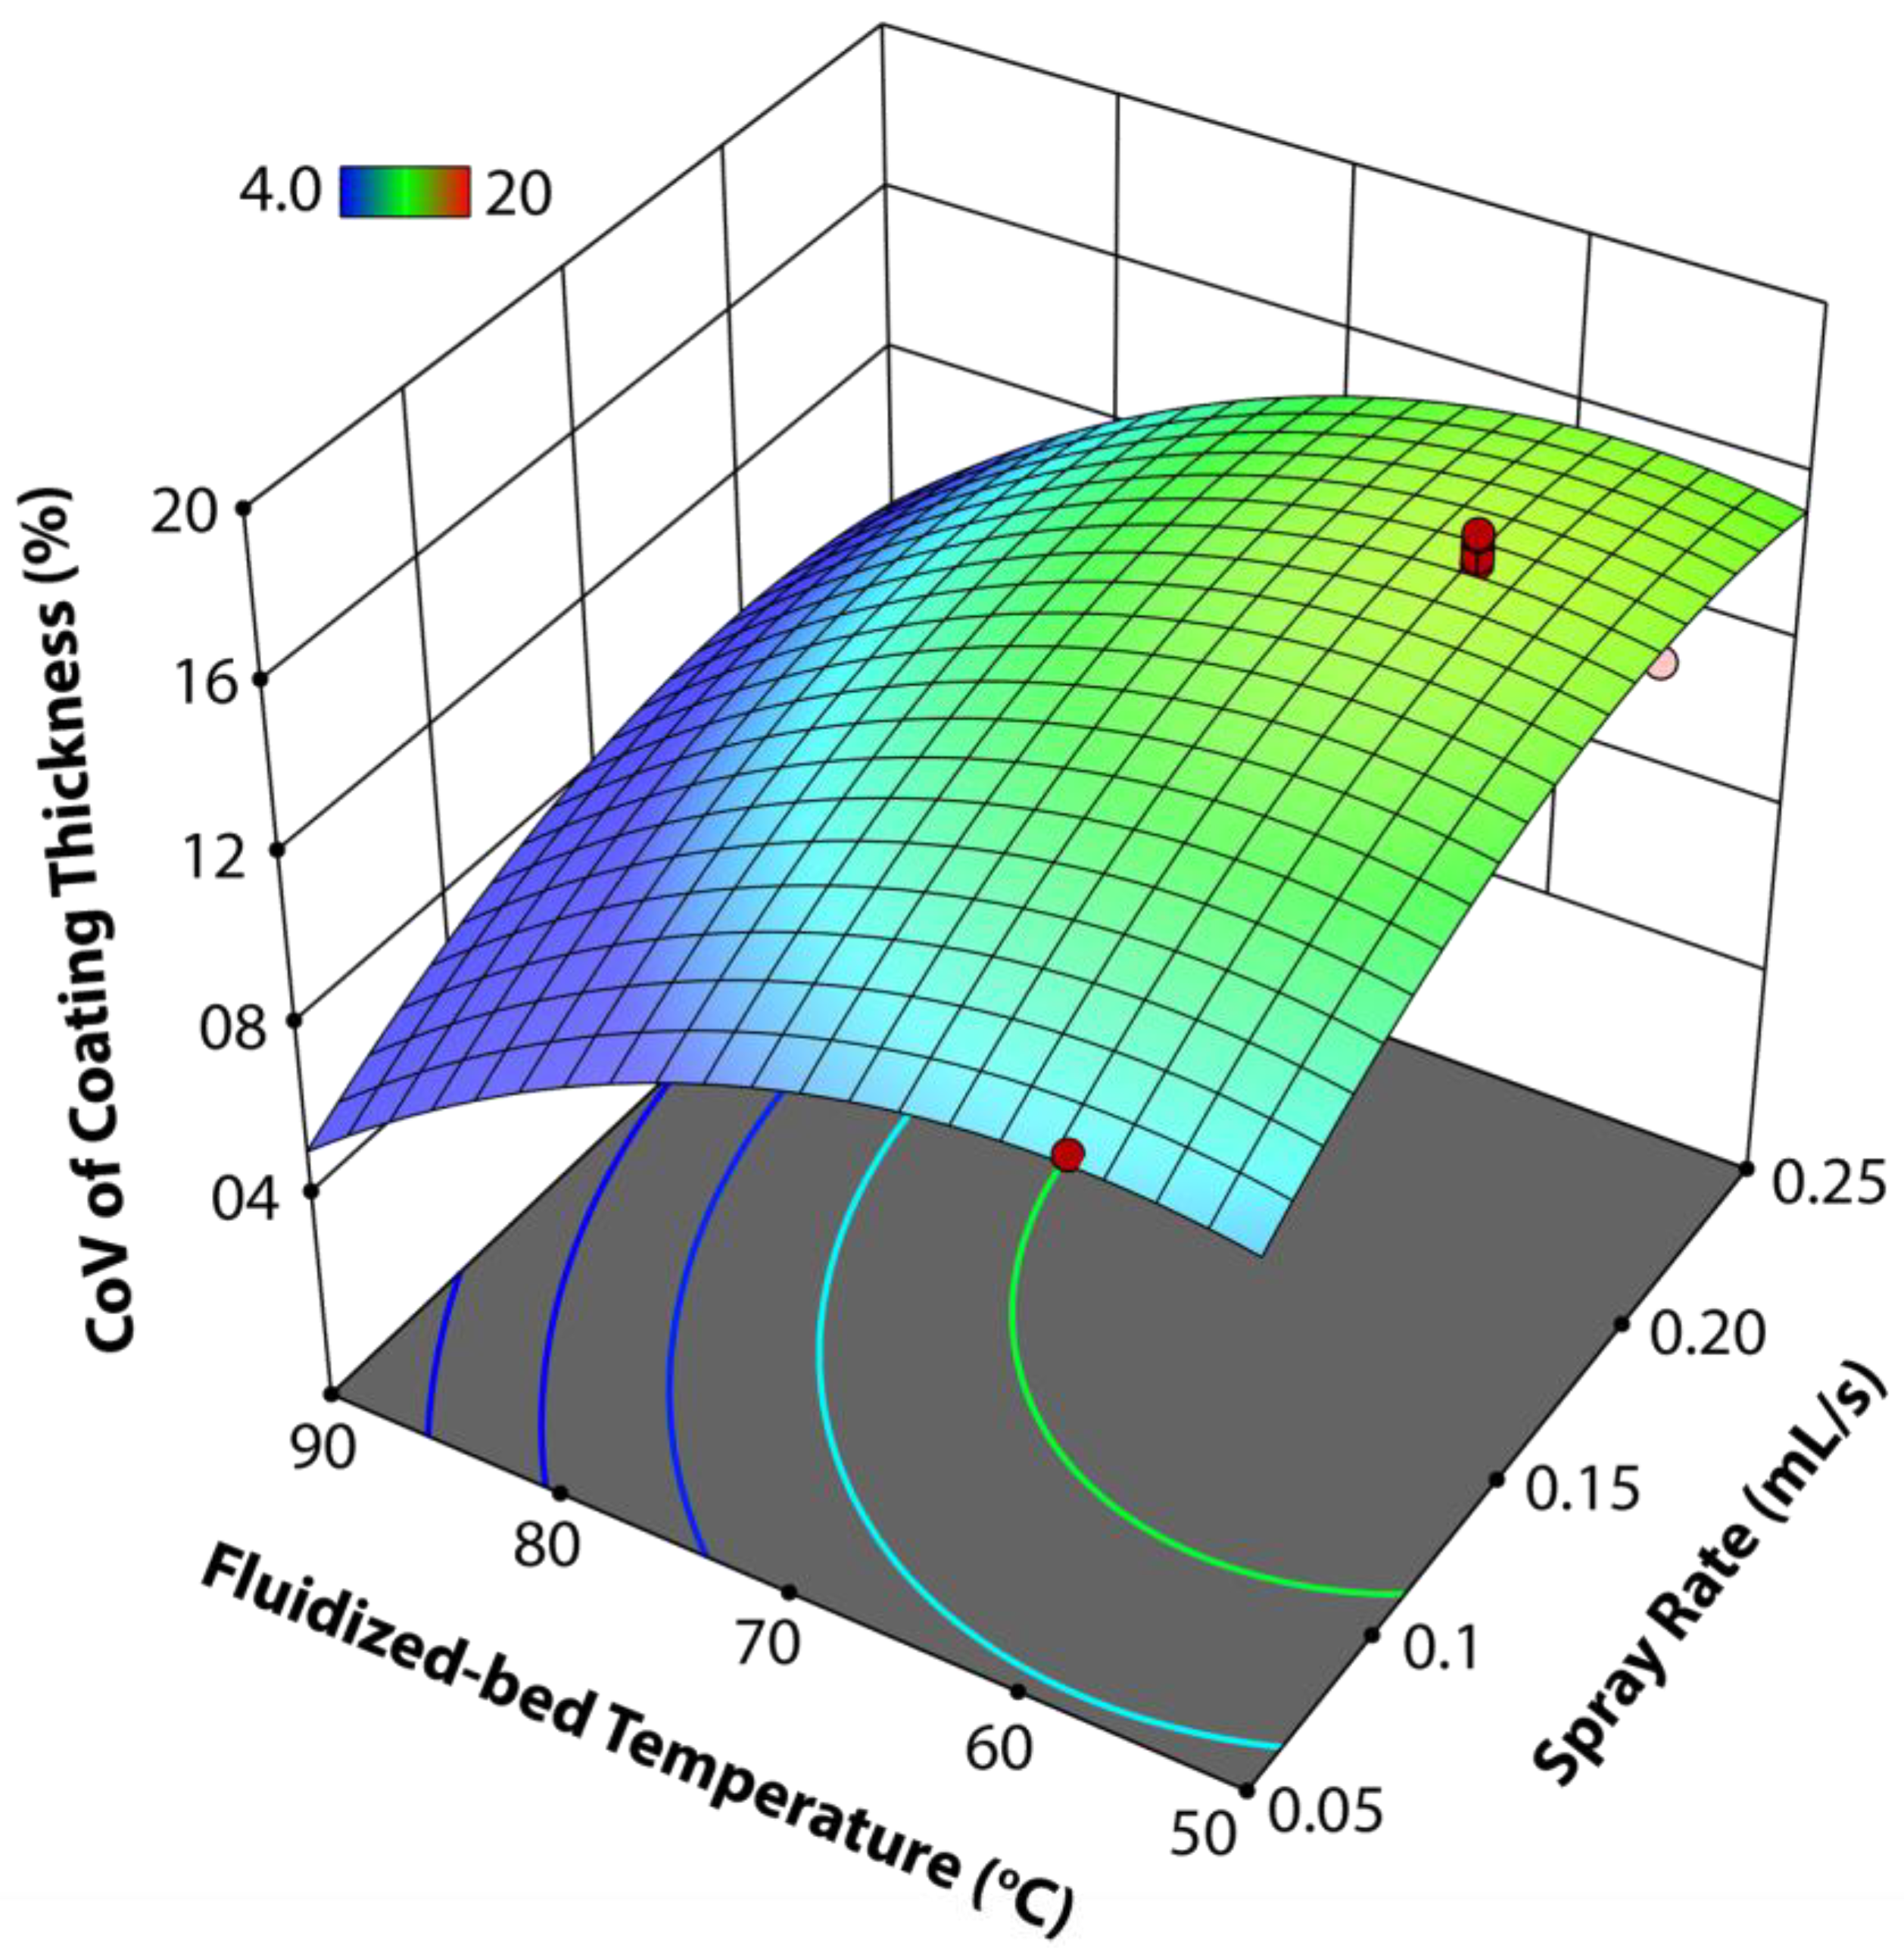
3.1.2. Interactive Effect of Tfb and Rspray on CoV of Film Thickness

Figure 4 demonstrates the interactive effect of Rspray and Tfb on the CoV of the coating thickness. In this interaction of process parameters, Tfb is more influential than the spray rate (Rspray) because the p-value of Tfb is lower than the p-value for Rspray. This is also evident from the curvature of Tfb lines in the response surface (Figure 4). A good coating uniformity (lower CoV) was achieved for the complete range of Rspray at higher Tfb. This is most likely because of the timely evaporation of solvent from the spray droplets soon after their impingement and film formation on the surface of granules. Thus, the circulation and flow trajectory of granules develop in a streamlined manner that enhances the frequency of particles coming across the spray zone and experiencing a narrower CPPD. As a result, minimal coating heterogeneities on the surface of granules led to the development of a uniform coating film. As we reported in our previous work, the viscosity of this lignocellulosic coating suspension decreases with an increase in temperature [11]. A decrease in viscosity increases the Reynolds number of the flowing film of spray droplets due to an increase in velocity (duρ/µ) and, therefore, a good spreading of droplets takes place on the surface of granules [18]. When these granules come across a high-temperature environment, an intact and robust thin film develops on the surface of the granules. This cycle continues until the end of the coating session, concluding with the development of a uniform film coating.
Figure 4 also shows that an elevated CoV of film thickness was achieved for the combination of a significantly high spray rate (≥0.2 mL/s) and a lower temperature (60 °C). A high spray rate means a high input of solvent into the system that requires a sufficient amount of energy to evaporate the solvent from the spray droplets. The interaction of a lower temperature and high spray rate, however, does the opposite. The sluggish evaporation of the solvent resulted in the poor spreading of spray droplets, polarized local accumulation of liquid on the granules’ surface, aggregate formation, poor bed mobility and circulation, and the abnormal flow trajectory of the granules. As a result, coating heterogeneities appeared on the surface of granules which gave rise to a higher CoV of film thickness. These results are in agreement with the literature results [19], except for a partial disagreement with a study that suggested that the CoV of film thickness decreases with an increase in temperature and spray only up to a critical value, beyond which a further increase in spray rate increases the CoV of film thickness [12].

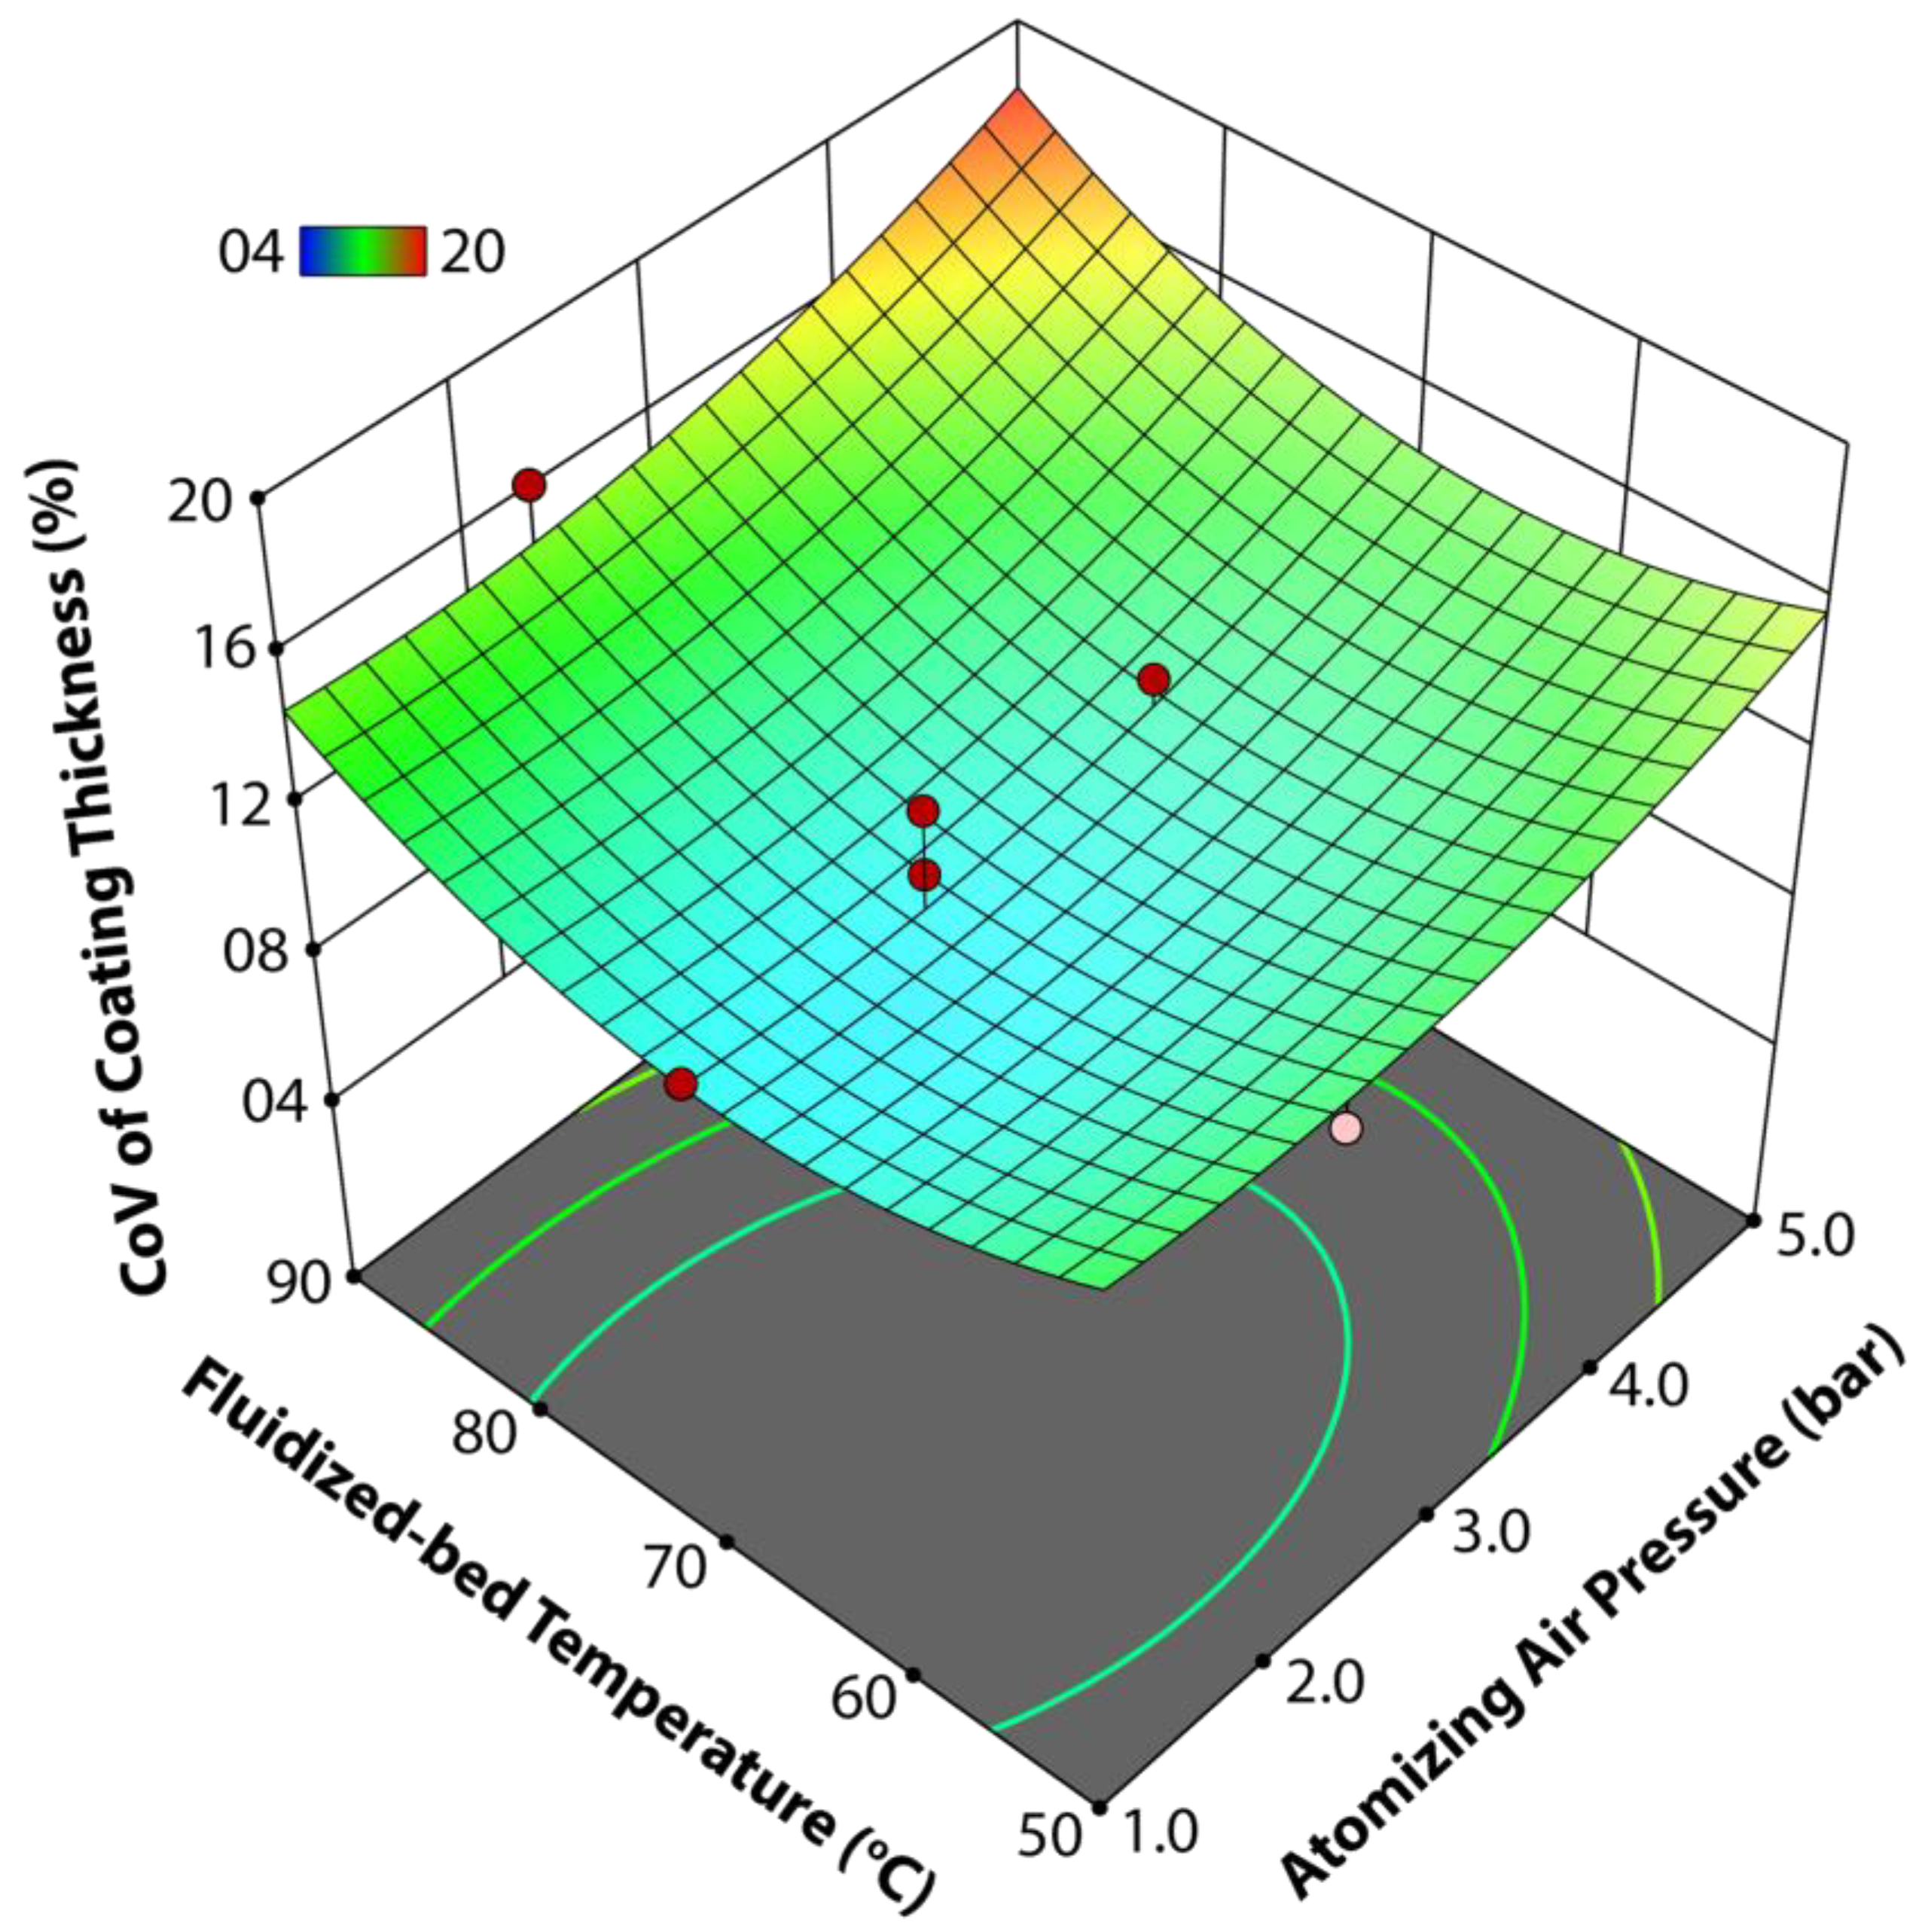
3.1.3. Interactive Effect of Tfb and Pair on CoV of Film Thickness

Figure 5 illustrates the interactive effect of Pair and Tfb on the coefficient of variance of the coating film thickness. It was observed that the CoV of the film thickness decreases (better coating uniformity) with an increase in both the process parameters, Tfb and Pair, up to a certain critical limit. The Pair governs the size of the spray droplets such that finer microdroplets are generated at a high Pair and relatively bigger droplets at a low Pair [20]. At a critically high Pair and Tfb, the droplet spreading, film formation on the surface of granules, and subsequent solvent evaporation were accomplished quickly in a streamlined manner. It also facilitated good circulation and mobility of the fluidized bed. Thus, the frequency of granules coming across the spray zone also increased and consequently, a relatively thick and uniform coating film developed on the surface of the substrate granules. However, there was no linear relationship between the increase in Pair and Tfb and a decrease in the CoV of the film thickness. After a certain critical value of both of these process parameters (Pair and Tfb), the coating film was observed to deteriorate, as evidenced by a rise in the CoV of the film thickness. Figure 5 illustrates that the highest CoV of the film thickness (18.2%) in this particular case was achieved at the maximum values of Tfb and Pair. At a high Pair (5.0 bar), an extremely small microdroplet spray was generated that experienced pre-mature drying at a high temperature (90 °C), and a fraction of these pre-maturely dried particles elutriated in the vent through the fluidizing air. A fraction of these dried particles intermingled with the fresh spray droplets, impinging the surface of the substrate granules. The mixing of the dried particles with fresh spray droplets hindered the spreading on the surface of the granules, thereby giving rise to (i) the local accumulation of droplets, (ii) preferential coating, and (iii) coating film heterogeneities. In addition, since the already-dried particles were not properly homogenized in the coating film of fresh droplets, a frail and loosely bound film on the surface of granules was developed that yielded a higher CoV of the film thickness (poor coating uniformity) [9]. Figure 5 also illustrates that a significantly high CoV of the film thickness was witnessed at a high Pair (5.0 bar) and lower Tfb (50 °C). This is most likely because of the poor evaporation of the solvent and the subsequent sluggish spreading of spray droplets yields a fluffy and coarse coating film on the surface of granules (higher CoV of the film thickness). From the analysis of variance, it is evident that Tfb was statistically more influential and significant (p-value = 0.0002) than Pair (p-value = 0.009).

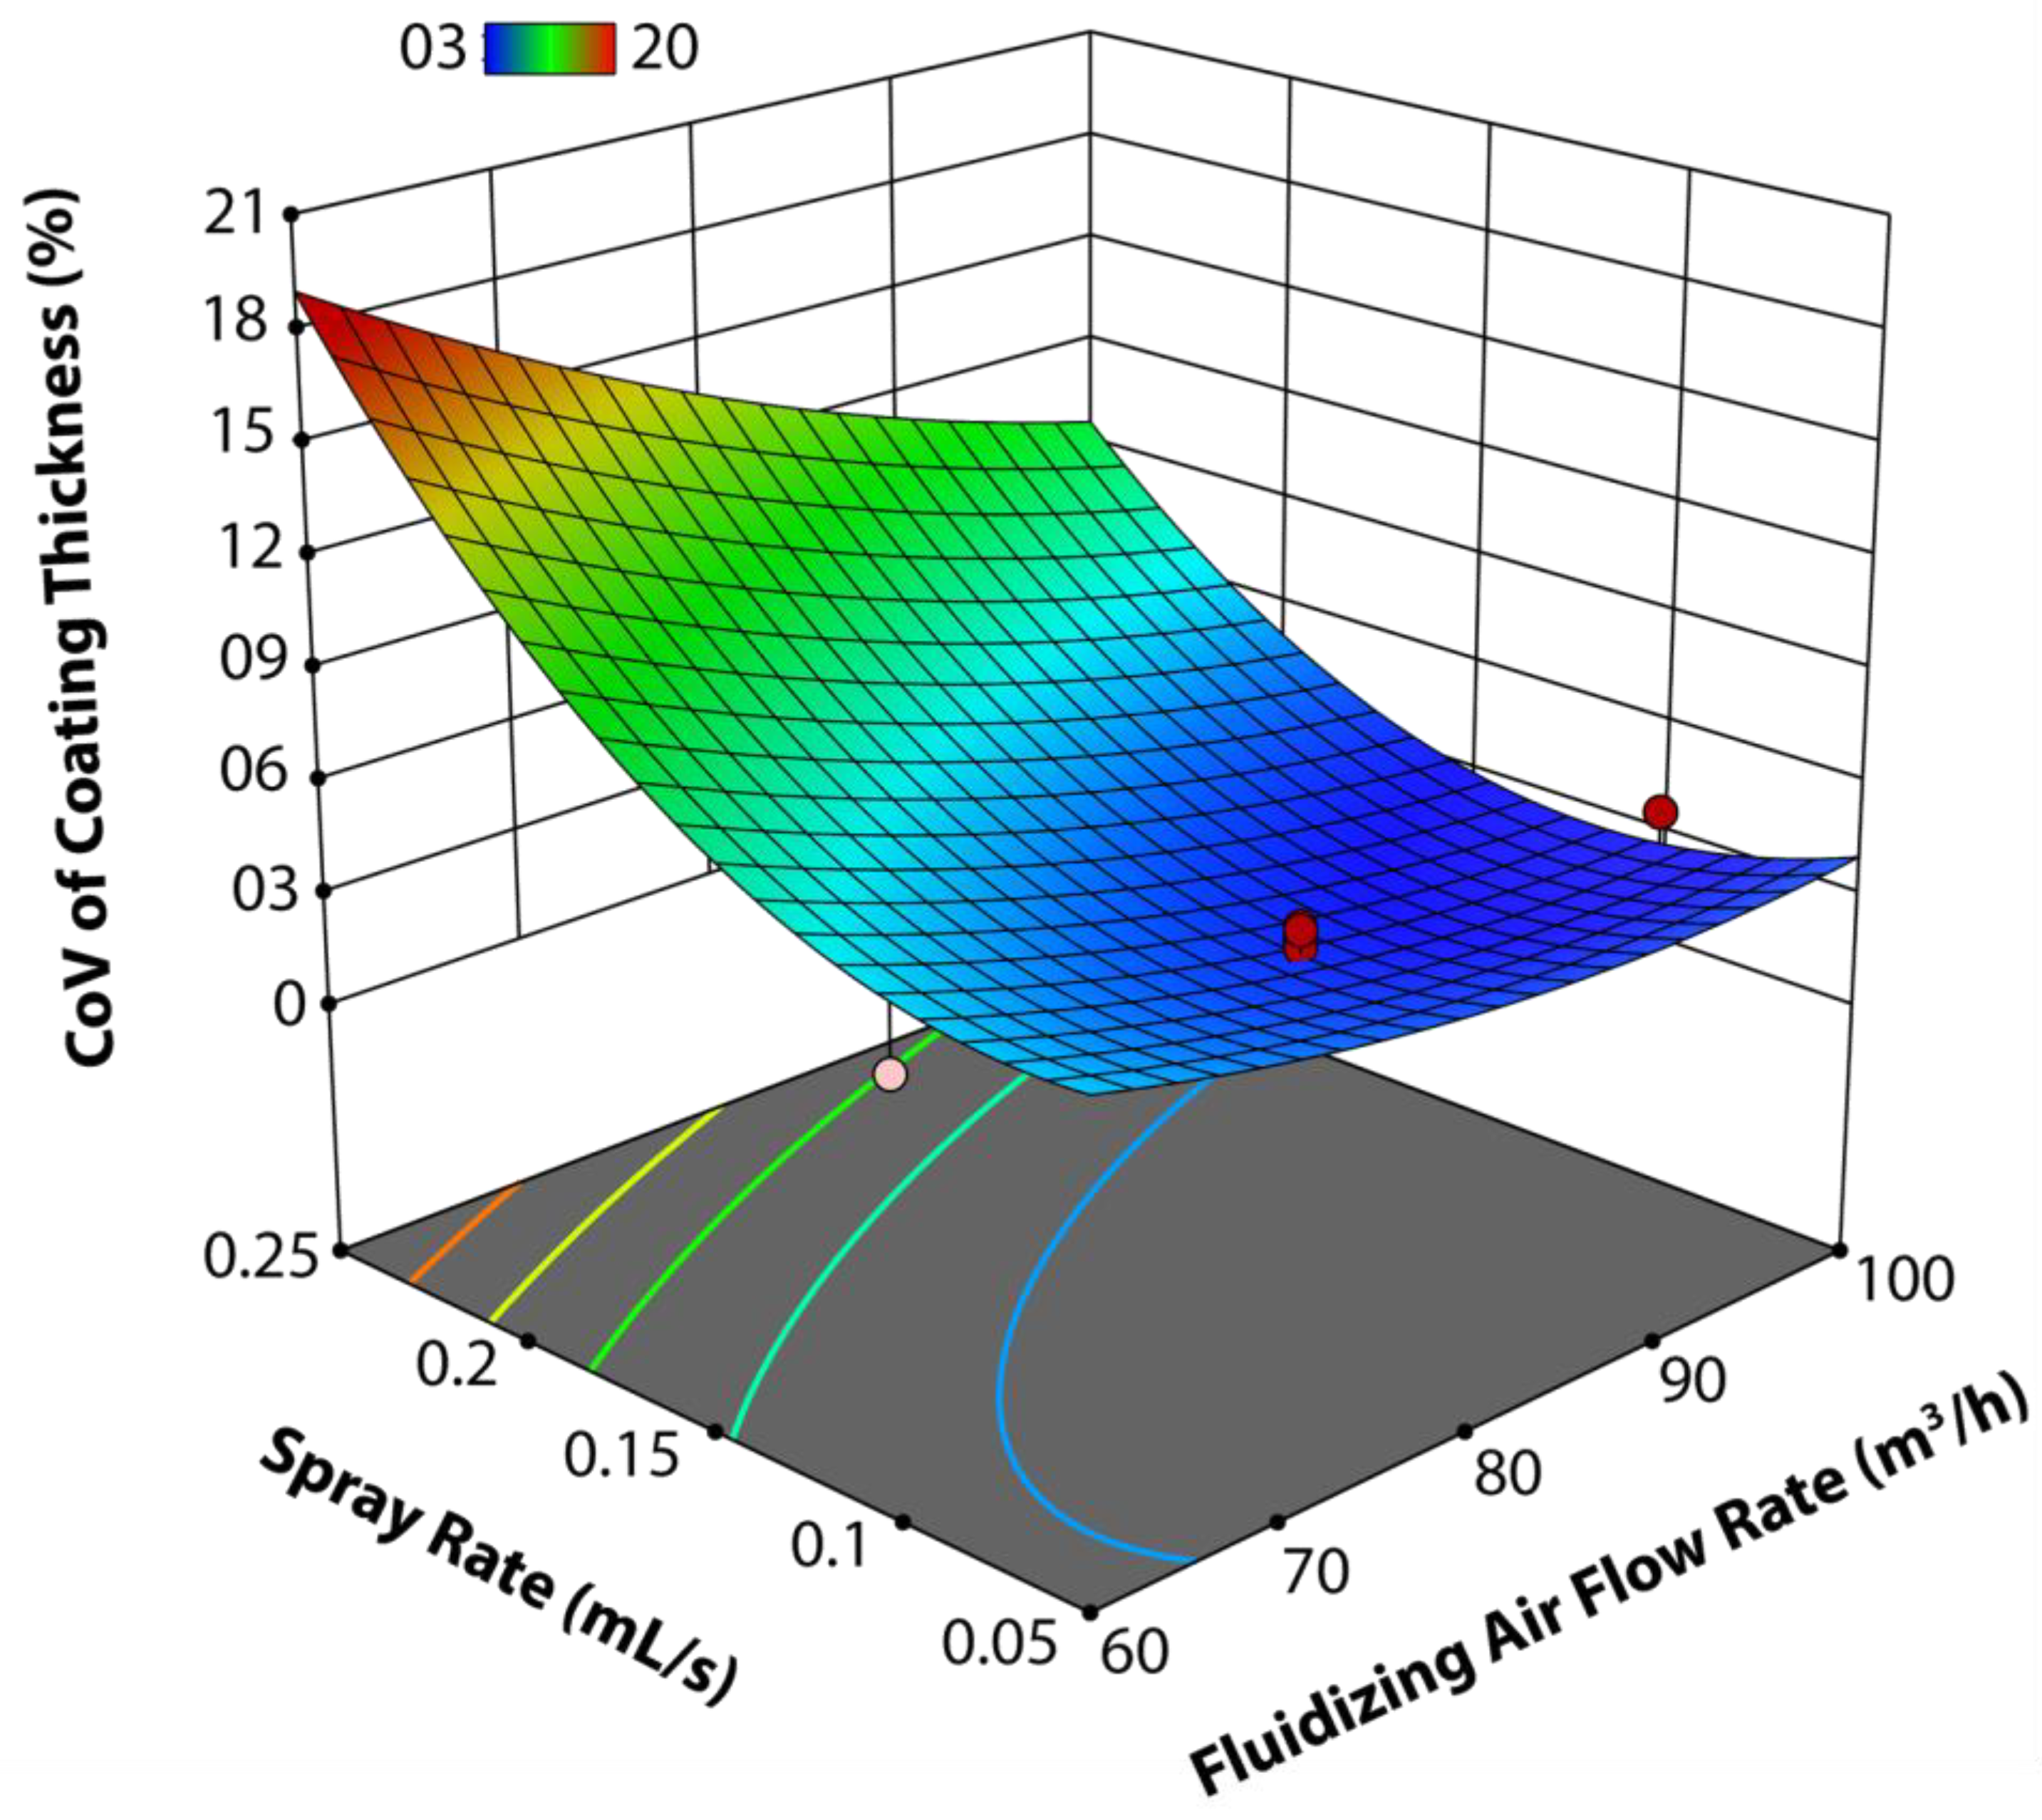
3.1.4. Interactive Effect of Rspray and Qair on CoV of Film Thickness

Figure 6 represents the integrated effect of Rspray and Qair on the CoV of the coating film thickness of the coated product. Qair plays an important role in the circulation of granules and the overall mobility of the fluidized bed. Rspray on the other hand is responsible for the liquid input in the system that can affect the circulation and mobility of granules if the solvent is not evaporated timely and properly. It can be observed in Figure 6 that the coating quality significantly deteriorated, that is, a higher CoV of the coating film thickness results with a higher Rspray (0.25 mL/s) and lower Qair (60 m3/h). With a constant atomizing air pressure, it was reported that a higher Rspray yielded relatively bigger spray droplets [21]. With a higher Rspray and bigger droplets, the local accumulation and sluggish evaporation of spray droplets resulted in the development of liquid bridges between granules, consequently forming temporary aggregates. Since the fluidizing air flow rate was low at this point (60 m3/h), the circulation rate of granules was much lower and, therefore, the frequency of particles visiting the spray zone was also lower, affecting the CPPD such that some of the granules did not receive a sufficient coating to even form a proper coating film due to the sheltering effect caused by the aggregates. When the temporary aggregates were broken at a certain point of time during the coating run, a spiky and rough coating film was the outcome. All these factors contributed to the rise in the CoV of the coating film thickness. A good coating uniformity was observed for a high Qair and a relatively lower Rspray. This was because of good circulation, a narrow CPPD, and a uniform trajectory of the granules’ flow. For the interaction of Qair and Rspray, the statistical analysis revealed that Rspray was more significant than Qair due to its lower p-value (0.0007) as compared to Qair (p-value = 0.001).

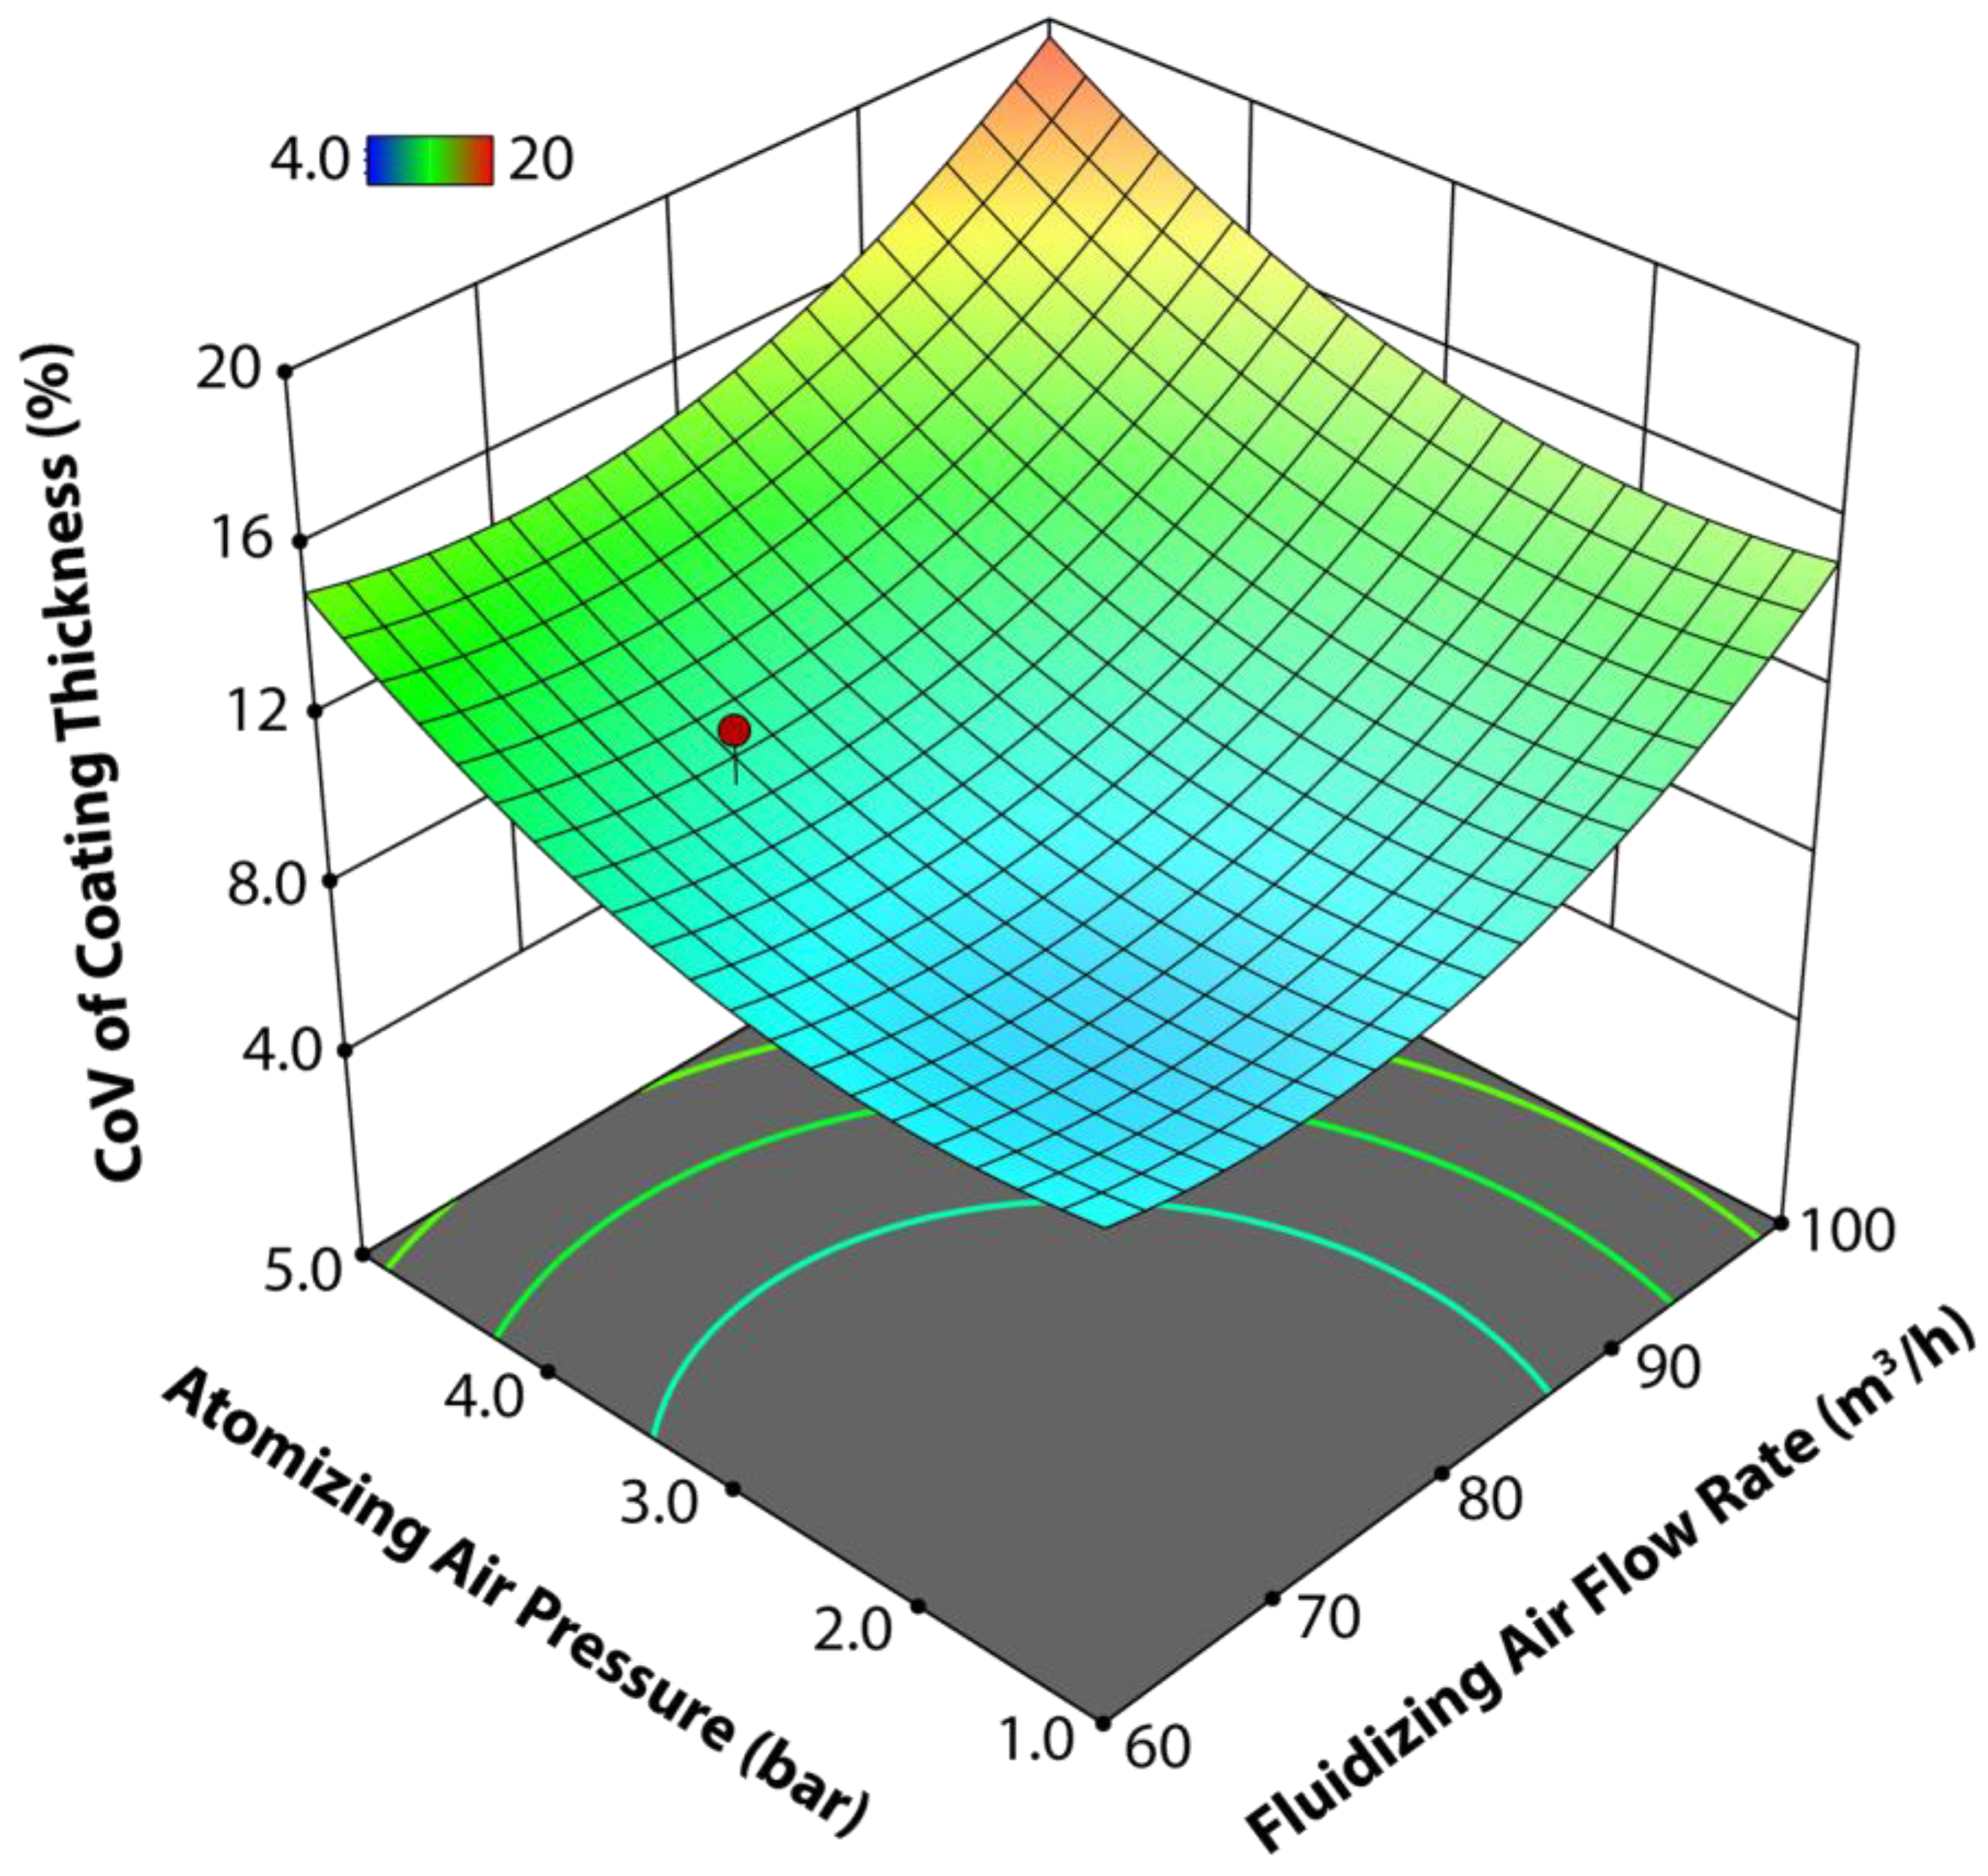
3.1.5. Interactive Effect of Qair and Pair on CoV of Film Thickness

Figure 7 illustrates the interactive effect of Qair and Pair on the coating uniformity (CoV of the film thickness). Promising results were achieved for coating uniformity at a moderate Qair (60 m3/h) and lower Pair (1.0 bar). At these interactive points in the response surface (Figure 7), a CoV of 6.37% was achieved, indicating that a uniform coating film was developed on the granules’ surface. In this case, the combination of a moderate Qair and low Pair at a certain bed temperature facilitated the smooth film formation process such that the trajectory of the flow of spray droplets and hydrodynamics of the fluidized bed were not significantly interrupted, resulting in streamlined impingement and the spreading of spray droplets on the granules’ surface. The good circulation and mobility of the fluidized bed led to the development of a homogeneous coating film after several passes of the granules under the spray zone.
On the contrary, a higher CoV of the film thickness (19.56%) was observed for the combination of Pair and Qair at 5.0 bar and 100 m3/h, respectively. It was reported that a high Pair yields extremely fine spray droplets [20]. It was observed during experimental runs that a significant portion of these extremely small spray droplets was carried away by the fluidizing air flowing at a high rate (100 m3/h). In addition, a higher Pair and Qair made a portion of the spray droplets stick on the inner wall of the fluidized bed. This spray loss in the air vent and on the bed wall resulted in the development of a thin coating film on the wall. A high Qair also disturbed the flow trajectory of granules and hydrodynamics of the fluidized bed which consequently led to the haphazard motion of the granules both in the draft tube and the annular spaces between the walls and the draft tube. Thus, the droplets’ impingement, droplet spreading, and subsequent film formation steps were all asymmetrical which led to the development of a thin, frail, and heterogeneous coating film on the granules’ surface (higher CoV of the film thickness).
A relatively high CoV of the film thickness (Figure 7) was also observed for (i) the combination of a lower Pair (1.0 bar) and higher Qair (100 m3/h) and (ii) the combination of a higher Pair (5.0 bar) and a moderate Qair (60 m3/h). For case (i), a higher Qair created turbulence in the flow regime of the fluidized granules, consequently giving rise to a broad CPPD and coating heterogeneities. Thus, a porous and rough coating surface appeared on the surface of the substrate granules. For case (ii), extremely fine spray droplets generated at a high Pair were carried away with the fluidizing air, resulting in a thin and frail coating film with numerous pores and fissures (high CoV of the film thickness).
The adequacy and validity of the empirical model (Equation (1)) were gauged by plotting the actual data versus the predicted values of the response objective (CoV of the film thickness) as shown in Figure 8A. Since most of the data points lay close to a straight line, the actual and the predicted data were believed to be in good agreement with each other.
To evaluate the optimum process parameters for the most promising coating uniformity results, the desirability of the CoV of the film thickness was set to be the minimum. The statistical analysis yielded the optimum process parameters and the response objective for urea coating uniformity as presented in Table 5. Actual coating experiments (triplicates) were performed using these optimum process conditions and the % error was reported by comparing the predicted and experimental values of the response objective (CoV of the film thickness) based on the results achieved. This error indicated the adequacy of the evaluated optimum process parameters.

3.2. Interactive Effect of Process Parameters on Efficacy of Nutrient Release

The ANOVA results for the interactive effect of process parameters on the longevity of nitrogen release (nutrient-release time) are presented in Table 4. Since the p-values of (i) the statistical model, (ii) individual process parameters (A, B, C, and D), and (iii) interactive parameters (AB, AD, BC, and BD) were less than 0.05, they meet the requirement of a 95% confidence level and are statistically significant.
The interactions of (i) fluidized-bed temperature and atomizing air pressure (AC) and (ii) atomizing air pressure and spray rate (CD), however, were found to be statistically insignificant because of their higher p-values (0.161 and 0.192, respectively). With the lowest p-value (0.0001), fluidized-bed temperature appeared to be the most influential and statistically significant process parameter in this particular case, followed by the spray rate (p-value = 0.0009). An R2 = 0.98 indicated that the regression model could be fitted to the experimental results with adequate precision. The empirical correlation that related the response objective (nutrient-release time) with the process parameters and their interactions after data normalization is given in Equation (2). Only statistically significant terms were included in this equation and the rest, including squared terms, were ignored.
Nutrient-release time   ( Normalized ) = 0.23 0.061 A + 0.0057 B 0.59 C + 0.001 AB + 0.63 AD + 0.054 BC 0.001 BD
where A, B, C, and D refer to the fluidized-bed temperature, fluidizing air flow rate, atomizing air pressure, and spray rate, respectively. The statistical significance of the empirical model (Equation (2)) was checked by an F-test as shown in Table 4. The significance of the F value implies that the regression model was predictive and, therefore, response surfaces can be generated.

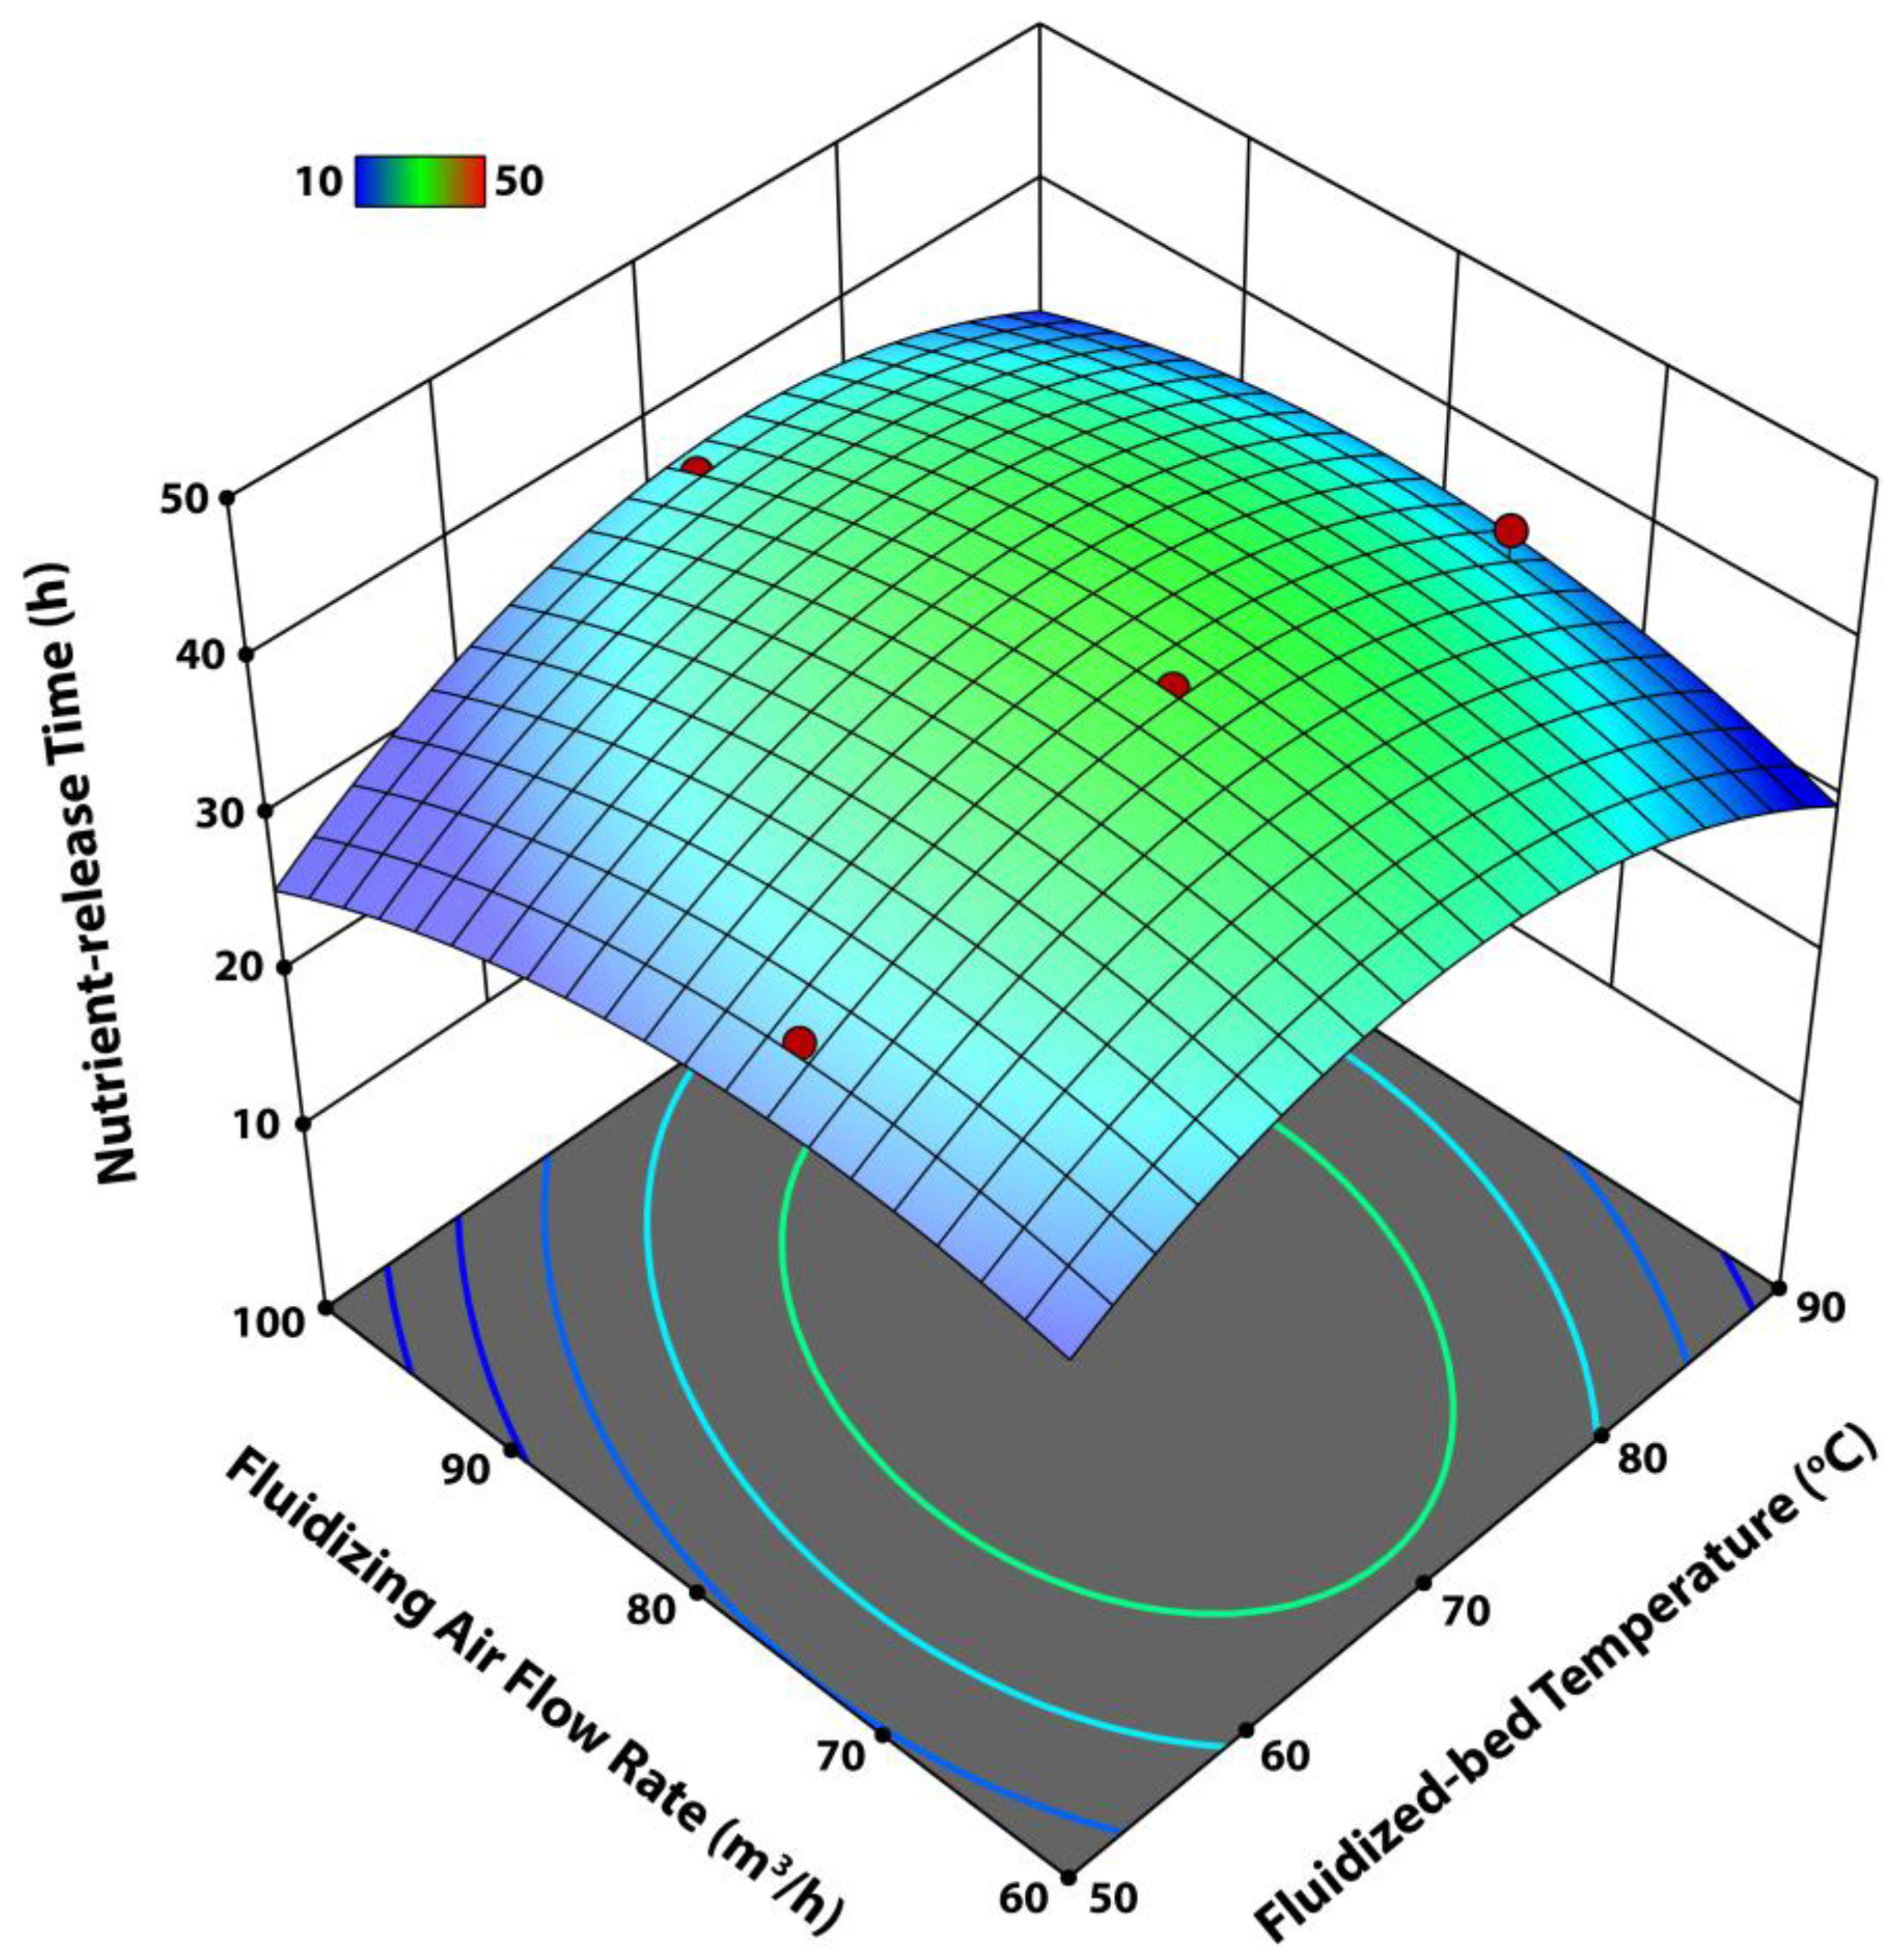
3.2.1. Interactive Effect of Tfb and Qair on Nutrient Release Time

Figure 9 illustrates the integrated effect of the fluidized-bed temperature (Tfb) and fluidizing air flow rate (Qair) on the longevity of nutrient release in terms of nitrogen-release time. The response surface appears to be a semi-circular paraboloid with circular contours. It is observed that the highest longevity of nitrogen release (43.65 h) is achieved at the vertex of the paraboloid for moderately high values of both Tfb and Qair, that is, 73 °C and 75 m3/h, respectively. The interaction of a moderately high Tfb and Qair yields favorable conditions for the film formation steps during the coating process that include droplet impingement, droplet spreading, liquid film formation, solvent evaporation, and the subsequent development of a thin, uniform, and dried solid film on the surface of pristine granules. The quality of granules’ coating in a Wurster fluidized-bed is highly dependent on the smooth and appropriate mixing and circulation of granules that consequently governs the coating per-pass distribution (CPPD) and frequency of the particles coming across the spray zone [22]. The Tfb affects the solvent evaporation from the spray droplets and thus the spread of the liquid film, consequently facilitating the formation of the dried coating film. Therefore, Tfb indirectly affects the mobility of the fluidized-bed and was observed to be promising at Tfb = 73 °C in this case. The hot fluidizing air not only facilitated the evaporation of solvent from spray droplets but also directly controlled the granules’ circulation, mixing, and bed mobility. The substrate granules showed a smooth flow trajectory and a good mixing and circulatory pattern with the kinetic energy of a moderately high Qair. As a result, the droplet impingement, droplet spreading, liquid film formation, solvent evaporation, and solid film formation occurred in a streamlined manner at Tfb = 73 °C and Qair = 75 m3/h and, therefore, a uniform coating film was developed on the surface of the granules. When these granules were subjected to controlled-release experiments, significantly high nutrient release longevity was observed (see the vertex of the paraboloid in Figure 9).
A relatively poor controlled release is observed at all four corners of the paraboloid (Figure 9). The lowest release time (25.2 h) in this particular case was observed for the combination of a Tfb = 50 °C and Qair = 100 m3/h. In this interaction of the process parameters, the Tfb was more influential because it was statistically more significant due to its lower p-value as compared to Qair (p-value = 0.003). Therefore, it is believed that the major contribution for the lower release time, in this case, was mainly driven by the Tfb parameter.
At such a low temperature (50 °C), the poor solvent-evaporation capacity of fluidizing air led to the development of temporary aggregates of the granules that (i) disrupted the flow trajectory of the granules, (ii) reduced the circulation and bed mobility and hence the frequency of the particles to come across the spray zone, and (iii) led to a broad CPPD. All of the aforementioned factors contributed towards the preferential coating of granules, giving rise to coating heterogeneities on the surface of granules. In addition, when the temporary aggregates were broken during the circulatory motion by collision with the walls of the bed and other granules, the coating layer at the bonded surface appeared to be rough and highly porous [23]. Therefore, it took less time for the fertilizer nutrient to escape through the imperfect coating film when subjected to dissolution experiments. Similarly, a relatively lower release time was observed for the combination of Tfb and Qair at 100 °C and 60 m3/h, respectively. This was because of poor circulation, decreased mobility, and a reduced frequency of the particles passing through the spray zone that affected the CPPD. In this case, as observed from the actual coated product, the film thickness was quite low, lowering the release time because the thin coating film could not withstand the osmotic pressure of the dissolved nutrient inside the core of the granule when subjected to the release experiments. At a Tfb = 100 °C, a portion of spray droplets dried pre-maturely and elutriated with the fluidizing air, resulting in spray loss and a thin and rough film coating.
The release time at the other two corners of the paraboloid (Response surface in Figure 9) for the combination of (1) lowest Tfb and Qair (release time = 32.5 h) and (2) highest Tfb and Qair (release time = 33.4 h) indicated relatively better results than the previous two cases. However, the release time at these two combinations (1 and 2) is still lower than the release time at the vertex. For case 1, since the temperature was very low, a sluggish evaporation capacity of fluidizing air developed liquid bridges between fractions of the colliding granules that led towards the formation of aggregates (both temporary and permanent) [24]. At this point, since the fluidizing air flow rate was also very low, the circulation rate and bed mobility was decreased. The frail, porous, and heterogeneous coating film thus formed is vulnerable to rupture and collapse. Hence, a decreased longevity of the nitrogen release was observed at this point of interaction of Tfb and Qair. For case 2 (highest Tfb and Qair), the dominating factor was Tfb due to the lower p-value. At such a high temperature, a fraction of the spray droplets were prematurely dried before impingement on the surface of granules. Part of these dried particles elutriated with the high-flow fluidizing air [13]. The other part of the dried solid particles floated in the flow trajectory of the granules and intermingled with fresh spray droplets. Since these particles are already dried, they maintained their individual integrity and were not homogenized in the spray droplets. Thus, they hindered the spreading of droplets, giving rise to the local accumulation of droplets (coating heterogeneity) [25]. In addition, since the dried particles were not properly integrated in the liquid film spread on the surface of granules and they maintained their individual integrity, a fluffy and fragile coating film was developed that resulted in a poor efficacy of nutrient release.

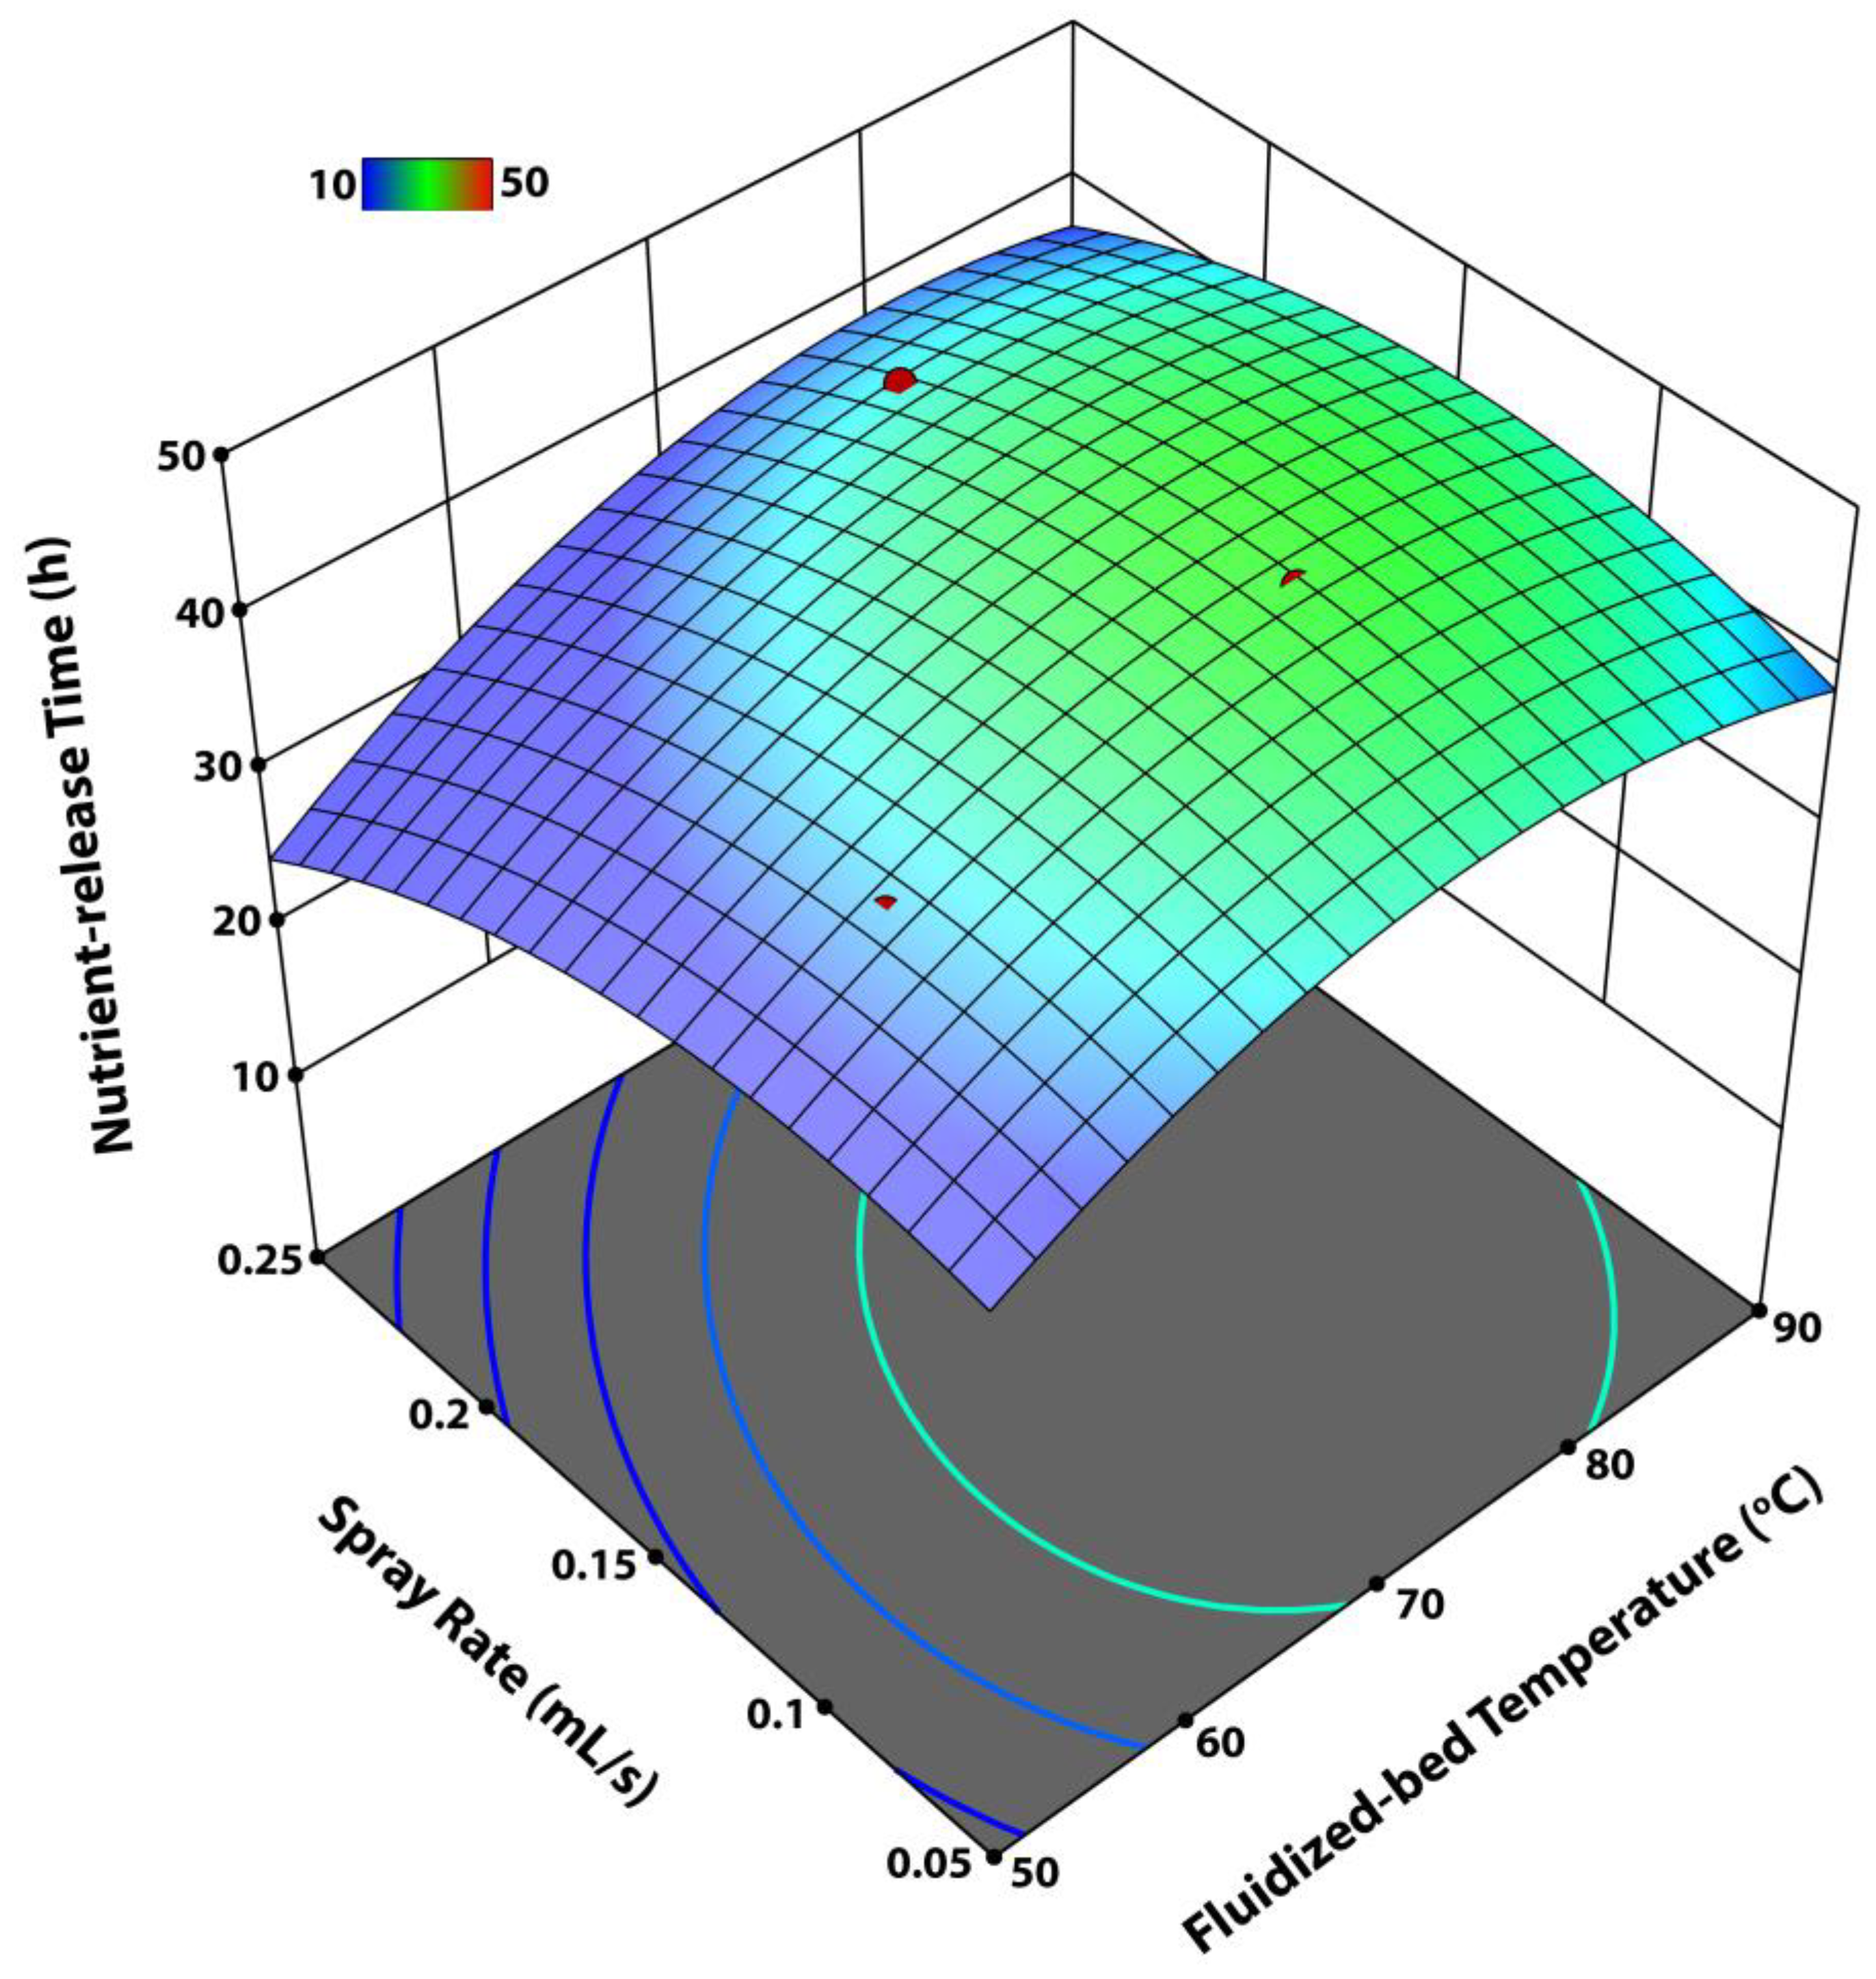
3.2.2. Interactive Effect of Tfb and Rspray on Nutrient Release Time

Figure 10 represents the interactive effect of Tfb and Rspray on the nutrient-release time. The highest release time (43.25 h) in this particular case is observed at the vertex of the paraboloid response surface for the combination of a relatively low Rspray (0.13 mL/s) and a moderately high Tfb (78 °C). A lower spray rate means a lower liquid input into the system [26]. A moderately high temperature augments the evaporation of solvent from the spread liquid film and facilitates the film formation on the surface of granules in a streamlined manner. Since no slugs of granules are formed, the granules experience good mixing and circulation through the flow trajectory and spray zone with a narrow CPPD. Consequently, a relatively thick and uniform coating film is developed which results in an extended-release time of the coated product.
The lowest release time in Figure 10 was observed with the interaction of the lowest Tfb and highest Rspray. An augmented spray rate introduced a higher volume of liquid into the system likewise required a higher amount of energy for the appropriate and timely evaporation of the solvent from the spray droplets spread over the surface of substrate granules [25]. Since the temperature was very low at this point, the consequent diminutive evaporation capacity of the fluidizing air abnormalized all the coating steps. The spray droplets observed polarized accumulation on the surface of granules due to the low Reynolds number because of the sluggish spreading velocity at a lower temperature [9]. The localized accumulation of liquid on the surface of the granules gave rise to preferential coating. The slower evaporation of the solvent facilitated the development of aggregates that disoriented the flow trajectory of granules, further contributing to the preferential coating of granules and thereby broadening the CPPD. In addition, upon segregation of the agglomerated granules, a rough and porous coating film appeared at the point of contact with the granules. All these factors were responsible for a heterogeneous coating film that resulted in a poor efficacy of nutrient-release of the controlled-release urea.
The same phenomena happened at the interactive point of the lowest Tfb (50 °C) and Rspray (0.05 mL/s). As a result, a decreased nutrient-release time was observed (Figure 10). However, the efficacy of nutrient release at this point was still much better than the release time for the combination with the highest Rspray and lowest Tfb. A minor downward trend of the release time was also observed for the interaction of the highest Tfb and Rspray which was most likely because of the premature drying of the spray droplets, and subsequent spray loss due to elutriation [13], and the intermingling of these dried particles with fresh spray droplets as discussed earlier.

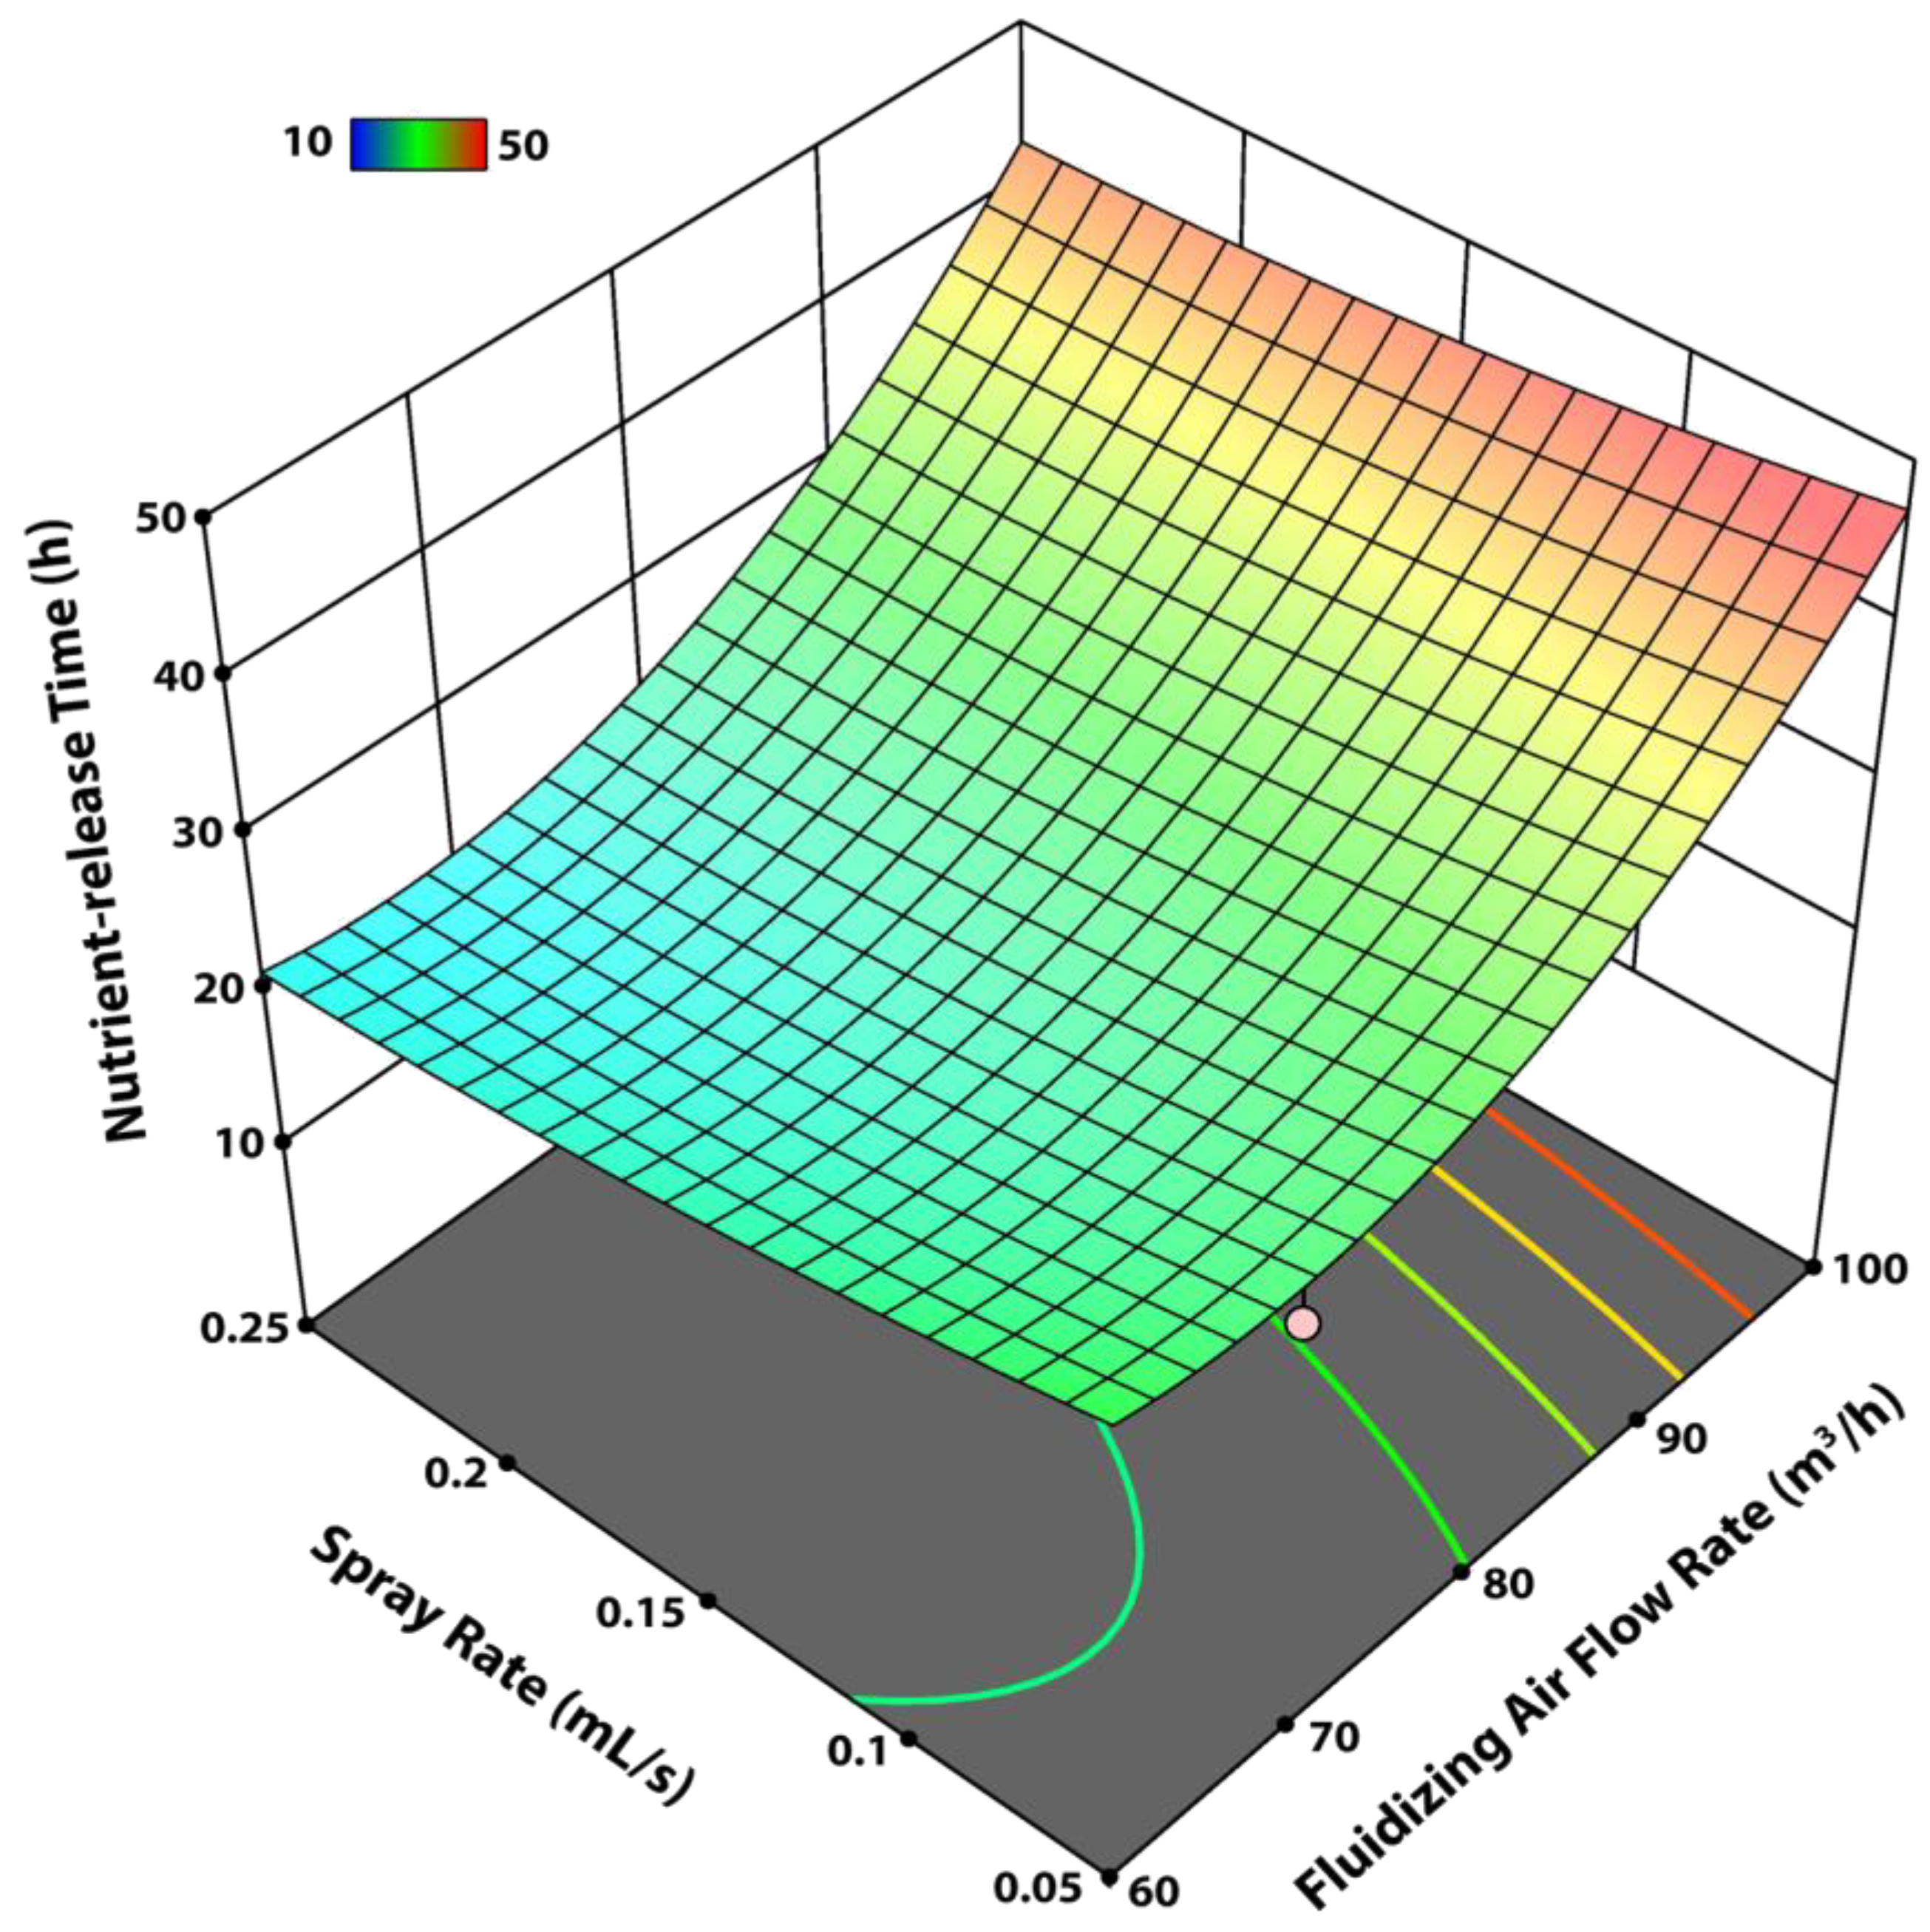
3.2.3. Interactive Effect of Qair and Rspray on Nutrient Release Time

Figure 11 illustrates the integrated effect of Rspray and Qair on the release time of nutrients from the coated product. A promising efficacy of nutrient release was observed for a combination of the largest value of Qair and the lowest Rspray. At a certain temperature, a lower spray rate and augmented flow rate of fluidizing air facilitated the substrate granules to smoothly follow a uniform flow trajectory such that individual granules had plenty of chances to come across the spray zone and witness a narrow CPPD. The same was observed to be true for the combination of the highest Qair and Rspray for which a promising release time was achieved, although it was relatively lower than the first case (highest Qair and lowest Rspray). In both of these scenarios, the essential coating steps were accomplished uninterruptedly and, therefore, a uniform, smooth, and robust coating film was formed on substrate granules that resulted in an extended period of time for the release of nutrients. On the other hand, a poor release performance was displayed by the controlled-release urea granules with Qair = 60 m3/h and Rspray = 0.25 mL/s. Since the airflow was very low in this case, the rate of circulation and granule mixing was likewise low [27]. The flow pattern of granules worsens for an escalated Rspray. In this particular case, it was observed in actual experiments that a fraction of the granules were not even able to follow the flow trajectory from the draft tube to the annular space and back to the draft tube. Instead, they stayed on the distributor or in the draft tube until they received sufficient kinetic energy to overcome the gravitational pull and follow the flow trajectory just like other granules. This led to the preferential coating of granules and a broad CPPD. An augmented Rspray also led to the formation of granules’ aggregates [28]. All these factors contributed towards the development of a frail, porous, and rough coating film on the surface of pristine granules of urea that ultimately resulted in poor performance of the product in terms of the longevity of nutrient release.
A similar result was also observed for the combination of the lowest Qair and Rspray which can also be attributed to the poor circulation of granules and, somehow, to an abnormal flow trajectory of granules. For this interaction of the two process parameters, in particular, the ANOVA results indicated that Qair was statistically more significant and influential as compared to Rspray due to its relatively lower p-value (0.003). This was also evident from the curvature of the response lines on the Qair axis in Figure 11.

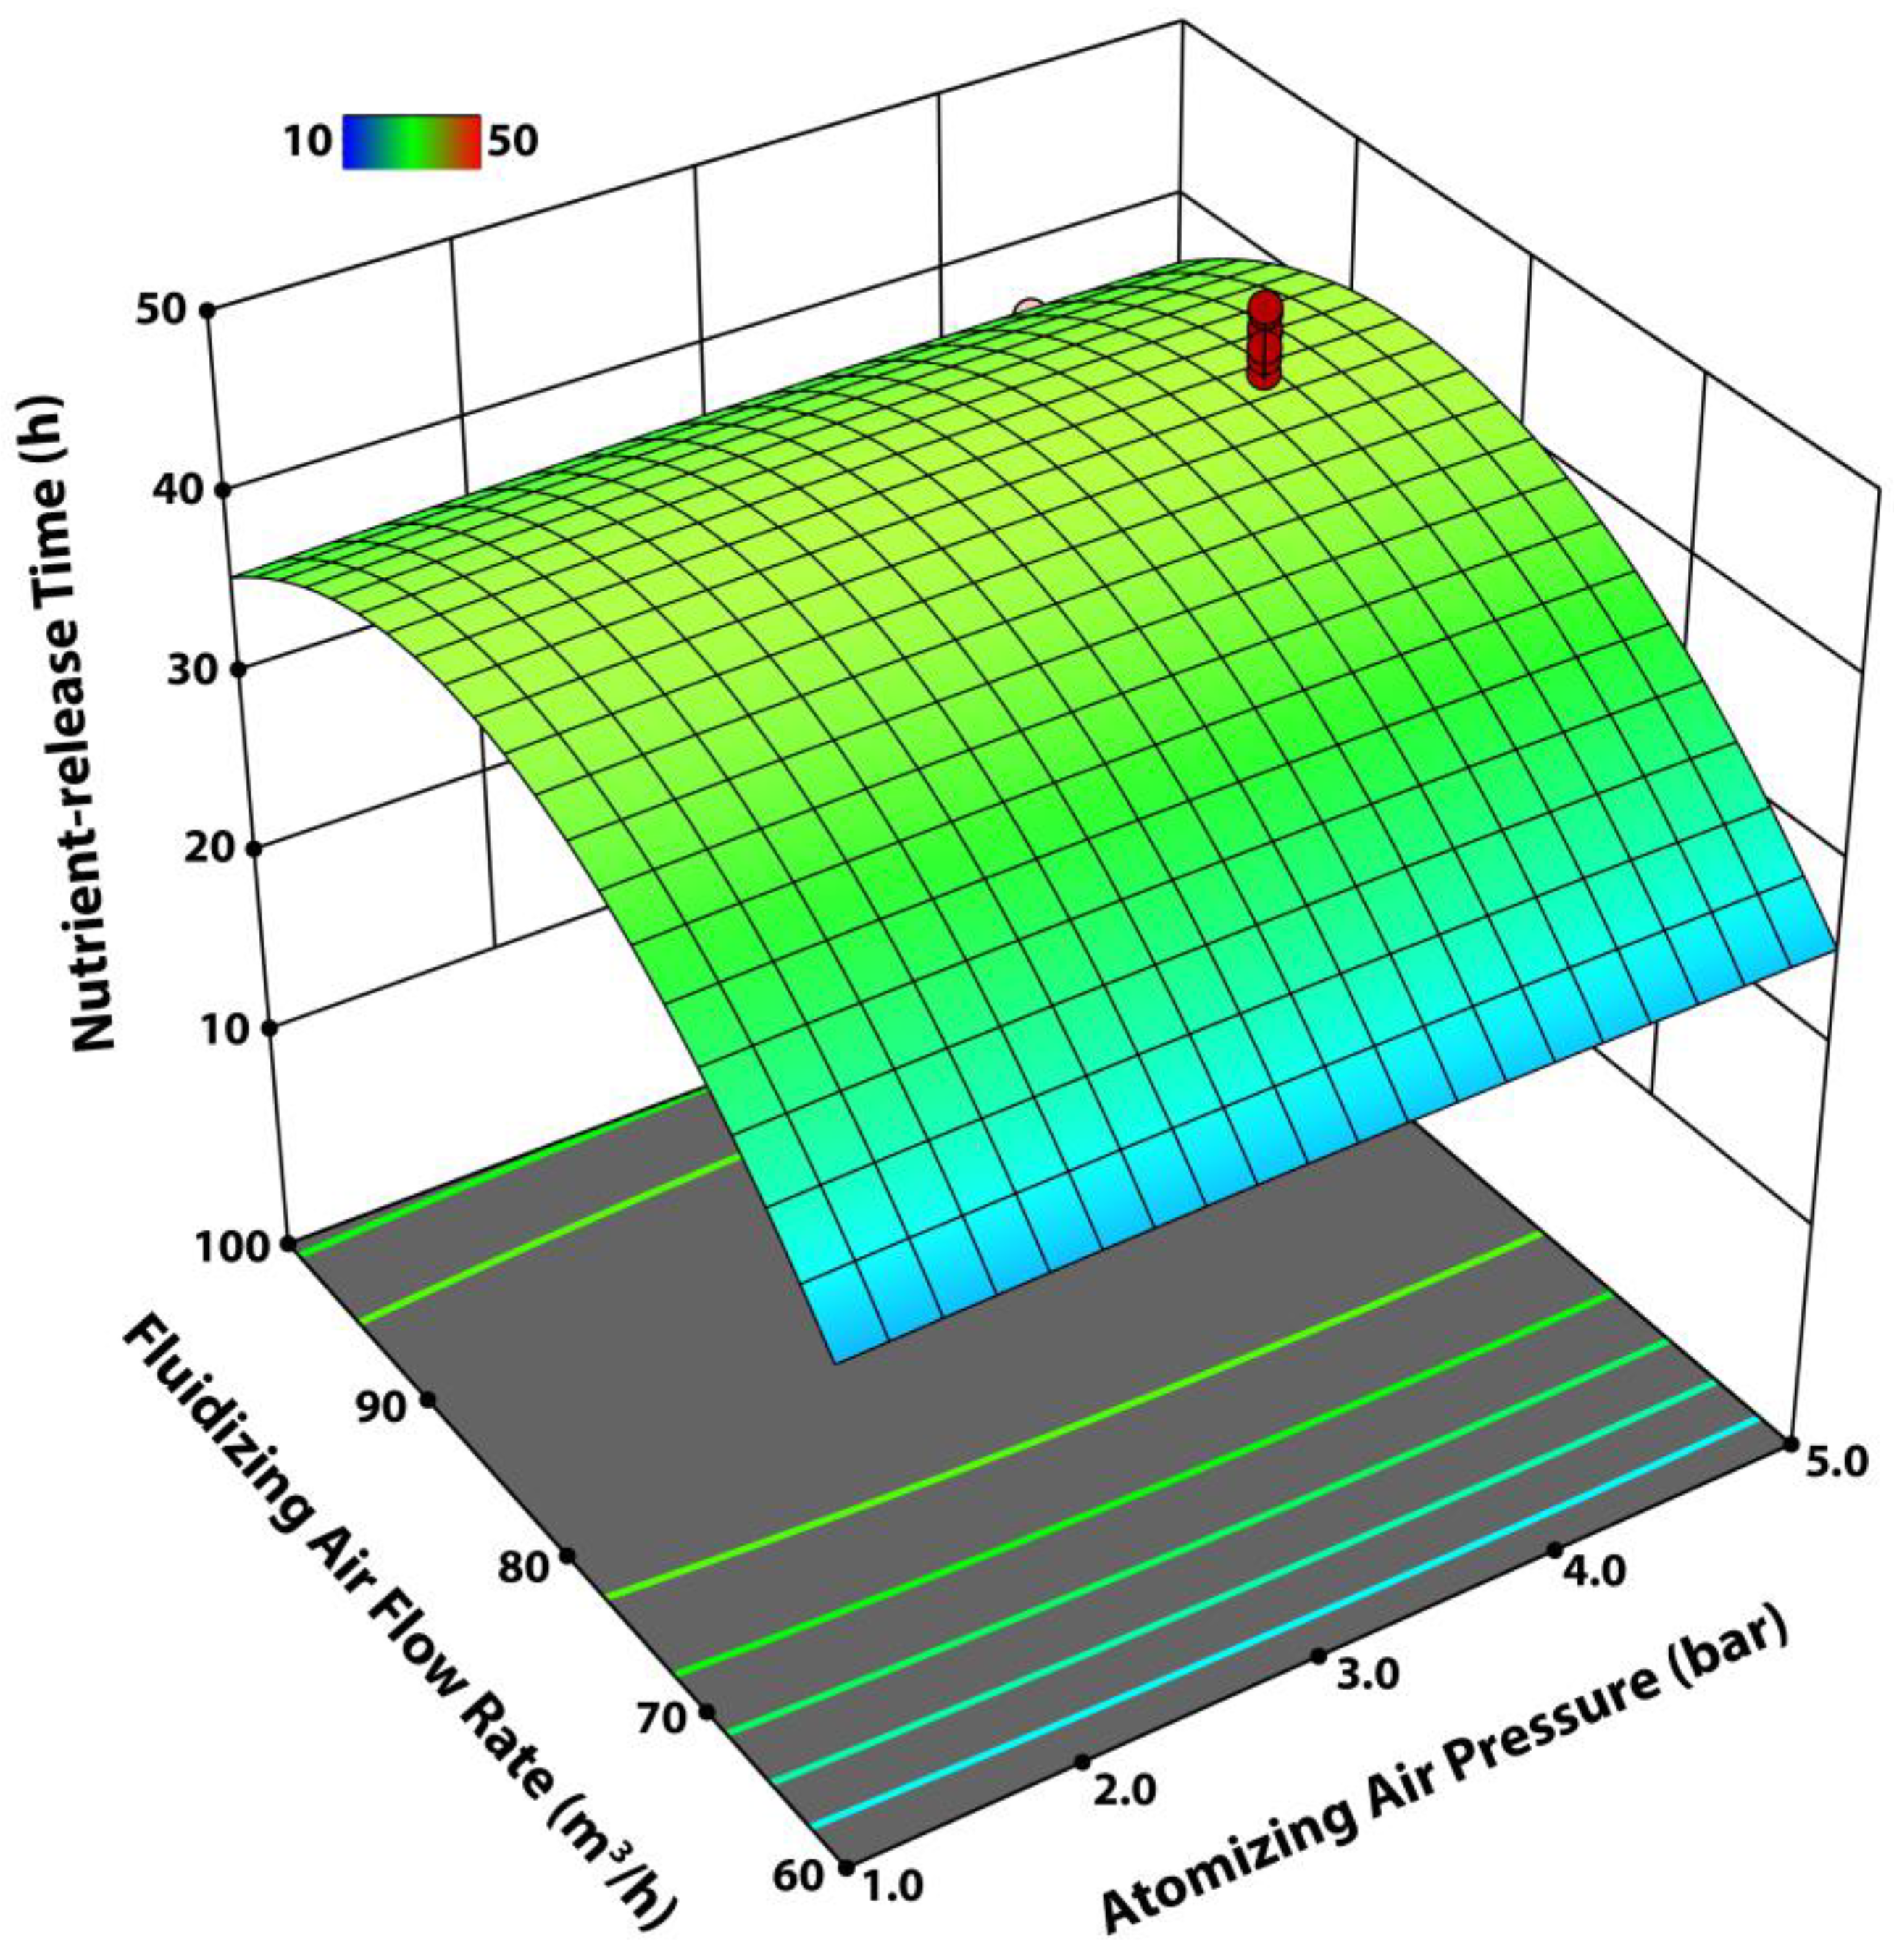
3.2.4. Interactive Effect of Qair and Pair on Nutrient Release Time

Figure 12 represents the interactive effect of Qair and Pair on the response objective (release time of nitrogen). The linearity of response lines on the Pair axis indicates that the nutrient-release time was almost independent of Pair when it comes to the interactive effect of Pair and Qair on nutrient-release time. However, the validity of this observation may not be generalized for other systems that used different spray suspensions for spray coating other substrates in a Wurster coating machine. This suggests that nutrient-release time in this particular case is mainly governed by Qair and a promising release time can be achieved for a significantly high Qair as evident from the vertex of the paraboloid response surface. At a particular bed temperature, a higher Qair guaranteed sufficient mixing and circulation of granules in addition to a well-oriented flow trajectory of the granules in a fluidized-bed [14]. These conditions favored the development of a relatively uniform and durable coating film on substrate granules that consequently withstood the osmotic pressure of dissolved urea for an extended period of time during the release experiments. A much lower release time, however, was observed for a lower Qair. This short release time was characterized by a heterogeneous coating film. The coating heterogeneities in this case were driven by poor circulation, sluggish mixing, and a broad CPPD [29]. A little decrease in release time was also observed for a Qair beyond a critical value of 85 m3/h. At such an augmented Qair, the hydrodynamics and flow profile of granules were interrupted, giving rise to the preferential coating of granules [13]. The rough and porous coating film thus formed resulted in a poor efficacy of nutrient release.
The adequacy and validity of the empirical model (Equation (2)) were gauged by plotting the actual data versus the predicted values of the response objective (nutrient-release time) as shown in Figure 8B. Since most of the data points lay close to a straight line, the actual and the predicted data were believed to be in good agreement with each other.
To evaluate the optimum process parameters for the most promising results of nutrient-release performance, the desirability of the nutrient-release time was set to the maximum. The statistical analysis yielded the optimum process parameters and the response objective for a nutrient-release time as presented in Table 5. Actual coating experiments (triplicates) were performed using these optimum process conditions and the % error was reported by comparing the predicted and experimental values of the response objective (nutrient-release time) based on the results achieved. This error indicated the adequacy of the evaluated optimum process parameters.
A tabular summary of the results is presented in Table 6.

4. Conclusions

In this study, almond shell lignocellulosic waste biomass particles were chemically processed to synthesize coating formulation for the production of controlled-release urea in a Wurster fluidized-bed reactor. A central composite rotatable design was used with response surface methodology for the design of experiments, optimization of process parameters, and investigation of the effect of interactive parameters on coating-film uniformity and nutrient-release performance. The analysis of variance revealed that the fluidized-bed temperature was the most significant and influential process parameter for coating-film uniformity and the controlled release characteristics of CRU particles. This statistical significance was attributed to the fact that the fluidized-bed temperature governs the solvent evaporation from the spray droplets and, therefore, directly affects the mobility and circulation of the substrate particles in the spray zone. The coating quality and consequent nutrient-release characteristics depend on the mixing rate and circulation of CRU particles in the spray zone in addition to the coating per pass distribution. The second most significant process parameter appeared to be the spray rate, which affects the surface properties and mobility of the substrate granules. The regression models indicated good prediction, with R2 = 0.971 and R2 = 0.98, respectively, for coating-film uniformity and nutrient-release efficacy. The validation of the predicted optimum process parameters and response objectives through experimental runs indicated a good agreement between the experimental and predicted values. The water dissolution experiments in this study revealed promising nutrient-release characteristics. Further studies are in process for the agronomic evaluation of this product in soil.

Author Contributions

Conceptualization, A.M.A. (Arshid Mahmood Ali) and B.A.; methodology, B.A.; software, A.J.; validation, A.B.M., M.I.R. and A.A.A.-Z.; formal analysis, K.S.; investigation, A.M.A. (Ahmad M. Alghamdi) and B.A.; resources, A.M.A. (Arshid Mahmood Ali); data curation, A.J; writing—original draft preparation, B.A.; writing—review and editing, B.A., A.M.A. (Ahmad M. Alghamdi) and M.I.R.; visualization, B.A. and A.B.M.; supervision, A.M.A. (Arshid Mahmood Ali); project administration, K.S. and A.A.A.-Z.; funding acquisition, A.M.A. (Arshid Mahmood Ali). All authors have read and agreed to the published version of the manuscript.

Funding

This research work was funded by Institutional Fund Projects under grant number IFPIP:630-135-1443. The authors gratefully acknowledge the technical and financial support provided by the Ministry of Education and King Abdulaziz University, DSR, Jeddah, Saudi Arabia.

Data Availability Statement

The data presented in this study are available within this article.

Conflicts of Interest

The authors declare no conflict of interest.

References

  1. Xie, H.; Zhang, Y.; Zeng, X.; He, Y. Sustainable land use and management research: A scientometric review. Landsc. Ecol. 2020, 35, 2381–2411. [Google Scholar] [CrossRef]
  2. Javaid, M.; Haleem, A.; Khan, I.H.; Suman, R. Understanding the potential applications of artificial intelligence in agriculture sector. Adv. Agrochem. 2022, in press. [Google Scholar] [CrossRef]
  3. Kendall, H.; Clark, B.; Li, W.; Jin, S.; Jones, G.; Chen, J.; Taylor, J.; Li, Z.; Frewer, L. Precision agriculture technology adoption: A qualitative study of small-scale commercial “family farms” located in the North China Plain. Precis. Agric. 2022, 23, 319–351. [Google Scholar] [CrossRef]
  4. Bilal, A.; Khan, N.M.B.; Zaib, J.; Obaid, K.; Ameen, S.; Abbas, S.G.; Babar, A.; Zahid, I.; Abid, M. Role of zinc-coated urea fertilizers in improving nitrogen use efficiency, soil nutritional status, nutrient use efficiency of test crops. Front. Environ. Sci. 2022, 10, 888865. [Google Scholar]
  5. Lawrencia, D.; Wong, S.K.; Low, D.Y.S.; Goh, B.H.; Goh, J.K.; Ruktanonchai, U.R.; Soottitantawat, A.; Lee, L.H.; Tang, S.Y. Controlled release fertilizers: A review on coating materials and mechanism of release. Plants 2021, 10, 238. [Google Scholar] [CrossRef] [PubMed]
  6. Han, Y.; Chen, S.; Xie, B.; Wang, Y.; Fan, Y.; Meng, Q.; Zhang, Y. Waterborne polymer modified with zeolite for environment-friendly slow-release coated urea. J. Appl. Polym. Sci. 2023, 140, e53633. [Google Scholar] [CrossRef]
  7. Chen, X.; Guo, T.; Mo, X.; Zhang, L.; Wang, R.; Xue, Y.; Sun, S. Reduced nutrient release and greenhouse gas emissions of lignin-based coated urea by synergy of carbon black and polysiloxane. Int. J. Biol. Macromol. 2023, 231, 123334. [Google Scholar] [CrossRef]
  8. Liang, D.; Shi, H.; Lu, Q.; Quirino, R.L.; Zhang, C. Controlled-release Fertilizers with Ultralow Coating Content. J. Mater. Chem. A 2023, 11, 4527–4538. [Google Scholar] [CrossRef]
  9. Fertahi, S.; Ilsouk, M.; Zeroual, Y.; Oukarroum, A.; Barakat, A. Recent trends in organic coating based on biopolymers and biomass for controlled and slow release fertilizers. J. Control. Release 2021, 330, 341–361. [Google Scholar] [CrossRef]
  10. Azeem, B.; KuShaari, K.; Man, Z.; Irfan, S.A.; Trinh, T.H. Tumbling fluidized-bed process parameters affecting quality of biopolymer coating on surface of pristine urea particles. Powder Technol. 2017, 320, 714–725. [Google Scholar] [CrossRef]
  11. Jiang, Z.; Rieck, C.; Bück, A.; Tsotsas, E. Modeling of inter-and intra-particle coating uniformity in a Wurster fluidized bed by a coupled CFD-DEM-Monte Carlo approach. Chem. Eng. Sci. 2020, 211, 115289. [Google Scholar] [CrossRef]
  12. Madlmeir, S.; Forgber, T.; Trogrlic, M.; Jajcevic, D.; Kape, A.; Contreras, L.; Carmody, A.; Liu, P.; Davies, C.; Sarkar, A.; et al. Modeling the coating layer thickness in a pharmaceutical coating process. Eur. J. Pharm. Sci. 2021, 161, 105770. [Google Scholar] [CrossRef]
  13. Norouzi, H.R. Simulation of pellet coating in Wurster coaters. Int. J. Pharm. 2020, 590, 119931. [Google Scholar] [CrossRef]
  14. Azeem, B.; Elboughdiri, N.; KuShaari, K.; Jamoussi, B.; Ghernaout, D.; Ghareba, S.; Raza, S.; Gasmi, A. Valorization of almond shells’ lignocellulosic microparticles for controlled release urea production: Interactive effect of process parameters on longevity and kinetics of nutrient release. J. Coat. Technol. Res. 2022, 19, 643–660. [Google Scholar] [CrossRef]
  15. Azeem, B.; KuShaari, K.; Man, Z.; Trinh, T.H. Effect of fluidized-bed process variables on controlled-release of nitrogen and coating. Braz. J. Chem. Eng. 2018, 35, 587–604. [Google Scholar] [CrossRef] [Green Version]
  16. Azeem, B.; KuShaari, K.; Man, Z.; Trinh, T.H. Nutrient release characteristics and coating homogeneity of biopolymer coated urea as a function of fluidized bed process variables. Can. J. Chem. Eng. 2017, 95, 849–862. [Google Scholar] [CrossRef]
  17. Turton, R.; Cheng, X.X. The scale-up of spray coating processes for granular solids and tablets. Powder Technol. 2005, 150, 78–85. [Google Scholar] [CrossRef]
  18. Shaari, K.Z.K. Coating Uniformity on a Pharmaceutical Tablet: An Experimental Study and Finite Volume Modeling of Droplet Impact Behavior; West Virginia University: Morgantown, WV, USA, 2007. [Google Scholar]
  19. KuShaari, K.; Pandey, P.; Song, Y.; Turton, R. Monte Carlo simulations to determine coating uniformity in a Wurster fluidized bed coating process. Powder Technol. 2006, 166, 81–90. [Google Scholar] [CrossRef]
  20. Bizhaem, H.K.; Tabrizi, H.B. Experimental study on hydrodynamic characteristics of gas–solid pulsed fluidized bed. Powder Technol. 2013, 237, 14–23. [Google Scholar] [CrossRef]
  21. Basit, A.; KuShaari, K.; Trinh, T.H.; Azeem, B. Spreading of low impact velocity droplet on porous surface. Int. J. Chem. Eng. Appl. 2014, 5, 95. [Google Scholar] [CrossRef] [Green Version]
  22. Palamanit, A.; Soponronnarit, S.; Prachayawarakorn, S.; Tungtrakul, P. Effects of inlet air temperature and spray rate of coating solution on quality attributes of turmeric extract coated rice using top-spray fluidized bed coating technique. J. Food Eng. 2013, 114, 132–138. [Google Scholar] [CrossRef]
  23. Hemati, M.R.K.V.; Cherif, R.; Saleh, K.; Pont, V.J.P.T. Fluidized bed coating and granulation: Influence of process-related variables and physicochemical properties on the growth kinetics. Powder Technol. 2003, 130, 18–34. [Google Scholar] [CrossRef]
  24. Lan, R.; Liu, Y.; Wang, G.; Wang, T.; Kan, C.; Jin, Y. Experimental modeling of polymer latex spray coating for producing controlled-release urea. Particuology 2011, 9, 510–516. [Google Scholar] [CrossRef]
  25. Zhou, H.; Tu, Q.Y.; Wang, H.G. Investigation of the complex gas-solids flow characteristics in a fluidized bed with a Wurster tube by process tomography and CFD simulation. Powder Technol. 2019, 357, 117–133. [Google Scholar] [CrossRef]
  26. Azeem, B.; KuShaari, K.; Naqvi, M.; Keong, L.K.; Almesfer, M.K.; Al-Qodah, Z.; Naqvi, S.R.; Elboughdiri, N. Production and characterization of controlled release urea using biopolymer and geopolymer as coating materials. Polymers 2020, 12, 400. [Google Scholar] [CrossRef] [Green Version]
  27. Saleh, K.; Guigon, P. Coating and encapsulation processes in powder technology. In Handbook of Powder Technology; Elsevier Science BV: Amsterdam, The Netherlands, 2007; Volume 11, pp. 323–375. [Google Scholar]
  28. Trinh, T.H.; Shaari, K.Z.K.; Basit, A.; Azeem, B. Effect of particle size and coating thickness on the release of urea using multi-diffusion model. Int. J. Chem. Eng. Appl. 2014, 5, 58. [Google Scholar] [CrossRef] [Green Version]
  29. Depypere, F.; Van Oostveldt, P.; Pieters, J.G.; Dewettinck, K. Quantification of microparticle coating quality by confocal laser scanning microscopy (CLSM). Eur. J. Pharm. Biopharm. 2009, 73, 179–186. [Google Scholar] [CrossRef]
Figure 1. Schematic diagram of the Wurster fluidized-bed (WFB) reactor for urea coating.
Agronomy 13 00725 g001
Figure 2. Field emission scanning electron microscope (FESEM) micrographs of representative cross-sections of coated granules.
Agronomy 13 00725 g002
Figure 3. Interactive effect of the fluidized-bed temperature (Tfb) and fluidizing air flow rate (Qair) on the coefficient of variance (CoV) of the coating film thickness.
Agronomy 13 00725 g003
Figure 4. Interactive effect of the fluidized-bed temperature (Tfb) and spray rate (Rspray) on the CoV of coating film thickness.
Agronomy 13 00725 g004
Figure 5. Interactive effect of the fluidized-bed temperature (Tfb) and atomizing air pressure (Pair) on the coefficient of variance (CoV) of the coating thickness.
Agronomy 13 00725 g005
Figure 6. Interactive effect of the spray rate (Rspray) and fluidizing air flow rate (Qair) on the CoV of the coating thickness.
Agronomy 13 00725 g006
Figure 7. Interactive effect of fluidizing air flow rate (Qair) and atomizing air pressure (Pair) on the CoV of the coating thickness.
Agronomy 13 00725 g007
Figure 8. Actual vs. predicted (A) coefficient of variance (CoV) of the film thickness and (B) nutrient-release time.
Agronomy 13 00725 g008
Figure 9. Interactive effect of the fluidizing air flow rate (Qair) and fluidized-bed temperature (Tfb) on the nutrient-release time.
Agronomy 13 00725 g009
Figure 10. Interactive effect of the spray rate (Rspray) and fluidized-bed temperature (Tfb) on the nutrient-release time.
Agronomy 13 00725 g010
Figure 11. Interactive effect of the spray rate (Rspray) and fluidizing air flow rate (Qair) on the nutrient-release time.
Agronomy 13 00725 g011
Figure 12. Interactive effect of the fluidizing air flow rate (Qair) and atomizing air pressure (Pair) on the nutrient-release time.
Agronomy 13 00725 g012
Table 1. Specifications of the Wurster fluidized-bed (WFB) reactor used in this study.
ParametersSpecifications
Nozzle type Two-fluid
Orifice size (inner) 0.3 mm
Orifice size (outer) 0.6 mm
FluidTwo-fluid mixed
Spray pattern Full circular cone (bottom to top)
Material EN 1.4305 Equiv.
Spray angle 45 degrees
Mean diameter of distributor orifices 1.5 mm
Height of draft tube 200 mm
Diameter of draft tube50 mm
Distance between draft tub and distributor 25 mm
Total height of the WFB580 mm
Base diameter in lower conical chamber 118 mm
Diameter of upper cylindrical expansion chamber250 mm
Height of upper cylindrical expansion chamber380 mm
Table 2. Trial runs’ maxima and minima of the studied process parameters.
SrParameterUnitsNotationMin. ValueMax. Value
1Fluidized-bed Temperature°CA4585
2Fluidizing-air Flow Ratem3/hB4090
3Atomizing Air Pressure barC1.54.5
4Spray Rate mL/sD0.0750.225
Table 3. Experimental matrix (design of experiments) based on the central composite rotatable design (CCRD).
RunFluidized-Bed
Temperature
(A)
Fluidizing
Air Flow Rate
(B)
Atomizing
Air Pressure
(C)
Spray
Rate
(D)
150453.50.20
260852.00.15
345501.50.05
470604.00.25
565753.00.05
680954.50.10
775703.50.15
890601.00.10
960303.50.05
1070551.50.25
1155804.00.20
1275703.50.15
13851001.50.05
1465653.00.25
1540804.50.15
1685501.50.05
1765952.00.20
1875703.50.15
1950755.00.25
2085601.00.15
2175703.50.15
2275553.00.10
2350404.50.15
2465352.00.10
2540803.50.25
2675703.50.15
2775751.00.15
28551004.00.05
2985855.00.05
3070954.50.25
3155451.50.15
3275703.50.15
3365651.00.20
3480703.00.25
3575703.50.15
3685902.50.15
37701003.50.05
3850601.50.10
3965704.50.25
4090305.00.20
Table 4. Statistical results for the interactive effect of process parameters on the coefficient of variance (CoV) of film thickness and nutrient release time.
SourceCoV of Film ThicknessNutrient Release Time
F-Valuep-ValueF-Valuep-Value
Model39.56<0.000138.31<0.0001
A (Fluid Bed Temp)40.700.000242.700.0001
B (Air Flow Rate)4.680.0016.750.003
C (Atom. Pressure)40.700.00935.700.007
D (Spray Rate)9.060.000712.060.0009
AB9.060.00319.470.0027
AC31.170.008236.50.161
AD6.700.00558.600.0048
BC12.250.0411.010.037
BD9.570.01515.450.011
CD14.360.10613.860.192
A225.140.000224.240.00015
B243.410.000740.810.0006
C2164.450.0009132.320.0008
D243.410.00153.580.0025
R2 = 0.971R2 = 0.98
Adj-R2 = 0.95Adj-R2 = 0.965
Adeq. Precision = 24.58Adeq. Precision = 21.37
Table 5. Optimum process parameters, experimental response, and % error.
Response
ANOVA-Based Optimum Values ofExperimental Response
(Using ANOVA-Based Optimum Parameters)
% Error
Process ParametersResponse
A
(°C)
B
(m3/h)
C
(bar)
D
(mL/s)
CoV of Film
Thickness (%)
80723.50.1511.512.69.56
Nutrient-release
Time (h)
78753.20.1255649.511.6
Table 6. Summary of the salient results.
Response ObjectiveNutrient-Release TimeCoV of Film Thickness
MagnitudeHighestLowestHighestLowest
43.65 h25.2 h19.56%3.0%
Parameter ValuesTfbQairTfbQairPairQairTfbQair
73 °C75 m3/h50 °C100 m3/h5.0 bar100 m3/h75 °C65 m3/h
Tfb = Fluidized-bed Temperature, Qair = Fluidizing-air Flowrate, and Pair = Atomizing-air Pressure.
Disclaimer/Publisher’s Note: The statements, opinions and data contained in all publications are solely those of the individual author(s) and contributor(s) and not of MDPI and/or the editor(s). MDPI and/or the editor(s) disclaim responsibility for any injury to people or property resulting from any ideas, methods, instructions or products referred to in the content.

