Article

Accurate Phenotypic Identification and Genetic Analysis of the Ear Leaf Veins in Maize (Zea mays L.)

1
College of Agronomy, Liaocheng University, Liaocheng 252059, China
2
Beijing Key Lab of Digital Plant, Research Center of Information Technology, Beijing Academy of Agriculture and Forestry Sciences, Beijing 100097, China
*
Authors to whom correspondence should be addressed.
These authors contributed equally to this work.
Agronomy 2023, 13(3), 753; https://doi.org/10.3390/agronomy13030753
Submission received: 19 January 2023 / Revised: 21 February 2023 / Accepted: 25 February 2023 / Published: 4 March 2023
(This article belongs to the Special Issue Micro Phenotyping for Plant Breeding)

Abstract

:
The ear leaf veins are an important transport structure in the maize "source" organ; therefore, the microscopic phenotypic characteristics and genetic analysis of the leaf veins are particularly essential for promoting the breeding of ideal maize varieties with high yield and quality. In this study, the microscopic image of the complete blade cross section was realized using X-ray micro-computed tomography (micro-CT) technology with a resolution of 13.5 µm. Moreover, the veins’ phenotypic traits in the cross section of the complete maize leaf, including the number of leaf veins, midvein area, leaf width, and density of leaf veins, were automatically and accurately detected by a deep-learning-integrated phenotyping pipeline. Then, we systematically collected vein phenotypes of 300 inbred lines at the silking stage of the ear leaves. It was found that the leaf veins’ microscopic characteristics varied among the different subgroups. The number of leaf veins, the density of leaf veins, and the midvein area in the stiff-stalk (SS) subgroup were significantly higher than those of the other three subgroups, but the leaf width was the smallest. The leaf width in the tropical/subtropical (TST) subgroup was the largest, but there was no significant difference in the number of leaf veins between the TST subgroup and other subgroups. Combined with a genome-wide association study (GWAS), 61 significant single-nucleotide polymorphism markers (SNPs) and 29 candidate genes were identified. Among them, the candidate gene Zm00001d018081 regulating the number of leaf veins and Zm00001d027998 regulating the midvein area will provide new theoretical support for in-depth analysis of the genetic mechanism of maize leaf veins.

1. Introduction

Maize is an important crop with high photosynthetic efficiency, optimal height, great production potential, and versatility in cultivation. The formation of maize yield has been extensively studied, particularly in relation to the "source, flow and sink" hypothesis, to look into the function of several maize organs in a multidimensional and deep phenotypic analysis [1,2]. The leaf serves as a “source” organ that stores light energy in carbohydrates, forming the basis of crop yield. Previous studies on the different leaf positions of maize have shown that the middle leaves contribute the most to the grain yield, with the ear leaf having the greatest impact on 100-grain weight and yield per plant [3]. Therefore, it is important to explore the phenotypic traits and related biological functions of the maize ear leaf. Leaf veins play a crucial role in conducting water and nutrients from stems to leaves, as well as transporting photosynthetic products to organs for consumption or storage [4,5]. In addition to their transportation function, the midvein, in conjunction with the lateral veins, can maintain the leaf’s general shape, ensure adequate hardness and elasticity of the vein structure, and adapt to the environment with the best structure [6,7]. As a result, leaf veins are commonly regarded as a crucial agronomic characteristic for improving crop output.
The unique structure and function of leaf veins have inspired the pursuit of underlying theoretical knowledge. Initially, it was found that the leaf veins showed complex patterns with certain distribution rules through visual observation; for example, the leaf age of monocotyledon crops can be judged from the number of veins and the position of the midvein [8]. The use of microscopy techniques to study the anatomical structure of leaves has led to the increasing discovery of phenotypic traits of leaf veins. The findings revealed that C4 leaves had denser veins [9,10], and there were notable differences in vein density and spacing between C4 and C3 leaves. Leaf veins in the majority of monocotyledons exhibit a hierarchical order and various structural variations, and this vein differentiation results in functional differences [11]. X-ray micro-computed tomography (micro-CT), as a new generation of microimage acquisition technology, uses X-rays to quickly acquire microscopic images nondestructively and realizes the visualization of plant tissue structure. In the late 1990s, micro-CT was first applied to plants to study the structure and morphological development of roots [12]. In recent years, there has been a growing number of studies related to the visualization and quantification of plant leaves, fruits, stems, inflorescences, and other structures using micro-CT due to the continuous advances in micro-CT hardware technology and image analysis tools. Kaminuma used commercial micro-CT (Shimadzu SMX-100CT-SV3) to scan Arabidopsis thaliana leaves, with a resolution of 21 µm/pixel, to quantify and visualize the distribution of trichome on the surface of Arabidopsis leaves and the arrangement skeleton of the leaf tissue cells [13]. Dhondt used micro-CT to obtain the three-dimensional (3D) image of the pseudosouthern tip, with resolutions of 4.5 µm and 13.8 µm [14]. Borsuk used micro-CT to scan leaf tissue, obtained images with resolutions between 1.277 and 0.1625 µm, observed the ordered honeycomb-like tissue structure of spongy mesophyll, and obtained 3D microscopic images at the cell level for measurement of cell length, width, volume, density, and other indicators [15]. Micro-CT can not only obtain the phenotypic information of plant tissues and cells with high throughput but also realize the 3D visualization of tissues and cells, and we were able to conduct 3D morphological analysis of plant tissue structure [16]. With the increasing resolution of micro-CT, the ability to capture the external plant morphology, as well as to visualize and quantify the internal structure of plant organs non-invasively, is of great importance for in-depth studies of leaf vein phenotypes.
Leaf vein development is controlled by complex genetic regulation involving multiple physiological and biochemical processes. In maize, several genes that regulate leaf vein structure have been discovered by studying mutants. For example, tangled-1 (tan1) encodes the microtubule-binding protein, and the mutant leads to the disorganized arrangement of vascular bundles in the leaf, forming disorganized and irregularly spaced leaf vascular bundle distribution [17]. The large scutellar node1 (lsn1) is involved in the growth hormone synthesis and transport process, and the mutant leads to incorrect differentiation of the leaf midvein, irregular distribution of vascular bundles, and poor tissue development [18]. The rough sheath2 (rs2) belongs to the MYB transcription factor family and is also involved in processes related to growth hormone synthesis and transportation, and the mutant can lead to distorted midvein development [19]. The rough sheath1 (rs1) and Knotted1 (kn1) both belong to the KNOX transcription factor family; the mutant of rs1 leads to abnormal vascular xylem development, and the mutant of kn1 results in an increase in leaf vein spacing [20,21]. Leaf width limits vein density; mutations in the NARROW LEAF2 (NAL2) and NAL3 narrow the leaf and reduce the number of large and small leaf veins [22]. Mutations in the PUNCTATE VASCULAR EXPRESSION1 (PVE1), which encodes an unknown protein, cause abnormal vascular bundle development [23]. In terms of phytohormones, the auxin and brassinolide (BR) signaling regulatory networks affect leaf vein density. SHORTROOT1 (SHR1) and SCARECROW1 (SCR1) belong to the GRAS transcription factor family; mutations in these genes result in reduced leaf vein density and abnormal development of vascular bundle sheath cells [24,25]. In Arabidopsis, SHR1 and SCR1 mutants cause decreased expression of BR-related genes [26]. INDETERMINATE DOMAIN (IDD) family proteins are involved in the control of leaf vein spacing, and, in Arabidopsis, AtIDD14/15/16 synergistically regulates the process of auxin biosynthesis [27]. Thus, the process of leaf vein development is regulated by a phytohormone-related network involving complex mechanisms of gene regulation.
GWAS is a useful approach to identify the genetic structures that regulate important traits by bridging phenotypes and genotypes. GWAS has been applied to various areas, including plant structure, development, and response to environmental factors [28]. At present, the integration of high-throughput phenotype data with GWAS has mainly focused on model species such as rice and maize, with few studies on other plants [29]. In maize leaf studies, Liu et al. used 508 inbred lines to determine the maize midvein traits, and GWAS analysis was performed on the width, thickness, and depth of the veins [30]. Tian et al. conducted a GWAS of the maize nested association mapping panel to determine the genetic basis of important leaf architecture traits and identified some of the key genes [31]. In addition, Peng used a panel of 285 diverse maize inbred lines genotyped with 56,000 significant single-nucleotide polymorphism markers (SNPs) to investigate the genetic basis of leaf angle using GWAS [32]. Based on advanced micro-CT high-throughput phenotypic acquisition technology, the combination of phenotyping and GWAS has the potential to reveal the genetic variation underlying leaf vein traits.
By combining phenotyping and GWAS with advanced micro-CT technology, our study analyzed the phenotypic variations in ear leaf veins among 300 inbred lines and revealed the genetic architecture of the leaf veins. This study will help to improve the accurate identification of ear leaf veins’ phenotypic traits, explore the structural and functional relationships of veins, provide an important phenotypic basis for breeding high-yielding and high-quality maize varieties, and lay a theoretical foundation for molecular-assisted breeding to improve leaf agronomic traits in maize.

2. Materials and Methods

2.1. Materials

The 300 maize inbred lines used in this study belong to the natural maize population constructed by Yang [33] and were divided into four subgroups according to the population structure Q matrix: 20 lines belong to stiff stalk (SS), 77 lines belong to non-stiff stalk (NSS), 141 lines belong to tropical–subtropical (TST), and 62 lines belong to the admixed group (Mixed). The materials were planted at the Southern Propagation Base of Maize Research Center, Beijing Academy of Agricultural and Forestry Sciences (Yazhou District, Sanya City, Hainan Province, 109.1870° E, 18.3905° N.), and sowing took place on 20 March 2021. Each inbred line was planted in two-row plots with eight plants in each row; each row was 2.1 m long, and there was 60 cm between rows. Ear leaves were collected 12 days after silking, and three replicates were taken from each inbred line. We soaked 2 cm sample blocks from the middle of the ear leaves in FAA solution (90:5:5 v/v/v, 70% ethanol:100% formaldehyde:100% acetic acid) for subsequent study.

2.2. Leaf Vein CT Image Acquisition and Image Reconstruction

To ensure image data quality, leaf vein CT image acquisition and phenotype analysis were performed with reference to the standardized process of maize vascular bundle microscopic image acquisition constructed by our research team [1], which includes the following three parts. (A) Pretreatment: (1) Sample dehydration. The soaked samples were dehydrated by ethanol gradient in the following steps: 70% alcohol for 1 d → 100% alcohol for 1 d → 100% alcohol for 1 d. (2) Tertiary butyl alcohol substitution. The samples that had completed ethanol gradient dehydration were replaced by tertiary butyl alcohol; the specific steps were: 1/2 anhydrous ethanol + 1/2 tertiary butyl alcohol 1d → 100% tertiary butyl alcohol 1d → 100% tertiary butyl alcohol 1d. (3) Sample freeze drying. The samples were frozen at −80 °C for 1 d, and frozen samples were freeze-dried for 2 h with a freeze dryer (LGJ-10E, Beijing, China). (4) Staining. The dried leaves were stained using the “iodine fumigation method” for 2 d. (B) Micro-CT scanning: The Skyscan 1172 X-ray computed tomography system (Bruker, Nazareth, Belgium) was used to obtain microscopic images of the intact middle cross section of the leaves in this study. The specific scanning parameters were as follows: voltage and current was 40 kV/250 mA, and no filter was set; the detector was 215 mm away from the X-ray source; the sample was 100 mm away from the X-ray source; and the scanning resolution was 13.55 µm. The 2K (2000 × 2000 pixels) scanning mode was set; the exposure time was about 250 ms. The sample stage was rotated in steps of 0.2°, the rotation angle was 180°, and the scanning time was about 27 min. (C) Image reconstruction. The original CT images were reconstructed using Skyscan NRecon software (Bruker, Nazareth, Belgium), the HU values were set to −500~6000, and the cross-sectional images of the maize ear leaves in 8 bit image file (BMP) format were obtained for later phenotypic feature extraction and analysis.

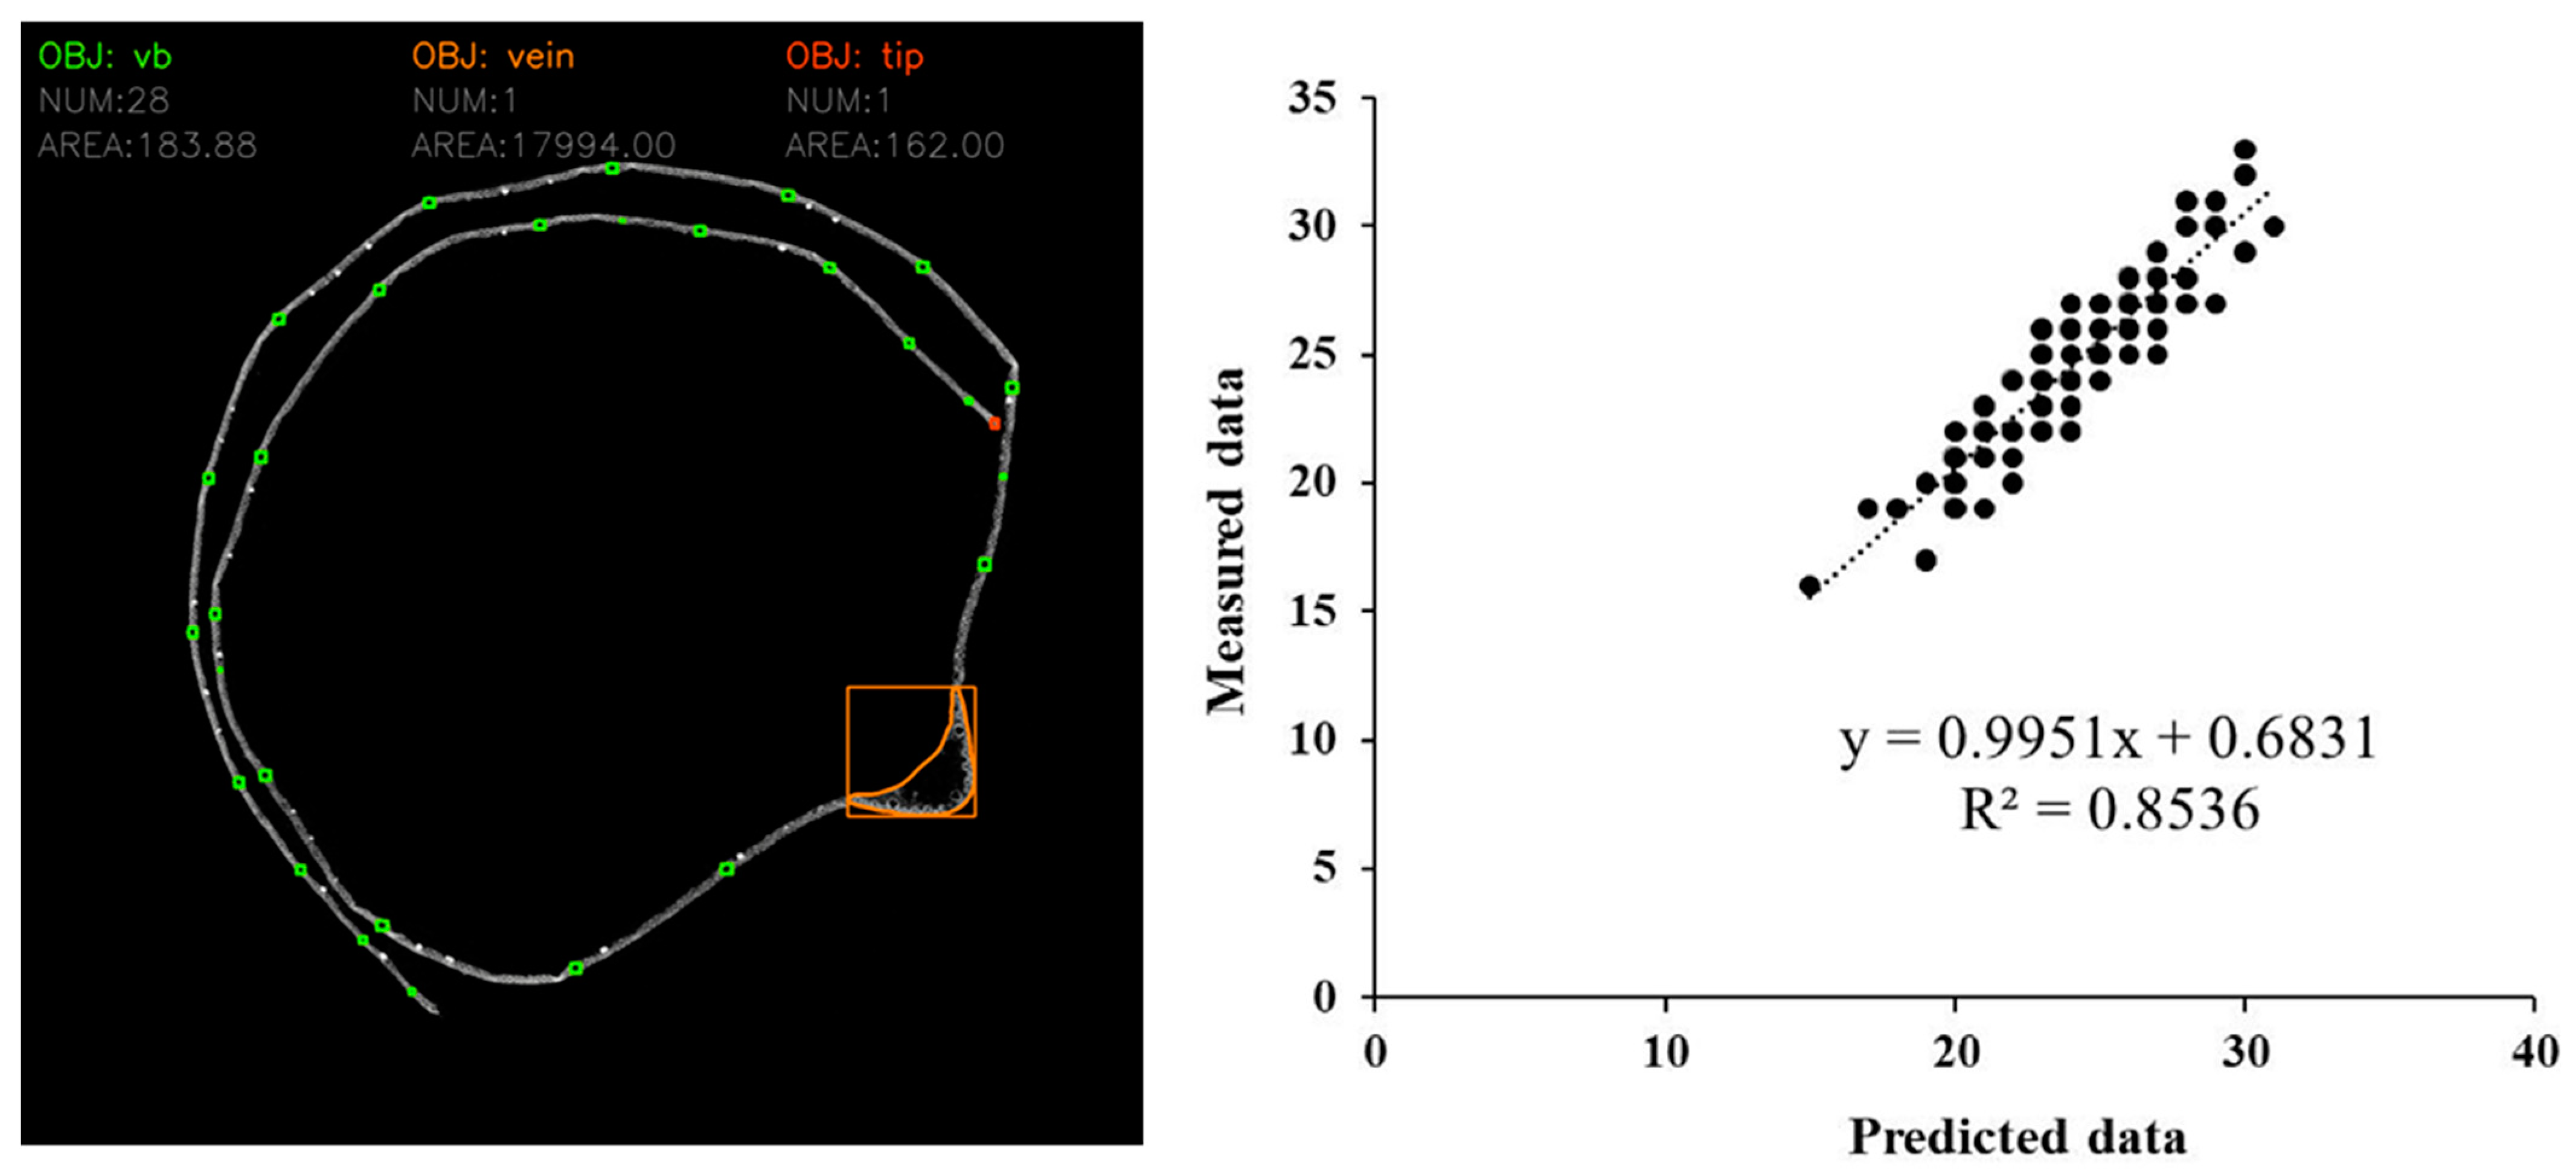
2.3. Accurate Analysis of Leaf Veins’ Microscopic Phenotypes

The cross-sectional CT image of maize leaf contains the main vein and secondary vascular bundles, and the main vein also contains some vascular bundles. To quantify the main vein and vascular bundles, labeling software was first used to build the annotation data set including vascular bundles, blade tip, and main vein, and then a segmentation model based on the DeeplabV3 network was trained to segment these three semantic objects. The Deeplab family of networks was developed by the Google team to deal with semantic segmentation models. When Deeplabv2 started, an ASPP (Atrous Spatial Pyramid Pooling) structure was used to enhance the feature extraction capability of the model, namely, the hollow convolution operation with different sampling rates was used for parallel sampling of input feature maps. Later, Deeplabv3 (Chen et al., 2017, 2018) further improved ASPP by using hollow convolution to deepen the network, reducing the number of parameters, and supplementing the global feature by adding image pooling. The model uses ResNet50 as the feature extraction network, Cross Entropy Loss as the loss function, random gradient descent (SGD) as the optimizer, and mean intersection over Union (mIoU) as the evaluation index. The model was trained in Windows 10, and the main configuration was GeForce GTX 1080 Ti, PyTorch: 1.6.0, CUDA Runtime: 10.1, CuDNN: 7.6.4. After 20,000 iterations, the segmentation accuracy was 0.99865, and the loss rate was 0.00481.

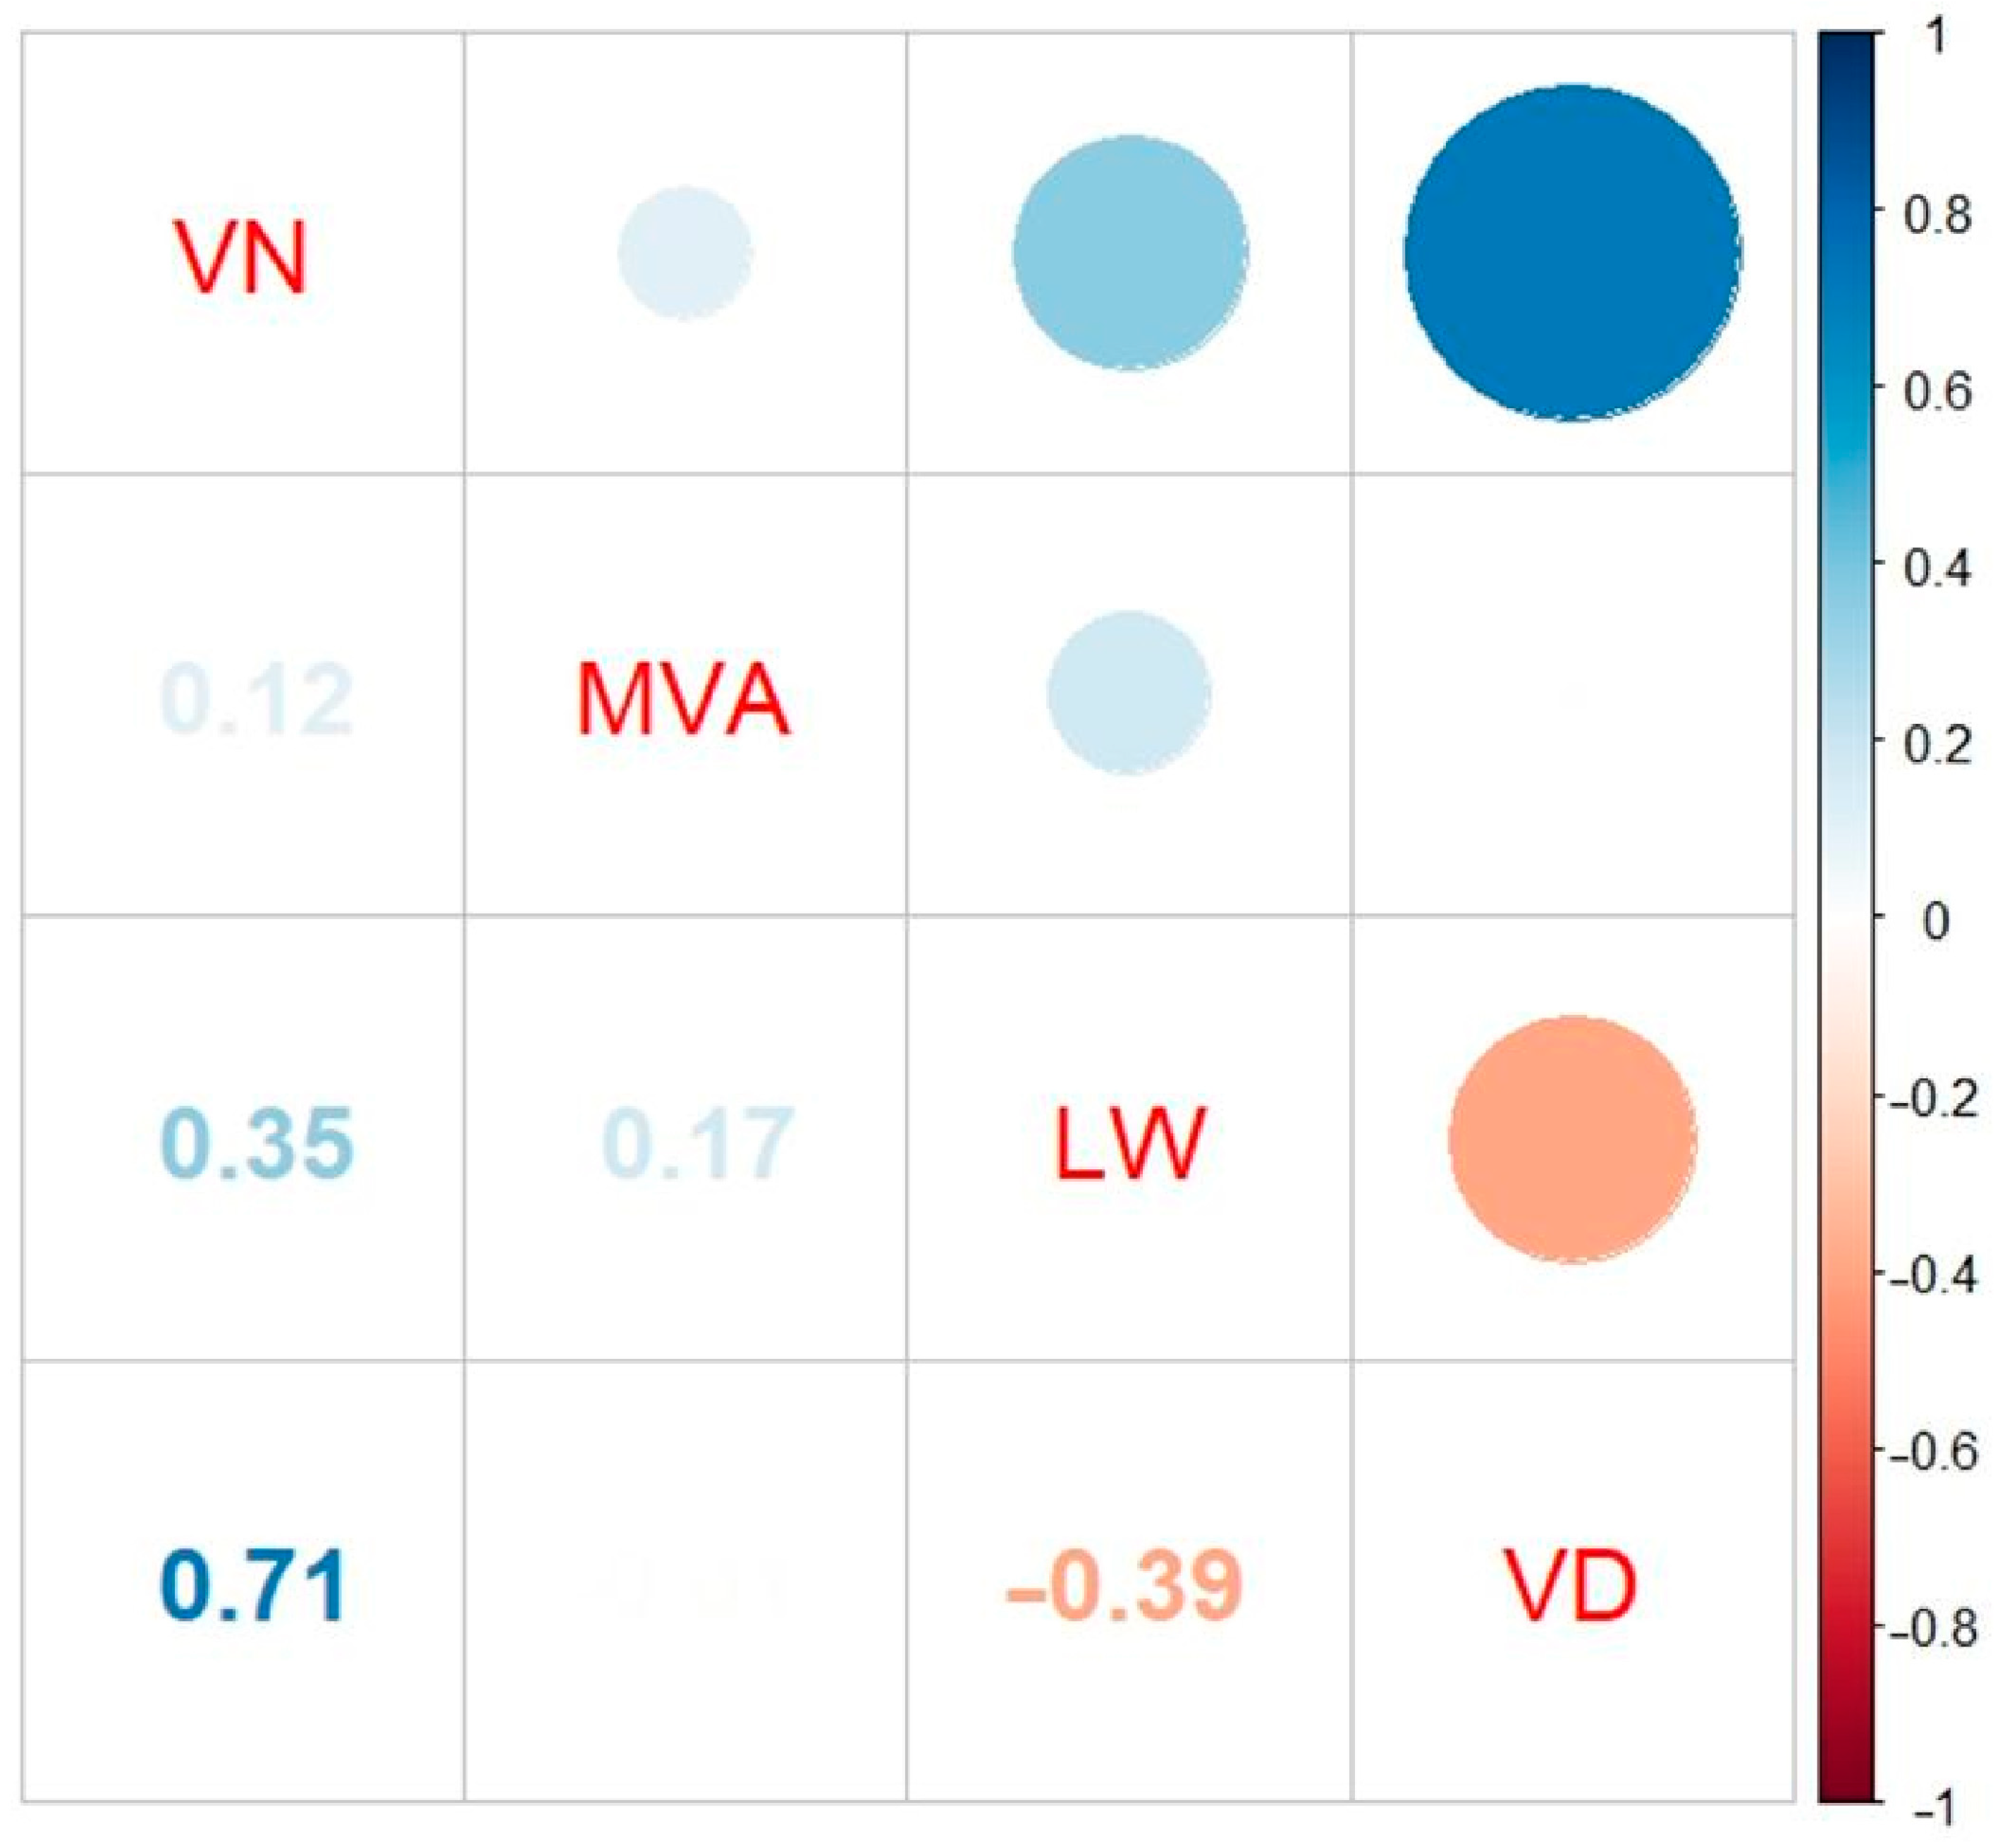
2.4. Phenotypic Data Analysis

The phenotypic data were organized and analyzed using Microsoft Excel 2013. The maximum, minimum, mean, and standard deviation of phenotypic data from the four subgroups were calculated, ANOVA and Duncan’s test were used to test the significance of phenotypic differences between subgroups of the maize inbred lines at the p < 0.05 level for ear leaf veins, and plots were made using R software.

2.5. Genome-Wide Association Studies

Briefly, genotype data of the 300 inbred lines were obtained from Professor Yan Jianbing’s laboratory of Huazhong Agricultural University (download URL: www.maizego.org/Resources.html, accessed on 17 August 2021). A total of 791, 833 SNPs with a minimum allele frequency (MAF) greater than 0.05 and a call rate greater than 0.9 were used for GWAS analysis. GWAS was performed by GEMMA for 4 leaf vein traits, including vein number (VN), midvein area (MVA), leaf width (LW), and vein density (VD). The software PopLDdecay (version 3.41) was used to calculate the decay distance of linkage disequilibrium (LD) across the whole genome. As a consequence, the threshold of significantly associated SNPs for traits was set at p-value < xx. All candidate genes were annotated by ANNOVAR software according to the maize B73 reference genome (B73 RefGen_v4) available in EnsemblPlants (http://plants.ensembl.org/Zea_mays/Info/Index, accessed on 10 October 2022) and the NCBI gene database (https://www.ncbi.nlm.nih.gov/gene, accessed on 10 October 2022). After the candidate genes were annotated, the pathway enrichment analysis and haplotype analysis were performed on the candidate genes.
In the subsequent candidate gene function analysis, data mining of qTeller (https://qteller.maizegdb.org/, accessed on 20 November 2022) expression profiles in MaizeGDB was applied. qTeller is a comparative RNA-seq expression platform for comparing expression across multiple data sources in a user-provided gene list or genomic interval, or to compare expression between two genes visually. qTeller has been used extensively in maize and other research.

3. Results

3.1. Phenotypic Analysis of Ear Leaf Veins

The micro-CT image acquisition system achieved quick and high-quality scanning of complete cross sections of maize ear leaves with a resolution of up to 13.55 µm (Figure 1). In maize, the leaf veins showed a parallel pattern, and the vascular bundles were densely arranged, with the midvein as the axis, showing a roughly symmetrical distribution. The leaf veins showed a trend of gradual reduction from the midvein to the edge of the blade (Figure 1A), a structure which may reduce the weight bearing of the whole blade and the pressure of the midvein support. On the other hand, the leaf veins could maintain the blade configuration, making the leaf extend to capture more light energy, and ensuring that the leaf was optimally adapted to the environment [34]. The CT images showed significant differences in the midvein size of the maize ear leaves (Figure 1B), which might have an important impact on leaf shape. The inner portion of the midvein is a thin-walled tissue with larger cells and lower density, while the outer epidermis consists of vascular bundles and a highly dense thick-walled tissue [6,7]. This structure ensured sufficient stiffness while ensuring sufficient elasticity to allow the leaf to bend, stretch, and twist under external forces.
In this study, an automatic phenotype analysis pipeline based on YOLOv5 and the U-Net network structure of maize leaf CT images was constructed to achieve high-throughput and accurate analysis of four phenotypic indicators, including the number of leaf veins, midvein area, leaf width, and leaf vein density, within the complete leaf cross section. Furthermore, 113 CT images were used to evaluate the computational performance. The number of leaf veins was measured manually by Image J software. The coefficient of determination (R2) was used to assess the consistency of the measured and predicted values. Figure 2 shows that the total number of leaf veins had an R2 of 0.85, which indicated that the trait measurements estimated by our algorithm were in good agreement with the manual measurements. In terms of detection efficiency, it took about 20 minutes to process 500 micro-CT images, and the average processing time for a single CT image was only about 2–3 s.
As shown in Table 1, phenotypic identification using micro-CT technology has obvious advantages over traditional methods in image acquisition efficiency and analytical accuracy. The conventional paraffin section preparation process is tedious and time-consuming, with high requirements for making sections. In contrast, micro-CT scanning technology simplifies the pre-production process and is easy to operate [35]. The traditional optical microscope can only obtain local phenotypic information; for example, the slide scanner Leica SCN400 (Leica, Germany) can obtain microscopic images with 0.5 µm ultra-high resolution, but the scanning range is limited to 0.5~20 µm. Micro-CT scanning can obtain complete cross-sectional microscopic images of leaves nondestructively, with a scanning range from 2.0 µm to 30 mm, and the maximum resolution can reach 2 µm/pixel. Moreover, traditional phenotypic traits analysis was a manual or semi-automatic image analysis, with criteria that varied from person to person and large errors. Based on deep learning algorithms, we realized an automatic analysis with a uniform standard and average analysis efficiency of about 2–3 s/CT image, which can analyze the complete cross section and local features of the leaf.

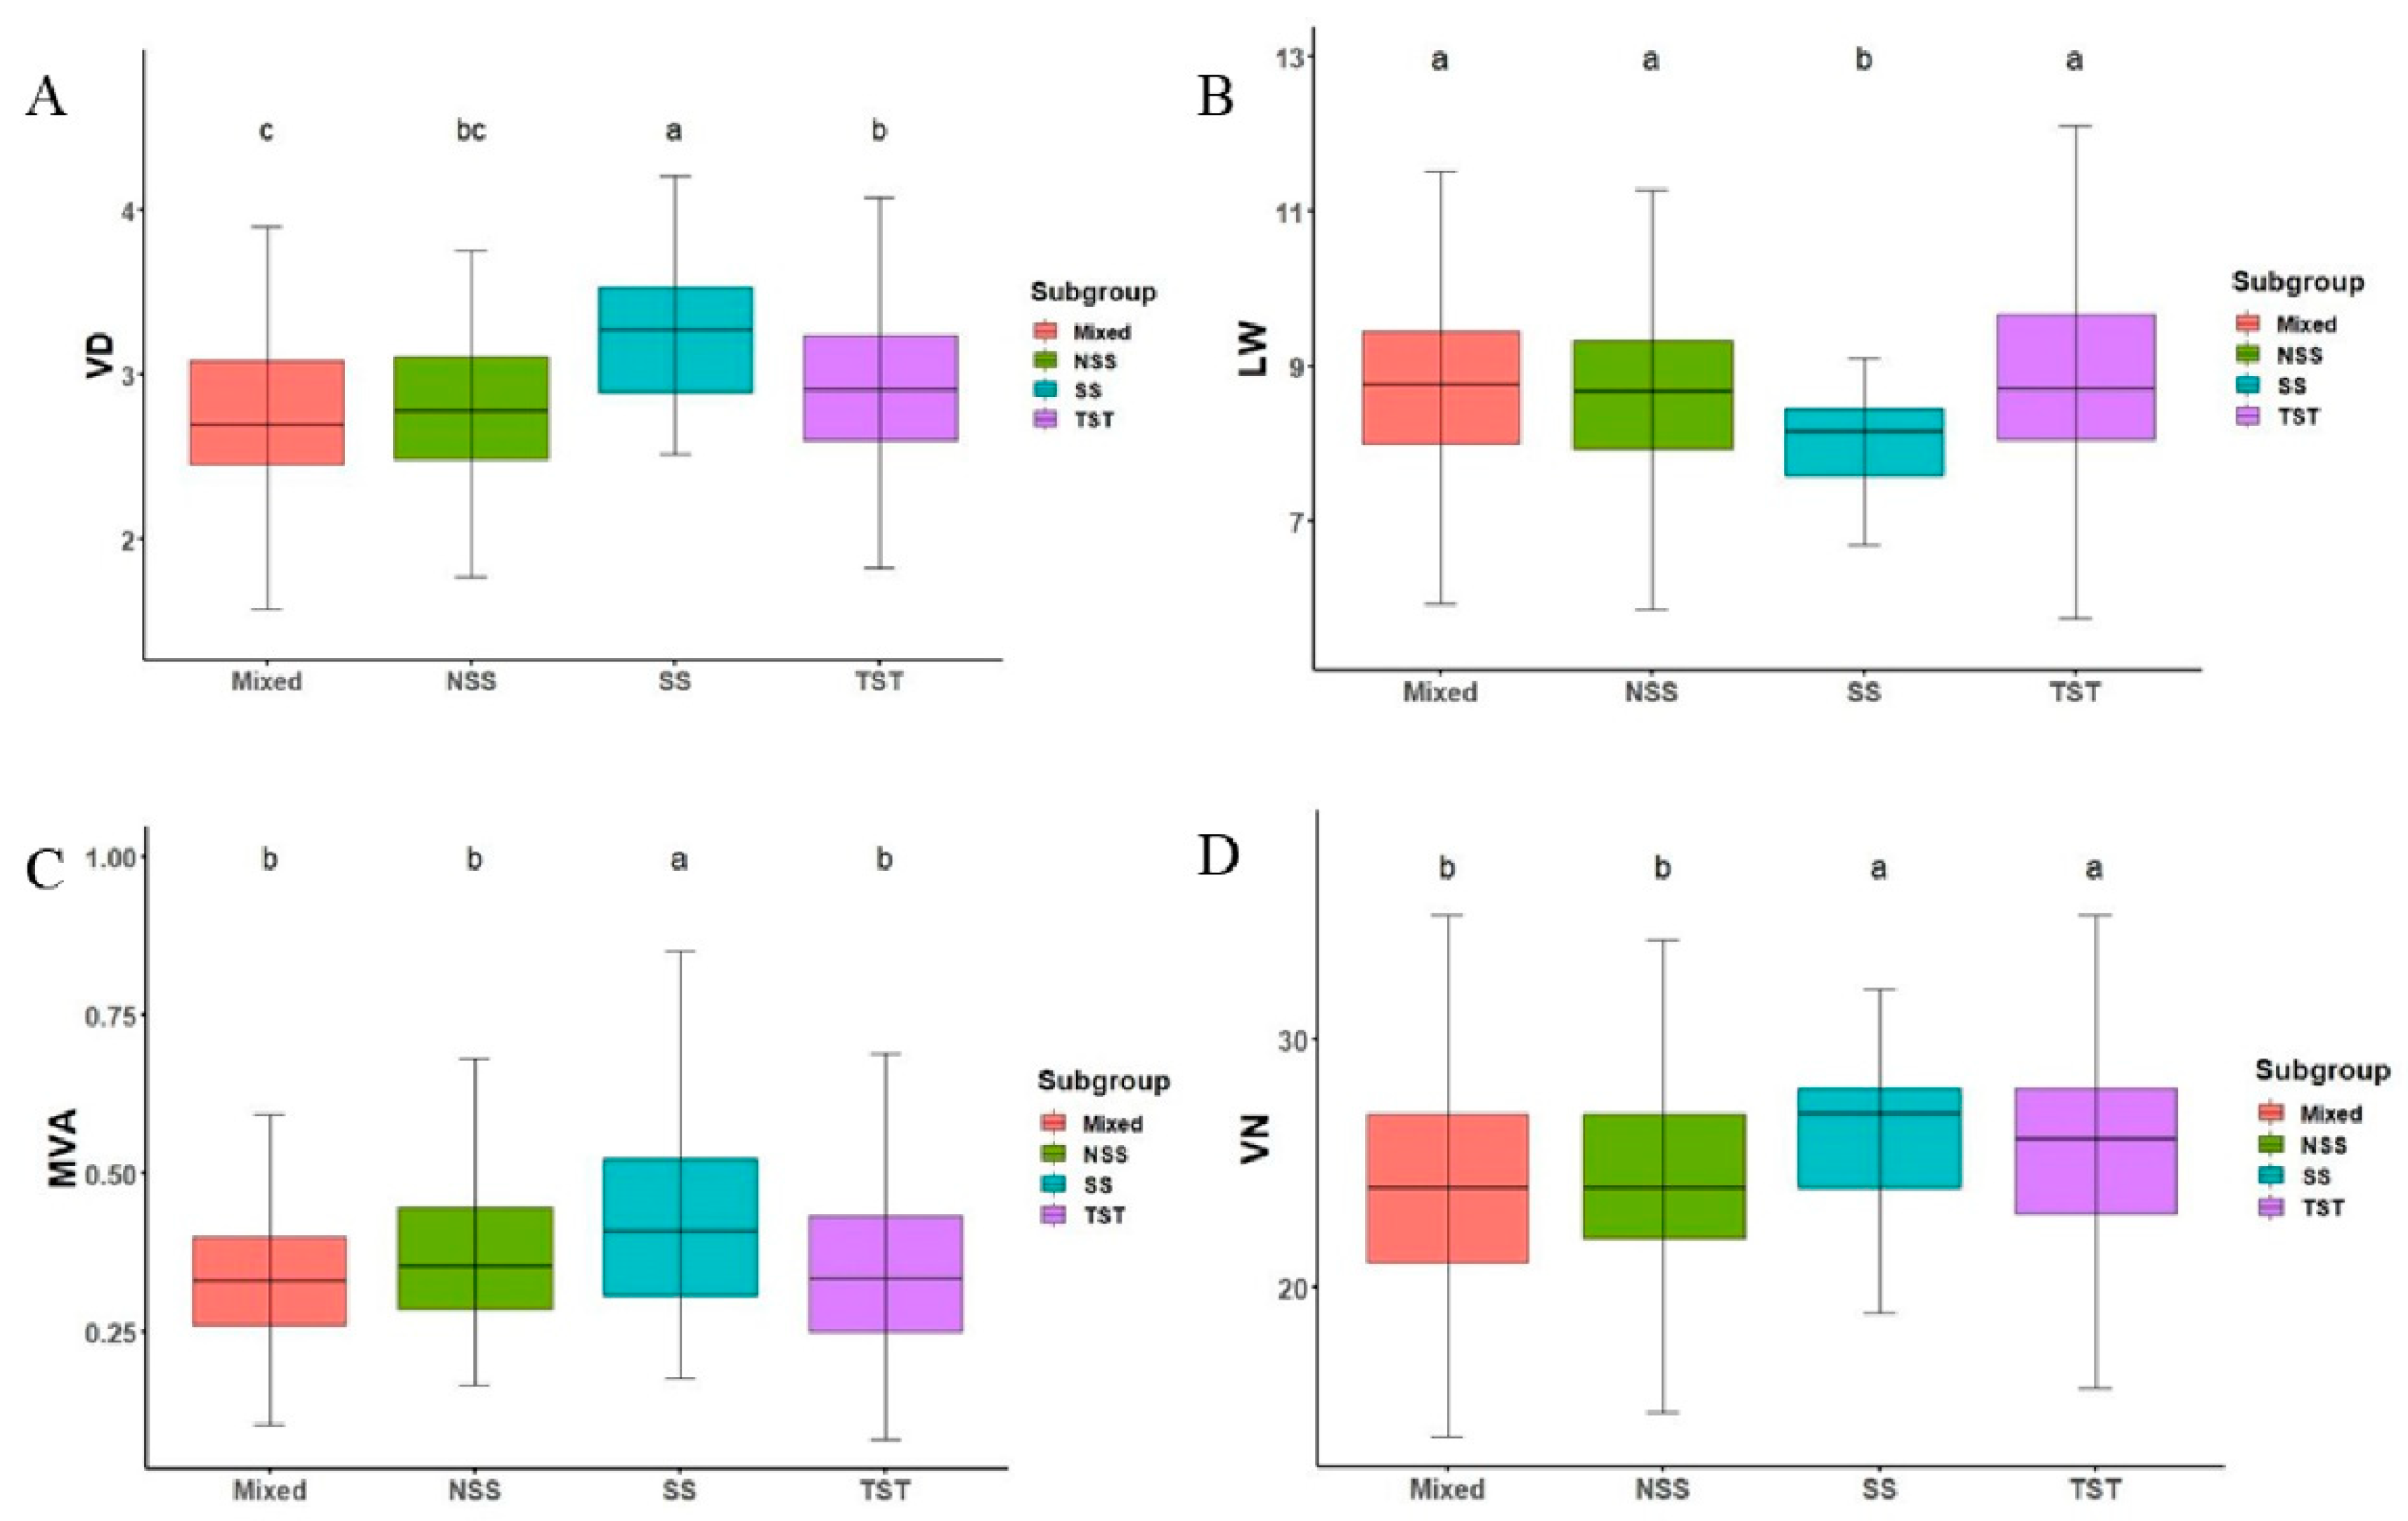
3.2. Phenotypic Variations in Maize Ear Leaf Veins among 300 Inbred Lines

Four phenotypic indicators related to the leaf veins were obtained in this study, as shown in Table 2, including the number of veins (VN), midvein area (MVA), leaf width (LW), and vein density (VD). The frequency distribution of the data for the four phenotypic traits in the natural population of maize showed a normal distribution law, indicating that the leaf veins’ phenotypic traits were typical quantitative traits controlled by multiple genes, with a large range of phenotypic variation. In the natural population of maize, there was a greater variation in the midvein area and leaf vein density. As shown in Table 2, the midvein area varied from 0.080 to 0.849 mm2 with an average of 0.376 mm2, with the largest variation range of 10.610-fold, followed by vein density with 3.356-fold, the number of veins with 2.714-fold, and the leaf width with the smallest variation range of 2.221-fold.
To explore the relationships among the phenotypic traits of the leaf veins, correlation analysis was carried out for the four phenotypic traits (Figure 3). The results showed that the leaf vein density was negatively correlated with the leaf width, with a correlation coefficient of −0.39, but the density of the leaf veins was positively correlated with the number of leaf veins, with a correlation coefficient of 0.71. The weak correlation between the midvein area and the remaining three traits indicated that the midvein development was mostly affected by various factors. There was a positive correlation between the leaf width and the number of veins, with a correlation coefficient of 0.35, indicating that the leaf width may affect the number of veins.
A single-factor analysis was performed on the phenotypic indicators of the leaf veins among the four subgroups of the natural maize population, and the results are shown in Table 3. The four phenotypic indicators showed significant differences (p ≤ 0.05) among the different subgroups. The data were visualized and plotted as shown in Figure 4. The leaf vein density was highest in the SS subgroup, followed by the TST subgroup, and lowest in the Mixed subgroup (Figure 4A). The leaf width of the SS subgroup was the smallest, and that of the TST subgroup was the largest (Figure 4B). The midvein area in the SS subgroup was the largest, and that in the Mixed subgroup was the smallest (Figure 4C). The number of veins in the SS subgroup was the highest, followed by the TST subgroup, and the number of veins in the Mixed subgroup was the lowest (Figure 4D).

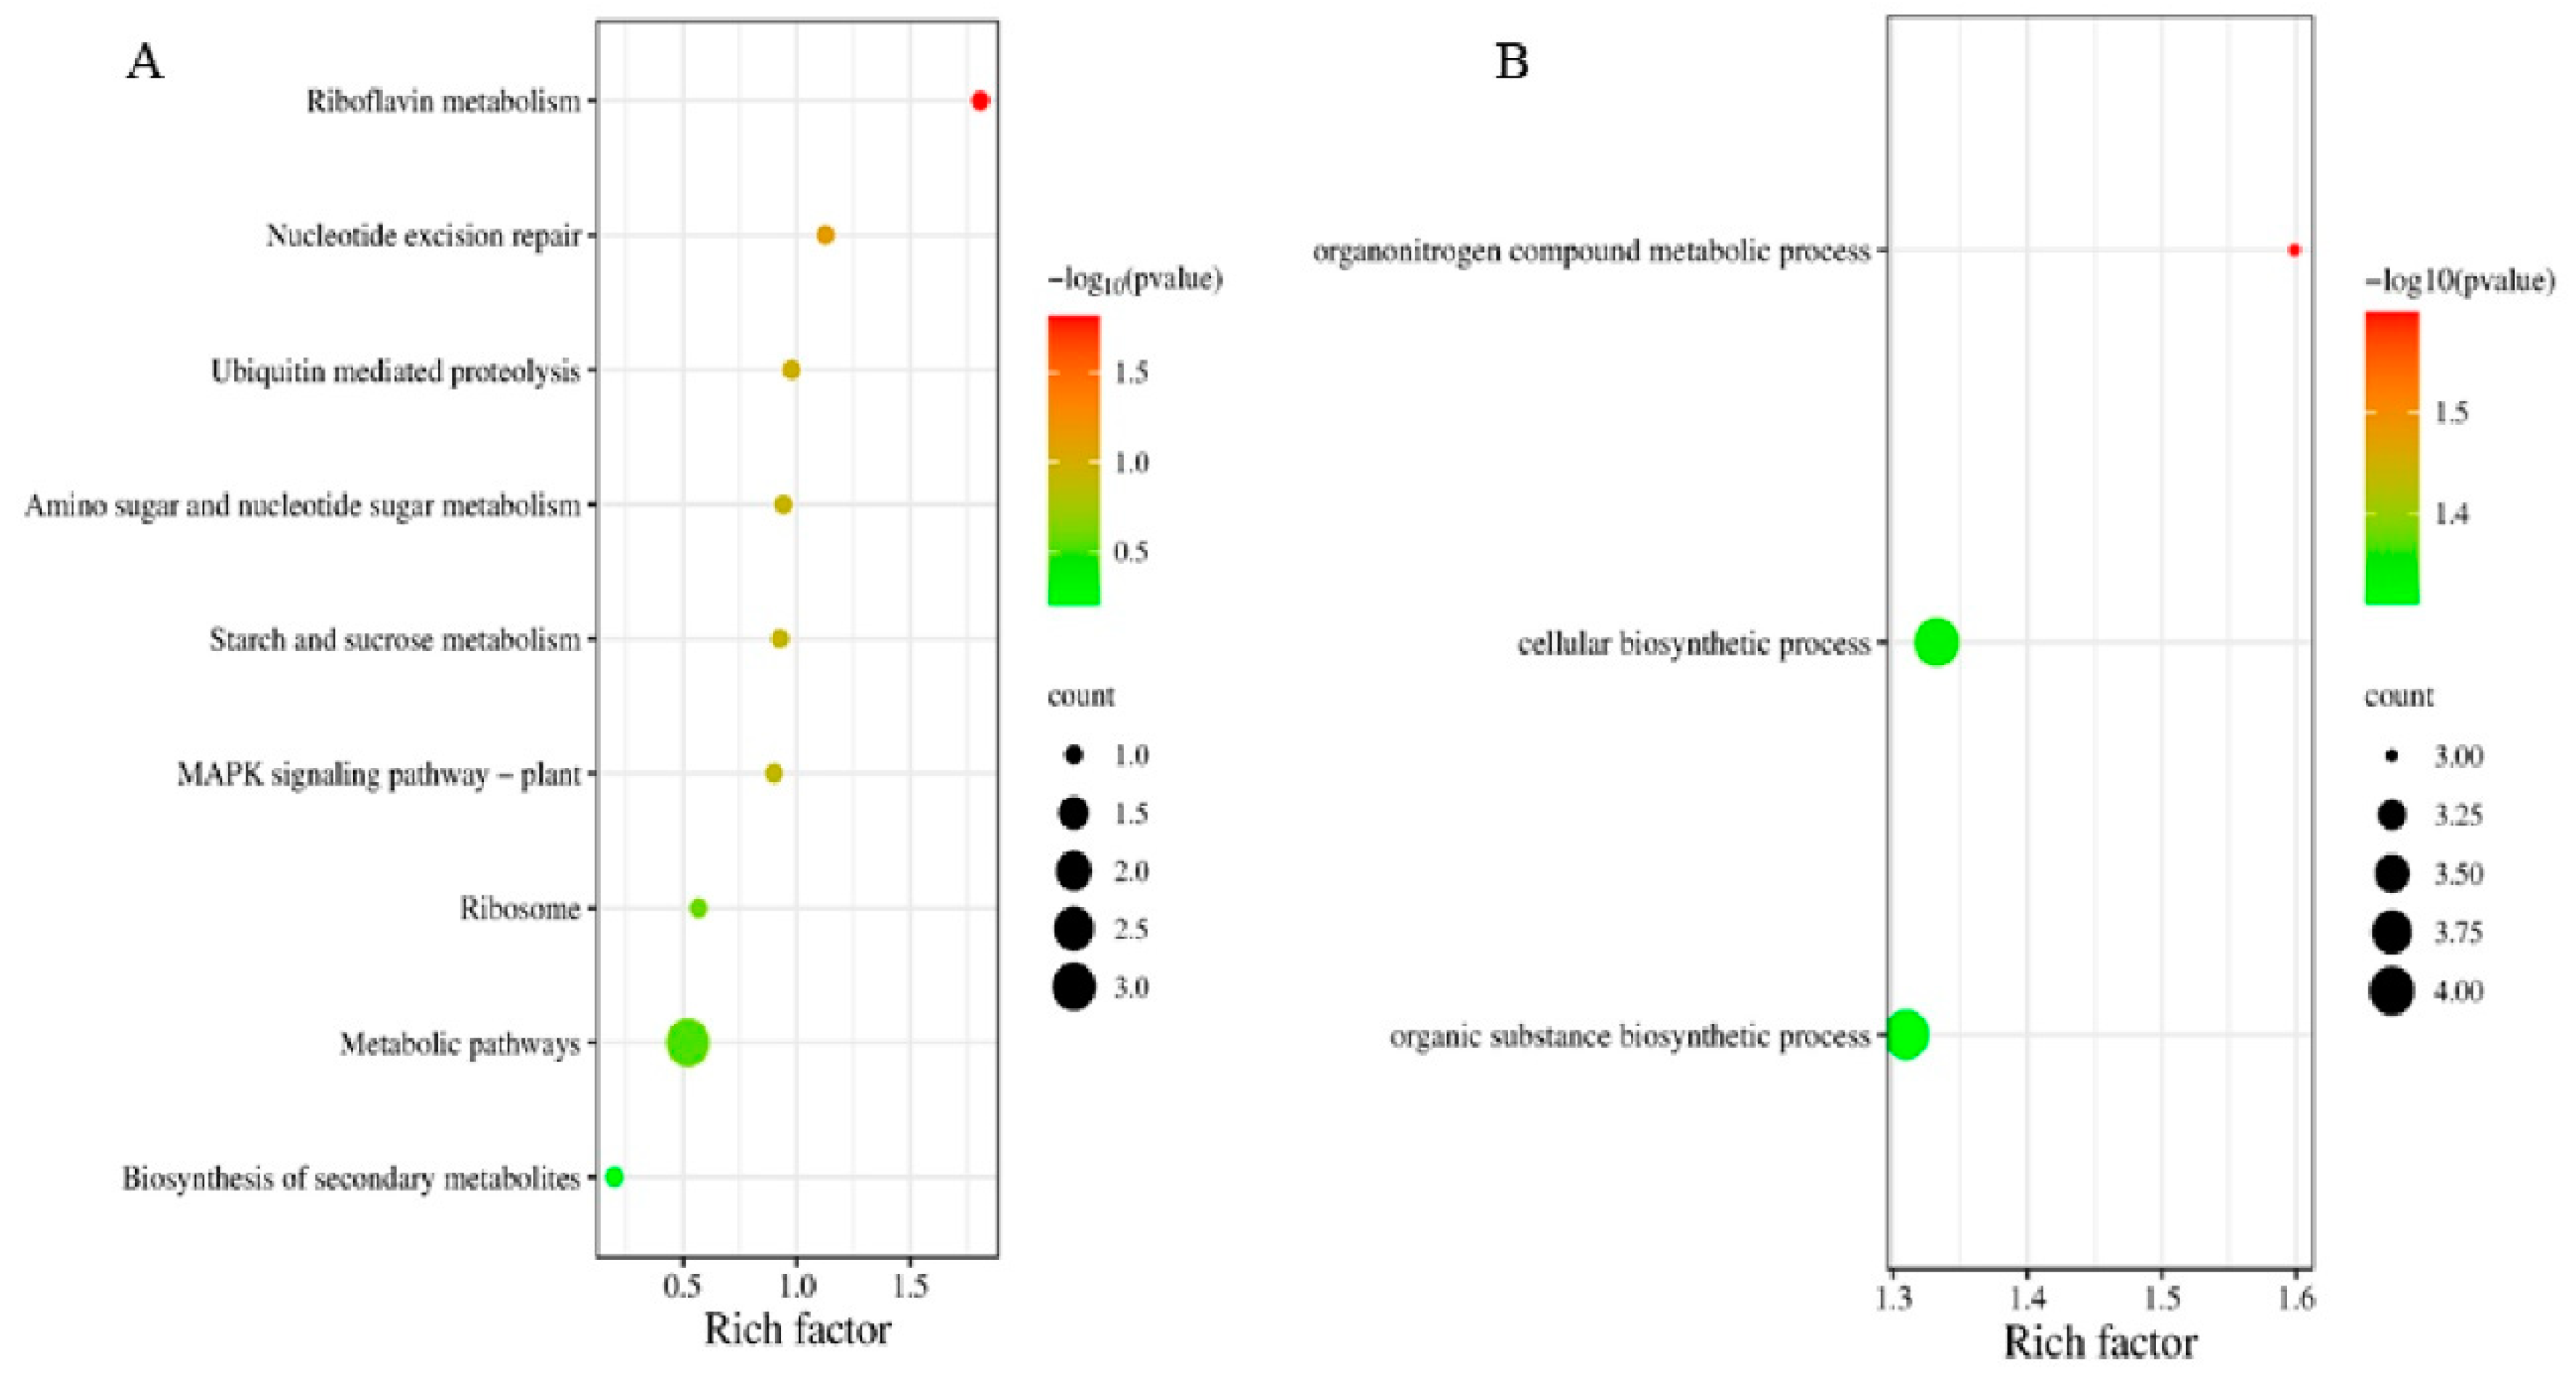
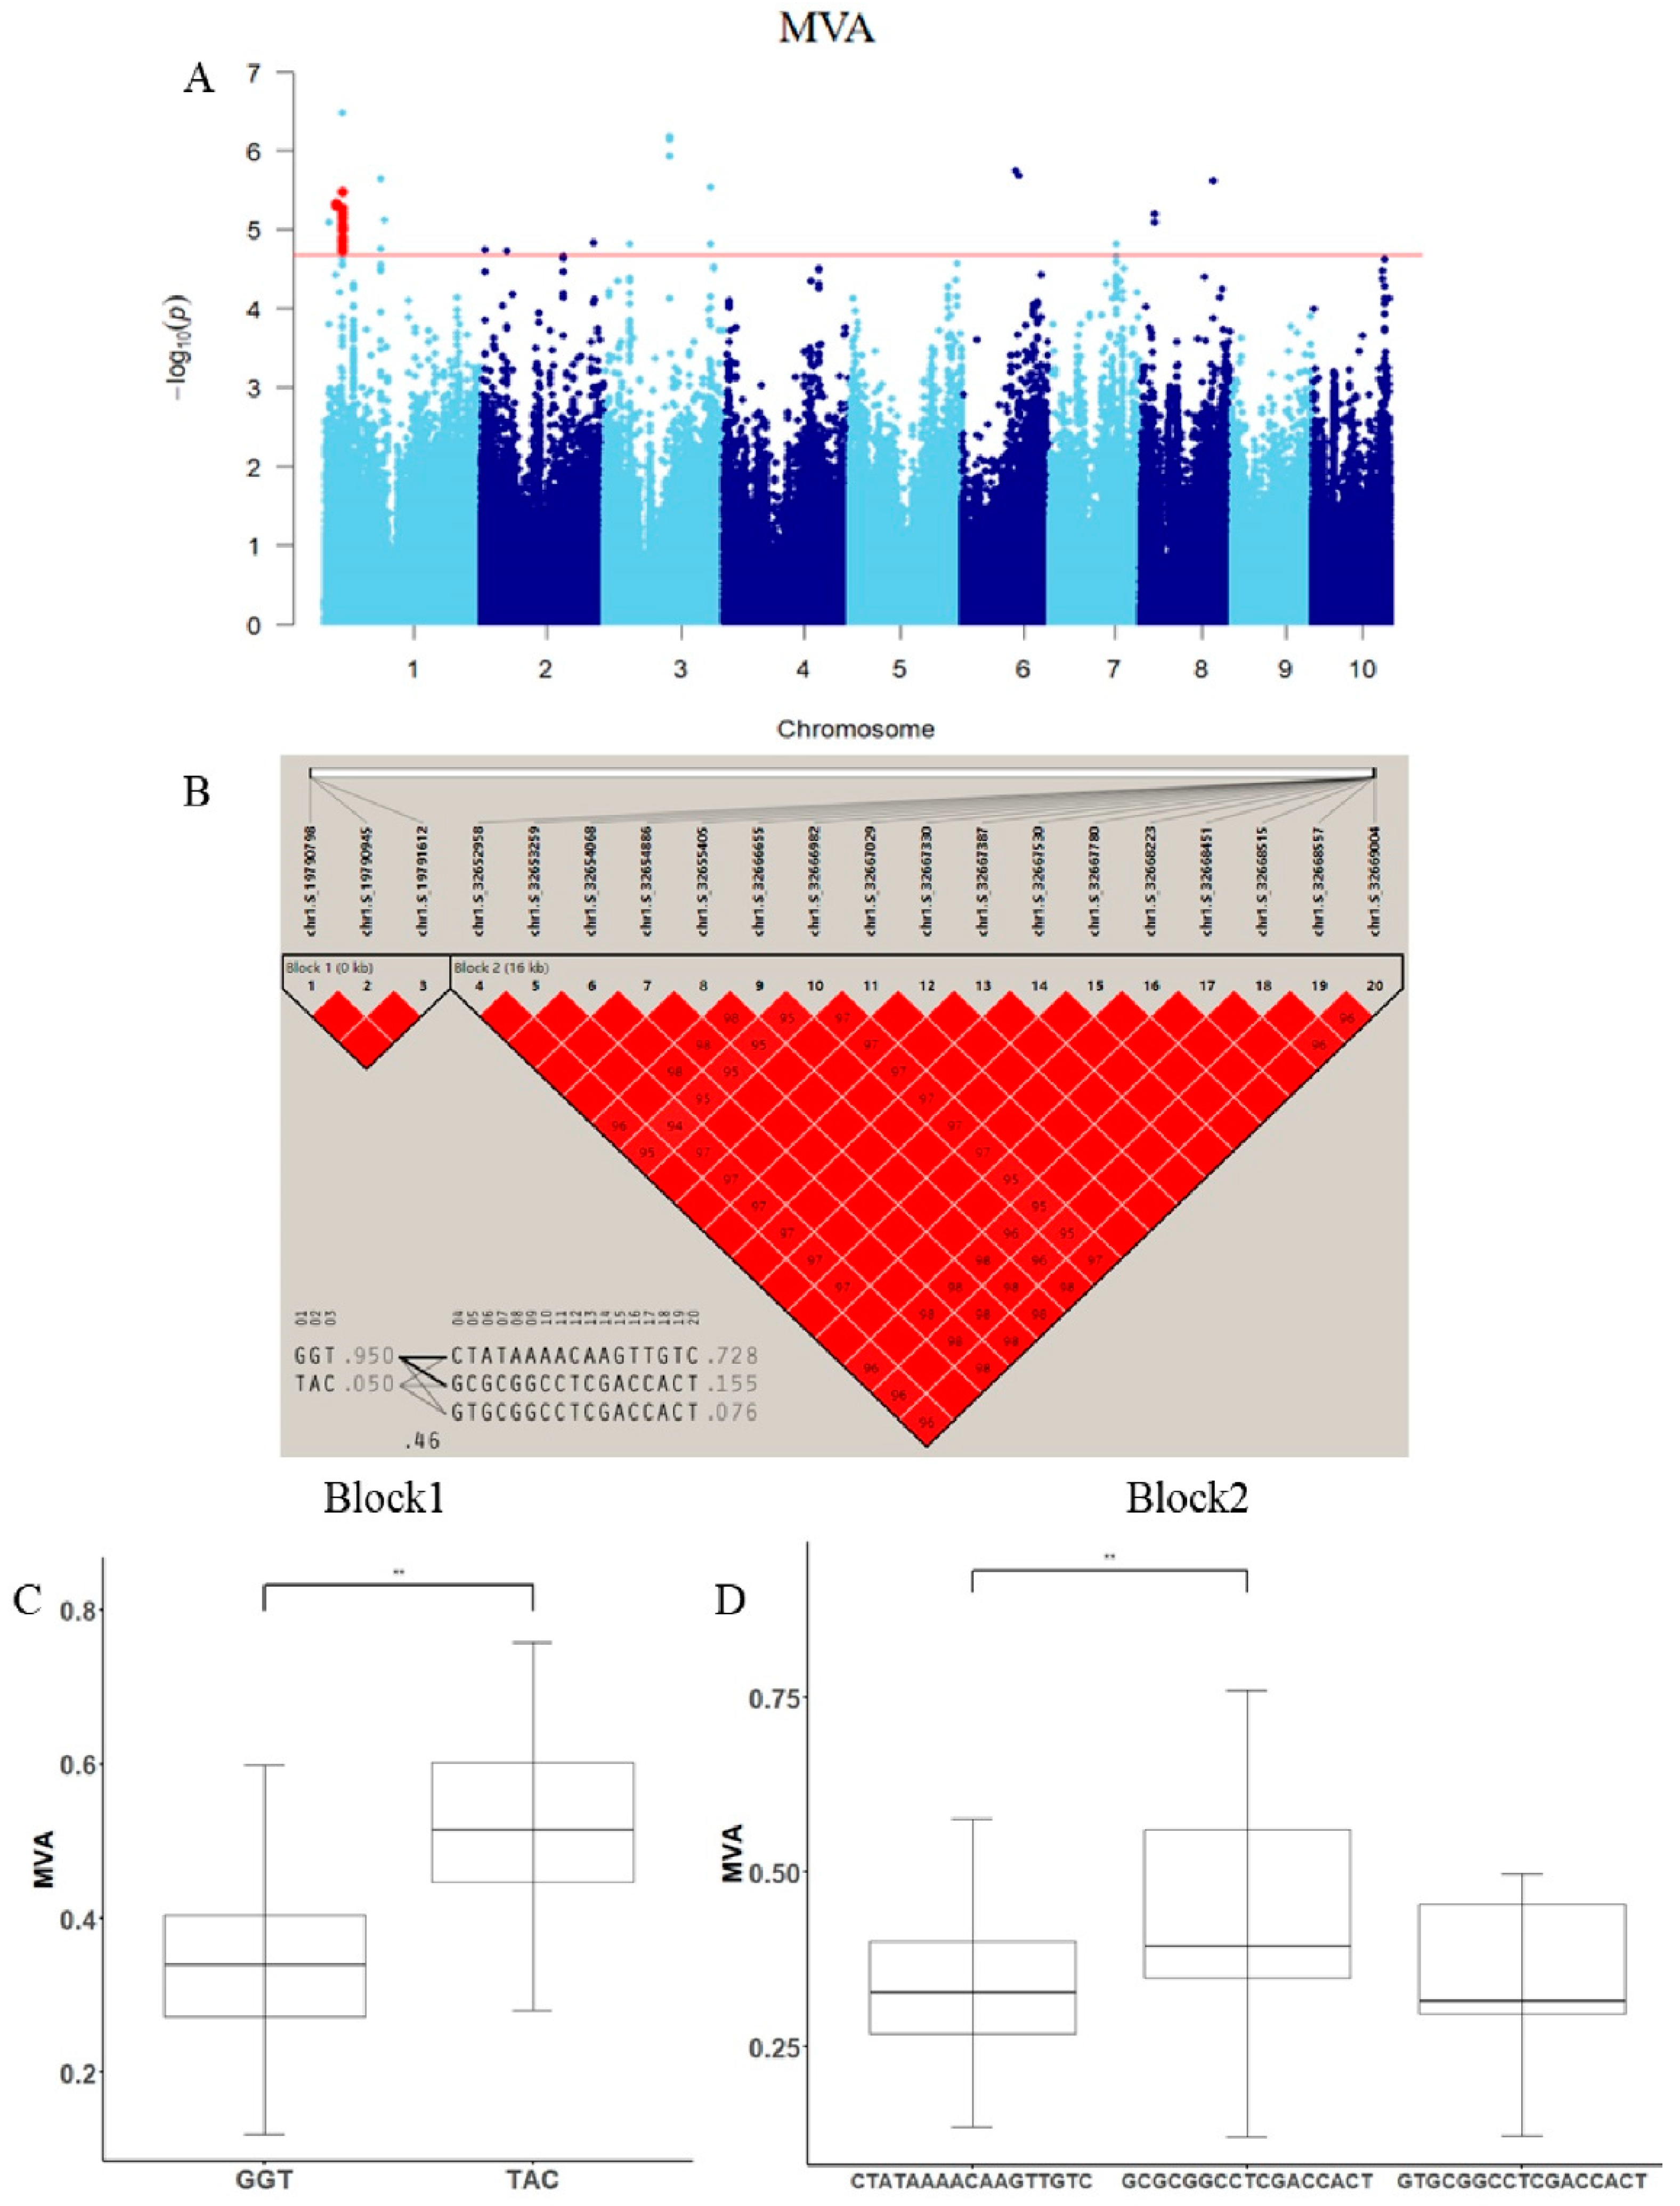
3.3. Genome-Wide Association Study of Leaf Veins’ Phenotypic Traits

In this study, the genome-wide association study based on GEMMA was used to analyze the four traits of the leaf veins’ phenotypic traits. A total of 61 SNPs were identified for the four traits, 114 genes were annotated according to the maize B73 reference genome (B73RefGen_v4), and 29 genes with functional annotation were obtained using the NCBI gene database (Table 4). The results revealed that the candidate genes regulating the number of veins trait were mainly concentrated on chromosomes 1 and 5; the candidate genes regulating the midvein area trait were mainly concentrated on chromosomes 1, 3, and 8; the candidate genes regulating the leaf width trait were mainly concentrated on chromosomes 4 and 10; and the candidate genes regulating the vein density trait were mainly concentrated on chromosomes 2, 7, and 9. These candidate genes mainly encode proteins involved in cell wall formation and cell division, nitrate transportation, growth hormone synthesis, electron transportation, lipid synthesis, and abiotic stress.
Pathway enrichment analysis was performed on 29 functionally annotated genes, and gene IDs were uploaded to KOBAS3.0 for KEGG pathway analysis (Figure 5A). The results showed that 29 functionally annotated genes were enriched to 1 KEGG pathway (p-value < 0.05): “riboflavin metabolism” (zma00740, p = 0.0155). In addition, the gene IDs were uploaded to PlantRegMap for GO enrichment analysis, and a total of three GO terms were enriched (p-value < 0.05), which mainly included the organonitrogen compound metabolic process, cellular biosynthetic process, and organic substance biosynthetic process, among which the organonitrogen compound metabolic process (GO:1901564, p = 0.0252) was the most significant (Figure 5B).
The FPKM values of 29 candidate genes extracted at different developmental stages of B73 maize leaves using the qTeller platform in MaizeGDB were plotted in a heat map (Figure 6). It was found that Zm00001d018081 showed high expression in different developmental stages of the leaves, especially the period from vegetative stage 9 to reproductive stage 2, and with the highest expression in the 13th leaf (Figure 7). The candidate gene Zm00001d018081, regulating the number of leaf veins and located on chromosome 5, encodes ethylene-responsive transcription factor RAP2-4, which belongs to the AP2/ERF family of transcription factors. The gene is involved in signal transduction pathways such as ethylene, abscisic acid, jasmonic acid, and salicylic acid to improve plant stress resistance. In addition, ERF transcription factors also play a role in regulating the growth and development of plant organs. For example, the AP2/ERF transcription factor gene BOLITA participated in regulating leaf size by regulating cell size and number in Arabidopsis thaliana [36]. In addition, the candidate gene Zm00001d018081 was also enriched in two GO terms of the cellular biosynthesis process and organic matter biosynthesis process (Figure 5B). Based on the above results, it was hypothesized that Zm00001d018081 might play an important role in leaf development by affecting leaf vein traits.
To further select key candidate genes associated with the leaf veins’ phenotypic traits, SNPs were analyzed by haplotype analysis in combination with the leaf veins’ phenotypic data. In the midvein area and leaf vein density, GWAS results showed multiple contiguous SNPs on chromosomes. Twenty significant contiguous SNPs on chromosome 1 were identified, and these SNPs were used as tagSNPs for further haplotype analysis, as shown in Figure 7A,B. The results showed that the twenty significant contiguous SNPs formed two block linkage regions and were independent of each other, with a probability of linking to each other of 0.46. Block1 consisted of three consecutive SNPs and had only two haplotypes, in which the frequency of haplotype GGT was 0.95 and the frequency of haplotype TAC was 0.05 (Figure 7B). The phenotypic data of the midvein area of the two haplotypes were analyzed, as shown in Figure 7C, and the results showed that haplotype GGT corresponded to a larger number of maize inbred lines with a smaller midvein area, while haplotype TAC corresponded to a smaller number of maize inbred lines with a larger midvein area. Block2 consisted of seventeen contiguous SNPs and had three haplotypes, haplotype CTATAAAACAAGTTGTC with a frequency of 0.728, haplotype GCGCGGCCTCGACCACT with a frequency of 0.155, and haplotype GTGCGGCCTCGACCACT with a frequency of 0.076 (Figure 7B), and the three haplotypes of the midvein area phenotypic data were analyzed as shown in Figure 7D. The results indicated that haplotypes CTATAAAACAAGTTGTC and GCGCGGCCTCGACCACT were significantly different in phenotype. The first haplotype corresponded to a larger number of maize inbred lines with a smaller midvein area, while the second haplotype corresponded to a smaller number of maize inbred lines with a larger midvein area. The candidate genes Zm00001d027997 and Zm00001d027998 were annotated within 100 kb outside the Block1 region, while Block2 was annotated within 40 kb outside the region with Zm00001d028378 and Zm00001d028379. Block1 and Block2 were located between the respective two candidate genes, and the results of the phenotypic difference analysis indicated that there might be potential candidate genes controlling the phenotypic trait of the midvein area among the four genes.
In particular, Zm00001d027998 was located on chromosome 1 and encoded a leucine-rich repeat extensin-like protein 3. Leucine-rich repeat extensins (LRXs) are a class of cell wall proteins that can affect cell wall function and have been found to be involved in cell wall signaling and transduction in response to salt stress in Arabidopsis thaliana mutants [37]. Moreover, a heatmap of 29 functionally annotated genes’ expression (Figure 6) showed that Zm00001d027998 had a high expression in immature leaves at the vegetative stage 9 of maize in terms of the developmental period. The cell wall could provide mechanical strength to the continuously developing leaves, and cell wall signal perception could respond to salt stress processes. Combining the results of haplotype analysis and gene expression analysis, it was tentatively verified that the protein encoded by Zm00001d027998 might be involved in the development process of maize leaves and affect the cell wall function.
Four significant contiguous SNPs on chromosome 7 for trait of vein density were identified, and these SNPs were used as tagSNPs for further haplotype analysis, as shown in Figure 8A,B. The results showed that the significant contiguous SNPs formed a block linkage region, and there were three haplotypes. The frequency of haplotype CGTC was 0.869, the frequency of haplotype GACG was 0.097, and the frequency of haplotype GGTC was 0.030 (Figure 8B). Combining the phenotypic data of the three haplotypes, as shown in Figure 8C, haplotypes CGTC and GACG differed significantly in phenotype, with haplotype CGTC being a larger number of maize inbred lines and corresponding to a lower density of leaf veins, while haplotype GACG being a smaller number of maize inbred lines and corresponding to a higher density of leaf veins. The block region within 135 kb was annotated with two candidate genes, Zm00001d020572 and Zm00001d020573, with the results indicating that these candidate genes may regulate the vein density phenotypic trait.

4. Discussion

4.1. Advanced Methods for Acquiring and Resolving Microscopic Images of Leaf Vein Phenotypes

In this study, the microscopic image acquisition by micro-CT technology showed significant advantages in terms of throughput, efficiency, and resolution. Freehand filming is convenient, with a low cost, but rough sample preparation and low image resolution [38]. Paraffin sectioning offers high image resolution and the acquisition of more indicators, but the sample preparation process is cumbersome and time-consuming [35]. Traditional optical microscopy is used to obtain phenotypic information for partial tissue structure. As mentioned above, the slide scanner Leica SCN400 can obtain microscopic images with 0.5 µm ultra-high resolution, but the scanning range is limited to 0.5~20 µm. By contrast, micro-CT can obtain complete cross-sectional microscopic images of leaves with a scanning range of 2.0 µm~30 mm and a maximum resolution of 2 µm/pixel [39]. The innovative construction of a material pre-processing system for micro-CT scanning can complete the processing of large quantities of materials in a relatively short time to ensure maximum morphological structure authenticity [40]. Traditional image detection methods mainly rely on manual or semi-automated software, with the resolution efficiency and accuracy differing from person to person. Based on a deep learning algorithm, it can automate the analysis with uniform standards, and the average analysis efficiency is about 2–3 s/CT image [41,42]. The nondestructive micro-CT technology, when combined with computer image analysis technology, enables high-throughput and intelligent analysis of leaf vein micro-phenotypes, making it an efficient and convenient method that is more suitable for large sample data acquisition.

4.2. Phenotypic Traits of Ear Leaf Veins

The CT image resolution obtained in this study could accurately identify the large vascular bundles in the leaf, which were also studied as leaf vein traits in subsequent analyses. From the cross-sectional microscopic images obtained by micro-CT (Figure 1A), the leaf veins showed a symmetrical distribution pattern and gradually became thinner from the middle to the edge of the leaf. The thinner veins both satisfy the transportation function and provide economical mechanical support, and the leaf edges are more easily curved, improving light capture ability [43]. From Figure 1B, the difference in the cross section of the midvein was obvious. Structurally, the interior of the midvein is a thin-walled tissue with larger cells and lower density, while the outer epidermis consists of vascular bundles and dense thick-walled tissue, which ensures sufficient stiffness and elasticity [44]. Functionally, the midvein plays a key role in leaf weight bearing, also carries out material transportation functions [45,46].
In this study, four phenotypic traits of leaf veins were obtained and analyzed, comparing populations and different subgroups. The midvein area and leaf vein density were found to have the largest range of variation. It has been shown that the development of leaf veins is co-regulated by multiple genes and that variation in plant leaves under different environments also affects leaf vein phenotypes [47,48]. Among the different subgroups, the four phenotypic traits of the leaf veins were further compared (Table 3, Figure 4). The results showed that the leaf vein density and midvein area of the SS subgroup were significantly higher than those of the other three subgroups. Surprisingly, the SS subgroup had the smallest leaf width but more veins, and the TST subgroup had the largest leaf width, but the number of veins was not significantly different from that of the SS subgroup. Three hypotheses are proposed for the differences in leaf veins between the SS and TST subgroups: (i) It may be related to material transportation. Vascular bundles of different sizes exist in maize leaves and are distributed parallel to each other, with different distributions of large vascular bundles and small vascular bundles among them, all of which belong to the maize leaf vein order network [49,50]. Evert found that the apoplast between the xylem and mesophyll in the vascular bundle of maize leaves was not completely interrupted by a suberin lamella, and the cell wall was the main pathway for transpiration water to the evaporating surfaces of mesophyll cells [51]. Organic matter is mainly transported from “source” to “sink” through the phloem. Previous studies have determined the possible pathway of sucrose in maize leaves from bundle sheath cells to sieve tubes. Evert studied the connection distribution between different cell types of vascular bundles and the osmotic potential value of those cell types, and it appears that sucrose in maize leaves is actively accumulated from the apoplast through the companion cell–sieve complex [52]. Heyser further supported the view of phloem loading via the apoplast by using the 14C labeling experiment [53]. Therefore, there is a close relationship between leaf veins and material transportation. (ii) It may be related to transportation efficiency. Vascular bundles, important structures that connect the ‘source’ to the ‘sink’, can improve the efficiency of transportation of photosynthetic products from the leaf to the cob [54]. A study investigated 36 phenotypic indicators of a shank and found that the number of total vascular bundles of the shank was higher in the SS subgroup than in the TST subgroup, and the density of the total vascular bundles of the shank was greater in the SS subgroup than in the TST subgroup [2], which was consistent with the results of leaf vein density in the SS and TST subgroups, and it was assumed that there was a coordinated relationship between leaf veins and vascular bundles of the shank in maize. (iii) Possible relevance to yield. Research on 17 agronomic traits in 513 maize inbred lines revealed that the 100-grain weight associated with yield traits differed between the SS and TST subgroups, with the largest 100-grain weight in the SS subgroup followed by the TST subgroup [55], which was consistent with the results of leaf vein density in the SS and TST subgroups.

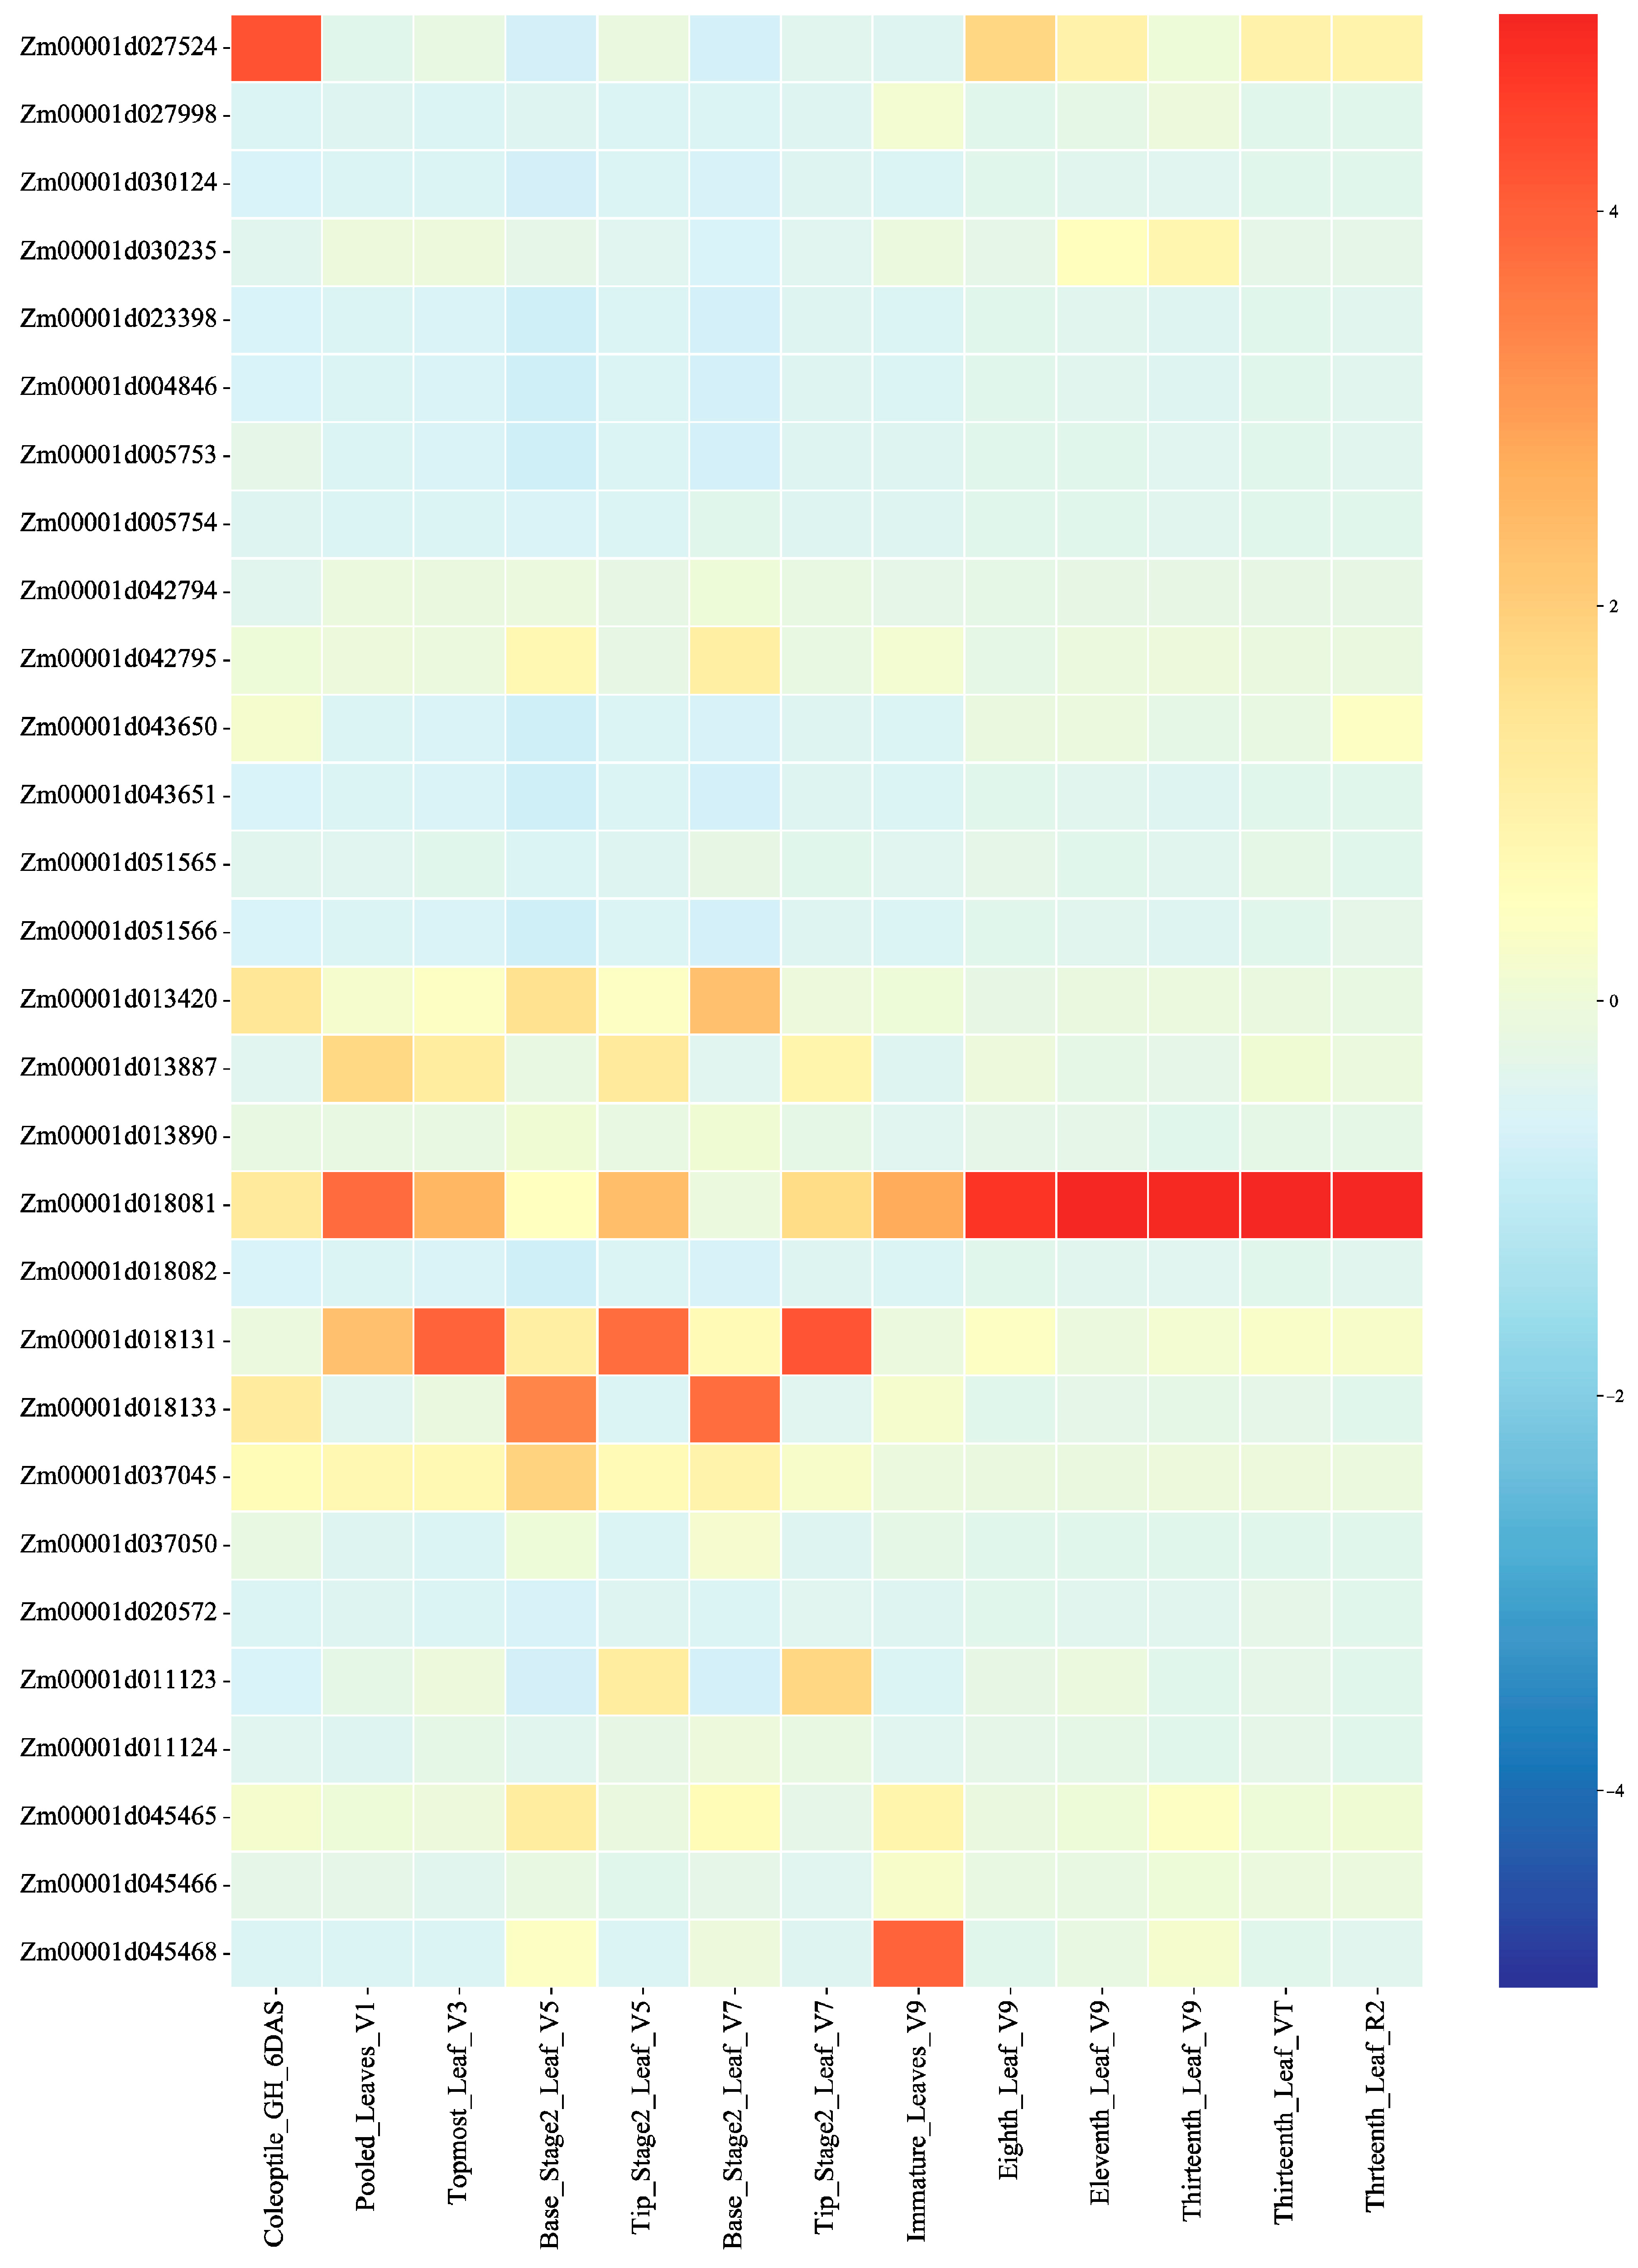
4.3. Analysis of Candidate Genes for Leaf Veins’ Phenotypic Traits

Among candidate genes for the leaf vein number, Zm00001d013420 encodes an ATP-binding protein and Zm00001d018082 encodes a probable trehalose-phosphate phosphatase 4, proteins that may be involved in stress response processes [56,57]. Among candidate genes for the midvein area, Zm00001d027998 encodes leucine-rich repeat extensin-like protein 3 involved in cell-wall-related functions [37], Zm00001d030235 belongs to the nitrate transporter (NRT) family involved in nitrate transportation [58], and Zm00001d043651 encodes tryptophan aminotransferase-related protein 4, which may be involved in auxin synthesis [59]. Zm00001d011124 encodes 4Fe-4S ferredoxin, which is involved in electron transfer [60]. Zm00001d011123 encodes zinc finger protein, which is involved in stress response [61]. Zm00001d027524 encodes a basic endochitinase that may be associated with embryonic axis growth [62]. Among candidate genes for the leaf width, Zm00001d051565 encodes replication factor C subunit 3, which plays an important role in DNA replication and repair as well as cell division [63], and Zm00001d023398 encodes probable glycosyltransferase3 involved in the regulation of abiotic stresses in plants [64]. Among candidate genes for the leaf vein density, Zm00001d045465 encodes a protein belonging to the lung seven transmembrane receptor family protein that plays a regulatory role in plant immune pathways [65], and Zm00001d045468 encodes an alpha/beta-hydrolases superfamily protein that may play a crucial role in lipid biosynthesis and metabolism [66].
The candidate gene Zm00001d018081, which regulates the leaf vein number trait, belongs to the AP2/ERF transcription factor family of genes in maize, which is one of the largest families of plant transcription factors [67]. In a study, 214 genes encoding ZmAP2/ERF proteins with complete AP2/ERF structural domains were identified by systematic analysis [68], of which Zm00001d018081 was classified as the DREB subfamily of the ERF family. Combined with the expression of Zm00001d018081 in different developmental stages of leaves, it suggested that this gene is involved in the regulation of plant growth and development. Based on the results of conserved motifs analysis, there are specific conserved motifs in Zm00001d018081, which may be involved in DNA methylation, transcriptional regulation, and ethylene response during plant development [69,70,71]. DREB subfamily proteins interacted with the cis-element DRE/C-repeat (DRE/CRT) of the A/GCCGAC core motif in the promoters of stress-inducible genes that interact and respond to plant hormones, such as ethylene and ABA [72]. In summary, Zm00001d018081 may affect the leaf phenotype, and mutations in this gene may lead to abnormal leaf development.
The candidate gene Zm00001d027998, which regulated the midvein area trait, encodes a leucine-rich repeat sequence extension-like protein 3. Leucine-rich repeat extension proteins (LRXs) are cell wall proteins consisting of an N-terminal leucine-rich repeat (LRR) structural domain and a C-terminal extension structural domain [73]. The LRR structural domain is capable of recognizing and binding ligands, and this domain is thought to interact with pathogen-induced molecules [74,75,76]. The highly glycosylated extended protein structural domain may be involved in the covalent cross-linking of cell wall components such as pectin; thus, LRX proteins are important for cell wall development [77]. In Arabidopsis thaliana, LRX1-LRX7 are mainly expressed in nutritional tissues, while LRX8-LRX11 are mainly expressed in pollen [78]. LRX1 and LRX2 are homologous genes expressed in root hairs. Studies showed that lrx1lrx2 double mutants had severe defects in the structure and growth of root hair cell walls, and the lrx3 lrx4 double mutant as well as the lrx3 lrx4 lrx5 triple mutant were defective in cell wall composition and exhibited retarded growth, suggesting a synergistic effect between LRX genes [74]. The identification of changes in lrx3, lrx4, and lrx5 mutants demonstrated that the LRX protein may be involved in cell wall development and that these LRX gene mutations result in an abnormal growth phenotype, implying that LRX proteins are essential for normal plant development.

5. Conclusions

In this study, microscopic phenotypic cross-sectional images of leaf veins at the silking stage of 300 maize inbred lines were acquired based on micro-CT with a resolution of 13.5 µm. Four phenotypic traits—the number of veins, midvein area, leaf width, and vein density—were automatically and accurately detected by a deep-learning-integrated phenotyping pipeline. The results of the analysis of the phenotypic traits showed that the leaf vein density and midvein area varied in a wide range, and the leaf width might affect the leaf vein density. The developmental characteristics and structural functions of the leaf veins were discussed based on the significant differences in the leaf vein traits among the four subgroups. Combined with GWAS, 61 significant SNPs and 29 candidate genes were identified, which were associated with cell wall function, nitrate transportation, growth hormone synthesis, electron transportation, cell division, lipid synthesis, abiotic stress, and other processes. The candidate gene Zm00001d018081, regulating the number of leaf veins and related to cellular biosynthesis and the organic matter biosynthesis pathway, was highly expressed in different developmental stages of the leaves. The candidate gene Zm00001d027998, regulating the midvein area, may be related to cell wall function, influencing the structural changes in leaf midvein. This study has achieved the nondestructive and efficient acquisition of complete microscopic images of phenotypic characteristics of maize ear leaf veins, improving the understanding of maize leaf veins’ phenotypic traits, discovering candidate genes related to maize leaf vein traits, and providing an important theoretical basis for promoting the breeding of new high-yielding and high-quality maize varieties.

Author Contributions

Y.Z. and M.Z. (Mingyi Zhu) drafted the manuscript, X.G., Y.Z. and S.G. revised the manuscript. X.L., M.Z. (Mingyi Zhu), Y.J. and M.Z. (Minggang Zhang) performed field experiments and obtained phenotypic data. Y.Z., J.D., M.Z. (Minggang Zhang) and J.W. analysed and interpreted the results, X.G. and S.G. performed project administration, X.G. and Y.Z. per-formed funding acquisition. All authors have read and agreed to the published version of the manuscript.

Funding

This study was supported by the Construction of Collaborative Innovation Center of Beijing Academy of Agriculture and Forestry Science (KJCX201917), Beijing Academy of Agriculture and Forestry Sciences Grants (QNJJ202124), the National Natural Science Foundation of China (U21A20205).

Institutional Review Board Statement

The study did not require ethical approval.

Informed Consent Statement

Not applicable.

Data Availability Statement

Genotypic data that support the findings of this research are open resource and can be downloaded from http://www.maizego.org/, accessed on 17 August 2021. All other data are available from corresponding author upon reasonable request.

Acknowledgments

We gratefully acknowledge the Maize Research Center, Beijing Academy of Agriculture and Forestry Sciences for preparing the seeds and materials. We also thank Yan’s lab from Huazhong Agricultural University and Yang’s lab from China Agricultural University for providing seeds of the maize inbred lines.

Conflicts of Interest

The authors have no conflict of interest to declare.

References

  1. Zhang, Y.; Wang, J.L.; Du, J.J.; Zhao, Y.X.; Lu, X.J.; Wen, W.; Gu, S.H.; Fan, J.; Wang, C.; Wu, S.; et al. Dissecting the phenotypic components and genetic architecture of maize stem vascular bundles using high-throughput phenotypic analysis. Plant Biotechnol. J. 2021, 19, 35–50. [Google Scholar] [CrossRef]
  2. Guo, S.; Zhou, G.; Wang, J.; Lu, X.; Zhao, H.; Zhang, M.; Guo, X.; Zhang, Y. High-Throughput Phenotyping Accelerates the Dissection of the Phenotypic Variation and Genetic Architecture of Shank Vascular Bundles in Maize (Zea mays L.). Plants 2022, 11, 1339. [Google Scholar] [CrossRef]
  3. Yang, H.W.; Chai, Q.; Yin, W.; Hu, F.L.; Qin, A.Z.; Fan, Z.L.; Yu, A.Z.; Zhao, C.; Fan, H. Yield photosynthesis and leaf anatomy of maize in inter- and mono-cropping systems at varying plant densities. Crop. J. 2022, 10, 893–903. [Google Scholar] [CrossRef]
  4. Zhang, Z.; Zheng, Y.; Ham, B.K.; Chen, J.; Lucas, W.J. Vascular-mediated signalling involved in early phosphate stress response in plants. Nat. Plants 2016, 2, 16033. [Google Scholar] [CrossRef]
  5. Moulia, B.; Fournier, M. Mechanics of the maize leaf: A composite beam model of the midrib. J. Mater. Sci. 1997, 32, 2771–2780. [Google Scholar] [CrossRef]
  6. Laguna, M.F.; Bohn, S.; Jagla, E.A. The role of elastic stresses on leaf venation morphogenesis. PLoS Comput. Biol. 2008, 4, e1000055. [Google Scholar] [CrossRef] [Green Version]
  7. Jonsson, K.; Hamant, O.; Bhalerao, R.P. Plant cell walls as mechanical signaling hubs for morphogenesis. Curr. Biol. 2022, 32, R334–R340. [Google Scholar] [CrossRef] [PubMed]
  8. Whittenberger, R.T.; Naghski, J. Separation and mounting of leaf vein skeletons and epidermis. Am. J. Bot. 1948, 35, 719–722. [Google Scholar] [CrossRef]
  9. Lundgren, M.R.; Osborne, C.P.; Christin, P.A. Deconstructing Kranz anatomy to understand C4 evolution. J. Exp. Bot. 2014, 65, 3357–3369. [Google Scholar] [CrossRef] [PubMed] [Green Version]
  10. Langdale, A.J. C4 cycles: Past, present, and future research on C4 photosynthesis. Plant Cell 2011, 23, 3879–3892. [Google Scholar] [CrossRef] [Green Version]
  11. Sage, R.F.; Roxana, K.; Sage, T.L. From proto-Kranz to C4 Kranz: Building the bridge to C4 photosynthesis. J. Exp. Bot. 2014, 65, 3341–3356. [Google Scholar] [CrossRef] [PubMed] [Green Version]
  12. Blonder, B.; Carlo, F.D.; Moore, J.; Rivers, M.; Enquist, B.J. X-ray imaging of leaf venation networks. New Phytol. 2012, 196, 1274–1282. [Google Scholar] [CrossRef]
  13. Kaminuma, E.; Yoshizumi, T.; Wada, T.; Matsui, M.; Toyoda, T. Quantitative analysis of heterogeneous spatial distribution of Arabidopsis leaf trichomes using micro X-ray computed tomography. Plant J. 2008, 56, 470–482. [Google Scholar] [CrossRef] [PubMed]
  14. Dhondt, S.; Vanhaeren, H.; Loo, D.V.; Cnudde, V.; Inzé, D. Plant structure visualization by high-resolution X-ray computed tomography. Trends Plant Sci. 2010, 15, 419–422. [Google Scholar] [CrossRef]
  15. Borsuk, A.M.; Roddy, A.B.; Théroux-Rancourt, G.; Brodersen, C.R. Structural organization of the spongy mesophyll. New Phytol. 2022, 234, 946–960. [Google Scholar] [CrossRef]
  16. Pajor, R.; Fleming, A.; Osborne, C.P.; Rolfe, S.A.; Sturrock, C.J.; Mooney, S.J. Seeing space: Visualization and quantification of plant leaf structure using X-ray micro-computed tomography. J. Exp. Bot. 2013, 64, 385–390. [Google Scholar] [CrossRef] [PubMed] [Green Version]
  17. Jankovsky, J.P.; Smith, L.G.; Nelson, T. Specification of bundle sheath cell fates during maize leaf development: Roles of lineage and positional information evaluated through analysis of the tangled1 mutant. Development 2001, 128, 2747–2753. [Google Scholar] [CrossRef] [PubMed]
  18. Michela, L.; Giuseppe, G.; Nicoletta, R.; Francesca, D.V.; Gabriella, C.; Silvana, D. A maize mutant with an altered vascular pattern. Ann. Bot. 2000, 85, 143–150. [Google Scholar] [CrossRef] [Green Version]
  19. Schneeberger, R.; Tsiantis, M.; Freeling, M.; Langdale, J.A. The rough sheath2 gene negatively regulates homeobox gene expression during maize leaf development. Development 1998, 125, 2857–2865. [Google Scholar] [CrossRef] [PubMed]
  20. Vollbrecht, E.; Veit, B.; Sinha, N.; Hake, S. The developmental gene Knotted-1 is a member of a maize homeobox gene family. Nature 1991, 350, 241–243. [Google Scholar] [CrossRef]
  21. Becraft, P.W.; Freeling, M. Genetic analysis of Rough sheath1 developmental mutants of maize. Genetics 1994, 136, 295–311. [Google Scholar] [CrossRef] [PubMed]
  22. Cho, S.H.; Yoo, S.C.; Zhang, H.; Pandeya, D.; Koh, H.J.; Hwang, J.Y.; Kim, G.T.; Paek, N.C. The rice narrow leaf2 and narrow leaf3 loci encode WUSCHEL-related homeobox 3A (OsWOX3A) and function in leaf, spikelet, tiller and lateral root development. New Phytol. 2013, 198, 1071–1084. [Google Scholar] [CrossRef] [PubMed]
  23. Zhang, X.; Douglas, R.N.; Strable, J.; Lee, M.; Buckner, B.; Janick-Buckner, D.; Schnable, P.S.; Scanlon, T.M. Punctate vascular expression1 is a novel maize gene required for leaf pattern formation that functions downstream of the trans-acting small interfering RNA pathway. Plant Physiol. 2012, 159, 1453–1462. [Google Scholar] [CrossRef] [PubMed] [Green Version]
  24. Slewinski, T.L.; Anderson, A.A.; Zhang, C.; Turgeon, R. Scarecrow plays a role in establishing Kranz anatomy in maize leaves. Plant Cell Physiol. 2012, 53, 2030–2037. [Google Scholar] [CrossRef] [Green Version]
  25. Slewinski, T.L.; Anderson, A.A.; Price, S.; Withee, J.R.; Gallagher, K.; Turgeon, R. Short-root1 plays a role in the development of vascular tissue and kranz anatomy in maize leaves. Mol. Plant 2014, 7, 1388–1392. [Google Scholar] [CrossRef] [PubMed] [Green Version]
  26. Dhondt, S.; Coppens, F.; Winter, F.D.; Swarup, K.; Merks, R.; Inze´, D.; Bennett, M.J.; Beemster, G. SHORT-ROOT and SCARECROW regulate leaf growth in Arabidopsis by stimulating S-phase progression of the cell cycle. Plant Physiol. 2010, 154, 1183–1195. [Google Scholar] [CrossRef] [PubMed] [Green Version]
  27. Cui, D.; Zhao, J.; Jing, Y.; Fan, M.; Liu, J.; Wang, Z.; Xin, W.; Hu, Y. The arabidopsis IDD14, IDD15, and IDD16 cooperatively regulate lateral organ morphogenesis and gravitropism by promoting auxin biosynthesis and transport. PLoS Genet. 2013, 9, e1003759. [Google Scholar] [CrossRef] [Green Version]
  28. Mir, R.R.; Reynolds, M.; Pinto, F.; Khan, M.A.; Bhat, M.A. High-throughput phenotyping for crop improvement in the genomics era. Plant Sci. 2019, 282, 60–72. [Google Scholar] [CrossRef]
  29. Xiao, Q.; Bai, X.; Zhang, C.; He, Y. Advanced high-throughput plant phenotyping techniques for genome-wide association studies: A review. J. Adv. Res. 2021, 35, 215–230. [Google Scholar] [CrossRef]
  30. Liu, L.L. Genome-Wide Association Analysis for Genetic Basis of Veins in Maize. Master’s Thesis, Shenyang Agricultural University, Shenyang, China, 2019. [Google Scholar]
  31. Tian, F.; Bradbury, P.J.; Brown, P.J.; Hung, H.; Sun, Q.; Flint-Garcia, S.; Rocheford, T.R.; McMullen, M.D.; Holland, J.B.; Buckler, E.S. Genome-wide association study of leaf architecture in the maize nested association mapping population. Nat. Genet. 2011, 43, 159–162. [Google Scholar] [CrossRef]
  32. Peng, B.; Zhao, X.; Wang, Y.; Li, C.; Wang, T. Genome-wide association studies of leaf angle in maize. Mol. Breed. 2021, 41, 1–18. [Google Scholar] [CrossRef]
  33. Yang, X.; Gao, S.; Xu, S.; Zhang, Z.; Prasanna, B.M.; Li, L.; Li, J.; Yan, J. Characterization of a global germplasm collectionand its potential utilization for analysis of complexquantitative traits in maize. Mol. Breed. 2011, 28, 511–526. [Google Scholar] [CrossRef]
  34. Sack, L.; Scoffoni, C.; McKown, A.D.; Frole, K.; Rawls, M.; Havran, J.C.; Tran, H.; Tran, T. Developmentally based scaling of leaf venation architecture explains global ecological patterns. Nat. Commun. 2012, 3, 837. [Google Scholar] [CrossRef] [PubMed] [Green Version]
  35. Zhang, Y.; Du, J.; Guo, X.; Yan, W.; Zhao, C. Three-dimensional visualization of vascular bundles in stem nodes of maize. Fresenius Environ. Bull. 2017, 26, 3395–3401. [Google Scholar]
  36. Marsch-Martinez, N.; Greco, R.; Becker, J.D.; Dixit, S.; Bergervoet, J.; Karaba, A.; Folter, S.; Pereira, A. BOLITA, an Arabidopsis AP2/ERF-like transcription factor that affects cell expansion and proliferation/differentiation pathways. Plant Mol. Biol. 2006, 62, 825–843. [Google Scholar] [CrossRef] [Green Version]
  37. Zhao, C.; Zayed, O.; Yu, Z.; Jiang, W.; Zhu, P.; Hsu, C.; Zhang, L.; Tao, W.A.; Lozano-Durán, R.; Zhu, J. Leucine-rich repeat extensin proteins regulate plant salt tolerance in Arabidopsis. Proc. Natl. Acad. Sci. USA 2018, 115, 13123–13128. [Google Scholar] [CrossRef] [PubMed] [Green Version]
  38. Tabassum, M.A.; Zhu, G.; Hafeez, A.; Wahid, M.A.; Shaban, M.; Li, Y. Influence of leaf vein density and thickness on hydraulic conductance and photosynthesis in rice (Oryza sativa L.) during water stress. Sci. Rep. 2016, 6, 36894. [Google Scholar] [CrossRef] [Green Version]
  39. Pierret, A.; Capowiez, Y.; Moran, C.J.; Kretzschmar, A. X-ray computed tomography to quantify tree rooting spatial distributions. Geoderma 1999, 90, 307–326. [Google Scholar] [CrossRef]
  40. Heeraman, D.A.; Hopmans, J.W.; Clausnitzer, V. Three dimensional imaging of plant roots in situ with X-ray Computed Tomography. Plant Soil 1997, 189, 167–179. [Google Scholar] [CrossRef]
  41. Du, J.; Zhang, Y.; Guo, X.; Ma, L.; Shao, M.; Pan, X.; Zhao, C. Micron-scale phenotyping quantification and three-dimensional microstructure reconstruction of vascular bundles within maize stalks based on micro-CT scanning. Funct. Plant Biol. 2016, 44, 10–22. [Google Scholar] [CrossRef]
  42. Huang, C.; Chen, Q.; Xu, G.; Xu, D.; Tian, J.; Tian, F. Identification and fine mapping of quantitative trait loci for the number of vascular bundle in maize stem. J. Integr. Plant Biol. 2016, 58, 81–90. [Google Scholar] [CrossRef] [PubMed] [Green Version]
  43. Sack, L.; Scoffoni, C. Leaf venation: Structure, function, development, evolution, ecology and applications in the past, present and future. New Phytol. 2013, 198, 983–1000. [Google Scholar] [CrossRef] [PubMed]
  44. Blonder, B.; Violle, C.; Bentley, L.P.; Enquist, B.J. Venation networks and the origin of the leaf economics spectrum. Ecol. Lett. 2011, 14, 91–100. [Google Scholar] [CrossRef] [PubMed]
  45. Vermerris, W.; Sherman, D.M.; Mcintyre, L.M. Phenotypic plasticity in cell walls of maize brown midrib mutants is limited by lignin composition. J. Exp. Bot. 2010, 61, 2479–2490. [Google Scholar] [CrossRef]
  46. Westgate, M.E.; Steudle, E. Water transport in the midrib tissue of maize leaves: Direct measurement of the propagation of changes in cell turgor across a plant tissue. Plant Physiol. 2019, 78, 183–191. [Google Scholar] [CrossRef] [Green Version]
  47. Huang, C.; Yu, C.; Wu, Y.; Lu, M.J.; Tu, S.; Wu, S.; Shiu, S.; Ku, M.; Li, W. Elevated auxin biosynthesis and transport underlie high vein density in C₄ leaves. Proc. Natl. Acad. Sci. USA 2017, 114, E6884–E6891. [Google Scholar] [CrossRef] [Green Version]
  48. Kumar, D.; Kellogg, E.A. Getting closer: Vein density in C4 leaves. New Phytol. 2019, 221, 1260–1267. [Google Scholar] [CrossRef] [Green Version]
  49. Nelson, T.; Dengler, N. Leaf Vascular Pattern Formation. Plant Cell 1997, 9, 1121–1135. [Google Scholar] [CrossRef] [Green Version]
  50. Linh, N.M.; Verna, C.; Scarpella, E. Coordination of cell polarity and the patterning of leaf vein networks. Curr. Opin. Plant Biol. 2018, 41, 116–124. [Google Scholar] [CrossRef]
  51. Evert, R.F.; Eschrich, W.; Heyser, W. Distribution and structure of the plasmodesmata in mesophyll and bundle-sheath cells of Zea mays L. Planta 1977, 136, 77–89. [Google Scholar] [CrossRef]
  52. Evert, R.F.; Eschrich, W.; Heyser, W. Leaf structure in relation to solute transport and phloem loading in Zea mays L. Planta 1978, 138, 279–294. [Google Scholar] [CrossRef]
  53. Heyser, W.; Evert, R.F.; Eschrich, F.W. Sucrose in the free space of translocating maize leaf bundles. Plant Physiol. 1978, 62, 491–494. [Google Scholar] [CrossRef] [PubMed] [Green Version]
  54. Sun, G.; Zhang, X.; Duan, H.; Gao, J.; Li, N.; Su, P.; Xie, H.; Li, W.; Fu, Z.; Huang, Y.; et al. Dissection of the genetic architecture of peduncle vascular bundle-related traits in maize by a genome-wide association study. Plant Biotechnol. J. 2022, 20, 1042–1053. [Google Scholar] [CrossRef] [PubMed]
  55. Yang, N.; Lu, Y.; Yang, X.; Huang, J.; Zhou, Y.; Ali, F.; Wen, W.; Liu, J.; Li, J.; Yan, J. Genome wide association studies using a new nonparametric model reveal the genetic architecture of 17 agronomic traits in an enlarged maize association panel. PLoS Genet. 2014, 10, e1004573. [Google Scholar] [CrossRef] [Green Version]
  56. Macovei, A.; Vaid, N.; Tula, S.; Tuteja, N. A new DEAD-box helicase ATP-binding protein (OsABP) from rice is responsive to abiotic stress. Plant Signal. Behav. 2012, 7, 1138–1143. [Google Scholar] [CrossRef] [PubMed] [Green Version]
  57. Wang, G.; Li, X.; Ye, N.; Huang, M.; Feng, L.; Li, H.; Zhang, J. OsTPP1 regulates seed germination through the crosstalk with abscisic acid in rice. New Phytol. 2021, 230, 1925–1939. [Google Scholar] [CrossRef]
  58. Kanno, Y.; Kamiya, Y.; Seo, M. Nitrate does not compete with abscisic acid as a substrate of AtNPF4.6/NRT1.2/AIT1 in Arabidopsis. Plant Signal. Behav. 2013, 8, e26624. [Google Scholar] [CrossRef] [Green Version]
  59. Shao, A.; Ma, W.; Zhao, X.; Hu, M.; He, X. The auxin biosynthetic tryptophan aminotransferase related tatar2.1-3a increases grain yield of wheat. Plant Physiol. 2017, 174, 2274–2288. [Google Scholar] [CrossRef] [Green Version]
  60. Liang, X.; Qin, L.; Liu, P.; Wang, M.; Ye, H. Genes for iron-sulphur cluster assembly are targets of abiotic stress in rice, Oryza sativa. Plant Cell Environ. 2014, 37, 780–794. [Google Scholar] [CrossRef]
  61. Bouard, W.; Houde, M. The C2H2 zinc finger protein TaZFP13D increases drought stress tolerance in wheat. Plant Stress 2022, 6, 100119. [Google Scholar] [CrossRef]
  62. Chen, F.; Ji, X.; Bai, M.; Zhuang, Z.; Peng, Y. Network analysis of different exogenous hormones on the regulation of deep sowing tolerance in maize seedlings. Front. Plant Sci. 2021, 12, 2843. [Google Scholar] [CrossRef] [PubMed]
  63. Xia, S.; Xiao, L.; Gannon, P.; Li, X. RFC3 regulates cell proliferation and pathogen resistance in Arabidopsis. Plant Signal. Behav. 2010, 5, 168–170. [Google Scholar] [CrossRef] [PubMed] [Green Version]
  64. Breton, C.; Fournel-Gigleux, S.; Palcic, M.M. Recent structures, evolution and mechanisms of glycosyltransferases. Curr. Opin. Struct. Biol. 2012, 22, 540–549. [Google Scholar] [CrossRef]
  65. Moriyama, E.N.; Strope, P.K.; Opiyo, S.O.; Chen, Z.; Jones, A.M. Mining the Arabidopsis thaliana genome for highly-divergent seven transmembrane receptors. Genome Biol. 2006, 7, R96. [Google Scholar] [CrossRef] [Green Version]
  66. Anitha, V.; Panneerselvam, V.; Arun Kuma, V.; Ram, R. The Arabidopsis ABHD11 mutant accumulates polar lipids in leaves as a consequence of absent acylhydrolase activity. Plant Physiol. 2016, 170, 180–193. [Google Scholar] [CrossRef] [Green Version]
  67. Mizoi, J.; Shinozaki, K.; Yamaguchi-Shinozaki, K. AP2/ERF family transcription factors in plant abiotic stress responses. BBA—Gene Regul. Mech. 2012, 1819, 86–96. [Google Scholar] [CrossRef] [PubMed]
  68. Zhang, J.; Liao, J.; Ling, Q.; Xi, Y.; Qian, Y. Genome-wide identification and expression profiling analysis of maize AP2/ERF superfamily genes reveal essential roles in abiotic stress tolerance. BMC Genom. 2022, 23, 125. [Google Scholar] [CrossRef] [PubMed]
  69. Yaish, M.W.; Peng, M.; Rothstein, S.J. AtMBD9 modulates Arabidopsis development through the dual epigenetic pathways of DNA methylation and histone acetylation. Plant J. Cell Mol. Biol. 2009, 59, 123–135. [Google Scholar] [CrossRef] [PubMed]
  70. David, S.; Christopher, W.; Philippe, L.; Berardini, T.Z.; Margarita, G.H.; Hartmut, F.; Li, D.; Tom, M.; Robert, M.; Larry, P. The Arabidopsis Information Resource (TAIR): Gene structure and function annotation. Nucleic Acids Res. 2008, 36, D1009–D1014. [Google Scholar] [CrossRef]
  71. Weber, H.; Hellmann, H. Arabidopsis thaliana BTB/ POZ-MATH proteins interact with members of the ERF/AP2 transcription factor family. FEBS J. 2009, 276, 6624–6635. [Google Scholar] [CrossRef]
  72. Jiang, C.; Iu, B.; Singh, J. Requirement of a CCGAC cis-acting element for cold induction of the BN115 gene from winter Brassica napus. Plant Mol. Biol. 1996, 30, 679–684. [Google Scholar] [CrossRef]
  73. Borassi, C.; Sede, A.; Mecchia, M.; Salgado Salter, J.; Marzol, E.; Muschietti, J.; Estevez, J. An update on cell surface proteins containing extensin-motifs. J. Exp. Bot. 2016, 67, 477–487. [Google Scholar] [CrossRef] [PubMed] [Green Version]
  74. Draeger, C.; Fabrice, T.N.; Gineau, E.; Mouille, G.; Kuhn, B.M.; Moller, I.; Abdou, M.; Frey, B.; Pauly, M.; Bacic, A.; et al. Arabidopsis leucine-rich repeat extensin (LRX) proteins modify cell wall composition and influence plant growth. BMC Plant Biol. 2015, 15, 155. [Google Scholar] [CrossRef] [PubMed]
  75. He, Z.; Wang, Z.Y.; Li, J.; Zhu, Q.; Lamb, C.; Ronald, P.; Chory, J. Perception of brassinosteroids by the extracellular domain of the receptor kinase BRI1. Science 2000, 288, 2360–2363. [Google Scholar] [CrossRef] [Green Version]
  76. Dharmasiri, N.; Dharmasiri, S.; Estelle, M. The F-box protein TIR1 is an auxin receptor. Nature 2005, 435, 441–445. [Google Scholar] [CrossRef]
  77. Cannon, M.C.; Terneus, K.; Hall, Q.; Tan, L.; Wang, Y.; Wegenhart, B.L.; Chen, L.; Lamport, D.; Chen, Y.; Kieliszewski, M.J. Self-assembly of the plant cell wall requires an extensin scaffold. Proc. Natl. Acad. Sci. USA 2008, 105, 2226–2231. [Google Scholar] [CrossRef] [Green Version]
  78. Baumberger, N.; Doesseger, B.; Guyot, R.; Diet, A.; Parsons, R.L.; Clark, M.A.; Simmons, M.P.; Bedinger, P.; Goff, S.A.; Ringli, C.; et al. Whole-genome comparison of leucine-rich repeat extensins in Arabidopsis and rice. a conserved family of cell wall proteins form a vegetative and a reproductive clade. Plant Physiol. 2003, 131, 1313–1326. [Google Scholar] [CrossRef] [PubMed] [Green Version]
Figure 1. (A) Maize ear leaf veins. (A-1) CT image of complete ear leaf cross section of inbred line CIMBL148, (A-2) CT image of lateral veins of CIMBL148, (A-3) CT image of midvein of CIMBL148. (B) Maize ear leaf midvein. (B-1) CT image of ear leaf midvein of inbred line CIMBL132, (B-2) CT image of ear leaf midvein of inbred line GEMS11, (B-3) CT image of ear leaf midvein of inbred line GEMS23, (B-4) CT image of ear leaf midvein of inbred line GEMS52.
Agronomy 13 00753 g001
Figure 2. Accuracy evaluation for total number of leaf veins comparing predicted data and measured data.
Agronomy 13 00753 g002
Figure 3. Correlation analysis of leaf veins’ phenotypic traits at ear leaf of maize among 300 inbred lines.
Agronomy 13 00753 g003
Figure 4. Analysis of differences in ear leaf veins’ phenotypic traits among different subgroups. (A) Vein density (VD), (B) leaf width (LW), (C) midvein area (MVA), (D) vein number (VN). Different lowercase letters of the same index show significant difference at 0.05 level.
Agronomy 13 00753 g004
Figure 5. GO terms and KEGG pathways enriched by 29 functionally annotated genes. (A) KEGG pathways, (B) GO terms.
Agronomy 13 00753 g005
Figure 6. Heatmap of 29 functionally annotated genes’ expression in 13 different development stages of maize leaves. DAS: days after sowing, Vn: vegetative stage corresponding to the number of emerged leaves, VT: vegetative tasseling stage, R2: reproductive stage 2.
Agronomy 13 00753 g006
Figure 7. Analysis of haplotype (A,B) and phenotypic difference (C,D) of SNPs related to the midvein area of maize ear leaf. ** p ≤ 0.01.
Agronomy 13 00753 g007
Figure 8. Analysis of haplotype (A,B) and phenotypic difference (C) of SNPs related to the vein density of maize ear leaf. *** p ≤ 0.001.
Agronomy 13 00753 g008
Table 1. Comparison of leaf microscopic image acquisition and analysis methods.
MethodPretreatmentImage ScanningImage AccuracyPhenotype Analysis
Paraffin section + manual/semi-automatic analysis methodParaffin sectioning
About 2–3 weeks
The scanning of slide scanner can only obtain local microscopic images, and the scanning range is 0.5–20 µmUp to 0.5 µm resolutionManual or semi-automatic detecting, the standard varies from person to person, and the detection efficiency is lowAnalysis of local characteristics of leaves
Micro-CT + automatic detection based on deep learningDehydration, tertbutyl alcohol replacement, drying, etc.
About 1 week
Micro-CT can obtain a complete cross-sectional microscopic image of leaves, with a scanning range of 2.0 µm–30 mmUp to 2 µm resolutionAutomatic analysis, unified standard, average efficiency of about 2–3 s/CT imageComplete cross section of leaves or analysis of local characteristics can be realized
Table 2. Phenotypic variations in leaf vein traits at ear leaf of maize among 300 inbred lines.
Phenotypic TraitsAbbreviationUnitMedianMaximumMinimum
Vein numberVNpcs25.000 ± 0.16338.000 ± 0.16414.000 ± 0.020
Midvein areaMVAmm20.341 ± 0.0050.849 ± 0.0050.080 ± 0.005
Leaf widthLWcm8.665 ± 0.04312.101 ± 0.0425.447 ± 0.042
Vein densityVDpcs/cm2.855 ± 0.0194.804 ± 0.0191.432 ± 0.019
Table 3. Single-factor variance analysis among different subgroups of ear leaf veins’ phenotypic traits.
Traitp-ValueMixedNSSTSTSS
VN9.28 × 10−7 ***23.785 ± 0.303b24.190 ± 0.334b25.735 ± 0.328a26.043 ± 0.246a
MVA0.000303 ***0.339 ± 0.008b0.371 ± 0.009b0.360 ± 0.011b0.434 ± 0.012a
LW0.000195 ***8.696 ± 0.083a8.642 ± 0.087a8.816 ± 0.084a8.059 ± 0.058b
VD1.09 × 10−8 ***2.766 ± 0.039c2.821 ± 0.038bc2.942 ± 0.037b3.246 ± 0.031a
Note: 0 ‘***’; different lowercase letters of the same index show significant difference at 0.05 level.
Table 4. Important loci in genome-wide association study of maize ear leaf veins’ phenotypic traits.
TraitNo. of Significant SNPsNo. of Annotated GenesNo. of
Functionally Annotated Genes
VN14267
MVA325910
LW5106
VD10196
Total6111429
Disclaimer/Publisher’s Note: The statements, opinions and data contained in all publications are solely those of the individual author(s) and contributor(s) and not of MDPI and/or the editor(s). MDPI and/or the editor(s) disclaim responsibility for any injury to people or property resulting from any ideas, methods, instructions or products referred to in the content.

