Article

Breeding Milestones Correspond with Changes to Wheat Rhizosphere Biogeochemistry That Affect P Acquisition

by
Rebecca K. McGrail
1,2,*,
David A. Van Sanford
3 and
David H. McNear, Jr.
1
1
Rhizosphere Science Laboratory, Department of Plant and Soil Sciences, University of Kentucky, 1100 South Limestone, Lexington, KY 40546-0091, USA
2
Grassland Ecology Laboratory, Department of Plant and Soil Sciences, University of Kentucky, 1100 South Limestone, Lexington, KY 40546-0091, USA
3
Wheat Breeding Group, Department of Plant and Soil Sciences, University of Kentucky, 1405 Veterans Drive, Lexington, KY 40546-0091, USA
*
Author to whom correspondence should be addressed.
Agronomy 2023, 13(3), 813; https://doi.org/10.3390/agronomy13030813
Submission received: 30 January 2023 / Revised: 8 March 2023 / Accepted: 9 March 2023 / Published: 10 March 2023
(This article belongs to the Topic Plant-Soil Interactions)

Abstract

:
Breeding wheat (Triticum aestivum L.) has resulted in small gains in improved nutrient acquisition and use as numerous traits are involved. In this study, we evaluated the impact of breeding on P-acquisition and identified both plant and soil variables that could be used to inform the selection of germplasm with increased P acquisition efficiency. We previously screened a historic panel of winter wheat cultivars for root system architecture and root tip organic acid content when grown in P-deficient solution/agar and used these characteristics together with breeding history to develop a predicted P extraction potential (PEP). We tested the validity of the PEP classification by growing cultivars under sufficient and insufficient soil P conditions. Old, wild-type cultivars had the greatest P utilization efficiency (PUtE) when grown under insufficient P, likely a result of the chemical potential of wild-type (with respect to Rht-B1) cultivars (greater organic acid production) rather than root system size. Wild-type plants had differences in rhizosphere microbial community structure, rhizosphere bicarbonate-extractable P, and bulk soil Fe and Al, indicating the utilization of typically less available P pools. The PEP classification based on the presence of dwarfing allele and era of release offers a path forward for breeding for improved P acquisition.

1. Introduction

Yield gaps, in which the crop yield potential is not achieved, result from numerous factors including unfavorable weather conditions (temperature and moisture extremes), pests, disease, and nutrient deficiencies. It is estimated that solely improving nutrient balances could close the yield gap in 73% of agricultural regions that report a yield gap exceeding 25% [1]. Improving nutrient balances cannot be accomplished solely through the increased use of fertilizers because fertilizer use efficiencies for macronutrients are low—≤50% for nitrogen, ≤10% for phosphorus, and 20–40% for potassium [2]. Estimates suggest that plant available P is limited in 67% of agricultural soils [3]. Therefore, improving the P balances is a major target for closing the yield gap. The reliance on inorganic P fertilizer alone to improve P balance and close yield gaps is volatile and can be economically unattainable for producers, most notably in developing nations [4,5,6,7].
The adaptation of germplasm for low fertility soils and/or reduced input production systems is the best path forward [6]. Two major targets for improving the germplasm for these conditions are root system architecture and biochemical mechanisms of P acquisition. Diffusion is the principal mechanism by which plants acquire P, accounting for 89% of all uptake in corn (Zea mays L.) [8]. However, uptake via diffusion creates depletion zones around the roots. Depletion zones reduce uptake efficiencies through a decline in nutrient flux per unit of root surface with time [9]. Large root systems can overcome this problem by increasing the amount of soil explored, therefore increasing the amount of P-containing soil solution the roots come into contact with. Because P uptake is proportional to the root length density, plants can respond by increasing the overall root number or by producing roots with a smaller diameter or root hairs to increase the root surface area. Such improvements in root system architecture require less carbon investment than primary roots and offer a mechanism through which to obtain P without greatly increasing plant stress [10,11]. Genetic variance in lateral root growth in wheat (Triticum aestivum L.) genotypes [12], seminal root traits in barley (Hordeum vulgare L.) breeding lines [13], and both root hair presence [14] and length [15] in rye (Secale cereale L. cv. Petkus II) support the adaptation of grain cultivars for low fertility conditions, either low natural fertility or reduced inputs to use legacy P.
A second, promising target is the biogeochemical response to P-deficiency. Plants can exude a variety of compounds to increase P availability including enzymes, organic acids, and protons. Differences in organic acid or proton production have been reported between crop species [16] and among genotypes within a species [17,18,19,20], which are linked to increases in P availability. The organic acid response to a given nutrient condition will vary by plant. For example, under low P conditions, alfalfa (Medicago sativa L.) and oat (Avena sativa L.) released citrate [21,22] whereas rape (Brassica napus L.) released malate [23]. Some cultivars of wheat have been reported to contain citric acid [24] and oxalic acid [19,25,26] in the root tips under P-deficiency. However, not all plant species respond to P-deficiency with increased organic acids. Hoffland et al. [27] found that hedge mustard (Sisymbrium officinale Scop.) does not accumulate or excrete organic acids. Differences in enzyme exudation such as phytase, acid phosphomonoesterase, and acid phosphatase have been observed in plant genotypes [28,29,30], which correlated with increased tissue P content [31]. Additionally, microbes in the rhizosphere can also play a role in enhancing P acquisition. The most reported of these is the association between the majority of land plants and mycorrhiza fungi, which can greatly increase the root surface area [32] and influence nutrient foraging strategies [33]. Rhizosphere bacteria, supported by the greater availability of C in the rhizosphere, have also been shown to mineralize organic P or solubilize inorganic P from soil minerals [34]. Both plant and microbial processes play a role in enhancing P availability in the rhizosphere. Selection for plant traits that influence microbial community assemblages, rather than breeding for the microbial community itself, is a suitable target for advancing plant nutrition [35].
Breeding to improve plant response to nutrient deficiencies and to increase nutrient acquisition is crucial [36]. However, genotype information is useful for breeding if the expressed phenotypic response that resulted in improved performance is also known [37]. The genetic underpinnings of root phenotypic responses are poorly understood, especially in comparison to our increasing knowledge of the plant genome, transcriptome, proteome, and metabolome, and are a bottleneck to advancing breeding [37]. We set out to evaluate the winter wheat cultivar performance when grown in soils with low P availability based on an a priori classification. Cultivars selected for this study were previously characterized by the authors for root system architecture (RSA) and root tip organic acid (OA) content in response to P-deficiency. Based on prior analysis, semi-dwarf wheat varieties (all Rht-1b semi-dwarfs) were found to contain two times less organic acids in root tips under P stress compared to wild-type cultivars [19]. RSA analysis determined that under P stress, old cultivars released prior to 1970 had larger root systems compared to intermediate (1970–1989) and modern (1990–2002) cultivars [38]. RSA and OA production were used to group the cultivars into groups based on the P extraction potential (PEP). We hypothesized that old wild-type cultivars (PEP class 1) would perform best under low P conditions compared to newer semi-dwarf varieties with smaller root systems (PEP class 4).

2. Materials and Methods

2.1. Plant Growth Conditions

Winter wheat seeds for use in this study were provided by the United States Department of Agriculture Agricultural Research Service National Genetic Resources Program. Pembroke 2016, developed by the Kentucky Agricultural Experiment Station [39], was used as a check cultivar for growth parameters as it has been well-characterized and grown by the University of Kentucky Wheat Breeding Group in a variety of environments. Seeds of Pembroke 2016 were provided by the University of Kentucky Wheat Breeding Group. Cultivars were previously described by the authors [19,38] and classified for this study as shown in Table 1.
Crider silt loam (fine-silty, mixed, active, mesic Typic Paleudalf; Table S1) was selected for use in this study as it is a highly productive soil with insufficient P (6 mg kg−1) underlying 202,343 hectares of land in Kentucky, many of which are classified as prime farmland [40]. Soil was passed through a sieve (<2 mm) and limed to a target pH of 6.4 according to the University of Kentucky’s recommendations [41] with reagent grade calcium hydroxide (Fisher Scientific, Waltham, MA, USA). Seeds were germinated by planting one seed per cell of a six-cell plant pack filled with limed soil and placing them into plant flats where they were watered continuously with deionized (DI) water from the bottom. After germination, the flats were transferred to a cold room for six weeks for vernalization.
Following vernalization, the entire contents of each individual cell pack was transferred to the center of a labeled pot (950 cm3 volume; [42]) filled with 800 g of limed soil (target pH = 6.4). Pots (n = 5 per cultivar per condition) were randomly arranged on a greenhouse bench and immediately watered with 100 mL of DI water after transplanting. Experimental conditions (sufficient/insufficient P) were established through the addition of 100 mL of nutrient solution. Nutrient solution for both treatments contained reagent grade ammonium nitrate and potassium sulfate (Fisher Scientific, Waltham, MA, USA). Nutrient solution for plants in the sufficient P treatment also contained reagent grade phosphorus(V) oxide (Fisher Scientific, Waltham, MA, USA). The insufficient P treatment received no P fertilization. Nutrient solutions were prepared in ultrapure DI, and nutrient sources were added according to the rate specified by the University of Kentucky’s recommendations [41] scaled to the amount of soil per pot (0.58 g NH4NO3, 0.03 g K2SO4, and 0 g or 0.06 g P2O5). Plants were watered every other day with 100 mL of DI water following the nutrient addition. The volume of water added each day was 50% of the soil’s water holding capacity. Granular Marathon (1% imidacloprid) was added to each pot according to the label 22 days post-transplant to treat for aphids.
Plants were harvested 47 days after transplant with a target growth stage of heading (Feekes 10.1). At this stage, approximately 80% of the total P uptake had occurred [43,44,45]. Plant height was measured from the soil surface to the top of the head on the primary tiller (excluding awns), and the number of tillers and heads were counted. Biomass was harvested by cutting the stem at the soil surface with a razor blade. Shoot and root biomass was measured after drying at 60 °C.

2.2. Soil Collection and Analyses

Plants were depotted by applying slight pressure to the bottom of the inverted pot. An effort was made to segregate and sample the root-associated soil and bulk soil not impacted by roots. The soil that freely broke away from the root system in the depotting process was considered bulk soil, while the soil that was retained by the root system was classified as rhizosphere soil. The roots were collected and placed into a separate labeled paper bag. The rhizosphere soil was sieved (<2 mm) to separate the soil from roots, with roots passing through the sieve collected and added to the root biomass. There was not a large amount of rhizosphere soil, so the decision was made to collect a ~7 g sample and ~50 g sample of rhizosphere soil for microbial phospholipid fatty acid analysis (PLFA) and Hedley sequential fractionation, respectively. The small amount of rhizosphere soil remaining was mixed with the sieved bulk soil and a sample was sent to the University of Kentucky Regulatory Services for analysis (pH, Mehlich-III extractable nutrients, %N, and %C).
Samples for PLFA analysis were stored at −20 °C until lyophilization and thereafter at −80 °C until extraction. Fatty acid methyl esters (FAMEs) were extracted from the rhizosphere soil following the high-throughput methods described by Buyer and Sasser [46]. FAME concentrations were determined using an Agilent 7890 GC (Agilent Technologies, Wilmington, DE, USA) equipped with an auto sampler and flame ionization detector controlled by MIS Sherlock® (MIDI, Inc., Newark, DE, USA) and the Agilent ChemStation software. FAMEs were separated on an Agilent 7693 Ultra 2 column (25 m long × 0.2 mm internal diameter × 0.33 µm film thickness) with a column split ratio of 30:1 using ultra-high-purity hydrogen gas at a flow rate of 1.2 mL min−1. The oven temperature was 190 °C, ramping to 285 °C for 10 min and then 310 °C for 2 min at a rate of 10 °C min−1 and 60 °C min−1, respectively. Blanks (hexane only) were analyzed every ten samples and a 37-component fatty acid mixture (Supelco, Sigma Aldrich, Saint Louis, MO, USA) was used to verify the calibration. FAMEs were identified and their concentrations and percentages calculated using the peak naming table in the Sherlock® microbial identification system (MIDI, Newark, DE, USA).
The rhizosphere soil samples were sequentially extracted for inorganic P following the Hedley procedure as described by Tiessen et al. [47] with slight modification. A 4 cm × 10 cm anion exchange resin (CTL Scientific Supply Company, Deer Park, NY, USA) activated with 0.5 N nitric acid (HNO3) for a minimum of 12 h was used rather than Dowex and exchange resin. No other modifications were made. A flatbed orbital shaker (Barnstead International, Dubuque, Iowa) set at 110 rpm was used to shake the samples, and samples were centrifuged with an Eppendorf 5810R centrifuge (Eppendorf, Hamburg, Germany) at 3800 rpm for 50 min. Inorganic orthophosphate was quantified by ICP-OES (5110, Agilent Technology, Santa Clara, CA, USA), and the concentration was determined from standards of a known concentration. In the Hedley procedure, resin-extractable and bicarbonate-extractable P are plant-available P. The resin-extractable P is directly taken up by plants and the bicarbonate-extractable pool replenishes the resin-available pool.

2.3. Plant Digestion and Elemental Quantification

Oven-dried shoot and roots with masses ≥ 0.20 g were ground in a ball mill (Cianflone Scientific Instruments Corporation, Pittsburgh, PA, USA) prior to digestion. Root and shoot samples with masses ≤ 0.20 g were not ground, and the entire sample was digested whole. Grinding such small quantities resulted in minimal material recovery. Tissue samples were digested in open top 50 mL metal-free conical vials using 10 mL of trace metal grade 31.4 N HNO3 in a 1600 W MARS Xpress microwave (Matthews, NC, USA) digestion system at 100 °C for 20 min. Digests were diluted to a final volume of 50 mL with ultrapure DI water prior to analysis for Al, Ca, Fe, K, Mg, Mn, and P concentrations on an ICP-OES (5110, Agilent Technology, Santa Clara, CA, USA). The instrument was calibrated with a mixed standard and verified every twenty samples along with a calibration blank. An internal standard of yttrium was continuously analyzed to test for instrumental drift and matrix effects. Five samples of varying masses of apple leaf standard reference material (NIST SRM 1515, Millipore Sigma, Burlington, MA, USA) were digested and analyzed to calculate the percent recovery.
Two measures of P uptake and efficiency were calculated from the shoot and root P concentrations. Phosphorus utilization efficiency (PUtE) and root P acquisition efficiency (RPAE) were computed following the equations in Pan et al. [48].
PUtE = [shoot dry mass + root dry mass (g)]/[shoot P content + root P content (g)]
RPAE = [shoot P content + root P content (mg)]/root dry mass (g)

2.4. Statistical Analysis

Univariate outlier analysis was performed by experimental condition (sufficient/insufficient P) using JMP Pro 16 (Statistical Analysis Systems Institute, Cary, NC, USA) by which any value that was three times the interquartile range beyond the lower and upper quartiles was classified as an outlier. In the sufficient P portion of the experiment, a single Baca (modern wild-type) rep was identified as an outlier for root Ca, root Al, root Mg, and root P, likely due to soil contamination in the digestate. These values were excluded from any further analysis. No measurements were identified as an outlier in the insufficient P portion of the experiment.
Statistical analysis of plant growth metrics, plant nutrients, soil chemical data, measures of nutrient use efficiency, and the total concentrations of microbial biomarker groups (Gram-positive bacteria (G+), Gram-negative bacteria (G−), arbuscular mycorrhizal fungi (AMF), general fungi, actinobacteria, protists) conducted in SAS 9.4 (Statistical Analysis Systems Institute, Cary, NC, USA). PROC GLIMMIX (generalized linear mixed model), which does not require the assumption of normality, was used to test the effects of dwarfing status and cultivar age classification. The experimental condition (sufficient/insufficient P) was statistically significant for 38 of the 60 variables, so all analyses were performed by the experimental condition.
A two-way ANOVA was used to assess the impact of the fixed effects of cultivar dwarfing status and cultivar age with replicate as a random effect. No interaction was specified in the model as the interaction term was the PEP classification. Means were separated using a post-hoc Tukey’s honest significant difference (HSD) test (α = 0.05). A one-way ANOVA was used to evaluate the PEP class on the measures of efficiency (PUtE and RPAE) with the replicate specified as a random effect. Means were separated using a post-hoc Tukey’s HSD test (α = 0.05). A complete ANOVA table for all variables is available in Table S2.
The microbial community structure was analyzed in PC-ORD (version, 6.08, MjM Software, Gleneden Beach, OR, USA) using Hellinger transformed [49] microbial biomarker group concentrations in autopilot mode using Sorensen (Bray-Curtis) distances and slow and thorough settings. A multi-response permutation procedure (MRPP) was used with a relative Sorenson distance measure of the PLFA matrix to evaluate whether the cultivar dwarfing status (wild-type or semi-dwarf), cultivar age (old or modern), or PEP classification affected the microbial community structure. The p-values were corrected for multiple comparisons using the Benjamini and Hochberg [50] approach with a false discovery rate of 0.10.

3. Results

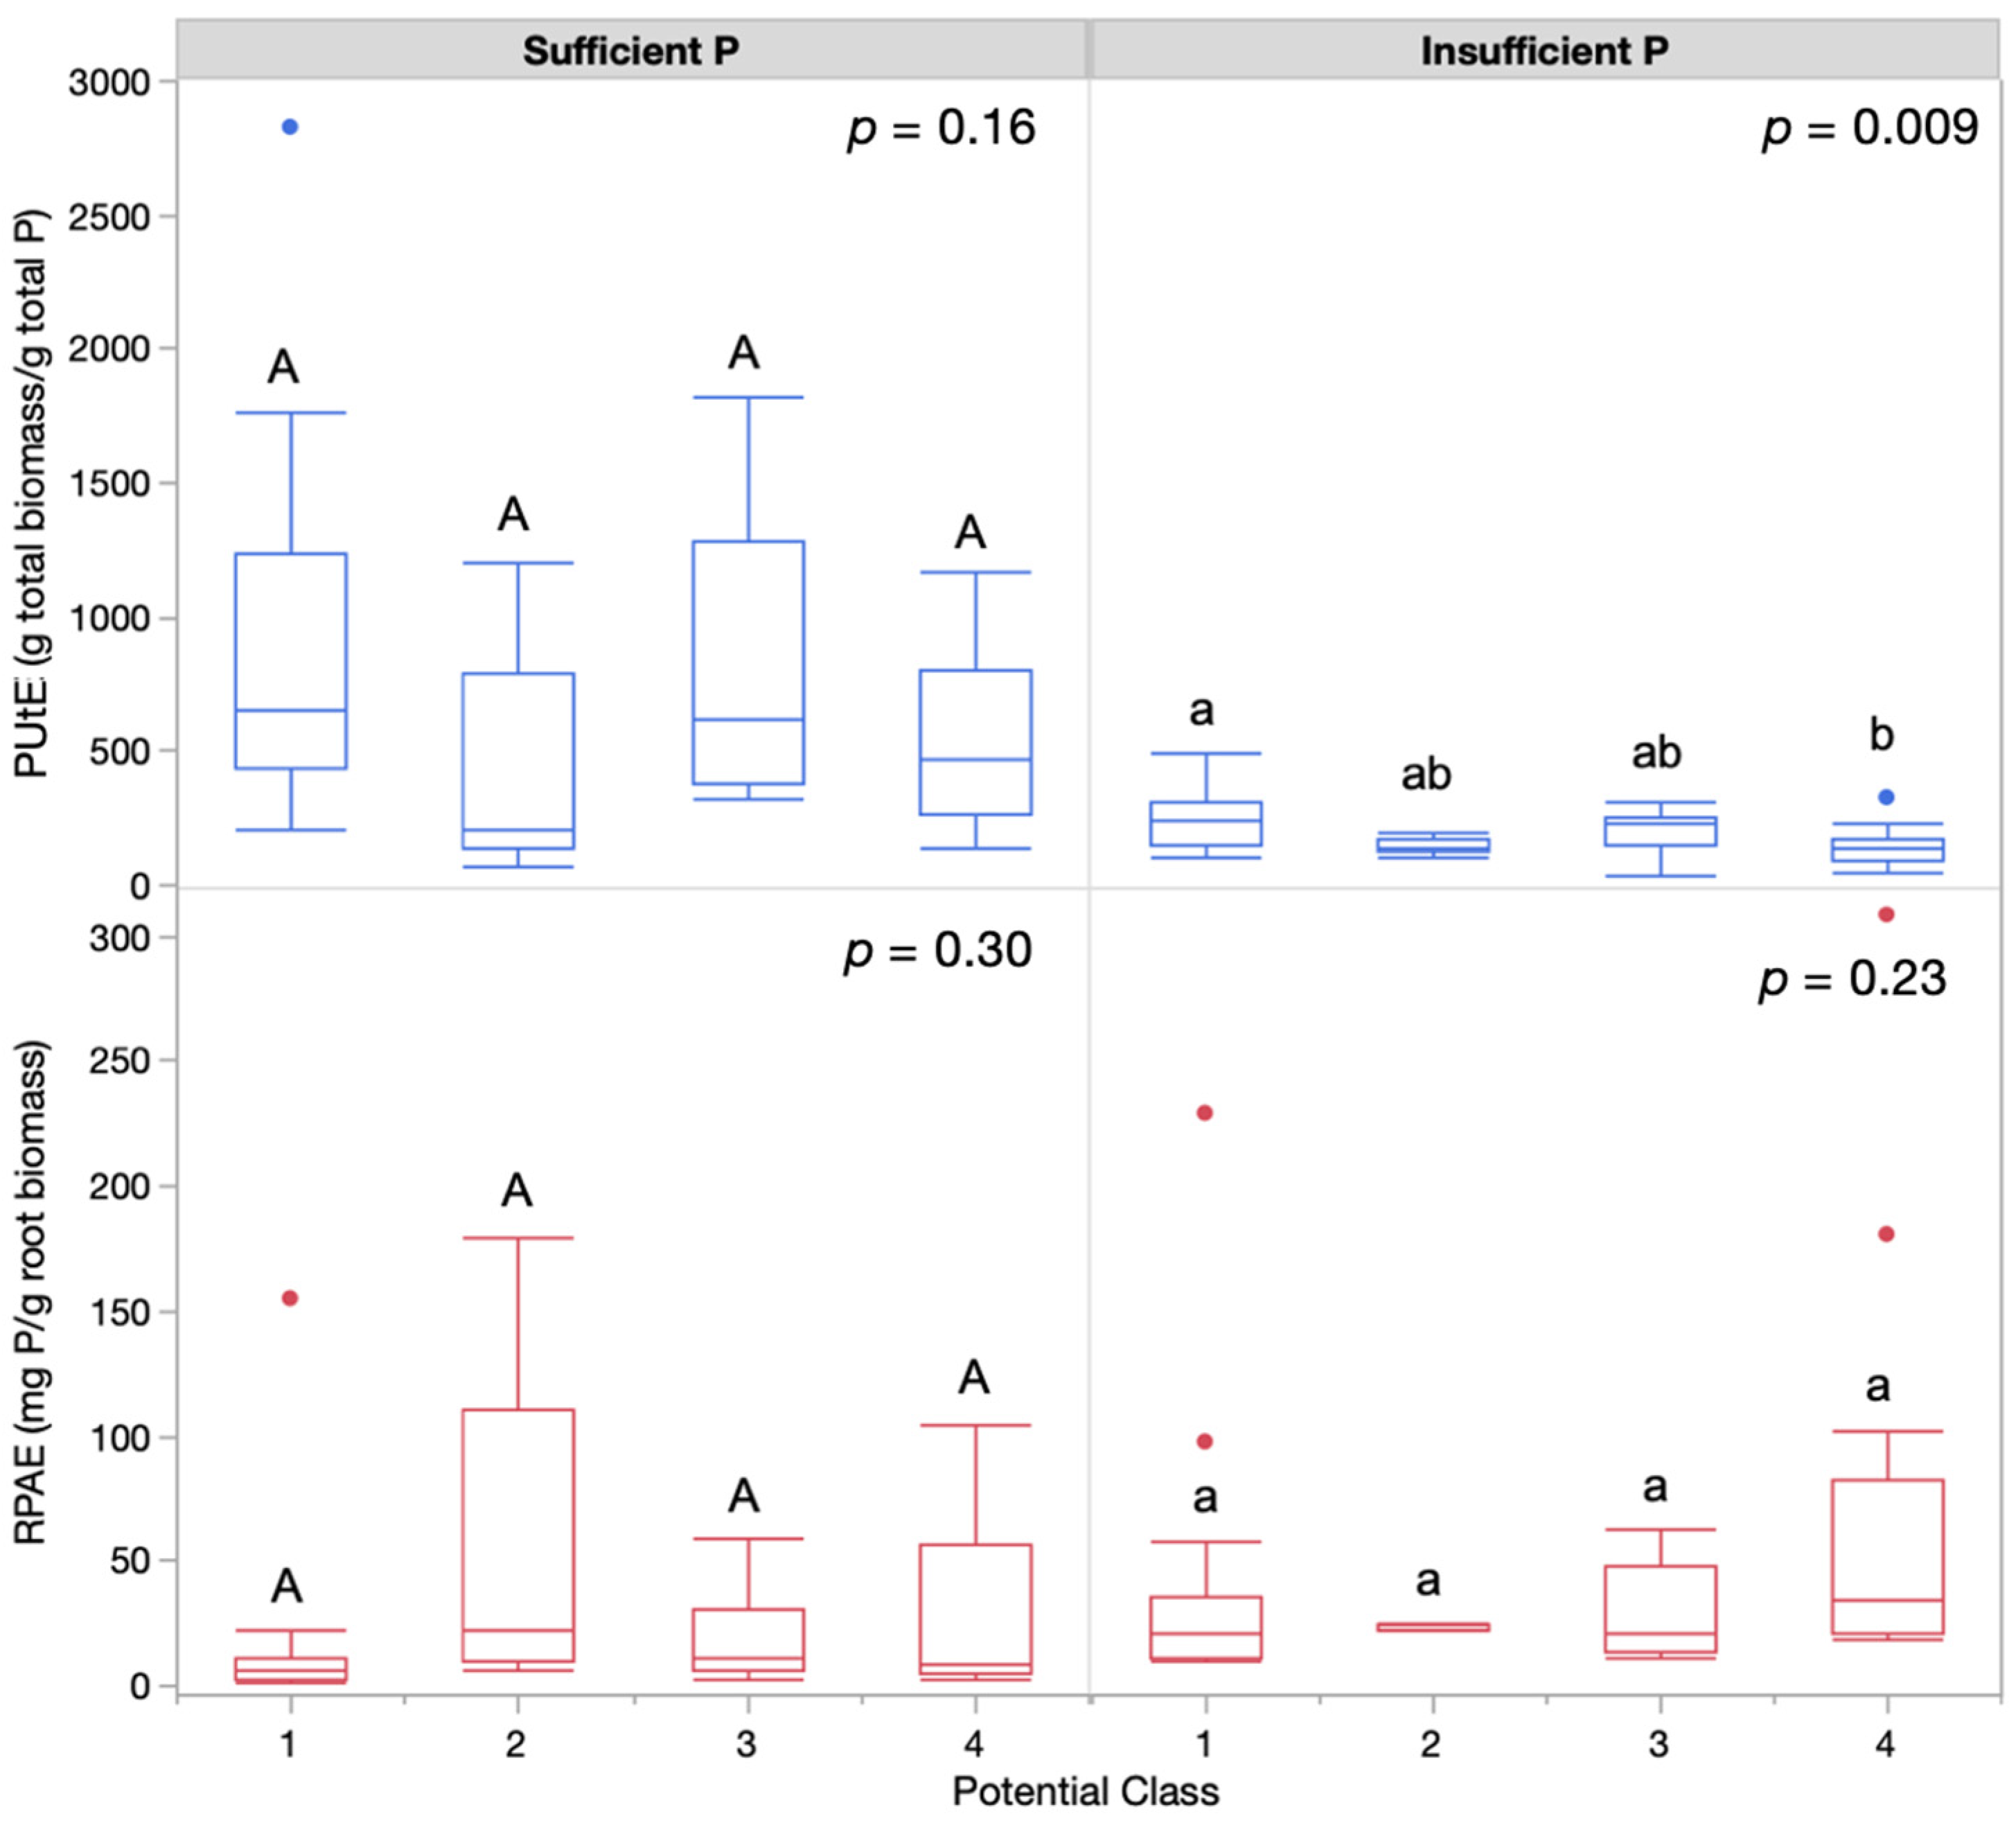
3.1. Measures of Phosphorus Efficiency

Under sufficient soil P, PUtE and RPAE did not differ significantly with the PEP class (Table 2). With insufficient P, PUtE differed significantly with the PEP class. PUtE was greatest for PEP class 1, composed of the old wild-type cultivars (Figure 1), and was lowest for PEP class 4, which was the modern semi-dwarf cultivars. RPAE did not differ with the PEP class. Because the PEP class is a categorical combination of two factors (plant era and dwarfing status), explanatory factors that inform PUtE were evaluated by both plant era and dwarfing status to ascertain which plant root responses corresponded with either changes in RSA (plant era) or OA production (dwarfing status).

3.2. Plant Growth and Nutrient Content

With sufficient P, cultivar dwarfing status had a significant (p < 0.05) effect on the main stem height, shoot mass, and shoot P, root Al, and root Fe concentrations (Table 3). Wild-type cultivars were taller and had more shoot biomass compared to the semi-dwarf cultivars. Wild-types had 29% less shoot P concentration compared to the semi-dwarfs (Table S3). When accounting for the total nutrient content (shoot or root concentration multiplied by shoot or root mass), shoot P did not vary by cultivar dwarfing status (Table 3 and Table S5). Root Al and root Fe concentration decreased by 25% and 33% (Table S3) in the wild-type cultivars compared to the semi-dwarf cultivars, however, this did not result in any difference in the total nutrient uptake (Table 3). The total nutrient content differed significantly (p < 0.05) in the wild-types compared to the semi-dwarfs for shoot K, shoot Ca, shoot Mg, shoot Mn, shoot Al, and shoot Fe (Table 3). The total nutrient uptake increased in the wild-types by 42% for shoot K, 49% for shoot Ca, 36% for shoot Mg, 36% for shoot Mn, 40% for shoot Fe, and 33% for shoot Al (Table S5). Shoot Mg and root Fe concentrations differed with cultivar age class (Table 3). Old cultivars contained 23% more shoot Mg and 50% more root Fe compared to modern cultivars (Table S4). Again, this difference in concentration did not correspond with a difference in the total nutrient uptake for either shoot Mg or root Fe (Table S6).
With insufficient P, the growth stage, main stem height, and shoot K, shoot Mg, shoot P concentration varied with the cultivar dwarfing status (p < 0.05; Table 3). The wild-type cultivars were taller and contained 11% greater concentration (mg g−1 tissue) of shoot K compared to the semi-dwarf cultivars (Table S3). P and Mg concentration in the shoots of the semi-dwarf cultivars was 32% and 11% greater, respectively, compared to the wild-type cultivars (Table S3). However, the total nutrient uptake (mg) did not differ between the wild-types and semi-dwarfs for shoot K, shoot P, or shoot Mg (Table S5). Growth stage, number of heads, shoot K, and shoot Mg differed with the cultivar age class (Table 3). Modern cultivars had an average of one head per plant whereas old cultivars had an average of 0.8 heads per plant, which was attributed to a difference in growth stages. Five wild-type plants were not at the targeted stage (three Red May and one Blackhull plant at flag leaf stage and one Red May plant in boot) and therefore did not have any emerged heads. Shoot K and shoot Mg concentration was 11% and 10% greater, respectively in the wild-type cultivars compared to the semi-dwarf cultivars (Table S3). These differences did not result in a differing total nutrient uptake. The total uptake of shoot Fe and root K differed between the old and modern cultivars (Table 3). The total shoot Fe content was 36% greater and the total root K content was 32% greater in the old cultivars compared to the modern cultivars (Table S6).

3.3. Bulk and Rhizosphere Soil Chemical Variables

With sufficient P, the bulk soil P and K (p < 0.05) differed significantly by cultivar dwarfing status (Table 3). Bulk soil Mehlich-III P was 36% greater for the wild-types compared to the semi-dwarf cultivars (Table S7). Bulk soil Mehlich-III K was 17% less for the wild-types compared to the semi-dwarf cultivars (Table S7).
Under insufficient P, the bulk soil Mg and rhizosphere bicarbonate-extractable P varied by cultivar dwarfing status (Table 3). Rhizosphere bicarbonate extractable P was 16% less in the soil from the wild-types (Figure 2, Table S7). The rhizosphere resin-extractable P varied with cultivar age class (Table 3). Rhizosphere soil from the wild-type plants contained 25% less resin-available P compared to the soil from semi-dwarf plants (Figure 2, Table S7). Bulk soil Mehlich-III Mg was 4% greater for the wild-types (Table 4 and Table S7).

3.4. Rhizosphere Microbial Community Structure

Dwarfing status, era, and PEP class had a significant influence on the microbial community structure in the insufficient P (−P) treatment. The NMDS resulted in a 3-dimensional solution with a final stress of 8.88 after 71 iterations. In the orientation shown (Figure 3), axes 1 and 2 explained 27% and 57% of the variation, respectively, with an additional 10% for axis 3 (not shown) for a total of 94%. PEP classes 2 and 4 were significantly different from each other and all other PEP classes. Microbial communities in the rhizosphere of the semi-dwarf and wild-type cultivars separated along axis 2 (Figure S1) and were significantly different (MRPP A = 0.1383, p < 0.001). The rhizosphere of the wild-type plants were strongly correlated with G+ bacteria (axis 2 r2 = 0.946). The effect of era on the rhizosphere microbial community in the insufficient P treatment was significant, but less pronounced (A = 0.06, p = 0.004; Figure S1), separating along axis 1. The rhizosphere of the modern cultivars was correlated with general fungi (axis 1 r2 = 0.905).
Analysis by PEP class in the sufficient P (+P) treatment revealed significant differences in the rhizosphere microbial community structure. The NMDS resulted in a 3-dimensional solution with a final stress of 7.731 after 76 iterations. In the orientation shown (Figure 3), axes 1 and 2 explained 39% and 51% of the variation, respectively, with an additional 7% for axis 3 (not shown) for a total of 96%. The rhizosphere community under PEP classes 3 and 2 separated along axis 1 and were found to be significantly different from each other (A = 0.158, p < 0.001). PEP classes 3 and 4 were also found to be significantly different, however, the difference was not robust (A = 0.0469, p = 0.031). There was no effect of era on the rhizosphere microbial community structure in the sufficient P treatment (A = 0.013, p = 0.133), but the dwarfing status did have a significant, albeit weak, effect (A = 0.0412, p = 0.011).
Univariate analysis of the microbial biomarker concentrations by P treatment found that with sufficient P, the G+ bacterial biomass was significantly greater in the wild-type compared to semi-dwarf cultivars (12.81 vs. 11.27 nmol g−1; Table S7) while the protist biomass was significantly less (0.67 vs. 0.58 nmol g−1; Table 3 and Table S7). The G− and actinobacteria biomass were significantly greater in the old compared to modern cultivars (19.68 vs. 18.14 nmol g−1, and 7.04 vs. 6.50 nmol g−1, respectively; Table 3 and Table S8). As with the P sufficient conditions, in the insufficient P treatment, the G+ bacterial biomass was significantly greater in the wild-type compared to the semi-dwarf cultivars (12.28 vs. 11.16 nmol g−1) while the protist biomass was significantly less (0.63 vs. 0.56 nmol g−1; Table 3 and Table S7).

4. Discussion

In this study, we tested the validity of a predictive P extraction potential (PEP) informed by previous screenings of a historical panel of winter wheat for root system architecture and root organic acid content when grown in P deficient conditions. We hypothesized that plants with larger root systems (cultivars released before 1970) and greater concentrations of organic acids involved in P extraction from soil (wild-type cultivars) would perform better under P insufficient conditions compared to plants with smaller root systems (cultivars released after 1970) and lower concentrations of organic acids involved in P extraction (semi-dwarf cultivars). We found that under P insufficient conditions, the P utilization efficiency (PUtE) was explained by the PEP classes. Old wild-type cultivars (class 1) had the greatest PUtE compared to the modern semi-dwarfs (class 4), which had smaller root systems and lower root tip organic acid concentrations. Our findings agree with those of Pan et al. (2008) who found that soybean root architecture was correlated with PUtE. Our study for the first time, to our knowledge, combines root physical and chemical potentials to predict PUtE in wheat.
There is some debate over the influence of microbial and chemical responses in the uptake and use efficiencies. In a CIMMYT evaluation of 42 semi-dwarf wheat lines, Manske et al. [51] concluded chemical and microbial responses were of less importance for P-uptake efficiency than agronomic traits alone, the number of spikes, and aboveground biomass. However, others have reported that the PUtE genotypic variance could not be explained by agronomic traits alone [52,53]. For example, Hetrick et al. [54] found mycorrhizal colonization of the roots varied with wheat evolutionary history where older cultivars had a greater reliance on the symbiosis than the modern wheat cultivars and even ancient wheat ancestors. The presence of P-solubilizing bacteria in rhizosphere soil has been linked to other factors such as the overall size of the microbial community and organic matter rather than soil P-status [55]. Root exudates such as organic acids can increase the overall microbial community size, which changes microbial P and can influence the transformation of P from more recalcitrant forms [56]. Therefore, the dynamic interaction between plant roots and the rhizosphere microbial community can influence P availability, uptake, and use.
We observed shifts in the microbial community composition that correlate with PUtE under insufficient P, suggesting differing roles of microbial communities in P cycling of the wheat classifications. Under insufficient P, PEP class 4 was distinct from all the other classes (Figure 3), and an abundance of microbial groups differed between the PEP classes. These differences were likely driven by differences in organic acids by the dwarfing status previously found in this panel [19]. Organic acids, more so than sugars, are an important driving factor in shaping rhizosphere microbial communities in forests [57], grasslands [58], and agricultural systems [59]. PEP classes 4 and 2 separated along axis 1 in which PEP class 4 was correlated with a greater concentration of general fungi. Fungal dominance is common with P-stress in which plants do not release organic acids, principally oxalic acid [60]. Classes 2 and 4 were both semi-dwarfs, which produce less oxalic acid under P-stress compared to wild-type cultivars [19]. However, Class 2 was composed only of Norin-10, which had a larger root system compared to the modern semi-dwarfs of Class 4 [38], and consistently performed as an intermediate between the wild-types and the modern semi-dwarfs in organic acid production [19]. Therefore, the fungal dominance of Class 4 is likely to be correlated with the decreased organic acid potential of these modern, semi-dwarf cultivars, and the smaller root system by which it interacted with soil. PEP classes 1 and 3 were similar to each other but separated from classes 4 and 2 along axis 2, which correlated with greater concentrations of G+ bacteria. G+ bacteria are distinct from G− bacteria due to the presence of a peptidoglycan in the cell membrane, which decreases the sensitivity to pH and increases the tolerance of acids within the rhizosphere. The greater concentration of organic acids in the roots of the wild-types (class 1 and 3; [19]) selected for G+ bacteria was capable of tolerating those conditions. NMDS analysis of the community structure was supported by ANOVA analyses on microbial group abundance. Protist abundance in both sufficient and insufficient P treatments were influenced by dwarfing status in which the semi-dwarf cultivars (regardless of age class, PEP class 2 and 4) had a greater abundance of protists. Protists, which feed on both G+ and G− soil bacteria, have been linked to influencing the production of plant growth promoting compounds by bacteria, particularly indole acetic acid [61]. Additionally, protists are important in soil organic matter mineralization by enhancing nitrogen and P availability and subsequent plant uptake [62,63,64]. Separation of microbial communities by PEP class, and its correspondence with PUtE, suggests differing mechanisms for increasing P availability.
Cultivars can respond to nutrient availability, or lack thereof, through different mechanisms such as morphological and physiological changes, despite belonging to the same species [65]. In this study, differences in PUtE by PEP class can be attributed primarily to changes in both the root morphology (root system size as a function of old vs. modern cultivars) and chemical potentials (organic acid production in wild-types vs. Rht-loci semi-dwarfs), which affect nutrient acquisition. Mechanisms that resulted in similar shoot P concentrations between PEP class differed by the presence of a dwarfing allele or era as evidenced by the soil physicochemical properties. Under insufficient P conditions, rhizosphere soil bicarbonate-extractable P was lower in soils from the wild-types compared to the semi-dwarfs (Figure 2). Because plant-available resin-P was similar between the wild-types and semi-dwarfs (Figure 2) at the time of harvest, the bicarbonate-extractable P pool replenished the plant available resin-P pool in the rhizosphere of the wild-type cultivars. The decrease in bicarbonate-available P was accompanied by a quantitative increase in Mehlich-III extractable bulk soil Fe and Al concentrations under wild-type cultivars (Table 4). This supports the replenishment theory as bicarbonate-extractable P reflects the P sorbed to soil oxides including Fe, Al, and Mg [66]. Wild-type cultivars can have large or small root systems depending on the era of the cultivar release [38], but universally have high OA potential [19], suggesting that the quantitatively greater bulk soil Fe, Al, and Mg concentrations were due to the destabilization of soil oxides by root-derived organic acids, most likely oxalic acid, and the release of P. While citric and malic acids are usually correlated with P-stress, greater oxalic acid concentrations have been reported in the roots and root exudates of a variety of plants when grown in P-limited soils [17,67]. Oxalic acid requires less carbon and energy to synthesize, and it is not as important a metabolite in plant physiological processes, unlike citric acid [17]. Furthermore, oxalic acid is not as favorable a carbon source for rhizosphere microorganisms compared to citric or malic acids, and therefore could persist in soils longer to chelate metals (e.g., Fe and Al) and liberate P in the process [68,69]. The quantitively increased concentrations of bulk soil Fe, Al, and Mg, coupled with a decrease bicarbonate-extractable P, suggests that wild-type cultivars likely used organic acids, principally oxalic acid, to release soil P.
As older varieties of wheat have been reported to have larger root systems compared to modern varieties, it is further likely that older cultivars would be capable of exploring more soil. Differences in the total shoot and root nutrient concentrations between the old and modern cultivars provide additional support for the increased exploration of soil and utilization of the bicarbonate-extractable P pools including P sorbed to oxides [70] and secondary clay minerals [71,72]. Old cultivars had a greater shoot Fe content and root K content (Table S6). Landraces and old cultivars have been found to have a larger root system than that of modern cultivars [38,73,74,75]; therefore, the nutrient influx of old cultivars was likely greater. Because all nutrient uptake was not greater in old cultivars, another mechanism other than greater soil exploration can be attributed to the increased uptake of Fe and K. It is more likely that the increased exploration, coupled with differences in the exudation of sugars, enzymes, and organic acids, is responsible for the increased uptake of Fe and K. Through our previous work with organic acid production in this panel, we believe that oxalate is the most likely exudate responsible for the increased Fe and K. As Fe is solubilized by organic acids including oxalate, increased soluble Fe would be present in the soil solution for uptake. Oxalate is an important counterion to Na and K cations [76], and K would remain within the root with the exudation of oxalate. Oxalate production and release in response to P-deficiency has been found to correspond to increases in soil solution K through the release of K from secondary clay minerals [77,78,79] such as vermiculate and mica, which were present in the soil we used [80]. Therefore, increased root K and shoot Fe could be indicative of increased oxalate production in the old cultivars.

5. Conclusions

Overall, our findings are suggestive that old, wild-type cultivars are capable of extracting more soil P through increased root exploration (trait of old cultivars) and increased exudation (trait of wild-type cultivars), which selects for microbial groups such as fungi and G+ bacteria, capable of enhancing soil P turnover. The unique nature of our panel, covering two major breeding milestones—the introduction of semi-dwarfism and the use of increased inputs (i.e., inorganic fertilizers, pesticides, herbicides, and irrigation use) in germplasm development following the Green Revolution—helps us to better understand variance in P-acquisition mechanisms. Our panel included both wild-types and semi-dwarfs in modern and old age classes, which is a necessary departure from other studies to better understand the mechanisms for P-acquisition to advance breeding efforts. Here, we measured numerous variables—plant, soil chemical, and microbial—that, together with our previous research, improved our understanding of the P-stress response in soil and identified variables that could be measured within breeding programs to identify cultivars capable of using soil P and reducing the amount of inorganic fertilizer necessary for growth. The greater variation in PUtE observed in PEP classes 1 and 3 (wild-types) offers a potential for future breeding work. While the classes represented in this paper were based only on RSA and OA potentials, our prior definition of PEP [81] can be used to expand the number of chemical and physical traits desired or considered important, thereby adding additional classes in the system of choice such as enzymes, seed P content, or nutrient ratios. While our research has provided a system for classifying genotypes on the basis of P acquisition, this is simply a first step in an area that has been neglected by conventional, yield-centric breeding programs. It is likely that as more genotypes are screened, the system will evolve to consider other factors and eventually, proxies such as single nucleotide polymorphisms associated with P-acquisitive phenotypes will be available for breeders to use. We conclude that wild-types, both modern and old, provide a reservoir of traits to improve germplasm for low input conditions and show that phenotyping winter wheat roots in early development stages, as was done in our earlier investigative work, is representative of their performance nearing maturity.

Supplementary Materials

The following supporting information can be downloaded at: https://www.mdpi.com/article/10.3390/agronomy13030813/s1, Table S1: Initial physicochemical properties of Crider silt loam soil; Table S2: Complete statistical results of two-way ANOVA for explanatory parameters of P utilization efficiency (PUtE) and root P acquisition efficiency (RPAE) by dwarfing status and era of release under sufficient and insufficient soil P; Table S3: Average (least squares means ± one standard error) growth metrics and tissue nutrient concentration by cultivar dwarfing status; Table S4: Average (least squares means ± one standard error) growth metrics and tissue nutrient concentration by cultivar age class; Table S5: Average total nutrient removals per plant component (least squares means ± one standard error) by cultivar dwarfing status; Table S6: Average total nutrient removals per plant component (least squares means ± one standard error) by cultivar age classification; Table S7: Average (least squares means ± one standard error) soil physicochemical data and microbial group concentration by cultivar dwarfing status; Table S8: Average (least squares means ± one standard error) soil physicochemical data and microbial group concentration by cultivar age classification; Figure S1: Nonmetric multidimensional scaling (NMDS) ordination biplots of Hellinger transformed microbial biomarker group FAMEs showing the separation in microbial communities based on dwarfing status (semi-dwarf vs. wild-type) and era (modern vs. old) in insufficient (−P) or sufficient (+P) conditions.

Author Contributions

Conceptualization, R.K.M. and D.H.M.J.; Methodology, R.K.M., D.A.V.S. and D.H.M.J.; Software, D.H.M.J.; Validation, R.K.M. and D.H.M.J.; Formal analysis, R.K.M. and D.H.M.J.; Investigation, R.K.M.; Resources, D.A.V.S. and D.H.M.J.; Data curation, R.K.M.; Writing—original draft preparation, R.K.M.; Writing—review and editing, D.A.V.S. and D.H.M.J.; Visualization, R.K.M. and D.H.M.J.; Supervision, D.H.M.J.; Project administration, D.H.M.J.; Funding acquisition, D.H.M.J. All authors have read and agreed to the published version of the manuscript.

Funding

This research was funded by the United States Department of Agriculture National Institute of Food and Agriculture Grant 2016-67019-25281.

Data Availability Statement

All generated data for this experiment can be requested by contacting the corresponding author.

Acknowledgments

The authors thank Joe Kupper of the University of Kentucky Rhizosphere Science Lab for their assistance in the PLFA sample extraction and analysis and John Connelley of the University of Kentucky Wheat Breeding Group for his assistance in germinating and vernalizing the plants. We appreciate the United States Department of Agriculture Agricultural Research Service National Genetics Resource Program for providing the seed for use in this study.

Conflicts of Interest

The authors declare that the research was conducted in the absence of any commercial or financial relationships that could be construed as potential conflicts of interest.

References

  1. Mueller, N.D.; Gerber, J.S.; Johnston, M.; Ray, D.K.; Ramankutty, N.; Foley, J.A. Closing yield gaps through nutrient and water management. Nature 2012, 490, 254–257. [Google Scholar] [CrossRef] [PubMed]
  2. Baligar, V.C.; Bennett, O.L. Outlook on fertilizer use efficiency in the tropics. Fertil. Res. 1986, 10, 83–96. [Google Scholar] [CrossRef]
  3. Batjes, N.H. A world dataset of derived soil properties by FAO-UNESCO soil unit for global modelling. Soil Use Manag. 1997, 13, 9–16. [Google Scholar] [CrossRef]
  4. Cordell, D.; White, S. Life’s bottleneck: Sustaining the world’s phosphorus for a food secure future. Annu. Rev. Environ. Resour. 2014, 39, 161–188. [Google Scholar] [CrossRef]
  5. Isherwood, K.F. Mineral Fertilizer Use and the Environment; International Fertilizer Industry Association: Paris, France, 2000. [Google Scholar]
  6. Lynch, J.P. Roots of the second Green Revolution. Aust. J. Bot. 2007, 55, 493–512. [Google Scholar] [CrossRef]
  7. Lynch, J.P. Root phenes for enhanced soil exploration and phosphorus acquisition: Tools for future crops. Plant Physiol. 2011, 156, 1041–1049. [Google Scholar] [CrossRef] [Green Version]
  8. Barber, S.A.; Walker, J.M.; Vasey, E.H. Mechanisms for movement of plant nutrients from soil and fertilizer to plant root. J. Agric. Food Chem. 1963, 11, 204–207. [Google Scholar] [CrossRef]
  9. Darrah, P.R. The rhizosphere and plant nutrition: A quantitative approach. Plant Soil 1993, 155–156, 1–20. [Google Scholar] [CrossRef] [Green Version]
  10. Lynch, J.P.; Ho, M.D. Rhizoeconomics: Carbon costs of phosphorus acquisition. Plant Soil 2005, 269, 45–56. [Google Scholar] [CrossRef]
  11. Zhu, J.; Mickelson, S.M.; Kaeppler, S.M.; Lynch, J.P. Detection of quantitative trait loci for seminal root traits in maize (Zea mays L.) seedlings grown under differential phosphorus levels. Theor. Appl. Genet. 2006, 113, 1–10. [Google Scholar] [CrossRef]
  12. Sun, H.; Zhang, F.; Li, L.; Tang, C. The morphological changes of wheat genotypes as affected by the levels of localized phosphate supply. Plant Soil 2002, 245, 233–238. [Google Scholar] [CrossRef]
  13. Robinson, H.; Kelly, A.; Fox, G.; Franckowiak, J.; Borrell, A.; Hickey, L. Root architectural traits and yield: Exploring the relationship in barley breeding trials. Euphytica 2018, 214, 151. [Google Scholar] [CrossRef]
  14. Gahoonia, T.S.; Nielsen, N.E. Barley genotypes with long root hairs sustain high grain yields in low-P field. Plant Soil 2004, 262, 55–62. [Google Scholar] [CrossRef]
  15. Gahoonia, T.S.; Nielsen, N.E.; Joshi, P.A.; Jahoor, A. A root hairless barley mutant for elucidating genetic of root hairs and phosphorus uptake. Plant Soil 2001, 235, 211–219. [Google Scholar] [CrossRef] [Green Version]
  16. Sinclair, T.R.; Vadez, V. Physiological traits for crop yield improvement in low N and P environments. Plant Soil 2002, 245, 1–15. [Google Scholar] [CrossRef]
  17. Dong, D.; Peng, X.; Yan, X. Organic acid exudation induced by phosphorus deficiency and/or aluminum toxicity in two contrasting soybean genotypes. Physiol. Plant. 2004, 122, 190–199. [Google Scholar] [CrossRef]
  18. Iannucci, A.; Fragasso, M.; Beleggia, R.; Nigro, F.; Papa, R. Evolution of the crop rhizosphere: Impact of domestication on root exudates in tetraploid wheat (Triticum turgidum L.). Front. Plant Sci. 2017, 8, 2124. [Google Scholar] [CrossRef] [Green Version]
  19. McGrail, R.K.; Van Sanford, D.A.; McNear, D.H. Semi-dwarf winter wheat roots contain fewer organic acids than wild type varieties under phosphorus stress. Crop Sci. 2021, 61, 3586–3597. [Google Scholar] [CrossRef]
  20. Vengavasi, K.; Renu, P. Root exudation index: Screening organic acid exudation and phosphorus acquisition efficiency in soybean genotypes. Crop Pasture Sci. 2016, 67, 1096–1109. [Google Scholar] [CrossRef]
  21. Lipton, D.S.; Blanchar, R.W.; Blevins, D.G. Citrate, malate, and succinate concentration in exudates from P-sufficient and P-stressed Medicago sativa L. seedlings. Plant Physiol. 1987, 85, 315–317. [Google Scholar] [CrossRef] [Green Version]
  22. Wang, Y.; Krogstad, T.; Clarke, J.L.; Hallama, M.; Øgaard, A.F.; Eich-Greatorex, S.; Kandeler, E.; Clarke, N. Rhizosphere organic anions play a minor role in improving crop species’ ability to take up residual phosphorus (P) in agricultural soils low in P availability. Front. Plant Sci. 2016, 7, 1664. [Google Scholar] [CrossRef] [PubMed] [Green Version]
  23. Dakora, F.D.; Phillips, D.A. Root exudates as mediators of mineral acquisition in low-nutrient environments. Plant Soil 2002, 245, 35–47. [Google Scholar] [CrossRef]
  24. Ryan, P.R.; James, R.A.; Weligama, C.; Delhaize, E.; Rattey, A.; Lewis, D.C.; Bovill, W.D.; McDonald, G.; Rathjen, T.M.; Wang, E.; et al. Can citrate efflux from roots improve phosphorus uptake by plants? Testing the hypothesis with near-isogenic lines of wheat. Physiol. Plant. 2014, 151, 230–242. [Google Scholar] [CrossRef] [PubMed]
  25. Dotaniya, M.L.; Datta, S.C.; Biswas, D.R.; Meena, B.P. Effect of solution phosphorus concentration on the exudation of oxalate ions by wheat (Triticum aestivum L.). Proc. Natl. Acad. Sci. India Sect. B Biol. Sci. 2013, 83, 305–309. [Google Scholar] [CrossRef] [Green Version]
  26. Dotaniya, M.L.; Datta, S.C.; Biswas, D.R.; Meena, H.M.; Kumar, K. Production of oxalic acid as influenced by the application of organic residue and its effect on phosphorus uptake by wheat (Triticum aestivum L.) in an Inceptisol of North India. Natl. Acad. Sci. Lett. 2014, 37, 401–405. [Google Scholar] [CrossRef] [Green Version]
  27. Hoffland, E.; Findenegg, G.; Nter, R.; Nelemans, J.A. Solubilization of rock phosphate by rape: I. Evaluation of the role of the nutrient uptake pattern. Plant Soil 1989, 113, 155–160. [Google Scholar] [CrossRef]
  28. Asmar, F.; Gahoonia, T.S.; Nielsen, N.E. Barley genotypes differ in activity of soluble extracellular phosphatase and depletion of organic phosphorus in the rhizosphere soil. Plant Soil 1995, 172, 117–122. [Google Scholar] [CrossRef]
  29. Asmar, F. Variation in activity of root extracellular phytase between genotypes of barley. Plant Soil 1997, 195, 61–64. [Google Scholar] [CrossRef]
  30. Richardson, A.E.; Hadobas, P.A.; Hayes, J.E. Acid phosphomonoesterase and phytase activities of wheat (Triticum aestivum L.) roots and utilization of organic phosphorus substrates by seedlings grown in sterile culture. Plant Cell Environ. 2000, 23, 397–405. [Google Scholar] [CrossRef]
  31. McLachlan, K.D.; Marco, D. Acid phosphatase activity of intact roots and phosphorus nutrition in plants. III. Its relation to phosphorus garnering by wheat and a comparison with leaf activity as a measure of phosphorus status. Aust. J. Agric. Res. 1982, 33, 1–11. [Google Scholar] [CrossRef]
  32. Brundrett, M.C. Coevolution of roots and mycorrhizas of land plants. New Phytol. 2002, 154, 275–304. [Google Scholar] [CrossRef] [PubMed]
  33. Schnepf, A.; Roose, T.; Schweiger, P. Growth model for arbuscular mycorrhizal fungi. J. R. Soc. Interface 2008, 5, 773–784. [Google Scholar] [CrossRef] [Green Version]
  34. Pii, Y.; Mimmo, T.; Tomasi, N.; Terzano, R.; Cesco, S.; Crecchio, C. Microbial interactions in the rhizosphere: Beneficial influences of plant growth-promoting rhizobacteria on nutrient acquisition process. A review. Biol. Fertil. Soils 2015, 51, 403–415. [Google Scholar] [CrossRef]
  35. Bakker, M.G.; Manter, D.K.; Sheflin, A.M.; Weir, T.L.; Vivanco, J.M. Harnessing the rhizosphere microbiome through plant breeding and agricultural management. Plant Soil 2012, 360, 1–13. [Google Scholar] [CrossRef]
  36. Koevoets, I.T.; Venema, J.H.; Elzenga, J.T.M.; Testerink, C. Roots withstanding their environment: Exploiting root system architecture responses to abiotic stress to improve crop tolerance. Front. Plant Sci. 2016, 7, 1335. [Google Scholar] [CrossRef] [Green Version]
  37. Lynch, J.P.; Brown, K.M. New roots for agriculture: Exploiting the root phenome. Philos. Trans. R. Soc. Lond. B Biol. Sci. 2012, 367, 1598–1604. [Google Scholar] [CrossRef]
  38. McGrail, R.K.; McNear, D.H. Two centuries of breeding has altered root system architecture of winter wheat. Rhizosphere 2021, 19, 100411. [Google Scholar] [CrossRef]
  39. Van Sanford, D.A.; Clark, A.J.; Bradley, C.; Brown-Guedira, G.L.; Cowger, C.; Dong, Y.; Baik, B.-K. Registration of ‘Pembroke 2016′ soft red winter wheat. J. Plant Regist. 2018, 12, 373–378. [Google Scholar] [CrossRef]
  40. Natural Resource Conservation Service. Crider—Kentucky State Soil. United States Department of Agriculture. Available online: https://mikhailova.org/documents/poster_015.pdf (accessed on 5 May 2021).
  41. Ritchey, E.L.; McGrath, J.M. AGR-1-Lime and Fertilizer Recommendation, 2019–2020; University of Kentucky Agricultural Communications Service: Lexington, KY, USA, 2019; p. 24. [Google Scholar]
  42. Poorter, H.; Bühler, J.; van Dusschoten, D.; Climent, J.; Postma, J.A. Pot size matters: A meta-analysis of the effects of rooting volume on plant growth. Funct. Plant Biol. 2012, 39, 839–850. [Google Scholar] [CrossRef] [Green Version]
  43. Page, M.B.; Smalley, J.L.; Talibudeen, O. The growth and nutrient uptake of winter wheat. Plant Soil 1978, 49, 149–160. [Google Scholar] [CrossRef]
  44. Malhi, S.S.; Johnston, A.M.; Schoenau, J.J.; Wang, Z.H.; Vera, C.L. Seasonal biomass accumulation and nutrient uptake of wheat, barley and oat on a Black Chernozern soil in Saskatchewan. Can. J. Plant Sci. 2006, 86, 1005–1014. [Google Scholar] [CrossRef]
  45. Jones, C.; Olson-Rutz, K.; Dinkins, C.P. Nutrient Uptake Timing by Crops to Assist with Fertilizing Decisions; Montana State University Extension: Bozeman, MT, USA, 2015. [Google Scholar]
  46. Buyer, J.S.; Sasser, M. High throughput phospholipid fatty acid analysis of soils. Appl. Soil Ecol. 2012, 61, 127–130. [Google Scholar] [CrossRef]
  47. Tiessen, H.; Stewart, J.W.B.; Cole, C.V. Pathways of phosphorus transformations in soils of differing pedogenesis. Soil Sci. Soc. Am. J. 1984, 48, 853–858. [Google Scholar] [CrossRef]
  48. Pan, X.; Li, W.; Zhang, Q.; Li, Y.; Liu, M. Assessment on phosphorus efficiency characteristics of soybean genotypes in phosphorus-deficient soils. Agric. Sci. China 2008, 7, 958–969. [Google Scholar] [CrossRef]
  49. Ramette, A. Multivariate analyses in microbial ecology. FEMS Microbiol. Ecol. 2007, 62, 142–160. [Google Scholar] [CrossRef] [Green Version]
  50. Benjamini, Y.; Hochberg, Y. Controlling the false discovery rate: A practical and powerful approach to multiple testing. J. R. Stat. Soc. Ser. B 1995, 57, 289–300. [Google Scholar] [CrossRef]
  51. Manske, G.G.B.; Ortiz-Monasterio, J.I.; Van Ginkel, M.; González, R.M.; Rajaram, S.; Molina, E.; Vlek, P.L.G. Traits associated with improved P-uptake efficiency in CIMMYT’s semidwarf spring bread wheat grown on an acid Andisol in Mexico. Plant Soil 2000, 221, 189–204. [Google Scholar] [CrossRef]
  52. Jones, G.P.D.; Jessop, R.S.; Blair, G.J. Alternative methods for the selection of phosphorus efficiency in wheat. Field Crops Res. 1992, 30, 29–40. [Google Scholar] [CrossRef]
  53. Ozturk, L.; Eker, S.; Torun, B.; Cakmak, I. Variation in phosphorus efficiency among 73 bread and durum wheat genotypes grown in a phosphorus-deficient calcareous soil. Plant Soil 2005, 269, 69–80. [Google Scholar] [CrossRef]
  54. Hetrick, B.A.D.; Wilson, G.W.T.; Cox, T.S. Mycorrhizal dependence of modern wheat varieties, landraces, and ancestors. Can. J. Bot. 1992, 70, 2032–2040. [Google Scholar] [CrossRef]
  55. Tang, X.; Placella, S.A.; Daydé, F.; Bernard, L.; Robin, A.; Journet, E.-P.; Justes, E.; Hinsinger, P. Phosphorus availability and microbial community in the rhizosphere of intercropped cereal and legume along a P-fertilizer gradient. Plant Soil 2016, 407, 119–134. [Google Scholar] [CrossRef]
  56. Shen, P.; Murphy, D.V.; George, S.J.; Lapis-Gaza, H.; Xu, M.; Gleeson, D.B. Increasing the size of the microbial biomass altered bacterial community structure which enhances plant phosphorus uptake. PLoS ONE 2016, 11, e0166062. [Google Scholar] [CrossRef] [Green Version]
  57. Shi, S.; Richardson, A.E.; O’Callaghan, M.; DeAngelis, K.M.; Jones, E.E.; Stewart, A.; Firestone, M.K.; Condron, L.M. Effects of selected root exudate components on soil bacterial communities. FEMS Microbiol. Ecol. 2011, 77, 600–610. [Google Scholar] [CrossRef] [PubMed] [Green Version]
  58. Zhalnina, K.; Louie, K.B.; Hao, Z.; Mansoori, N.; Da Rocha, U.N.; Shi, S.; Cho, H.; Karaoz, U.; Loqué, D.; Bowen, B.P.; et al. Dynamic root exudate chemistry and microbial substrate preferences drive patterns in rhizosphere microbial community assembly. Nat. Microbiol. 2018, 3, 470–480. [Google Scholar] [CrossRef] [PubMed] [Green Version]
  59. Wen, T.; Yu, G.-H.; Hong, W.-D.; Yuan, J.; Niu, G.-Q.; Xie, P.-H.; Sun, F.-S.; Guo, L.-D.; Kuzyakov, Y.; Shen, Q.-R. Root exudate chemistry affects soil carbon mobilization via microbial community reassembly. Fundam. Res. 2022, 2, 697–707. [Google Scholar] [CrossRef]
  60. Gadd, G.M. Fungal production of citric and oxalic acid: Importance in metal speciation, physiology and biogeochemical processes. Adv. Microb. Physiol. 1999, 41, 47–92. [Google Scholar] [CrossRef]
  61. Bonkowski, M. Protozoa and plant growth: The microbial loop in soil revisited. New Phytol. 2004, 162, 617–631. [Google Scholar] [CrossRef]
  62. Bonkowski, M.; Clarholm, M. Stimulation of plant growth through interactions of bacteria and protozoa: Testing the auxiliary microbial loop hypothesis. Acta Protozool. 2012, 51, 237–247. [Google Scholar] [CrossRef]
  63. Bonkowski, M.; Griffiths, B.; Scrimgeour, C. Substrate heterogeneity and microfauna in soil organic ‘hotspots’ as determinants of nitrogen capture and growth of ryegrass. Appl. Soil Ecol. 2000, 14, 37–53. [Google Scholar] [CrossRef]
  64. Oliverio, A.M.; Geisen, S.; Delgado-Baquerizo, M.; Maestre, F.T.; Turner, B.L.; Fierer, N. The global-scale distributions of soil protists and their contributions to belowground systems. Sci. Adv. 2020, 6, e8787. [Google Scholar] [CrossRef] [Green Version]
  65. Deng, Y.; Teng, W.; Tong, Y.-P.; Chen, X.-P.; Zou, C.-Q. Phosphorus efficiency mechanisms of two wheat cultivars as affected by a range of phosphorus levels in the field. Front. Plant Sci. 2018, 9, 1614. [Google Scholar] [CrossRef] [PubMed]
  66. Hedley, M.J.; Stewart, J.W.B. Method to measure microbial phosphate in soils. Soil Biol. Biochem. 1982, 14, 377–385. [Google Scholar] [CrossRef]
  67. Ström, L.; Owen, A.G.; Godbold, D.L.; Jones, D.L. Organic acid behaviour in a calcareous soil implications for rhizosphere nutrient cycling. Soil Biol. Biochem. 2005, 37, 2046–2054. [Google Scholar] [CrossRef]
  68. Keiluweit, M.; Bougoure, J.J.; Nico, P.S.; Pett-Ridge, J.; Weber, P.K.; Kleber, M. Mineral protection of soil carbon counteracted by root exudates. Nat. Clim. Change 2015, 5, 588–595. [Google Scholar] [CrossRef] [Green Version]
  69. Sokol, N.W.; Sanderman, J.; Bradford, M.A. Pathways of mineral-associated soil organic matter formation: Integrating the role of plant carbon source, chemistry, and point of entry. Glob. Change Biol. 2019, 25, 12–24. [Google Scholar] [CrossRef] [Green Version]
  70. Cross, A.F.; Schlesinger, W.H. A literature review and evaluation of the Hedley fractionation: Applications to the biogeochemical cycle of soil phosphorus in natural ecosystems. Geoderma 1995, 64, 197–214. [Google Scholar] [CrossRef]
  71. Gérard, F. Clay minerals, iron/aluminum oxides, and their contribution to phosphate sorption in soils—A myth revisited. Geoderma 2016, 262, 213–226. [Google Scholar] [CrossRef]
  72. Klotzbücher, A.; Kaiser, K.; Klotzbücher, T.; Wolff, M.; Mikutta, R. Testing mechanisms underlying the Hedley sequential phosphorus extraction of soils. J. Plant Nutr. Soil Sci. 2019, 182, 570–577. [Google Scholar] [CrossRef]
  73. Boudiar, R.; González, J.M.; Mekhlouf, A.; Casas, A.M.; Igartua, E. Durum wheat seminal root traits within modern and landrace germplasm in Algeria. Agronomy 2020, 10, 713. [Google Scholar] [CrossRef]
  74. Figueroa-Bustos, V.; Palta, J.A.; Chen, Y.; Siddique, K.H.M. Characterization of root and shoot traits in wheat cultivars with putative differences in root system size. Agronomy 2018, 8, 109. [Google Scholar] [CrossRef] [Green Version]
  75. Qin, X.; Feng, F.; Wen, X.; Siddique, K.H.M.; Liao, Y. Historical genetic responses of yield and root traits in winter wheat in the yellow-Huai-Hai River valley region of China due to modern breeding (1948–2012). Plant Soil 2019, 439, 7–18. [Google Scholar] [CrossRef]
  76. Libert, B.; Franceschi, V.R. Oxalate in crop plants. J. Agric. Food Chem. 1987, 35, 926–938. [Google Scholar] [CrossRef]
  77. Tu, S.-X.; Guo, Z.-F.; Sun, J.-H. Effect of oxalic acid on potassium release from typical Chinese soils and minerals. Pedosphere 2007, 17, 457–466. [Google Scholar] [CrossRef]
  78. Wang, J.G.; Zhang, F.S.; Zhang, X.L.; Cao, Y.P. Release of potassium from K-bearing minerals: Effect of plant roots under P deficiency. Nutr. Cycl. Agroecosyst. 2000, 56, 45–52. [Google Scholar] [CrossRef]
  79. Wang, H.-Y.; Shen, Q.-H.; Zhou, J.-M.; Wang, J.; Du, C.-W.; Chen, X.-Q. Plants use alternative strategies to utilize nonexchangeable potassium in minerals. Plant Soil 2011, 343, 209–220. [Google Scholar] [CrossRef]
  80. Karathanasis, A.D.; Wells, K.L. Conservation tillage effects on the potassium status of some Kentucky soils. Soil Sci. Soc. Am. J. 1990, 54, 800–806. [Google Scholar] [CrossRef]
  81. McGrail, R.K.; Van Sanford, D.A.; McNear, D.H. Trait-based root phenotyping as a necessary tool for crop selection and improvement. Agronomy 2020, 10, 1328. [Google Scholar] [CrossRef]
Figure 1. Phosphorus utilization efficiency (PUtE; g total biomass g−1 total P) and root P acquisition efficiency (RPAE; mg total P g−1 root biomass) between the hypothesized PEP classes (n = 15, 5, 15, 15, respectively, per condition) grown with sufficient or insufficient P. Boxes for each parameter not sharing the same uppercase (sufficient P) or lowercase (insufficient P) letter were significantly different (Tukey’s HSD, p < 0.05).
Agronomy 13 00813 g001
Figure 2. Resin-available rhizosphere P (mg kg−1 soil) and bicarbonate-extractable rhizosphere P (mg kg−1 soil) between the wild-type (n = 30 per condition) and semi-dwarf wheat cultivars (n = 20 per condition) and between the old (n = 30 per condition) and modern (n = 20 per condition) cultivars grown with sufficient or insufficient P. Boxes for each parameter not sharing the same uppercase (sufficient P) or lowercase (insufficient P) letter were significantly different (Tukey’s HSD, p < 0.05).
Agronomy 13 00813 g002
Figure 3. Nonmetric multidimensional scaling (NMDS) ordination biplots of Hellinger transformed microbial biomarker group FAMEs showing the separation in microbial communities based on the hypothesized PEP classification in sufficient (+P) and insufficient (−P) conditions. The NMDS resulted in a 3D solution with only the two dominant axes being shown, which cumulatively explained 90% (+P) and 84% (−P) of the overall variance in the dataset. Ellipses show the significant separation in microbial communities based on results from the multiple regression permutation procedure (MRPP). PLFA biomarker group concentrations with r2 > 0.30 between the variable and axis score are displayed as vectors. Vectors indicate strength (length of arrow) and direction of graphed relationships.
Agronomy 13 00813 g003
Table 1. Wheat cultivars selected for this study with previous organic acid (OA) [19] and root system architecture (RSA) [38] study classifications.
CultivarYear ReleasedEraDwarfing StatusOA Potential ClassRSA Potential ClassPEP Class
Goens1808oldwild-typehighlarge1
Red May1830oldwild-typehighlarge1
Blackhull1917oldwild-typehighlarge1
Norin-101935oldsemi-dwarflowlarge2
Nicoma1971modernwild-typehighsmall3
Baca1973modernwild-typehighsmall3
Prowers1997modernwild-typehighsmall3
Lindon1975modernsemi-dwarflowsmall4
Akron1994modernsemi-dwarflowsmall4
Ankor2002modernsemi-dwarflowsmall4
Table 2. Average (least squares means ± one standard error) P utilization efficiency (PUtE) and root P acquisition efficiency (RPAE) by the PEP classification under sufficient or insufficient soil P. Parameters not sharing the same uppercase (sufficient P) or lowercase (insufficient P) letter were significantly different (Tukey’s HSD, p < 0.05).
Sufficient PInsufficient P
PEP ClassPUtERPAEPUtERPAE
Class 1897 ± 136 A9 ± 13 A259 ± 23 a41 ± 14 a
Class 2412 ± 235 A44 ± 19 A148 ± 41 ab24 ± 25 a
Class 3818 ± 140 A13 ± 13 A204 ± 24 ab29 ± 15 a
Class 4539 ± 146 A23 ± 13 A147 ± 23 b68 ± 14 a
Table 3. Two-way ANOVA results for the significant explanatory parameters of P utilization efficiency (PUtE) and root P acquisition efficiency (RPAE) by dwarfing status and era of release under sufficient or insufficient soil P. A complete listing of ANOVA results for all variables can be found in Table S2.
Sufficient PInsufficient P
Dwarfing StatusEraDwarfing StatusEra
F-Valuep-ValueF-Valuep-ValueF-Valuep-ValueF-Valuep-Value
Plant Growth Metrics
Growth Stage0.530.47023.010.08924.290.044011.80.0017
Main Stem Height12.530.00090.500.48108.850.00471.770.1902
Number of Heads0.060.80853.720.06011.490.22865.860.0196
Shoot Mass5.700.02120.200.65621.150.28940.960.3327
Nutrient Concentration (mg kg−1)
Shoot K0.150.69702.580.11514.590.03745.520.0231
Shoot Mg0.960.332212.820.00085.760.02056.410.0148
Shoot P11.270.00160.010.927511.620.00142.580.1147
Root Al4.870.03282.930.09400.650.42280.090.7675
Root Fe5.570.02294.750.03490.540.46630.000.9905
Total Nutrient Content (mg)
Shoot Ca7.390.00920.000.97952.760.10371.420.2402
Shoot K5.850.01950.090.76742.770.10293.260.0776
Shoot Al4.600.03730.450.50373.280.07670.670.4156
Shoot Fe7.670.00810.610.43983.090.08535.290.0261
Sufficient PInsufficient P
Dwarfing StatusEraDwarfing StatusEra
F-valuep-valueF-valuep-valueF-valuep-valueF-valuep-value
Shoot Mg4.410.04130.670.41650.300.58473.060.0867
Shoot Mn4.620.03700.030.85850.920.34172.270.1391
Root K0.810.37182.550.11760.097.5984.340.0428
Bulk Soil Physicochemical Parameters
P5.170.02780.010.92231.450.23441.860.1798
K7.640.00820.960.33171.060.30871.910.1734
Mg0.100.75350.910.34424.210.04600.060.8071
Mn1.190.281710.830.00190.060.80702.930.0939
Rhizosphere Soil Inorganic P Fractions
Resin P0.130.72510.020.87980.510.47985.420.0243
Bicarbonate P0.440.50930.150.70096.480.01430.040.8452
Rhizosphere Soil Microbial Biomass
G+ Bacteria10.900.00190.130.72225.050.02950.060.8035
G- Bacteria0.080.77357.090.01060.090.78922.480.1218
Actinobacteria2.760.10356.510.01410.190.66343.430.0706
Protists5.430.02421.630.20836.960.01130.090.7694
Table 4. Average (least squares means ± one standard error) Mehlich-III extractable oxides associated with P-sorption by dwarfing status and cultivar era from soil with sufficient or insufficient P. Parameters not sharing the same uppercase (sufficient P) or lowercase (insufficient P) letter were significantly different (Tukey’s HSD, p < 0.05).
Sufficient PInsufficient P
Wild-TypeSemi-DwarfWild-TypeSemi-Dwarf
Mg (mg kg−1)117 ± 2 A118 ± 3 A119 ± 1 a114 ± 2 b
Fe (mg kg−1)84 ± 5 A77 ± 6 A103 ± 6 a97 ± 7 a
Al (mg kg−1)716 ± 9 A723 ± 12 A762 ± 9 a743 ± 12 a
OldModernOldModern
Mg (mg kg−1)119 ± 3 A115 ± 2 A117 ± 2 a116 ± 1 a
Fe (mg kg−1)75 ± 6 A87 ± 5 A95 ± 7 a104 ± 6 a
Al (mg kg−1)714 ± 12 A725 ± 9 A741 ± 12 a764 ± 9 a
Disclaimer/Publisher’s Note: The statements, opinions and data contained in all publications are solely those of the individual author(s) and contributor(s) and not of MDPI and/or the editor(s). MDPI and/or the editor(s) disclaim responsibility for any injury to people or property resulting from any ideas, methods, instructions or products referred to in the content.

