Article

Weed Detection and Mapping of a Coffee Farm by a Remotely Piloted Aircraft System

by
Nicole Lopes Bento
1,
Gabriel Araújo e Silva Ferraz
1,*,
Jhones da Silva Amorim
2,
Lucas Santos Santana
1,
Rafael Alexandre Pena Barata
1,
Daniel Veiga Soares
1 and
Patrícia Ferreira Ponciano Ferraz
1
1
Department of Agricultural Engineering, School of Engineering, Federal University of Lavras—UFLA, Trevo Rotatório Professor Edmir Sá Santos, s/n, P.O. Box 3037, Lavras 37200-900, Brazil
2
Academic Unit Specialized in Agricultural Sciences, Agricultural School of Jundiaí, Federal University of Rio Grande do Norte, RN 160, Km 03, District of Jundiaí, P.O. Box 07, Macaíba 59280-000, Brazil
*
Author to whom correspondence should be addressed.
Agronomy 2023, 13(3), 830; https://doi.org/10.3390/agronomy13030830
Submission received: 10 February 2023 / Revised: 9 March 2023 / Accepted: 10 March 2023 / Published: 12 March 2023
(This article belongs to the Special Issue Coffee—from Plant to Cup)

Abstract

:
The differentiation between the main crop and weeds is an important step for selective spraying systems to avoid agrochemical waste and reduce economic and environmental impacts. In this sense, this study aims to classify and map the area occupied by weeds, determine the percentage of area occupied, and indicate treatment control strategies to be adopted in the field. This study was conducted by using a yellow Bourbon cultivar (IAC J10) with 1 year of implementation on a commercial coffee plantation located at Minas Gerais, Brazil. The aerial images were obtained by a remotely piloted aircraft (RPA) with an embedded multispectral sensor. Image processing was performed using PIX4D, and data analysis was performed using R and QGIS. The random forest (RF) and support vector machine (SVM) algorithms were used for the classification of the regions of interest: coffee, weed, brachiaria, and exposed soil. The differentiation between the study classes was possible due to the spectral differences between the targets, with better classification performance using the RF algorithm. The savings gained by only treating areas with the presence of weeds compared with treating the total study area are approximately 92.68%.

1. Introduction

Brazil is currently the largest producer, exporter, and consumer of coffee in the world and the country is responsible for approximately 47% of the world’s coffee production, and based on forecasts for the 2023 harvest, a good productivity margin, totaling 54.94 million bags of 60 kg, is expected for exports [1]. Among the cultivated species, Coffea arabica L. is the coffee most appreciated by consumers and therefore has great economic value. Due to the importance of this commodity in the Brazilian trade balance, scientific studies are encouraged to solve the problems encountered in the field. Thus, improvements are suggested, aiming at the optimization and profitability of coffee plantations.
To enhance the yield and decrease the cost of coffee crops, the correction and adaptation of problems encountered in the field are sought, and the efficient and timely control of weeds is a critical task in agricultural production, since the inadequate management of plant weeds reduces the yield of the main crop and increases the negative impacts on the environment [2]. Agrochemicals represent a considerable part of the cost of a crop, and the traditional methods of blanket spraying promote great waste because there is no selectivity at the time of application [3]. In this sense, the mapping and detection of weeds through precision agriculture technologies allows greater economic and environmental sustainability. This technique can contribute to reducing environmental impacts by identifying specific areas for spraying agrochemicals [4]. In addition, the use of computer techniques and technologies combined with the agricultural problem allow the reduction in human work in the field, mainly when identifying weed spots in the crop lines and between the plants in the crop line [5].
In coffee crops, weeds, when poorly controlled, are in direct competition with coffee plants for water, light, and nutrients. Among the invasive species, the species morning glory (Ipomea sp.) belongs to the Convolvulaceae family, which includes more than 350 species distributed in 18 genera [6]. Morning glory are fast-growing climbing plants that inhabit the most varied environments, with heights ranging from 1 to 3 m [7]. This species can also cause damage to harvests since its branches are intertwined with the plants of interest, affecting the performance of agricultural harvesting machines as well as manual harvesting, which compromises the yield and efficiency of these processes [8]. It is therefore necessary to identify the different types of weeds that are harmful to the crop and the control mechanism for weeds [9].
Technological advancements have introduced a promising data acquisition approach in the field using proximal aerial platforms such as remotely piloted aircraft (RPA). The advantages of RPA in relation to satellite platforms have been described by several authors who highlighted the possibilities of coupling different sensors using lightweight batteries with a long life and optimizing the coverage of a large area with higher spatial resolution in a short time. This is presented as an important requirement for the mapping of weeds by the detection of small objects, consolidating itself as a new means of obtaining spatial, spectral, and temporal quality parameters [10,11].
Remote sensing technologies combined with machine learning methods can contribute to the identification of weeds in coffee plantations. In the literature, the main methods applied for weed identification using RPA images are based on algorithms combined with classification tools and spectral characterization. In this process, the pixels are segmented and classified according to their reflectance values [12,13]. Machine learning algorithms allow land cover mapping, which has become frequently used due to the applicability of different sensors, yielding better results than other commonly used classifiers [14]. Among these algorithms, random forest (RF) [15] and support vector machine (SVM) [16] have great flexibility and are widely applied for spectral classifications. Therefore, they allow the generation of land cover maps affected by spectral patterns, which enable the identification and study of the spatial distribution of weed infestation, making it possible to develop treatment maps with different application demands according to the distribution of the plants in the crop, which has economic and ecological implications. It is also noteworthy that machine and deep learning-based crop and weed identification systems have the potential to save money and, at the same time, reduce environmental stress [17].
The mapping of weeds based on aerial images obtained by RPA is incipient, since there are few studies with this theme, especially for coffee crops. Weed mapping studies have been performed in cereals [18], corn fields [19], sunflower fields [20], and wheat and barley [21]. Furthermore, regarding the use of RPA to carry out aerial imaging for management recommendations in agricultural areas, its use for the localized spraying of agrochemicals stands out [22]. The advantages include a lower payload capacity, performing spraying on time [23], reducing health-related problems by reducing the number of workers and workload [24], and also promoting lower environmental impacts due to the application occurring in a localized and specific way [25].
In this context, the objective of this study is to use RPA for the diagnosis of an area and to map coffee plantations containing weeds (morning glory, Ipomea sp.) through classification algorithms, demonstrating the applicability of the procedure as well as the implementation of strategic control through selective spraying in coffee plantations.

2. Materials and Methods

2.1. Study Area

The study area is the Samambaia Farm, which is located in the municipality of Santo Antônio do Amparo, Zona Campos das Vertentes, Minas Gerais (MG) state, between the meridians 507,000 and 507,100 m W and parallels 7,691,400 and 7,691,500 m S in the UTM projection zone 23S and Sirgas 2000 geodesic reference (Figure 1). The municipality is located in the Atlantic Forest Biome with Dystrophic Red–Yellow Latosol [26] and a subtropical rainy climate with a temperate, dry winter, and warm summer (Cwb) according to the Köppen classification [27].
The experiment is characterized by an area of the coffee plantation (Coffea arabica L.) planted in November 2018, one year prior to data collection. The planted cultivar is Yellow Bourbon (IAC J10) as registered in the National Cultivar Registry (NCR) of the Ministry of Agriculture, Livestock, and Supply [28]. The area has a spacing of 3.8 m between rows, 0.5 m in the planting row, an average altitude of 1022.00 m above sea level, and the presence of brachiaria (Brachiaria decumbens) between the rows.

2.2. Collection of Aerial Data

Aerial imaging was collected based on two flights on 13 December 2019 by a remotely piloted aircraft, Matrice 100 (DJI, Shen Zhen, China), equipped with a multispectral camera (Parrot Sequoia, MicaSense, Seattle, WA, USA) and an irradiance sensor (S sunshine sensor) with reflectance values described in the green (GRE 530–570 nm), red (RED 640–680 nm), borderline red (REG 730–740 nm), near infrared (NIR 770–810 nm), and visible (RGB 380–720 nm) spectral bands (Figure 2). The orthomosaics generated in the first flight were used for training and validation of the model and the orthomosaics generated in the second flight were used to predict the distributions of the study classes and thus proceed with subsequent studies and recommendations.
The flight plan was generated using Precision Flight software (Precision Hawk, Raleigh, NC, USA) with parameters defined as follows: above ground level (AGL) distance of 50 m, flight speed of 8 m/s, with forward and side overlap of 80% and 80%, respectively, and a flight direction transverse to the planting row. The flight had a standardized schedule between 11:00 am and 1:00 pm, so there was no shading influence. The radiometric calibration of the images was performed using a calibration plate from the manufacturer of the sensor used to capture the images.

2.3. Image Processing

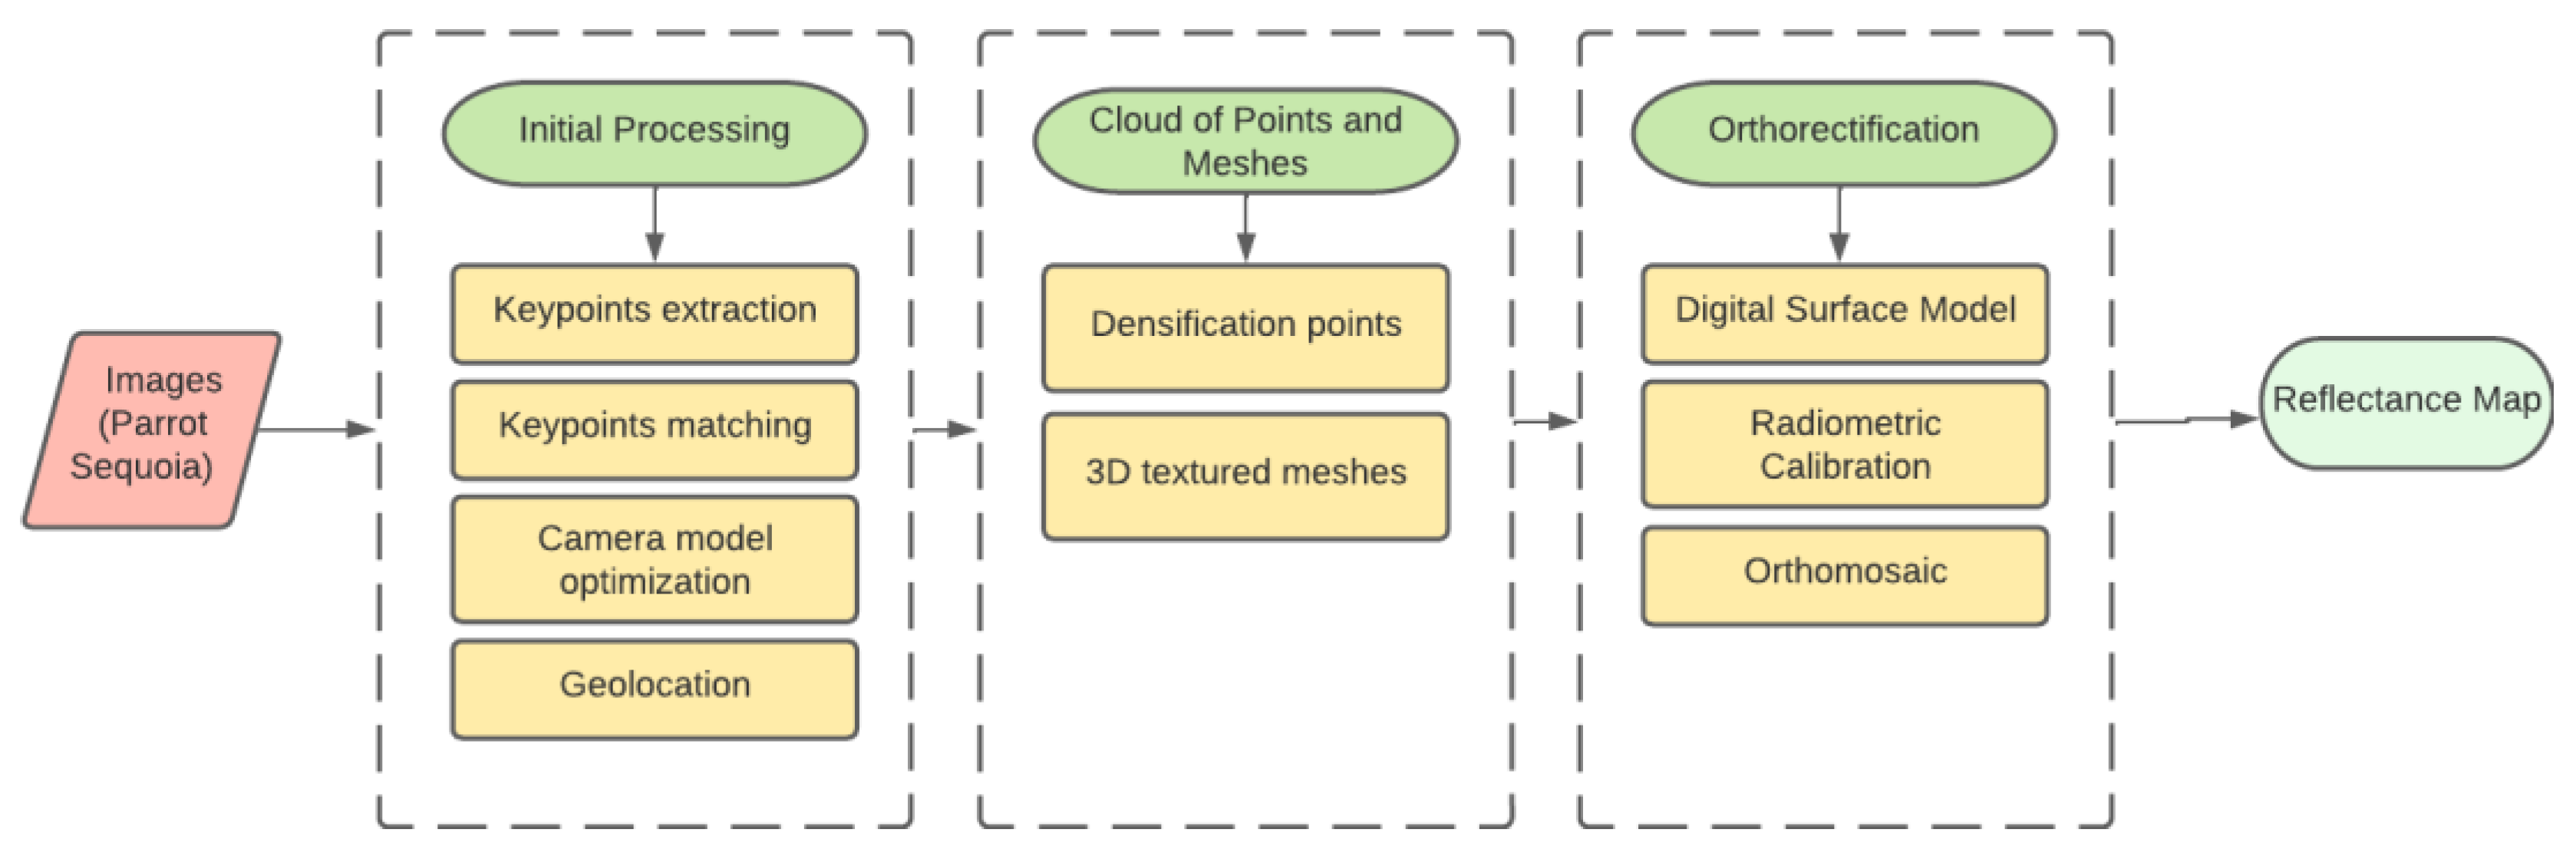
Aerial image processing was performed using Pix4D Mapper version 4.4.12 (Pix4D, Lausanna, Switzerland), and the orthomosaic product generated for each spectral band is related to the sensor used. The processing workflow consists of three different steps: initial processing, mesh/point cloud generation, and orthorectification as described in Figure 3.
The image processing software used is based on the detection of keypoints, which refer to the computer vision technique to locate key parts of objects in an image, that is, the keypoints refer to each characteristic point found in an image. Thus, in the first stage, specific image features (keypoints) were identified, these keypoints were found and combined, the internal and external parameters of the sensor were calibrated, and finally, the geolocation information of the collected images was determined. The tie points are automatically created during this stage. In the second stage, densified points were created; that is, more tie points are created on top of the existing ones to create a densified point cloud, and the 3D textured mesh was also created based on the densified point cloud. In summary, keypoints refer to the characteristic points of the image, tie points are points generated after connecting points with similar characteristics (keypoints), and densified points are the creation of a greater number of points to represent the terrain.
The orthomosaic consists of joining several images to form a single image based on the process of orthorectification, a method in which the perspective distortions of the images are removed. This way, in the third stage, the orthomosaics of each spectral band of the sensor (in this case, the RGB bands and individual GRE, RED, REG, and NIR bands) are created, in which the value of each pixel indicates the reflectance of the imaged object.

2.4. Classification Method (Training and Validation)

The training and validation steps are shown in Figure 4 and consist of (a) preprocessing and exploratory data analysis; (b) sampling of the classes of interest using orthomosaic images; (c) classification procedure using support vector machine (SVM) and random forest (RF) algorithms; (d) validation and verifying the performance of the SVM and RF classifiers; and (e) applying the best classifier in the prediction of the total area and the identification of the percentage of occupation of each class of study, with procedures performed in the QGis 3.22.8 (QGIS Development Team, Open-Source Geospatial Foundation) and R Studio (R Development Core Team, R project, Austria, Vienna) software.
In the classification process, four classes of interest were established: coffee, weed (morning glory), brachiaria, and exposed soil. The training samples of the classes of interest were selected based on the interpretation of the high-resolution orthomosaic image produced by the images collected by the RPA. For each class, a training shapefile with regions of interest (ROIs) was obtained, and a total of 650 samples were generated and distributed as follows: coffee (n = 150); weed (n = 150); soil (n = 200); and brachiaria (n = 150). Sample collection was performed using QGIS 3.22.8 with the Semi-Automatic Classification Plugin (SCP). Due to the spatial quality of the generated orthomosaic image, it cannot be assumed that a set of pixels that includes the sampled shapefile represents each class of interest. Thus, the points corresponding to all pixels belonging to ROIs for each study class were used as samples, increasing the number of samples (total of 8284 samples) with a procedure performed in R Studio. In summary, the samples were initially collected in shapefile format (650 samples), and then the rasters referring to each spectral band were extracted pixel-by-pixel from the contours of the shapefile, thus increasing the number of training samples (8284 samples) and improving the classification quality by increasing the number of samples for evaluation. The spectral signatures of each class of interest were generated by the ROIs using QGIS 3.22.8 to characterize the behavior of the reflectance of the pixels in each spectral range of the study.
Subsequently, using R, these samples were randomly divided into training and validation samples in proportions of 70% and 30%, respectively, with 5799 training samples and 2485 validation samples. Classification using the training samples was based on separation information from the reflectance spectrum using the SVM [29] and RF [15] classifiers in R. For SVM classification, the polynomial kernel function was applied, and for RF classification, the number of decision trees (Ntree) equal to 100 and the number of variables to be tested (Mtry), corresponding to the square root of the number of input variables, were defined [30]. For RF classification, the analysis of the Gini index was also applied, allowing the importance of each input variable of the algorithm for the classification process to be described. According to the application of the analysis via Mean Decrease in Gini, variables that present nodes with greater classification purity will have higher values and, therefore, have greater importance in the classification algorithm widely used in analyses of this type [31,32].
The data were validated based on the validation sample percentage with direct comparison to the reference data (training samples). The performance evaluation and classification quality of each algorithm were obtained through information derived from the confusion matrix using the overall accuracy, producer accuracy, user accuracy, and external metrics F1 score metrics [33], as well as the area under the ROC curve and kappa index [34].
The classifier algorithm with the best performance metrics was used to predict the total area and to identify the percentage of occupied area for each study class. Based on the information from the classifier, the prediction map of the classes of study was generated (location and percentages of area occupied by each class of study) using the QGis 3.22.8 software. This map makes it possible to identify the presence of weed occupation in the field and thus proceed with management based on the localized application of agrochemicals only in the compromised areas by weeds.
The analysis of the costs involved in the process of weed control was also performed, considering for this the current price quote of the weed control product in question, in this study the product HEAT (Saflufenacil), and considering the spray volume to be used only in areas with weeds versus the spray volume to be used in the total area (conventional application). Thus, the effect of savings was highlighted by showing the financial costs that would be spent for the application of agrochemicals in the total area versus the financial costs spent for the application of agrochemicals, considering only the application in areas occupied by weeds.

3. Results

3.1. Overall Classifier Accuracy

The results of the overall accuracy, kappa index, F1 score, and area under the ROC curve of the classifications using the RF and SVM algorithms are presented in Table 1 (results considering all classes of study). In general, satisfactory values of the analyzed metrics, which indicate good classifier performance for the differentiation of the study classes, were achieved using both algorithms. However, it should be emphasized that the values obtained using the RF algorithm were higher than those using the SVM algorithm.
The results for the classification algorithms were validated by means of confusion matrices, as shown in Table 2 for the RF algorithm and Table 3 for the SVM algorithm (results considering the study classes individually). As previously demonstrated by the satisfactory values of the performance metrics, few errors between the classified thematic classes were observed through the confusion matrices of both classification algorithms (Table 2 and Table 3). For both classifiers, the class with the greatest confusion, according to analysis via confusion matrix, was the exposed soil; this class has higher values of sampled pixels, which also result in an increase in errors. However, the errors were minimal and did not compromise the statistical results of the classification performance.
User accuracy are the estimates of fractions of mapping pixels, for each class, correctly classified, whereas producer accuracy are the sample fractions of pixels of each class correctly assigned to their classes by the classifiers [35]. In this regard, analyzing the discrimination between the thematic classes through the producer and user accuracies (Figure 5), similar behaviors for the algorithms, with good discrimination of the study classes, are evident. Based on Figure 5A, satisfactory results are observed for the average producer accuracy, with higher hits for the brachiaria class and a slight superiority of the RF algorithm when compared with the SVM algorithm. In turn, based on Figure 5B, satisfactory results are also observed for the average user accuracy, with high hits for the brachiaria and weed classes, and again a slight superiority of the RF algorithm when compared with the SVM algorithm. For the producer and user accuracies of both algorithms, the class with the lowest hit rate was that of coffee plants. However, with values greater than 95%, which indicate satisfactory values for this metric, the applicability of the algorithms for all classes of study is demonstrated.

3.2. Mapping and Quantification of the Study Classes

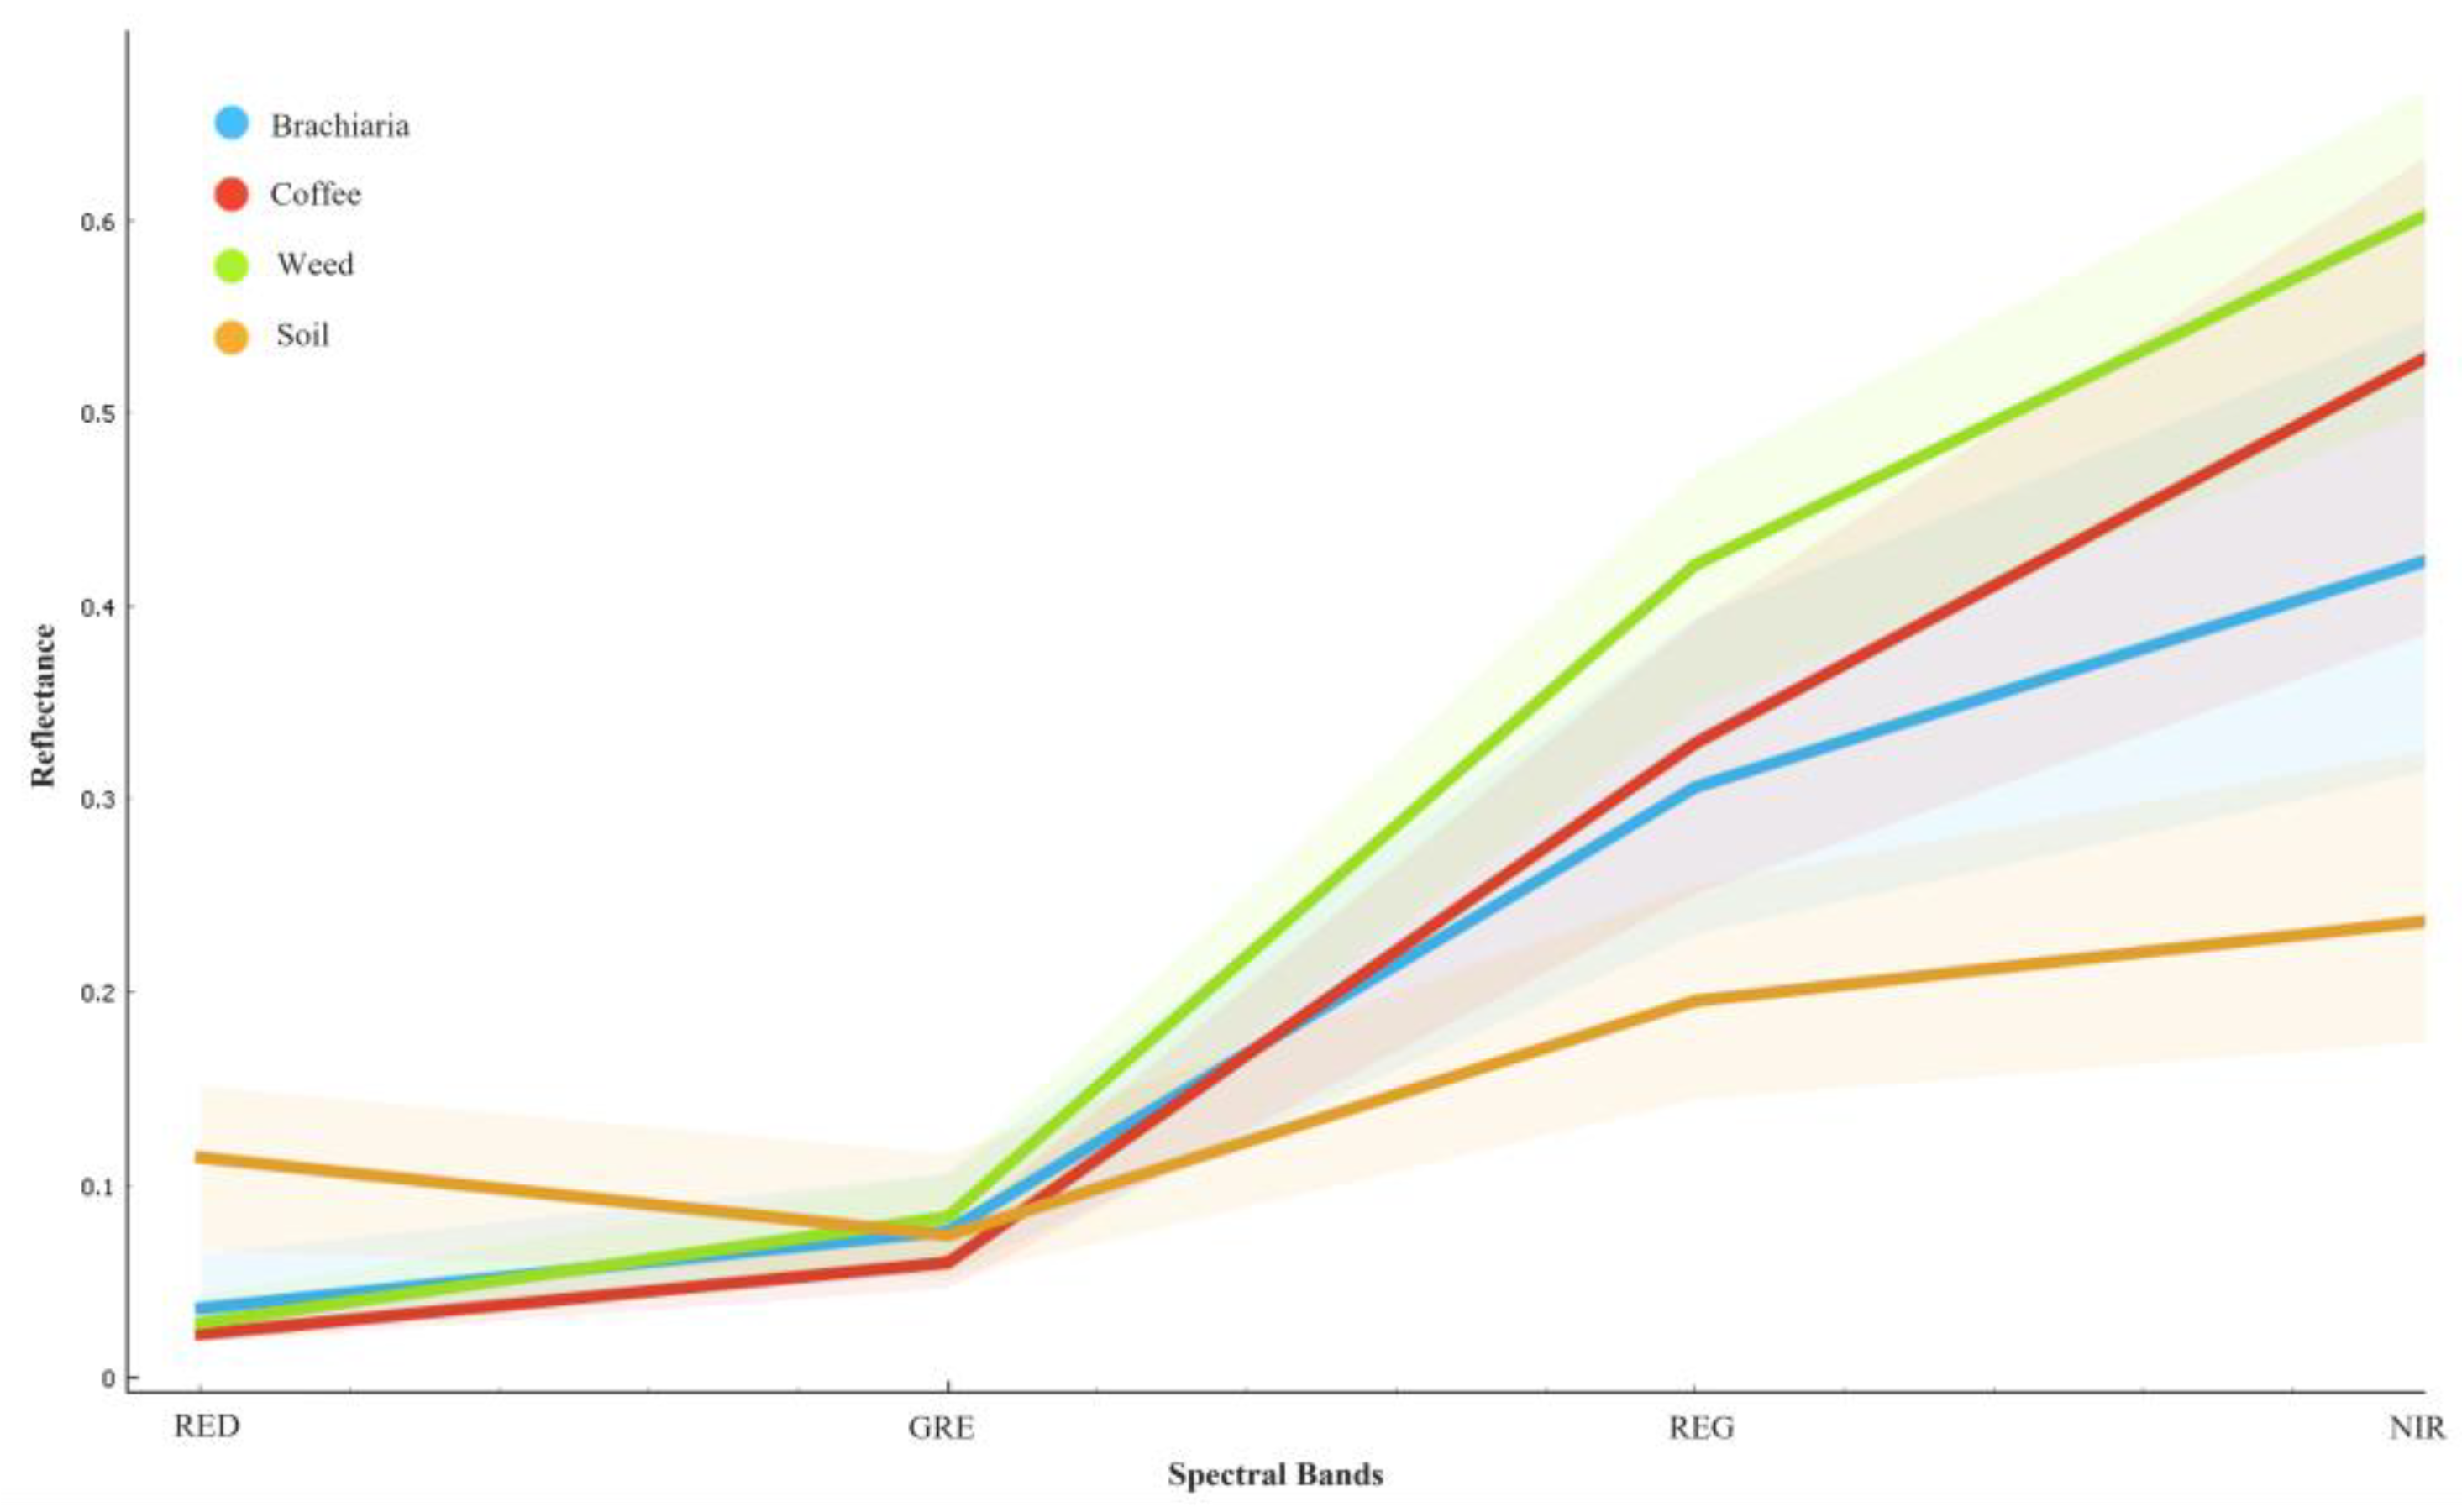
From the RF classifier, which yielded superior performance metrics, it was possible to describe the importance of each variable for the classification process through the Mean Decrease in Gini (Figure 6). Thus, it was noted that the variable of the NIR spectral band had the greatest importance for the classification, followed by the REG and RED spectral bands, and the least importance for the classification was the GRE spectral band, which is also highlighted in the spectral signatures of the study classes, according to Figure 7.
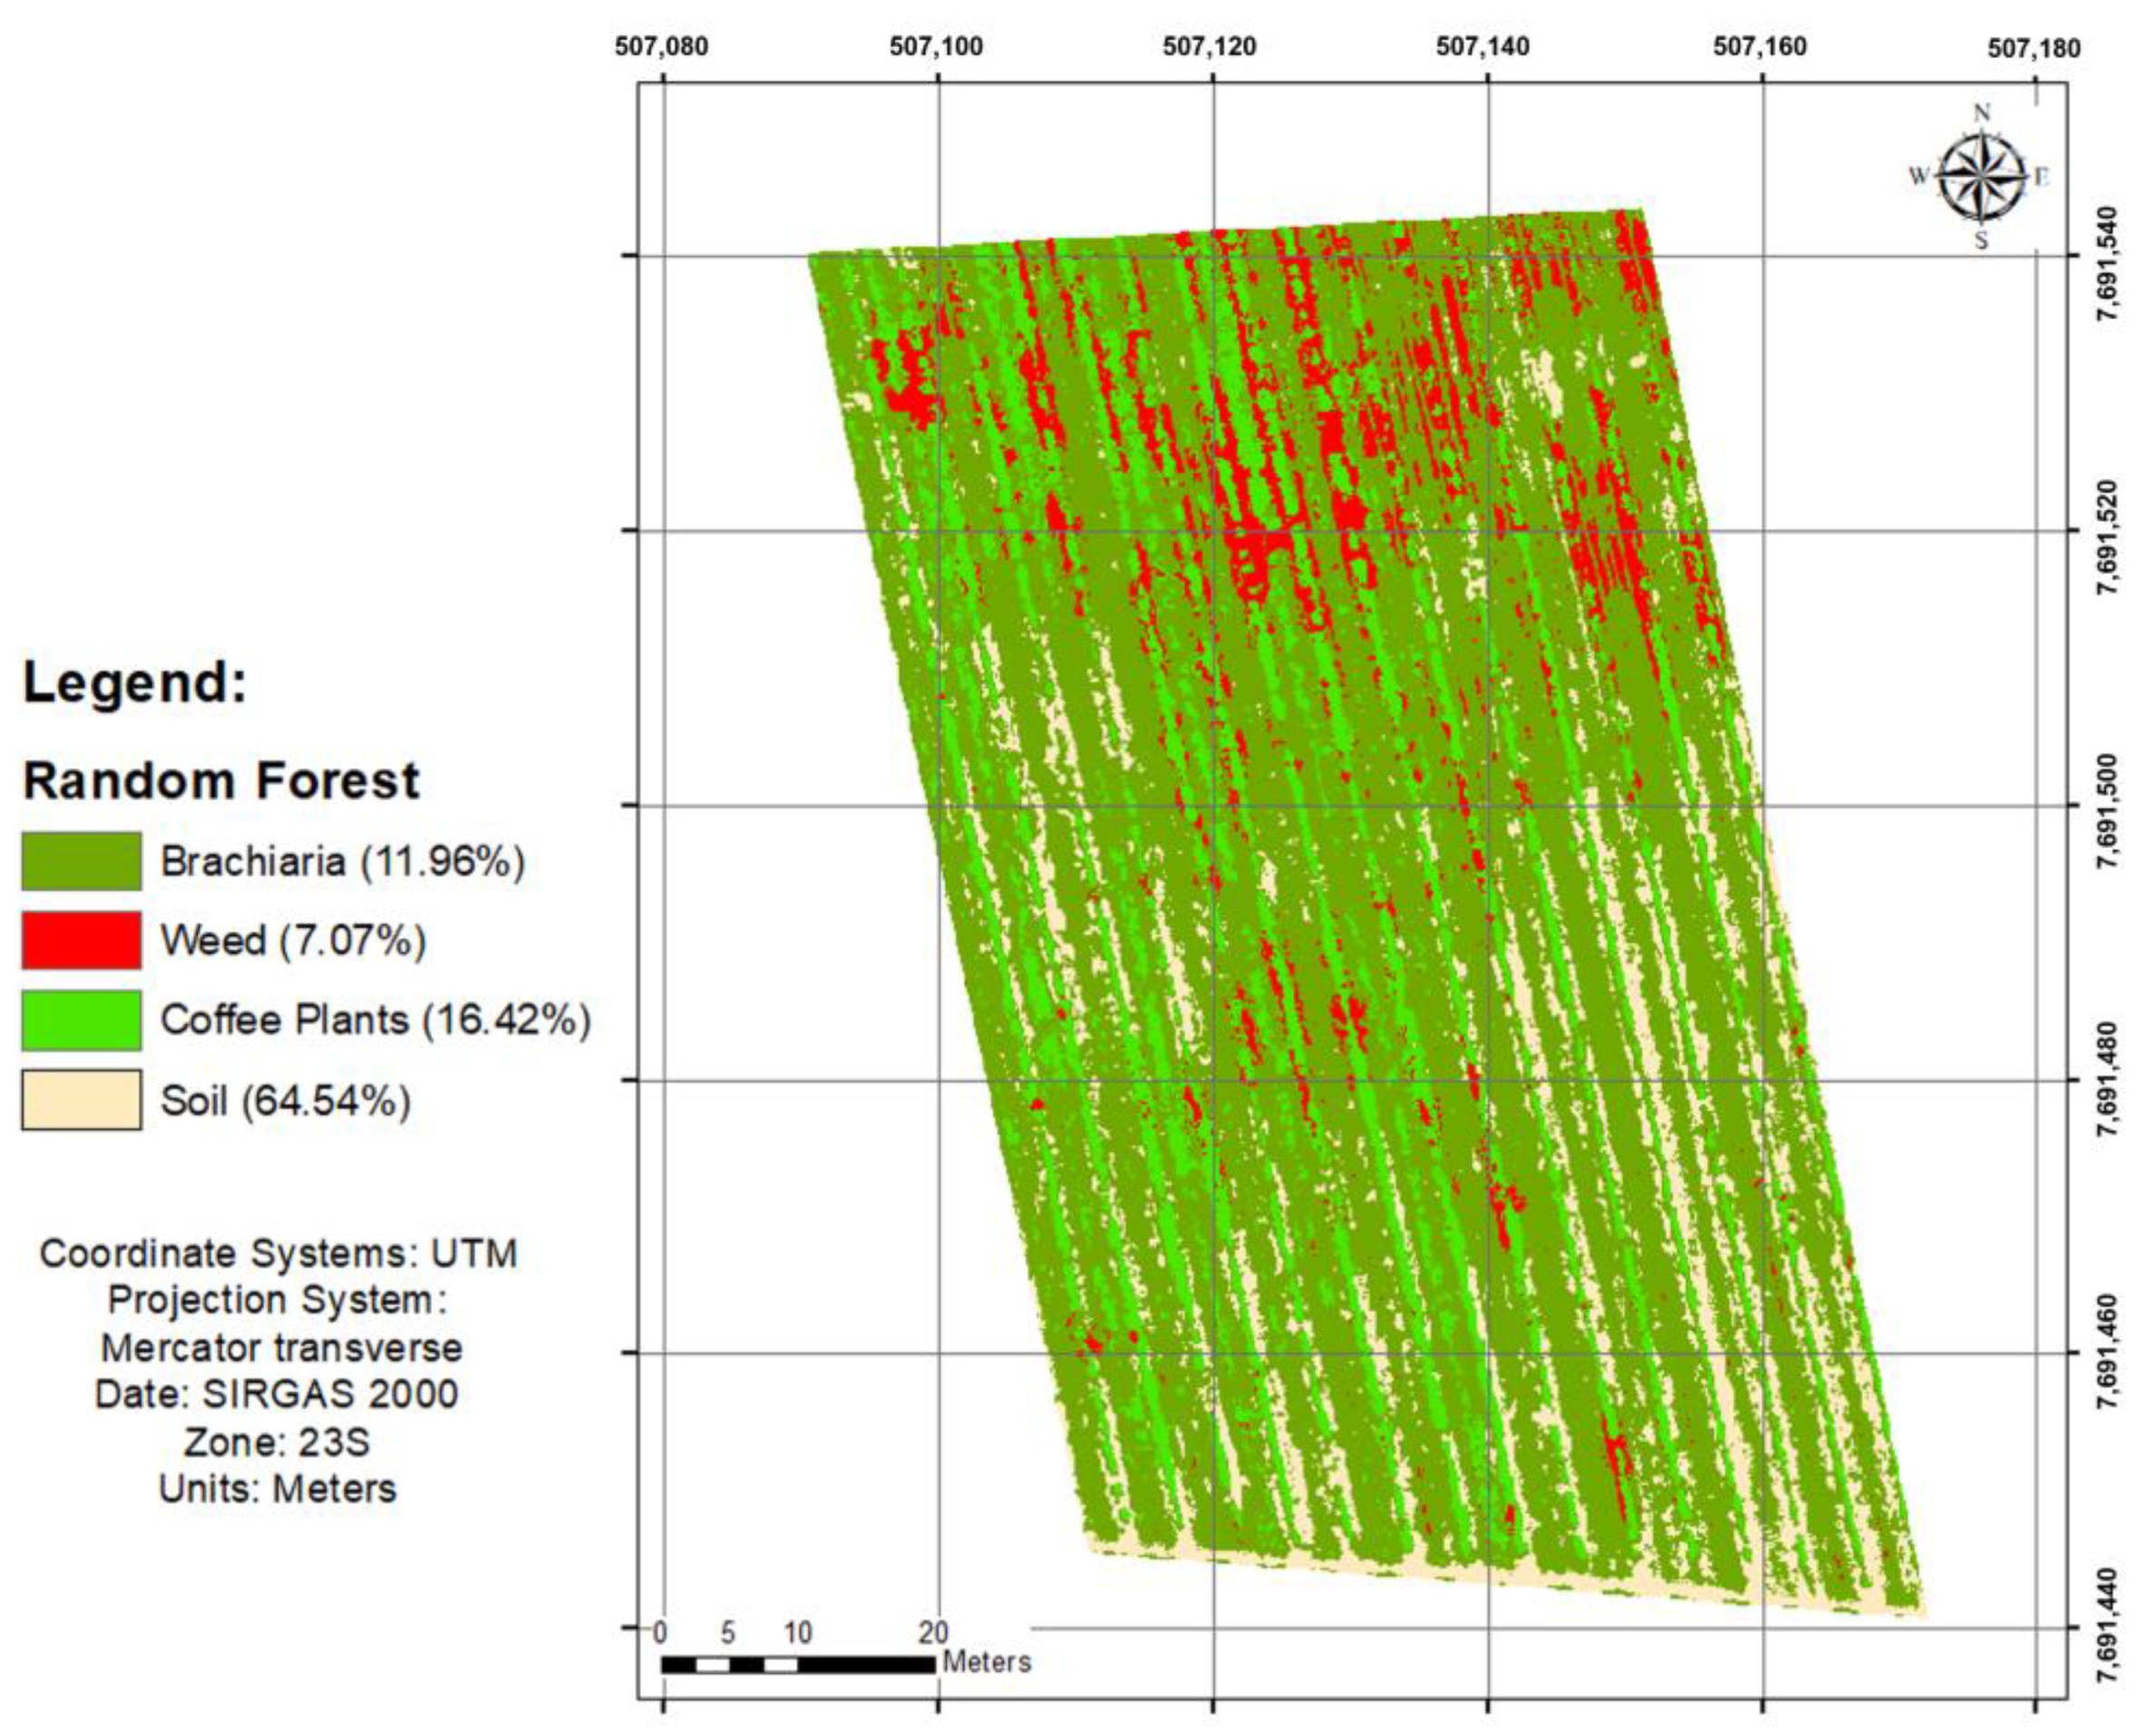
The map of the distribution of classes with the RF classifier (the prediction of classes by the classifier algorithm) is shown in Figure 8. In this figure, the spatialization for the study area and the percentage of occupation of the thematic classes in the study area are shown. There is a large discrimination between the analyzed classes, highlighting the quality of the classifier in determining the percentage of weed occupation (7.07%) in the crop and differentiating it from the coffee plant (16.42%), brachiaria (11.96%), and soil (64.54%).
Figure 8 also allows the diagnosis of the areas occupied by weeds with respect to their location and percentage of occupation. It was possible to identify strategic points for the local application of the agrochemical control of morning glory in the coffee plantation, allowing the recommendation of the spray volume and the comparison of the volume of spray that would be applied in the total area (180.3 L) versus the volume of spray applied in only areas with the presence of weeds (13.2 L) and enabling the analysis of financial costs involved in this process.

4. Discussion

4.1. General Precision of the Classifiers

As shown in Table 1, the overall accuracy, kappa index, F1 score, and area under the ROC curve values allowed the reliable discrimination of the study classes. The accuracy values indicate how often the classifier correctly estimates the proposed classes, with values closer to 100% indicating the excellent fit of the model to the proposed classes [36]. Considering the levels of evaluation of the kappa index, values above 0.81 indicate excellent performance [37]. Conversely, the area under the ROC curve (AUC) quantifies the discriminatory power of a model with values above 90% considered excellent for this variable [38]. For the producer and user accuracy values (Figure 5), a very high hit rate was obtained for all study classes using both algorithms, which can also be highlighted in the individual analysis by classes in the respective confusion matrices (Table 2 and Table 3). It should be noted that the classes with the highest confounding error were soil and coffee plants; however, low error percentages of approximately 4% for both inclusion and omission errors were obtained.
It is shown that the creation of a batch of decision trees as well as class division hyperplanes for the RF and SVM algorithms, respectively, was possible with the use of the multispectral bands of the sensor onboard the RPA used in this study. It is evident that the classifiers showed great similarity in class discrimination in the study area, which may be related to the low number of classes analyzed, the size of the study area, and the large spread of the weeds in the field; however, there were still pixels classified with erroneous classes, which may be directly related to the pixel-by-pixel classification method. Thus, for both tested algorithms, all performance metrics are within the limits of excellence in terms of classification acceptance; however, a better performance was observed using the RF. It is noteworthy that pixels classified as erroneous classes are checked whenever the classification does not reach 100% quality; however, the high classification performance evidenced by the satisfactory values of the analyzed performance metrics stands out, both in general analysis and in analysis by class via a confusion matrix.
The RF algorithm has characteristics that make it beneficial for classification. This algorithm is less affected by outliers and data with noise, is nonparametric, supports data with various statistical distributions, has a high capacity for processing large-scale data and data from various sources, and has greater accuracy in terms of classification when compared with other classifiers such as SVM and maximum likelihood [39,40]. Another benefit of this algorithm is the possibility of using the analysis of the variables of importance through the Mean Decrease in Gini, which allows an overview of the behavior of the variables during the classification process and the identification of those variables with greater and lesser importance weights (Figure 6).
By comparing the classification algorithms used in this study, it was observed that the SVM algorithm required a longer processing time than the RF algorithm. In addition, the difference in the accuracy of the classification algorithms usually occurs due to a subsampling of the separation hyperplanes of the SVM, which leads to an increase in processing time when compared with the RF algorithm [14].
The difficulty in detecting plants occurs due to the presence of dense environments, the plant configuration, high-definition canopy mapping, and conflicts between shade and lighting [41]. In addition to crop and weed segmentation methods, procedures that consider the spectral characteristics of plants are interesting to help classify different plants in the field [42]. The sensor wavelength directly affects the interaction response of electromagnetic energy with the targets present on the Earth’s surface [43]. It was observed in this study that the NIR spectral range was more important in the classification obtained using the RF model. This is justified by the fact that there is a greater difference in the spectral response between the study classes in this spectral range. The spectral signature of the soil is considerably less variable, and due to its composition, it has a high absorption capacity and therefore low reflectance in the NIR spectral range, especially under water deficit conditions. The vegetation, in turn, has a spectral signature with greater variation along the electromagnetic spectrum. An emphasis is placed on the high reflectance in the NIR spectral range due to the interaction of the incident energy with the structure of the spongy mesophyll of the leaves present within this structure. Thus, the greater the internal scattering is, the greater the reflectance in this spectral range.
Thus, class differentiation was facilitated by employing the NIR spectral range to separate the soil and vegetation classes. However, when only vegetation is analyzed, the coffee plant, weed, and brachiaria classes are included. Despite having close reflectance characteristics (due to vegetative spectral behavior), the NIR range was also the maximum and minimum amplitude values that occurred between these classes, allowing the differentiation of the vegetation into the subclasses used in this study (Figure 7).
Such variation in the vegetation cover reflectance in the NIR spectral range mainly depends on the internal structure of the leaves due to their organization and structural spacing but is also influenced by the number of leaves and the canopy architecture, which are variable in the coffee plant, weed, and brachiaria classes. This effect occurs because the energy transmitted through the upper layer of the leaves is partially reflected to the lower layer, and part of this energy is transmitted by the upper layer of the leaves and thus the reflected energy increases, which also explains the reasons for such variation in the NIR range [44,45,46]. In our study of the spectral behavior of the NIR band, also influenced by the behavior of the canopy, in addition to the internal structure of the plants, the highest reflectances were observed for plants with the highest density of leaves and weeds, followed by coffee plants, and finally by brachiaria. The reflectance variations are observed when analyzing the spectral signatures in which the most appropriate NIR spectral range are selected, as it has more defined limits of adequacy for each thematic class, as highlighted in Figure 8, with higher reflectance values in the NIR range for weeds, followed by coffee plants, and finally by brachiaria. However, although the NIR band is the most important band in the classification, its use alone was not enough to proceed with the differentiation between the study classes. For this reason, the other spectral bands were used to achieve better results in the proposed classification.
In accordance with the evidence presented in this study, several studies also demonstrated the applicability of using classification algorithms to individualize weeds in a field [13,47,48,49]. Multiple related works highlighted the use of the NIR spectral range when discriminating classes of land use and occupation in agricultural crops [19,50,51].

4.2. Diagnosis and Recommendation

In general, satisfactory and accurate weed classification results were obtained due to the use of high-spatial-resolution images. It is also noteworthy that the abundance of weeds and, consequently, the training dataset were key factors in the accuracy of the classification.
The classifier adjustment errors are mainly due to the irregular shape of the weeds, which prevented a good manual design and resulted in the overestimation of the actual weed infestation, ranking slightly higher than the actual information between the reference and the intended data. It should be noted, however, that from an agronomic point of view, overestimation is not a problem because it reduces the chance of a lack of control in the field by excluding untreated weeds [52].
In this study, the application of treatment agrochemicals to weeds occurred in a conservative manner, adopting the presence of weeds as the limit indicative of treatment. Thus, it provides minimal product savings but encourages controlled and environmentally correct applications when compared with the application in which the total area is treated and promotes cost reduction and greater economic returns of the coffee activity. Understanding the distribution of weeds in the crop through the evaluation of infestation promotes the adequate application of herbicides, allowing the adoption of more effective control measures and reducing the risk of unnecessary applications of agrochemicals [53].
Considering the total study area of 6010.24 m², the plot occupied by weeds is equivalent to 7.07%, i.e., 439.06 m² of the study area, as shown in Figure 8. To control morning glory weeds, 300 L of spray solution per hectare (HEAT–saflufenacil) was applied via a directed spray at a ratio of 100 g of HEAT to 100 L of water (see HEAT/BASF package insert). Considering the application in the total area, the spray volume would be 180.3 L, and considering the application only in areas occupied by weeds, the spray volume would be reduced to 13.2 L. Thus, the economic saving of herbicide, calculated in terms of the area not required for application, is 92.68% in relation to a conventional application of uniform total area. In conclusion, considering the current price of this herbicide, which would cost USD 42.00 for the producer to treat the total area, would be reduced to only USD 3.00 to treat only the areas affected by weeds. These values were applied to this study area; however, they show the importance and application of such methodology when performing the adequate monitoring of coffee crops affected by weeds, which is relevant in reducing producer costs and minimizing the use of agrochemicals as well as their impacts. Therefore, precision agriculture not only reduces costs and waste, but also improves yield and environmental quality [54].
However, it is essential to maintain a crop environment with weed control and management, and rapid detection is a crucial step to avoid yield loss and improve the profitability of agricultural activities. The young coffee plants, after planting and until the first year of fixation in the field, are very sensitive to the interference of weeds, and their growth and reproductive life are strongly affected if weed control is not addressed in a timely manner [55].
Traditional methods of identification and treatment with herbicide applications to weeds require a large amount of time and have a high treatment cost, which in many cases prevents application efficiency [50]. The use of a sensor coupled to an RPA enables the rapid collection of information. Effective results in the study area are obtained for the diagnosis and controlled application of agrochemicals in the area. Identifying weed species as a morning glory in coffee cultivation promotes improvements in the management and economy of products for their control in addition to providing the producer with a current mapping of the development and history of invasion of these plants.

5. Conclusions

The use of high-resolution images obtained by RPA for the classification of vegetation allowed the differentiation of coffee plants from weeds, and promising results were obtained. The use of high-performance and cost-free classification algorithms yielded satisfactory values for the performance metrics analyzed, with a slight superiority of the RF algorithm. The application of agrochemicals only in the area covered by weeds allows a savings of 92.68% when compared with the condition of application in the total area, showing economic gains and environmental protection.

Author Contributions

Conceptualization, N.L.B. and G.A.e.S.F.; methodology, N.L.B., G.A.e.S.F. and J.d.S.A.; software, N.L.B. and J.d.S.A.; validation, N.L.B.; formal analysis, N.L.B., J.d.S.A., L.S.S., R.A.P.B. and D.V.S.; investigation, N.L.B., J.d.S.A., L.S.S., R.A.P.B. and D.V.S.; resources, N.L.B., J.d.S.A., L.S.S., R.A.P.B., P.F.P.F. and D.V.S.; data curation, N.L.B. and G.A.e.S.F.; writing—original draft preparation, N.L.B. and G.A.e.S.F.; writing—review and editing, N.L.B. and G.A.e.S.F.; visualization, N.L.B. and G.A.e.S.F.; supervision, G.A.e.S.F.; project administration, N.L.B. and G.A.e.S.F.; funding acquisition, G.A.e.S.F. and P.F.P.F. All authors have read and agreed to the published version of the manuscript.

Funding

This study was funded by Embrapa Brazilian Coffee Research Consortium (project 10.18.20.041.00.00), the National Council for Scientific and Technological Development (305953/2020-6) and the Federal University of Lavras (UFLA).

Institutional Review Board Statement

Not applicable.

Informed Consent Statement

Not applicable.

Data Availability Statement

Data sharing not applicable.

Acknowledgments

We would like to thank the Embrapa Brazilian Coffee Research Consortium, the National Council for Scientific and Technological Development (CNPq), the Coordination for The Improvement of Higher Education Personnel (Capes), The Federal University Of Lavras (Ufla) and the Samambaia Farm.

Conflicts of Interest

The authors declare no conflict of interest.

References

  1. Companhia Nacional de Abastecimento-(CONAB). Acompanhamento da Safra Brasileira-CAFÉ. Obs. Agríc. 2023, 1, 1–60. [Google Scholar]
  2. Vargas, L.; Roman, E.S. Resistência de Plantas Daninhas a Herbicidas: Conceitos, Origem e Evolução; Embrapa Trigo: Passo Fundo, Brazil, 2006; 22p, Available online: http://www.cnpt.embrapa.br/biblio/do/p_do58.htm (accessed on 20 October 2022).
  3. Ahmad, J.; Muhammad, K.; Ahmad, I.; Ahmad, W.; Smith, M.L.; Smith, L.N.; Jain, D.K.; Wang, H.; Mehmood, I. Visual features based boosted classification of weeds for real-time selective herbicide sprayer systems. Comput. Ind. 2018, 98, 23–33. [Google Scholar] [CrossRef]
  4. Louargant, M.; Villette, S.; Jones, G.; Vigneau, N.; Paoli, J.N.; Gée, C. Weed detection by UAV: Simulation of the impact of spectral mixing in multispectral images. Precis. Agric. 2017, 18, 932–951. [Google Scholar] [CrossRef]
  5. Mateen, A.; Zhu, Q. Weed detection in wheat crop using UAV for precision agriculture. Pak. J. Agric. Sci. 2019, 56, 809–817. [Google Scholar] [CrossRef]
  6. Austin, D.F. Typification of the new world subdivisions of Ipomoea L. (Convolvulaceae). Taxon 1975, 24, 107–110. [Google Scholar] [CrossRef]
  7. Simão-Bianchini, R.; Pirani, J.R. Duas novas espécies de Convolvulaceae de Minas Gerais, Brasil. Hoehnea 2005, 32, 295–300. [Google Scholar]
  8. Felicio Barreto, L. Interferência de Ipomoea Grandifolia na Cultura do Milho. 2019. Available online: https://www.lapda.org.br/storage/downloads/interferencia-de-ipomoea-grandifolia-na-cultura-do-milho-3051.pdf (accessed on 26 October 2022).
  9. Mishra, A.M.; Gautam, V. Weed species identification in different crops using precision weed management: A review. In Proceedings of the CEUR Workshop Proceedings, Parma, Italy, 7–9 September 2021; Volume 2786, pp. 180–194. [Google Scholar]
  10. Dos Santos, L.M.; Ferraz, G.A.E.S.; Barbosa, B.D.S.; Andrade, A.D. Use of remotely piloted aircraft in precision agriculture: A review. Dyna 2019, 86, 284–291. [Google Scholar] [CrossRef]
  11. Sobrinho, M.F.O.; Corte, A.P.D.; Vasconsellos, B.N.; Sanqueta, C.R.; Rex, F.E.; Viana, M. Uso de Veículos Aéreos Não Tripulados (Vant) Para Mensuração de Processos Florestais. Enciclopédia Biosf. 2018, 15, 117–129. [Google Scholar] [CrossRef]
  12. Garcia-Ruiz, F.; Sankaran, S.; Maja, J.M.; Lee, W.S.; Rasmussen, J.; Ehsani, R. Comparison of two aerial imaging platforms for identification of Huanglongbing-infected citrus trees. Comput. Electron. Agric. 2013, 91, 106–115. [Google Scholar] [CrossRef]
  13. Pérez-Ortiz, M.; Peña, J.M.; Gutiérrez, P.A.; Torres-Sánchez, J.; Hervás-Martínez, C.; López-Granados, F. A semi-supervised system for weed mapping in sunflower crops using unmanned aerial vehicles and a crop row detection method. Appl. Soft Comput. J. 2015, 37, 533–544. [Google Scholar] [CrossRef]
  14. Whyte, A.; Ferentinos, K.P.; Petropoulos, G.P. A new synergistic approach for monitoring wetlands using Sentinels -1 and 2 data with object-based machine learning algorithms. Environ. Model. Softw. 2018, 104, 40–54. [Google Scholar] [CrossRef] [Green Version]
  15. Breiman, L. Random Forests. Mach. Learn. 2001, 45, 5–32. [Google Scholar] [CrossRef] [Green Version]
  16. Cortes, C.; Vapnik, V. Support-vector networks. Mach. Learn. 1995, 20, 273–297. [Google Scholar] [CrossRef]
  17. Haq, M.A. CNN Based Automated Weed Detection System Using UAV Imagery. Comput. Syst. Sci. Eng. 2021, 42, 837–849. [Google Scholar] [CrossRef]
  18. Rasmussen, J.; Nielsen, J.; Garcia-Ruiz, F.; Christensen, S.; Streibig, J.C. Potential uses of small unmanned aircraft systems (UAS) in weed research. Weed Res. 2013, 53, 242–248. [Google Scholar] [CrossRef]
  19. Peña, J.M.; Torres-Sánchez, J.; de Castro, A.I.; Kelly, M.; López-Granados, F. Weed Mapping in Early-Season Maize Fields Using Object-Based Analysis of Unmanned Aerial Vehicle (UAV) Images. PLoS ONE 2013, 8, e77151. [Google Scholar] [CrossRef] [Green Version]
  20. Torres-Sánchez, J.; López-Granados, F.; De Castro, A.I.; Peña-Barragán, J.M. Configuration and Specifications of an Unmanned Aerial Vehicle (UAV) for Early Site Specific Weed Management. PLoS ONE 2013, 8, e58210. [Google Scholar] [CrossRef] [Green Version]
  21. Rasmussen, J.; Nielsen, J.; Streibig, J.C.; Jensen, J.E.; Pedersen, K.S.; Olsen, S.I. Pre-harvest weed mapping of Cirsium arvense in wheat and barley with off-the-shelf UAVs. Precis. Agric. 2019, 20, 983–999. [Google Scholar] [CrossRef]
  22. Radoglou-Grammatikis, P.; Sarigiannidis, P.; Lagkas, T.; Moscholios, I. A compilation of UAV applications for precision agriculture. Comput. Netw. 2020, 172, 107148. [Google Scholar] [CrossRef]
  23. Khan, S.; Tufail, M.; Khan, M.T.; Khan, Z.A.; Iqbal, J.; Wasim, A. Real-time recognition of spraying area for UAV sprayers using a deep learning approach. PLoS ONE 2021, 16, e0249436. [Google Scholar] [CrossRef]
  24. Rahman, M.F.F.; Fan, S.; Zhang, Y.; Chen, L. A comparative study on application of unmanned aerial vehicle systems in agriculture. Agriculture 2021, 11, 22. [Google Scholar] [CrossRef]
  25. Yao, W.; Guo, S.; Yu, F.; Du, W.; Meng, Y.; Wang, J.; Chen, P.; Liang, X.; Xu, T.; Lan, Y. Droplet deposition and spatial drift distribution characteristics of aerial spraying based on the determination of effective swath. Int. J. Precis. Agric. Aviat. 2018, 1, 36–43. [Google Scholar] [CrossRef]
  26. dos Santos, H.G.; Jacomine, P.K.T.; dos Anjos, L.H.C.; de Oliveira, V.A.; Lumbreras, J.F.; Coelho, M.R.; de Almeida, J.A.; de Araújo Ilho, J.C.; de Oliveira, J.B.; Cunha, T.J.F. Sistema Brasileiro de Classificação de Solos-SBCS, 5th ed.; Brazilian Agricultural Research Corporation: Brasília, Brazil, 2018; Available online: https://www.embrapa.br/busca-de-publicacoes/-/publicacao/1094003/sistema-brasileiro-de-classificacao-de-solos (accessed on 13 November 2022).
  27. Alvares, C.A.; Stape, J.L.; Sentelhas, P.C.; de Moraes Gonçalves, J.L.; Sparovek, G. Köppen’s climate classification map for Brazil. Meteorol. Z. 2013, 22, 711–728. [Google Scholar] [CrossRef] [PubMed]
  28. Ministry of Agriculture. Livestock and Supply Brazil-MAPA; Ministry of Agriculture: Brasília, Brasil, 2018. Available online: https://sistemas.agricultura.gov.br/snpc/cultivarweb/cultivares_registradas.php (accessed on 8 May 2022).
  29. Chang, C.C.; Lin, C.J. LIBSVM: A Library for support vector machines. ACM Trans. Intell. Syst. Technol. 2011, 2, 1–27. [Google Scholar] [CrossRef]
  30. Gislason, P.O.; Benediktsson, J.A.; Sveinsson, J.R. Random forests for land cover classification. Pattern Recognit. Lett. 2006, 27, 294–300. [Google Scholar] [CrossRef]
  31. Balzter, H.; Cole, B.; Thiel, C.; Schmullius, C. Mapping CORINE land cover from Sentinel-1A SAR and SRTM digital elevation model data using random forests. Remote Sens. 2015, 7, 14876–14898. [Google Scholar] [CrossRef] [Green Version]
  32. Breiman, L. Manual On Setting Up, Using, and Understanding Random Forests V3.1; Berkeley University: Berkeley, CA, USA, 2001; p. 33. Available online: http://journal.um-surabaya.ac.id/index.php/JKM/article/view/2203 (accessed on 10 November 2022).
  33. Chinchor, N. MUC-4 evaluation metrics. In Proceedings of the 4th Message Understanding Conference, MUC 1992-Proceedings, McLean, VA, USA, 16–18 June 1992; pp. 22–29. [Google Scholar] [CrossRef] [Green Version]
  34. Cohen, J. A Coefficient of Agreement for Nominal Scales. Educ. Psychol. Meas. 1960, 20, 37–46. [Google Scholar] [CrossRef]
  35. Pontius, R.G.; Millones, M. Death to Kappa: Birth of quantity disagreement and allocation disagreement for accuracy assessment. Int. J. Remote Sens. 2011, 32, 4407–4429. [Google Scholar] [CrossRef]
  36. FAO: Food and Agriculture Organization of the United Nations. Map Accuracy Assessment and Area Estimation: A Practical Guide; FAO: Rome, Italy, 2016; Available online: http://www.fao.org/3/a-i5601e.pdf (accessed on 3 April 2022).
  37. Landis, J.R.; Koch, G.G. A One-Way Components of Variance Model for Categorical Data. Biometrics 1977, 33, 671. [Google Scholar] [CrossRef]
  38. Mandrekar, J.N. Receiver operating characteristic curve in diagnostic test assessment. J. Thorac. Oncol. 2010, 5, 1315–1316. [Google Scholar] [CrossRef] [Green Version]
  39. Mahdianpari, M.; Salehi, B.; Mohammadimanesh, F.; Motagh, M. Random forest wetland classification using ALOS-2 L-band, RADARSAT-2 C-band, and TerraSAR-X imagery. ISPRS J. Photogramm. Remote Sens. 2017, 130, 13–31. [Google Scholar] [CrossRef]
  40. de Almeida Furtado, L.F.; Silva, T.S.F.; de Moraes Novo, E.M.L. Dual-season and full-polarimetric C band SAR assessment for vegetation mapping in the Amazon várzea wetlands. Remote Sens. Environ. 2016, 174, 212–222. [Google Scholar] [CrossRef] [Green Version]
  41. Wang, A.; Zhang, W.; Wei, X. A review on weed detection using ground-based machine vision and image processing techniques. Comput. Electron. Agric. 2019, 158, 226–240. [Google Scholar] [CrossRef]
  42. Chicchón Apaza, M.Á.; Monzón, H.M.B.; Garrido, R.P.A. Semantic Segmentation of Weeds and Crops in Multispectral Images by Using a Convolutional Neural Networks Based on U-Net. Commun. Comput. Inf. Sci. 2019, 473–485. [Google Scholar] [CrossRef]
  43. Ulaby, F.T.; Allen, C.T.; Eger, G.; Kanemasu, E. Relating the microwave backscattering coefficient to leaf area index. Remote Sens. Environ. 1984, 14, 113–133. [Google Scholar] [CrossRef]
  44. Knipling, E.B. Physical and physiological basis for the reflectance of visible and near-infrared radiation from vegetation. Remote Sens. Environ. 1970, 1, 155–159. [Google Scholar] [CrossRef]
  45. Gardner, B.R. Techniques for Remotely Monitoring Canopy Development and Estimating Grain Yield of Moisture Stressed Corn; CAMAC Progress Report 83-9; Institute of Agriculture and Natural Resources–University of Nebraska-Lincoln: Lincoln, Nebraska, 1983; p. 187. [Google Scholar]
  46. Ramana Rao, T.V. Monitoring Water Stress in Soybeans with Remote Sensing Techniques; The University of Nebraska-Lincoln: Lincoln, Nebraska, 1985. [Google Scholar]
  47. Dyrmann, M.; Skovsen, S.; Stigaard Laursen, M.; Nyholm Jørgensen, R. Using a fully convolutional neural network for detecting locations of weeds in images from cereal fields An intelligent system for assessing the quality of the cereal sowing. View project FutureCropping View project. In Proceedings of the 14th International Conference on Precision Agriculture, Montreal, QC, Canada, 24–27 June 2018; Available online: https://www.researchgate.net/publication/355039118 (accessed on 10 April 2022).
  48. Alimboyong, R.P.; Hernandez, C.R.; Medina, A.A. Classification of SD-OCT images using Deep learning approach. In Proceedings of the 2017 IEEE International Conference on Signal and Image Processing Applications (ICSIPA), Kuching, Malaysia, 12–14 September 2017; pp. 3–6. [Google Scholar]
  49. López-Granados, F.; Torres-Sánchez, J.; Serrano-Pérez, A.; de Castro, A.I.; Mesas-Carrascosa, F.J.; Peña, J.M. Early season weed mapping in sunflower using UAV technology: Variability of herbicide treatment maps against weed thresholds. Precis. Agric. 2016, 17, 183–199. [Google Scholar] [CrossRef]
  50. de Castro, A.I.; Torres-Sánchez, J.; Peña, J.M.; Jiménez-Brenes, F.M.; Csillik, O.; López-Granados, F. An automatic random forest-OBIA algorithm for early weed mapping between and within crop rows using UAV imagery. Remote Sens. 2018, 10, 285. [Google Scholar] [CrossRef] [Green Version]
  51. Zhu, D.S.; Pan, J.Z.; He, Y. Identification methods of crop and weeds based on Vis/NIR spectroscopy and RBF-NN model. Guang Pu Xue Yu Guang Pu Fen Xi= Guang Pu 2008, 28, 1102–1106. [Google Scholar]
  52. Gibson, K.D.; Dirks, R.; Medlin, C.R.; Johnston, L. Detection of Weed Species in Soybean Using Multispectral Digital Images. Weed Technol. 2004, 18, 742–749. [Google Scholar] [CrossRef]
  53. Rizzardi, M.A.; Luiz, A.R.; Roman, E.S.; Vargas, L. Temperatura cardeal e potencial hídrico na germinação de sementes de corda-de-viola (Ipomoea triloba). Planta Daninha 2009, 27, 13–21. [Google Scholar] [CrossRef]
  54. Umamaheswari, S.; Arjun, R.; Meganathan, D. Weed Detection in Farm Crops using Parallel Image Processing. In Proceedings of the 2018 Conference on Information and Communication Technology (CICT), Jabalpur, India, 26–28 October 2018. [Google Scholar] [CrossRef]
  55. Fialho, C.M.T.; França, A.C.; Tironi, S.P.; Ronchi, C.P.; Silva, A.A. Interferência de plantas daninhas sobre o crescimento inicial de Coffea arabica. Planta Daninha 2011, 29, 137–147. [Google Scholar] [CrossRef] [Green Version]
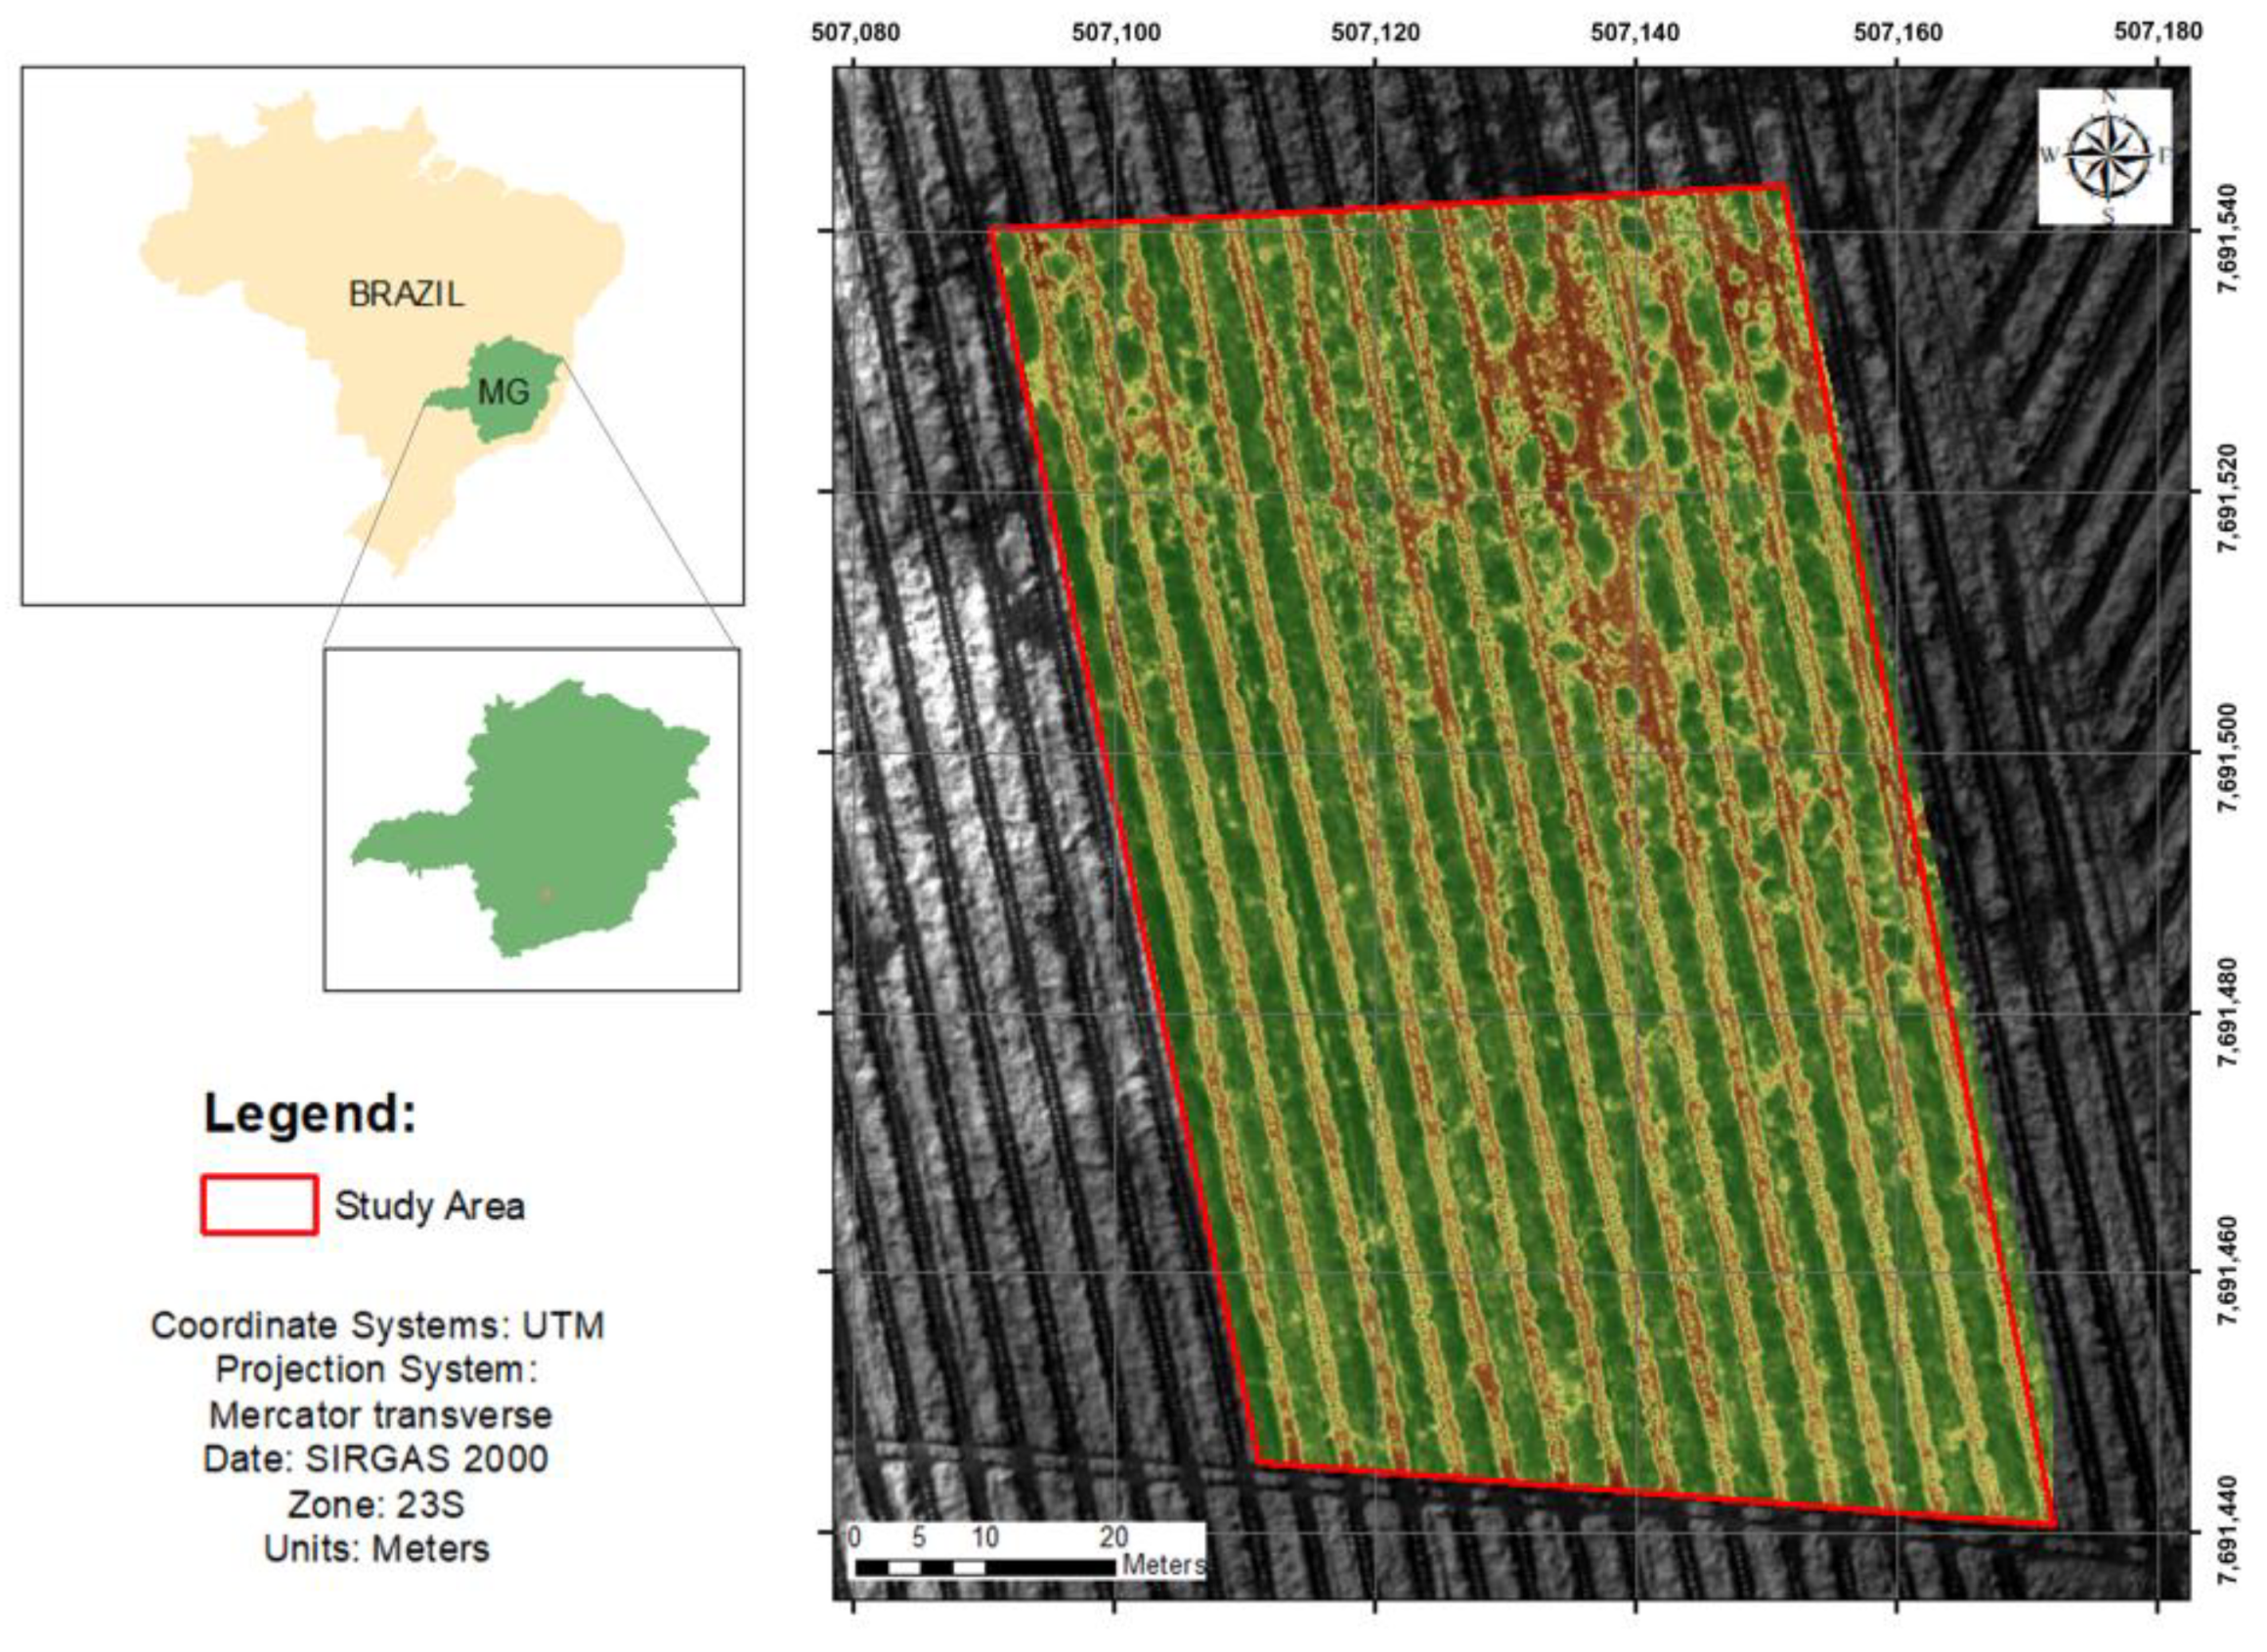
Figure 1. Location of the study area.
Agronomy 13 00830 g001
Figure 2. (A) RPA Matrice 100; (B) Parrot Sequoia and sunshine sensor.
Agronomy 13 00830 g002
Figure 3. Image processing flow in Pix4D Mapper software.
Agronomy 13 00830 g003
Figure 4. Flowchart of the classification process with the methodological steps used.
Agronomy 13 00830 g004
Figure 5. Average producer and user accuracy for each thematic class for (A) RF and (B) SVM.
Agronomy 13 00830 g005
Figure 6. Importance variables by Mean Decrease in Gini in spectral bands.
Agronomy 13 00830 g006
Figure 7. Spectral signature of each study class.
Agronomy 13 00830 g007
Figure 8. Land cover map with the RF classifier and the corresponding percentages for each class.
Agronomy 13 00830 g008
Table 1. Performance metrics for the RF and SVM classification algorithms.
AlgorithmGlobal AccuracyKappa IndexF1AUC
RF99.2498.8698.9199.91
SVM98.7198.0896.5299.83
Table 2. Confusion matrix for the RF machine learning algorithm.
ClassesReference
BrachiariaCoffeeWeedSoilTotalET1 (%)
PredictionBrachiaria4810004810
Coffee04002114133.15
Weed0037203720
Soil051121312190.50
Total48140537512242485-
ET2 (%)01.230.800.89--
Legend: Error type 1 (ET1); error type 2 (ET2).
Table 3. Confusion matrix for the SVM machine learning algorithm.
ClassesReference
BrachiariaCoffeeWeedSoilTotalET1 (%)
PredictionBrachiaria4810004810
Coffee03922154094.15
Weed0137103720.26
Soil0122120912231.15
Total48140537512242485-
ET2 (%)03.211.071.22--
Legend: Error type 1 (ET1); error type 2 (ET2).
Disclaimer/Publisher’s Note: The statements, opinions and data contained in all publications are solely those of the individual author(s) and contributor(s) and not of MDPI and/or the editor(s). MDPI and/or the editor(s) disclaim responsibility for any injury to people or property resulting from any ideas, methods, instructions or products referred to in the content.