Article

Source–Sink Balance Optimization Depends on Soil Nitrogen Condition So as to Increase Rice Yield and N Use Efficiency

1
College of Agronomy, Anhui Agricultural University, Hefei 230036, China
2
MARA Key Laboratory of Crop Ecophysiology and Farming System in the Middle Reaches of the Yangtze River, College of Plant Science and Technology, Huazhong Agricultural University, Wuhan 430070, China
3
National Key Laboratory of Crop Genetic Improvement, Wuhan 430070, China
*
Author to whom correspondence should be addressed.
Agronomy 2023, 13(3), 907; https://doi.org/10.3390/agronomy13030907
Submission received: 24 November 2022 / Revised: 9 March 2023 / Accepted: 16 March 2023 / Published: 18 March 2023

Abstract

:
Genetic improvement has been devoted to increasing rice yield by increasing the spikelet number per panicle and the spikelet/leaf ratio. As a result, indica-japonica hybrid rice “Yongyou” varieties with large panicles and superhigh yield potential have been developed. These varieties exhibit significantly higher grain yield and nitrogen use efficiency for grain (NUEg) under moderate and high N supply conditions due to their large sink size, but their yield performance remains obscure under low N input and low soil fertility conditions. In the present study, we investigated four varieties including Yongyou2640 (YY2640, large-panicle india-japonica hybrid variety), Yangliangyou6 (YLY6, two-line indica hybrid variety), Quanyou6 (QY6, three-line indica hybrid variety), and Huanghuazhan (HHZ, indica inbred variety) under two low soil fertility treatments [LF (removing half of soil depth) and CK] and two N fertilizer rates (0 and 100 kg N ha−1) in Central China. The results showed that the grain yield of YY2640 was more responsive to fertility than that of other varieties, which was 19.4–42.3% higher than that of the other three varieties under CK N100 treatment, but it was 14.5–19.4% lower than that of YLY6 and QY6 under LF N0 and LF N100. A higher spikelet/leaf ratio resulted in more biomass and N partition to panicles rather than to leaves under LF N0 and N100. Slightly more post-flowering dry matter obtained from higher leaf N content and crop growth rate failed to compensate for the adverse effects of reduced pre-flowering dry matter accumulation and stem-to-grain translocation during grain filling. This led to the lower NUEg of YY2640 than YLY6 and QY6 under low soil fertility conditions. Based on these findings, the present study suggested that the source–sink relationship of the super hybrid varieties should be optimized according to the soil N supply condition.

1. Introduction

Rice (Oryza sativa L.) is one of the most important cereal crops in China, and it provides more than 65% of diets for the world population [1]. During the past decades, rice yield has dramatically increased with the variety improvements, crop management, irrigation infrastructure construction, and fertilizer and pesticide application [2,3,4]. However, the increasing population, limited resources, and developing urbanization pose a great pressure on rice production [5,6]. In recent years, the growth rate of rice yield has slowed down significantly in China [7]. With the expanding land construction area and soil degradation, the land available for rice production is severely decreasing [8]. Therefore, increasing grain yield per unit area has been considered as the most promising way to boost future rice production [9,10]. In addition to varieties, crop management, and climates, the soil fertility is an important factor influencing rice yield. The soil fertility has been reported to be essential for increasing rice yield, especially from high yield to super-high yield [11]. However, the area of farmland with medium and low soil fertility accounts for about 70% of the total land area available for rice production in China, which seriously limits the further improvement of rice yield [12]. Increasing the yield of fields with medium and low soil fertility is an effective strategy to improve rice production capacity in China [12].
Rice yield is determined by panicle number per area, spikelets per panicle, grain filling percentage, and grain weight [13]. Generally, the yield can be promoted by increasing each individual yield component, or the combination among four components [14]. In the past decades, the enlargement in the sink size has been demonstrated as the effective approach to increase rice yield [15]. Genetic improvement in rice yield is mainly devoted to the increase in panicle size in China [15,16,17]. Recently, several rice varieties with strong heterosis and large panicle size have been successfully developed and put into production such as Yongyou 15 [18], Yongyou 2640 [19], and Yongyou 12 [20]. These varieties exhibit super high yield potential in Central China [21]. In addition to sink size, rice yield also depends on source capacity [22,23]. Source capacity is related to photosynthetic capacity, dry matter translocation, and the leaf senescence of plant [24]. According to the source–sink relationship, rice varieties can be divided into source-limiting type, sink-limiting type, and source–sink interaction type [25]. A strong source capacity, large sink size, and good sink-source relationship are essential to the high yield of rice [26,27]. The increase in rice yield tends to be accompanied by the increase in sink size and the continuous optimization of the source–sink relationship [28,29]. Increasing evidence has demonstrated that modern high-yield rice varieties exhibit large sink size characteristics such as more spikelets per panicle [30] and a strong source capacity such as a higher leaf area index [31] and more dry matter production [15]. The total spikelets number at maturity divided by the leaf area index at heading can be defined as the spikelets to leaf-area (spikelet/leaf) ratio [27,32]. The spikelet/leaf ratio is an important trait index to evaluate the source–sink relationship in rice [33]. A higher spikelet/leaf ratio is beneficial to promote the accumulation of dry matter after heading and the translocation of photosynthate from vegetative organs to grains during the grain filling stage [27]. Thus, a higher spikelet/leaf ratio is the reason that Yongyou4949 has high grain yield and nitrogen use efficiency under moderate and high nutrient supply conditions [27].
In addition to the variety characteristics, the source–sink relationship of rice is also regulated by the supply of nitrogen (N). N fertilizer input can effectively increase source capacity in rice by increasing the tiller number, leaf area [34], and canopy photosynthesis [35]. N uptake increase can also enlarge the sink size of rice and N uptake during the early growth stage and the stage from panicle initiation to heading increases sink capacity by raising the panicle number per unit area and spikelets per panicle, respectively [36]. The responses of the source–sink relationship to N supply are different between the large-panicle type and the multi-panicle type variety due to their different yield-increase pathways [36]. The “Yongyou” series of indica/japonica hybrid varieties with large panicles exhibited a high grain yield under moderate and high N input conditions (262.5–300 kg N ha−1) [20,27,37]. However, against the nitrogen fertilizer reduction policy background in China, little attention has been paid to the yield performance and source–sink relationship of the large-panicle variety under low N input and low soil fertility conditions [38].
The reduction of N uptake during the period from midtillering to panicle initiation decreases the panicle number m−2 and the total dry biomassis, thus resulting in yield decline under low soil fertility conditions [39]. However, the responses of the varieties with different sink sizes and source–sink relationships to different soil fertility and N treatments as well as the corresponding mechanisms remain poorly understood. In the present study, grain yield and nitrogen use efficiency were compared among varieties with different sink sizes and source–sink relations under different soil fertility and N input conditions in Central China in 2016–2018. The objectives of this study were: (1) to determine whether the large-panicle type varieties still exhibited high grain yield and NUEg under low soil fertility and low N input conditions, and (2) to reveal the physiological mechanisms underlying the different responses of different varieties to soil fertility and N input conditions.

2. Materials and Methods
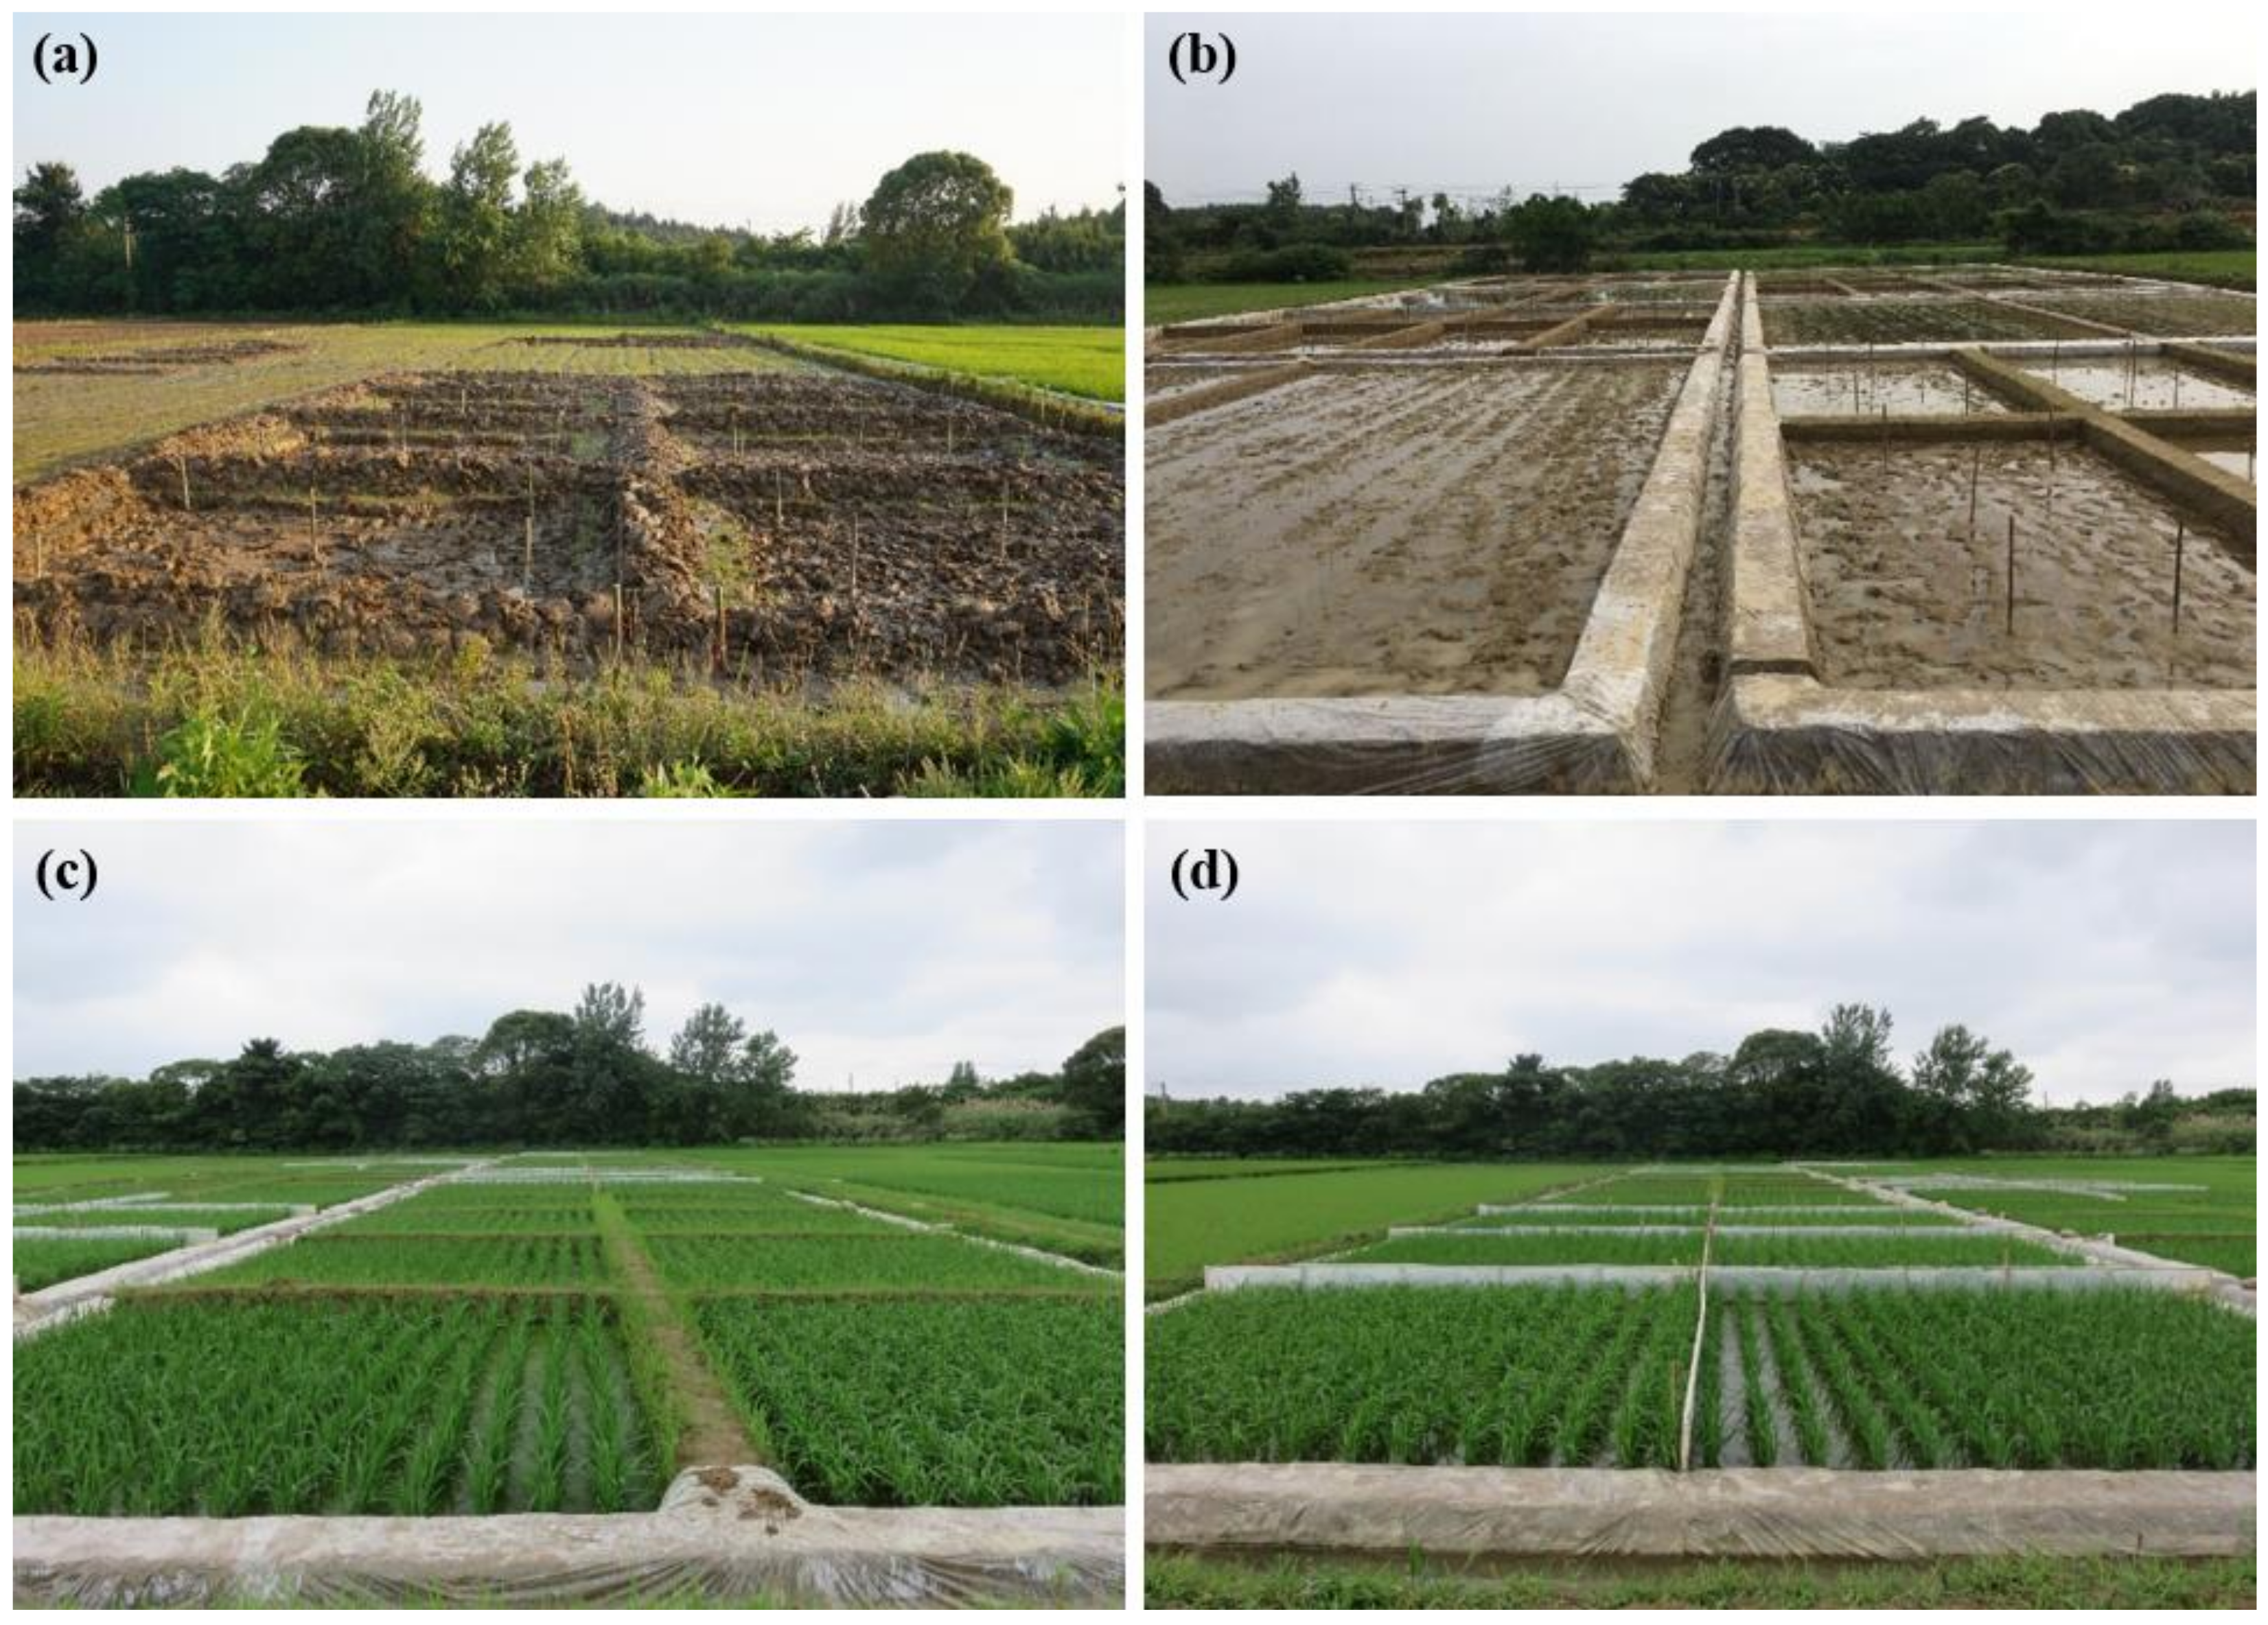
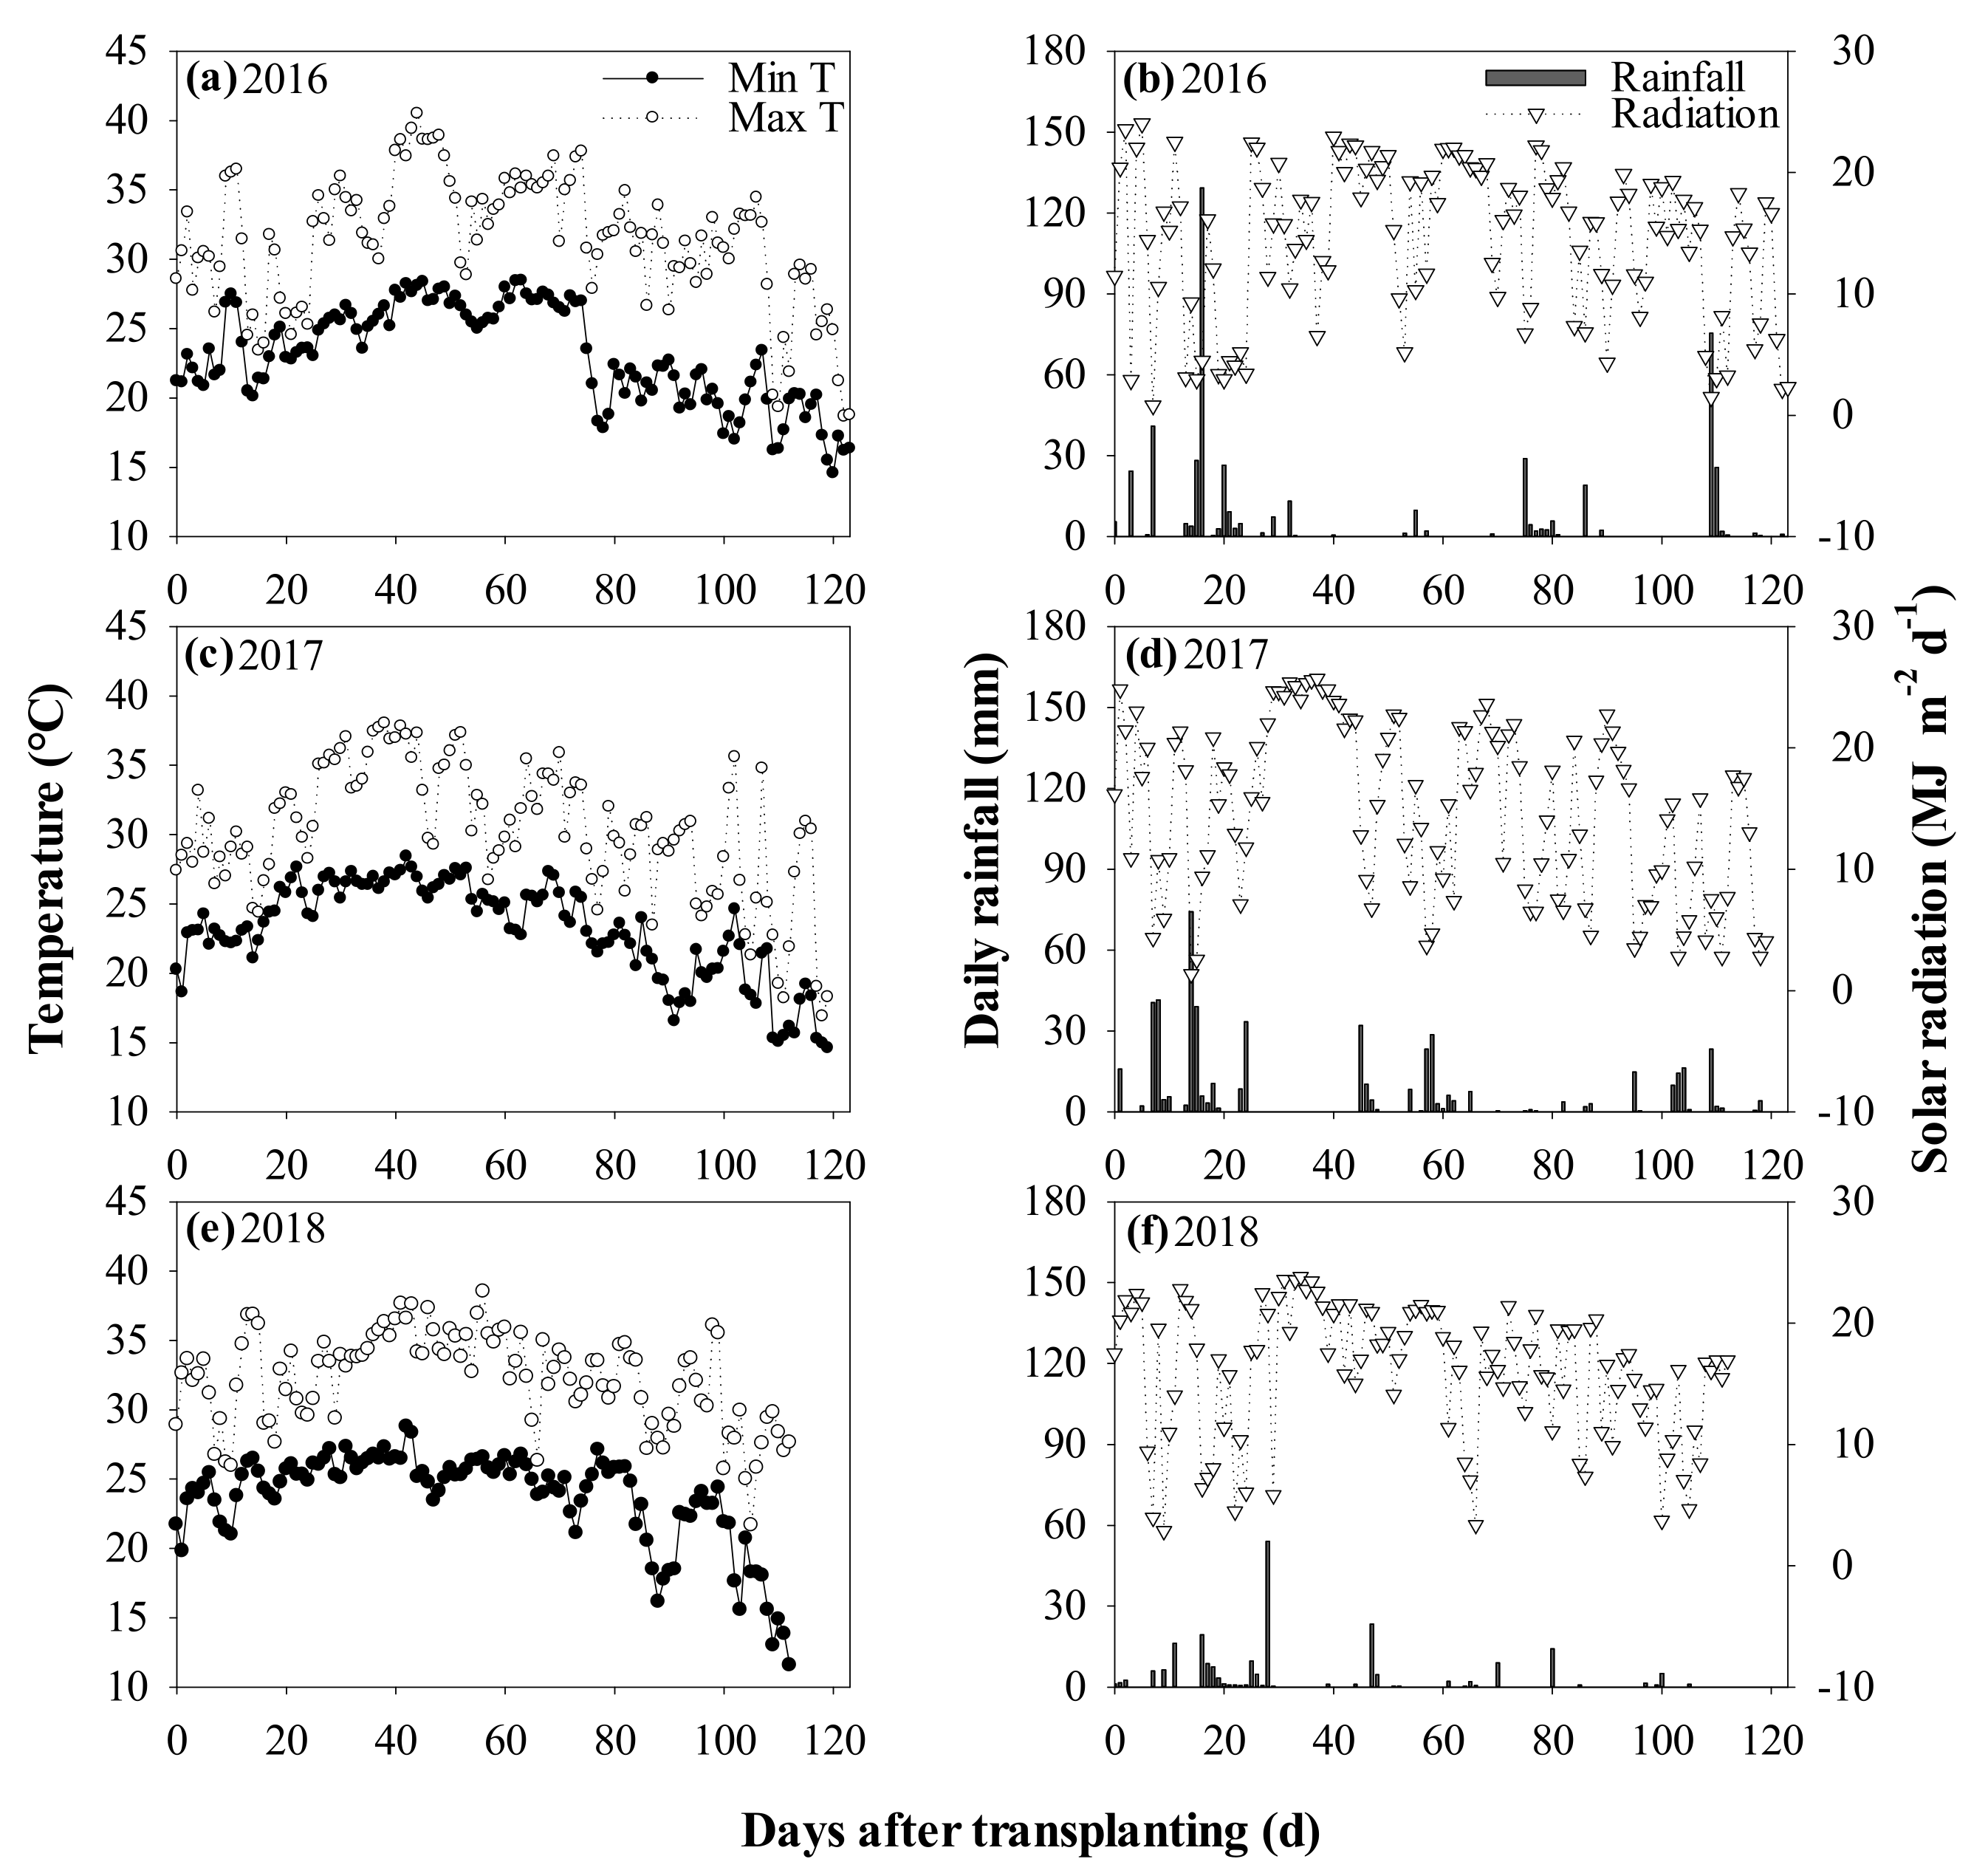
2.1. Site

Field experiments were conducted in farmers’ fields at Dajin Town, Wuxue County, Hubei Province, China (29°51′ N, 115°33′ E) during the rice-growing season from May to October in 2016–2018. The experiments were performed in three adjacent fields during three years, respectively. The soil in these fields was Eutric Gleysols (FAO taxonomy) and has a silty loam texture based on the American soil texture classification standard. This study area was located in a subtropical monsoon humid climate region. The daily meteorological data were collected from a weather station (AWS 800, Campbell Scientific, Inc., Logan, UT, USA) near the experimental site during the growing period from transplanting to maturity based on the longest duration of the tested variety. The average daily mean temperature for the entire 24 h, average daily solar radiation, and total precipitation during the growing season was 26.7 °C, 14.4 MJ m−2, and 494.0 mm in 2016, 26.2 °C, 14.7 MJ m−2, and 520.9 mm in 2017, and 27.4 °C, 15.9 MJ m−2, and 213.8 mm in 2018, respectively (Figure 1).

2.2. Experimental Design and Crop Management

In 2016 and 2017, the experiment was performed in a split-plot design with soil fertility as main plots and rice variety as subplots. In 2018, the experiment was arranged in a split-split-plot design with soil fertility as main plots, N application rate as sub-plots, and variety as sub-sub-plots. The experiments were conducted with 4 replicates in each year. There were two levels of soil fertility, low soil fertility (LF) and the control soil fertility (CK). The topsoil depth above hardpan was 30, 25, and 22 cm in 2016, 2017, and 2018, respectively. The LF referred to manual removal of half topsoil, and the removed topsoil was used to build bunds for each plot. The CK was the treatment without topsoil removal. Under CK, no bunds were built between plots, instead, plastic baffles were used to block water and fertilizer across plots (Figure 2). This manual LF plot creation allowed two simultaneous soil fertility treatments in one field so as to avoid the confounding factors from two different fields in the same site or different sites such as climate factors, soil type, and N concentration of irrigation water. The topsoil removal reduced the average plant N uptake by 27.8% based on the data of planting year, N application rate and variety, and the maximum N uptake reduction was observed in the period from midtillering to panicle initiation, compared with other planting periods [39]. The soil chemical properties under CK and LF treatments were presented in Table 1. The N application rate was 100 kg ha−1 in 2016 and 2017, and two N application rates in 2018 were N0 (0 kg N ha−1) and (N100) 100 kg N ha−1. Compared with N fertilizer rate of 180–200 kg ha−1 for single season rice in local farmers’ fields, 100 kg N ha−1 application rate in our experiment fields was a relatively low N input. In present study, we investigated 4 varieties including the inbred rice cultivar Huanghuazhan (HHZ), indica-japonica hybrid cultivar Yongyou2640 (YY2640), two-line indica hybrid rice cultivar Yangliangyou6 (YLY6), and three-line indica hybrid rice cultivar Quanyou6 (QY6). YY2640 was a large-panicle variety, compared with the other 3 varieties [17,27].
Pre-germinated seeds were sown into seedbeds on 13 May in 2016, 14 May in 2017, and 15 May in 2018. The seedlings were transplanted into the paddy field on 11 June in 2016, 16 June in 2017, and 13 June in 2018. Transplanting was performed at a spacing of 13.3 cm × 30.0 cm with two seedlings per hill. In all three years, total N application rate of 100 kg ha−1 was applied in the form of urea at pre-transplanting (as basal fertilizer), tillering period (day 10 after transplanting), and panicle initiation (PI) at a ratio of 4:3:3. Calcium superphosphate as phosphorus fertilizer was applied at 40 kg P ha−1 to all the plots one day before transplanting. Potassium chloride as potassium fertilizer was applied at 100 kg K ha−1 and pre-transplanting/PI ratio of 1:1 to all the plots. The plots were flooded after transplanting, and a 3–5 cm floodwater depth was maintained until one week before maturity except for water drainage at maximum tillering stage to reduce unproductive tillers. Weeds, pests, and diseases were intensively controlled to avoid yield loss throughout the growing season.

2.3. Sampling and Measurements

Twelve hills with two seedlings per hill were sampled from each plot at heading (HD), and maturity (MA). The plant samples were separated into leaves, stems (culm plus sheath), and panicles. The area of green leaf at HD was measured using a leaf area meter (LI-3100, LI-COR, Lincoln, NE, USA), and expressed as leaf area index (LAI, surface area of leaves per unit ground). The dry weight of each organ was determined after oven-drying at 80 °C to constant weight. At maturity, the panicles were hand threshed after recording panicle number, and then the filled spikelets were separated from the unfilled spikelets by submerging them in tap water. The empty spikelets were separated from the partially filled spikelets by winnowing. Three 30 g filled spikelets subsample, three 2 g empty spikelet subsamples, and all the partially filled spikelets were taken to count the number of spikelets per m−2. The dry weights of the rachis, and the filled, partially filled, and empty spikelets were measured after oven drying at 80 °C to a constant weight. The sum of the above-mentioned dry weight from panicles and that of leaves and stems were defined as aboveground total dry weight at maturity. The grain yield of a 5-m2 area in the center of each plot was determined as actual grain yield, which was adjusted to contain 14% moisture content. The grain moisture content was measured by a digital moisture tester (DMC-700, Seedburo, Chicago, IL, USA). Spikelet/leaf ratio was calculated as spikelet number m−2 at maturity divided by leaf area index at heading. Crop growth rate from transplanting (TP) to heading (HD) was calculated as dry weight accumulated from TP to HD divided by day number from TP to HD. Similarly, crop growth rate during grain filling period was also calculated as dry weight accumulated during this period divided by day number from HD to MA. Furthermore, pre-flowering translocated dry matter amount was calculated as filled grain dry weight minus post-flowering accumulated dry weight to investigate the difference in dry matter translocation characteristics among different varieties.
SPAD 502 chloropgyll meter (Konica Minolta, Japan) was used to measure leaf color in 2018. Six hills were sampled from each treatment plot for the measurements of the first expanded leaf blades (from the top) on a single stem from each plant. Three points on each leaf were selected from upper, middle, and lower part of leaf for measurement of N concentration with SPAD. The obtained three SPAD values were averaged. SPAD measurements were conducted at HD, day 21 after heading (DAH21), and MA to investigate the leaf senescence characteristics of four varieties.
The N concentration of each organ in different growth stages was measured by Elementar vario MAX CNS/CN (Elementar Trading Co., Ltd., Langenselbold, Germany). The N content of each organ was calculated as the product of N concentration and dry weight. Nitrogen uptake at each growth stage was the sum of N contents for each organ. Pre-flowering translocated N was calculated as grain N content minus N accumulated post flowering so as to investigate N translocation characteristics of different varieties. N utilization efficiency for grain production (NUEg, kg kg−1) was calculated as grain yield/total N uptake at MA.

2.4. Statistical Analysis

Analysis of variance was performed using Statistix 9.0 (Tallahassee, FL, USA). Year, soil treatments, N treatments, and varieties were considered fixed effects and replication was considered a random effect. The differences between groups were compared using the least significant difference (LSD) test. p < 0.05 was considered as statistically significant. All figures were generated by Sigmaplot 12.5 (SPSS Inc., Point Richmond, CA, USA).
The yield data of different cultivars under different soil fertility and N treatments in 2016, 2017, and 2018 was used to conduct yield stability linear regression. Environmental mean was calculated as the mean yield of the four varieties under each treatment combination and for each year following the procedure of Finlay and Wilkinson (1963) [40]. By fitting the yield performance of each variety under different environmental mean, the yield potential and stability of rice can be obtained according to the slope.

3. Results

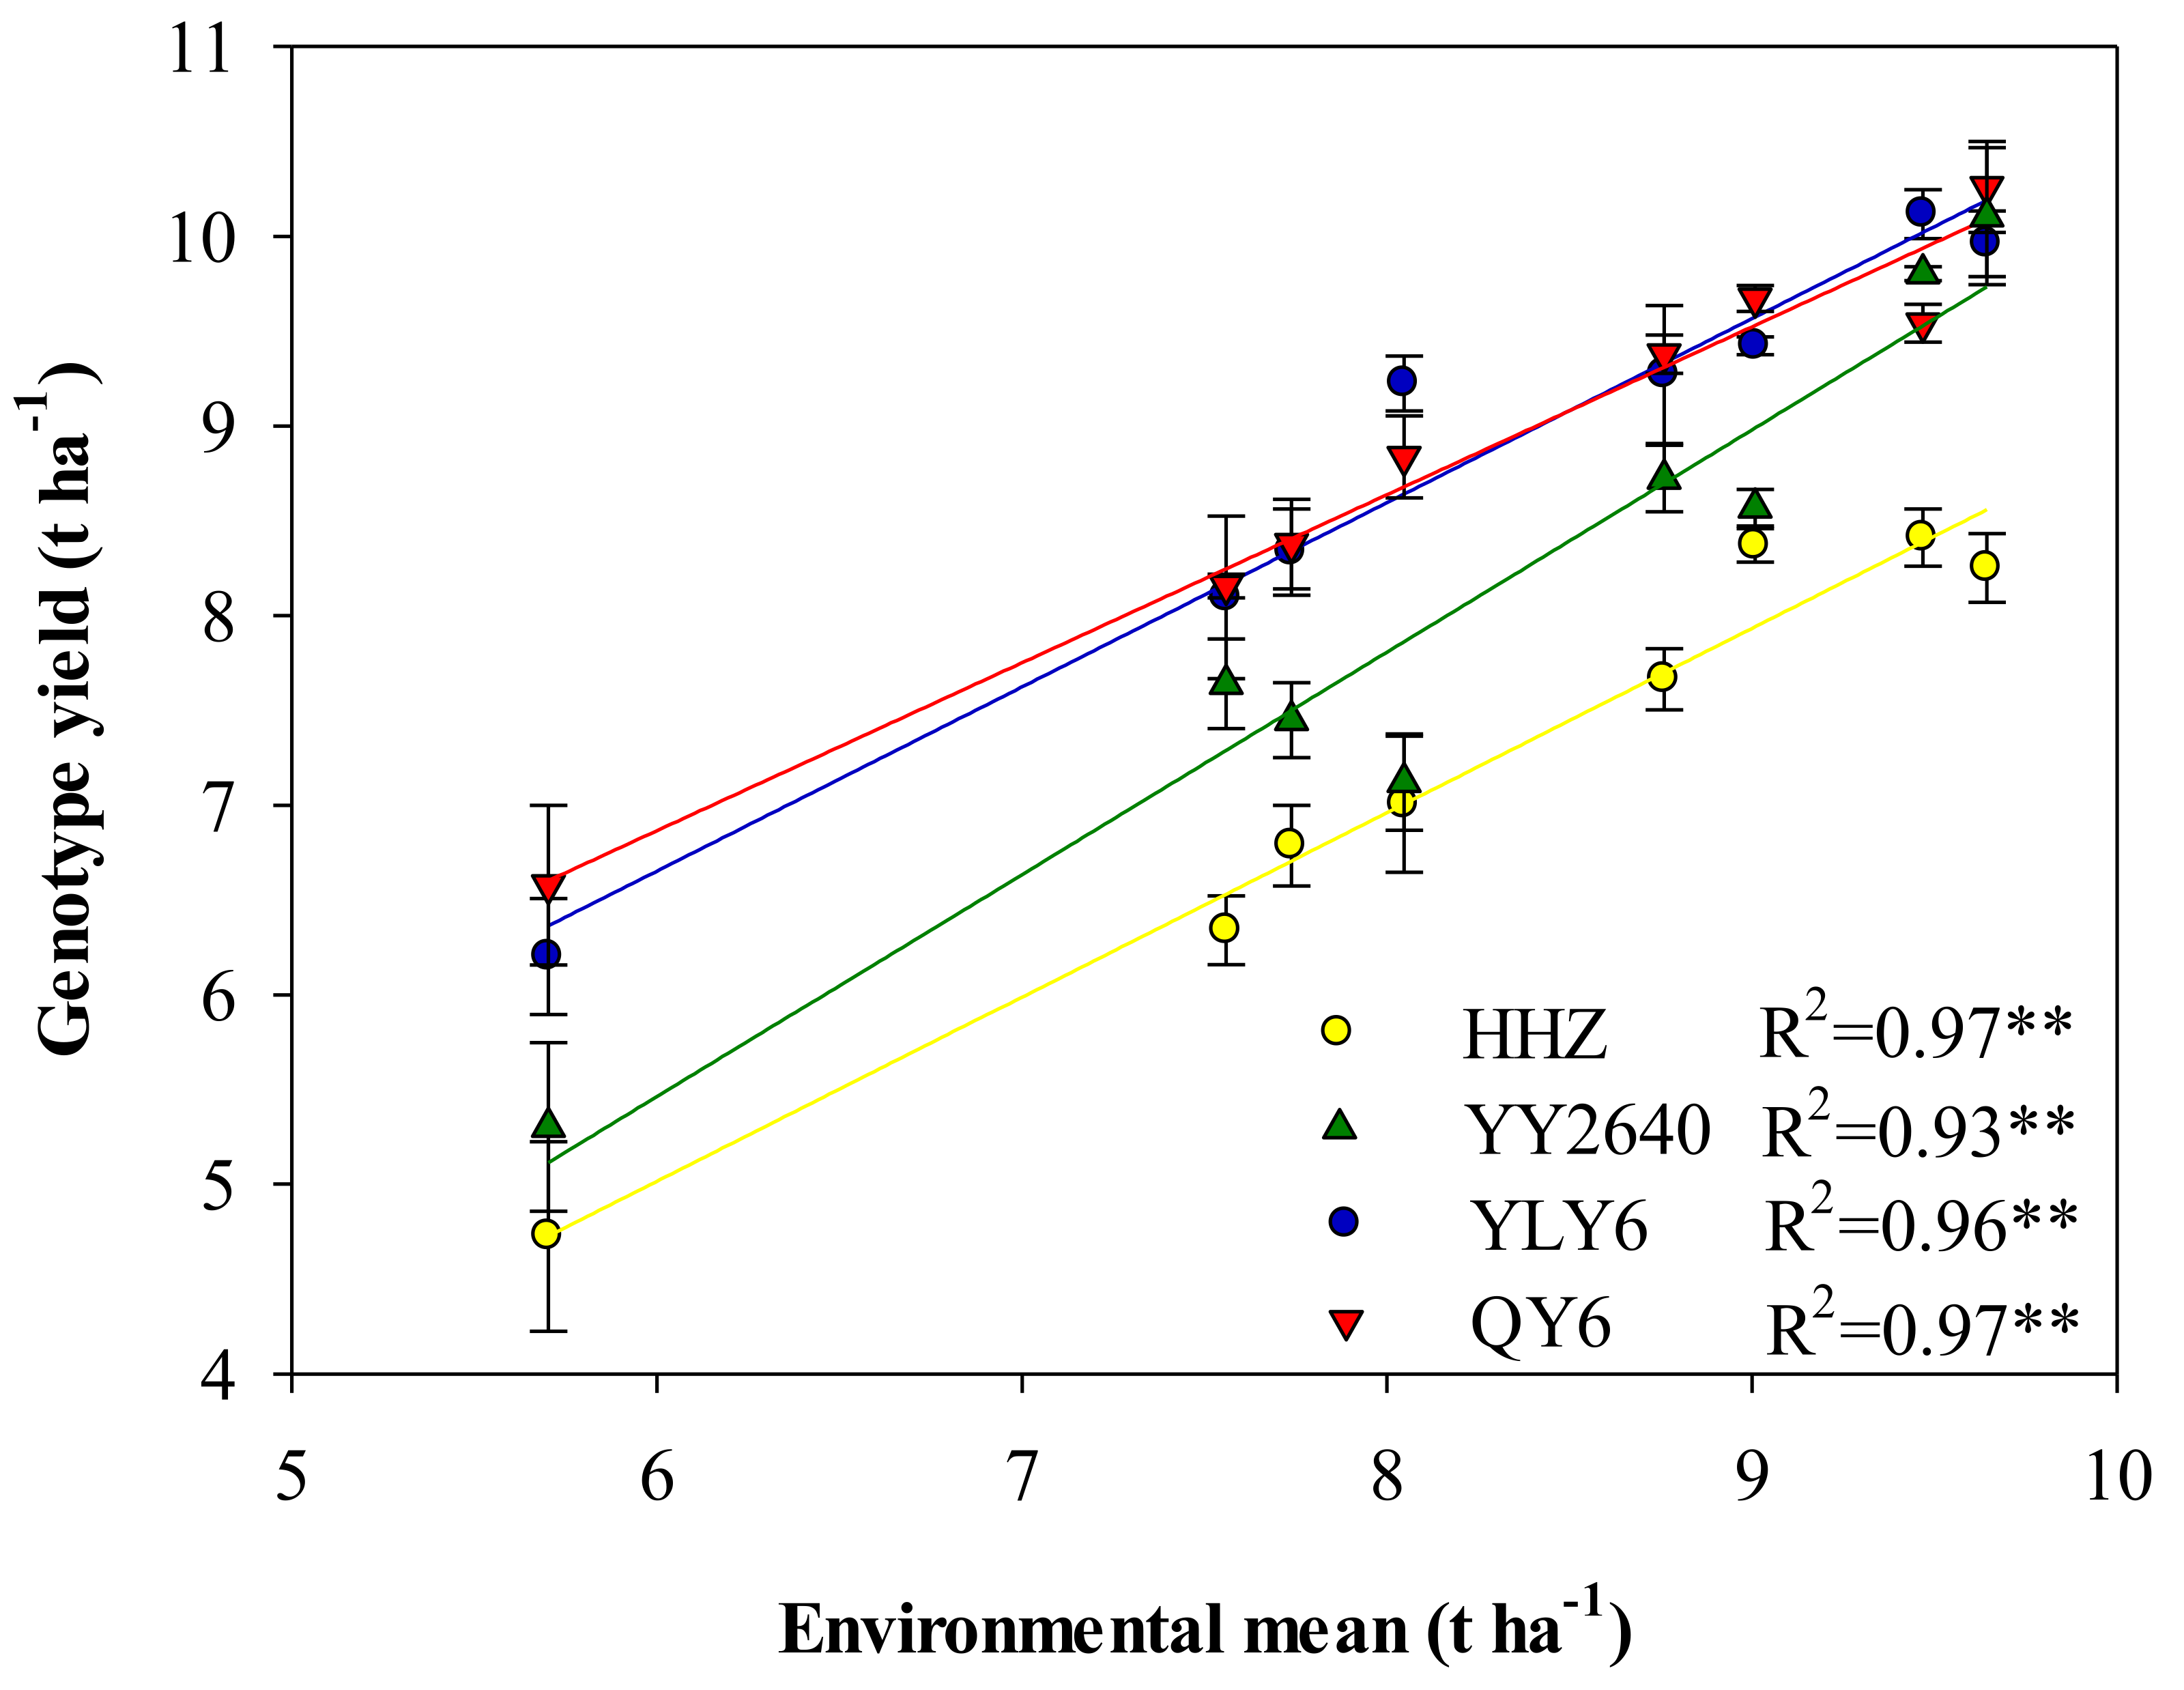
3.1. Growth Duration, Grain Yield, and NUEg

The total growth period, the vegetative growth period (from sowing to panicle initiation), and the grain filling period were shorter under LF N0 and LF N100 treatments than under CK N0 and CK N100 treatments across four varieties (Table 2). Among the four varieties, HHZ exhibited the shortest total growth period and grain filling period, and these two periods of YLY6 and QY6 were longer than those of YY2640 under four treatments. Among four varieties, YY2640 had the shortest vegetative growth period, and this period of YLY6 and QY6 was longer than that of HHZ across the four treatments.
The grain yield of YLY6 and QY6 under four different treatments in different years was higher than that of HHZ (Figure 3). Under CK N100 treatment, the grain yield of YY2640 was comparable to that of YLY6 and QY6. With the decrease in soil fertility and N application, YY2640 exhibited a higher degree of decrease than the other three varieties. Overall, YY2640 demonstrated the lowest yield stability among four varieties across different years and treatments.
NUEg was significantly higher under the LF N100 treatment than under the CK N100 treatment across four varieties (Table 3). The average NUEg of the four varieties was 56.0 kg kg−1 and 57.7 kg kg−1 under the CK N0 and LF N0 treatment, respectively. The NUEg of QY6 under LF N0 treatment was the highest, reaching 65.9 kg kg−1. Under the CK N100 treatment, the NUEg of YY2640 was comparable to that of YLY6 and QY6 for each year, but under the LF N100 treatment, it was significantly lower than that of YLY6 and QY6 in 2017 and significantly lower than YLY6 in 2016. Under the CK N0 and LF N0 treatments, the NUEg of YY2640 was significantly lower than YLY6 and QY6. The NUEg of HHZ was significantly lower than that of the three other varieties across the years, soil fertility treatments, and N application rates.

3.2. Sink–Source Relationship

Compared with the CK treatment, the LF treatment significantly decreased the four variety mean values of the spikelet number at MA and LAI at HD across the years, but significantly increased the spikelet/leaf ratio except in 2017 (Table 4). Under CK N100 treatment, the spikelet number of YY2640 (58.0 × 10³–59.8 × 10³ m−2) was significantly larger than that of HHZ (51.0 × 10³–54.5×10³ m−2), and the spikelet number of YY2640 and HHZ was significantly higher than that of YLY6 (41.4 × 10³–43.1 × 10³ m−2) and QY6 (41.1 × 10³–45.4 × 10³ m−2) across the years. However, YY2640 exhibited an increasingly small advantage in spikelet number over YLY6 and QY6 with the reducing soil fertility. The leaf area index (LAI) at HD of HHZ and YY2640 was significantly lower than that of YLY6 and QY6 under different soil fertility and N treatments. YY2640 had the largest spikelet number (except for N0 treatment in 2018) and the lowest LAI value among the four varieties across the years and different treatments. The spikelet/leaf ratio of HHZ and YY2640 was significantly larger than that of YLY6 and QY6, and YY2640 exhibited the largest spikelet/leaf ratio across the years and treatments.

3.3. Dry matter, Nitrogen Accumulation, and Translocation Characteristics

Compared with CK, the LF treatment significantly reduced pre-flowering dry matter accumulation (Table 5). Post-flowering dry matter accumulation was decreased with reducing soil fertility across years and varieties, and pre-flowering dry matter translocation was increased except with the N0 treatment in 2018. Pre-flowering dry matter accumulation was significantly lower in HHZ and YY2640 than in YLY6 and QY6 across years and different treatments. The post-flowering dry matter weight of YY2640 was 31.7% and 17.2% higher than the average dry matter weight of the other three varieties under CK treatment and LF treatment, respectively. Moreover, the pre-flowering dry matter translocations of HHZ and YY2640 were also lower than YLY6 and QY6 in CK and LF.
Compared with CK, the LF treatment significantly decreased pre-flowering N accumulation. Post-flowering N accumulation and pre-flowering N translocation also exhibited a decreasing trend with a reduction in soil fertility (Table 6). The pre-flowering N accumulation of HHZ and YY2640 was lower than that of YLY6 and QY6 across years and different treatments. Under CK, the post-flowering N accumulation of YY2640 was 39.1% higher than the mean value of other three varieties across years. However, the advantage of YY2640 in post-flowering N accumulation became increasingly smaller with the reduction in soil fertility. Moreover, the pre-flowering N translocation in HHZ and YY2640 were lower than that in YLY6 and QY6 across years and treatments.

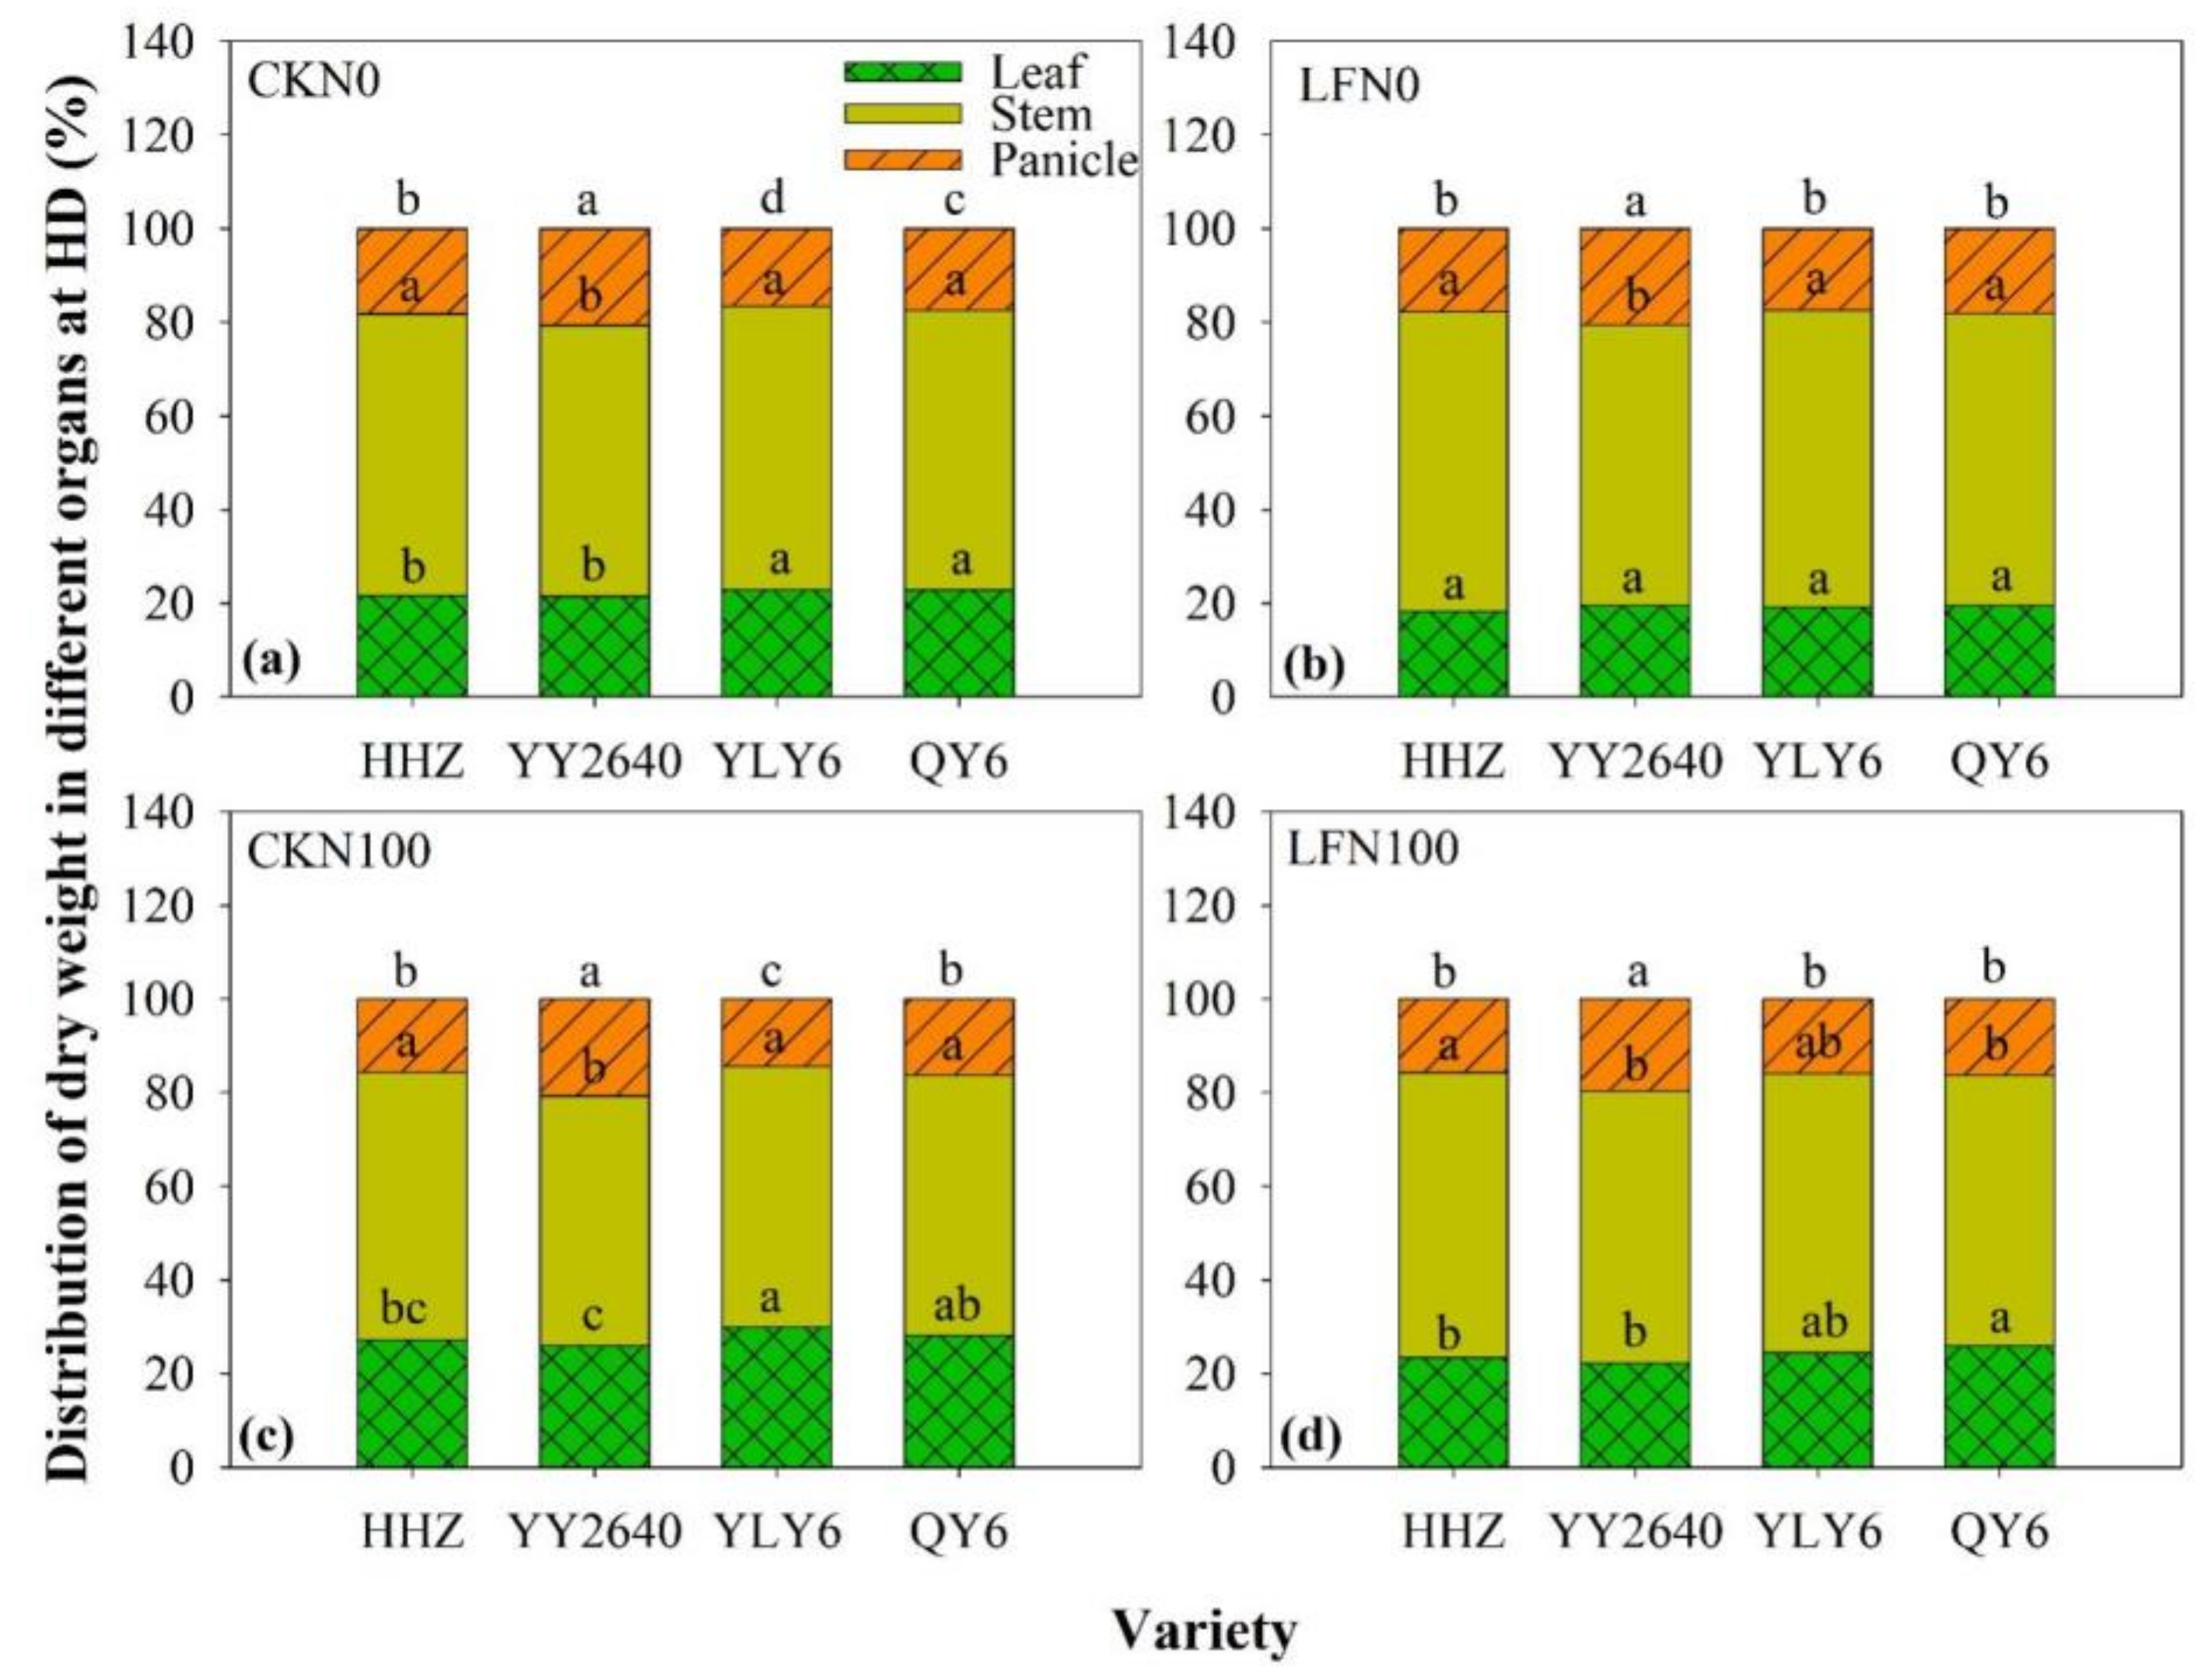
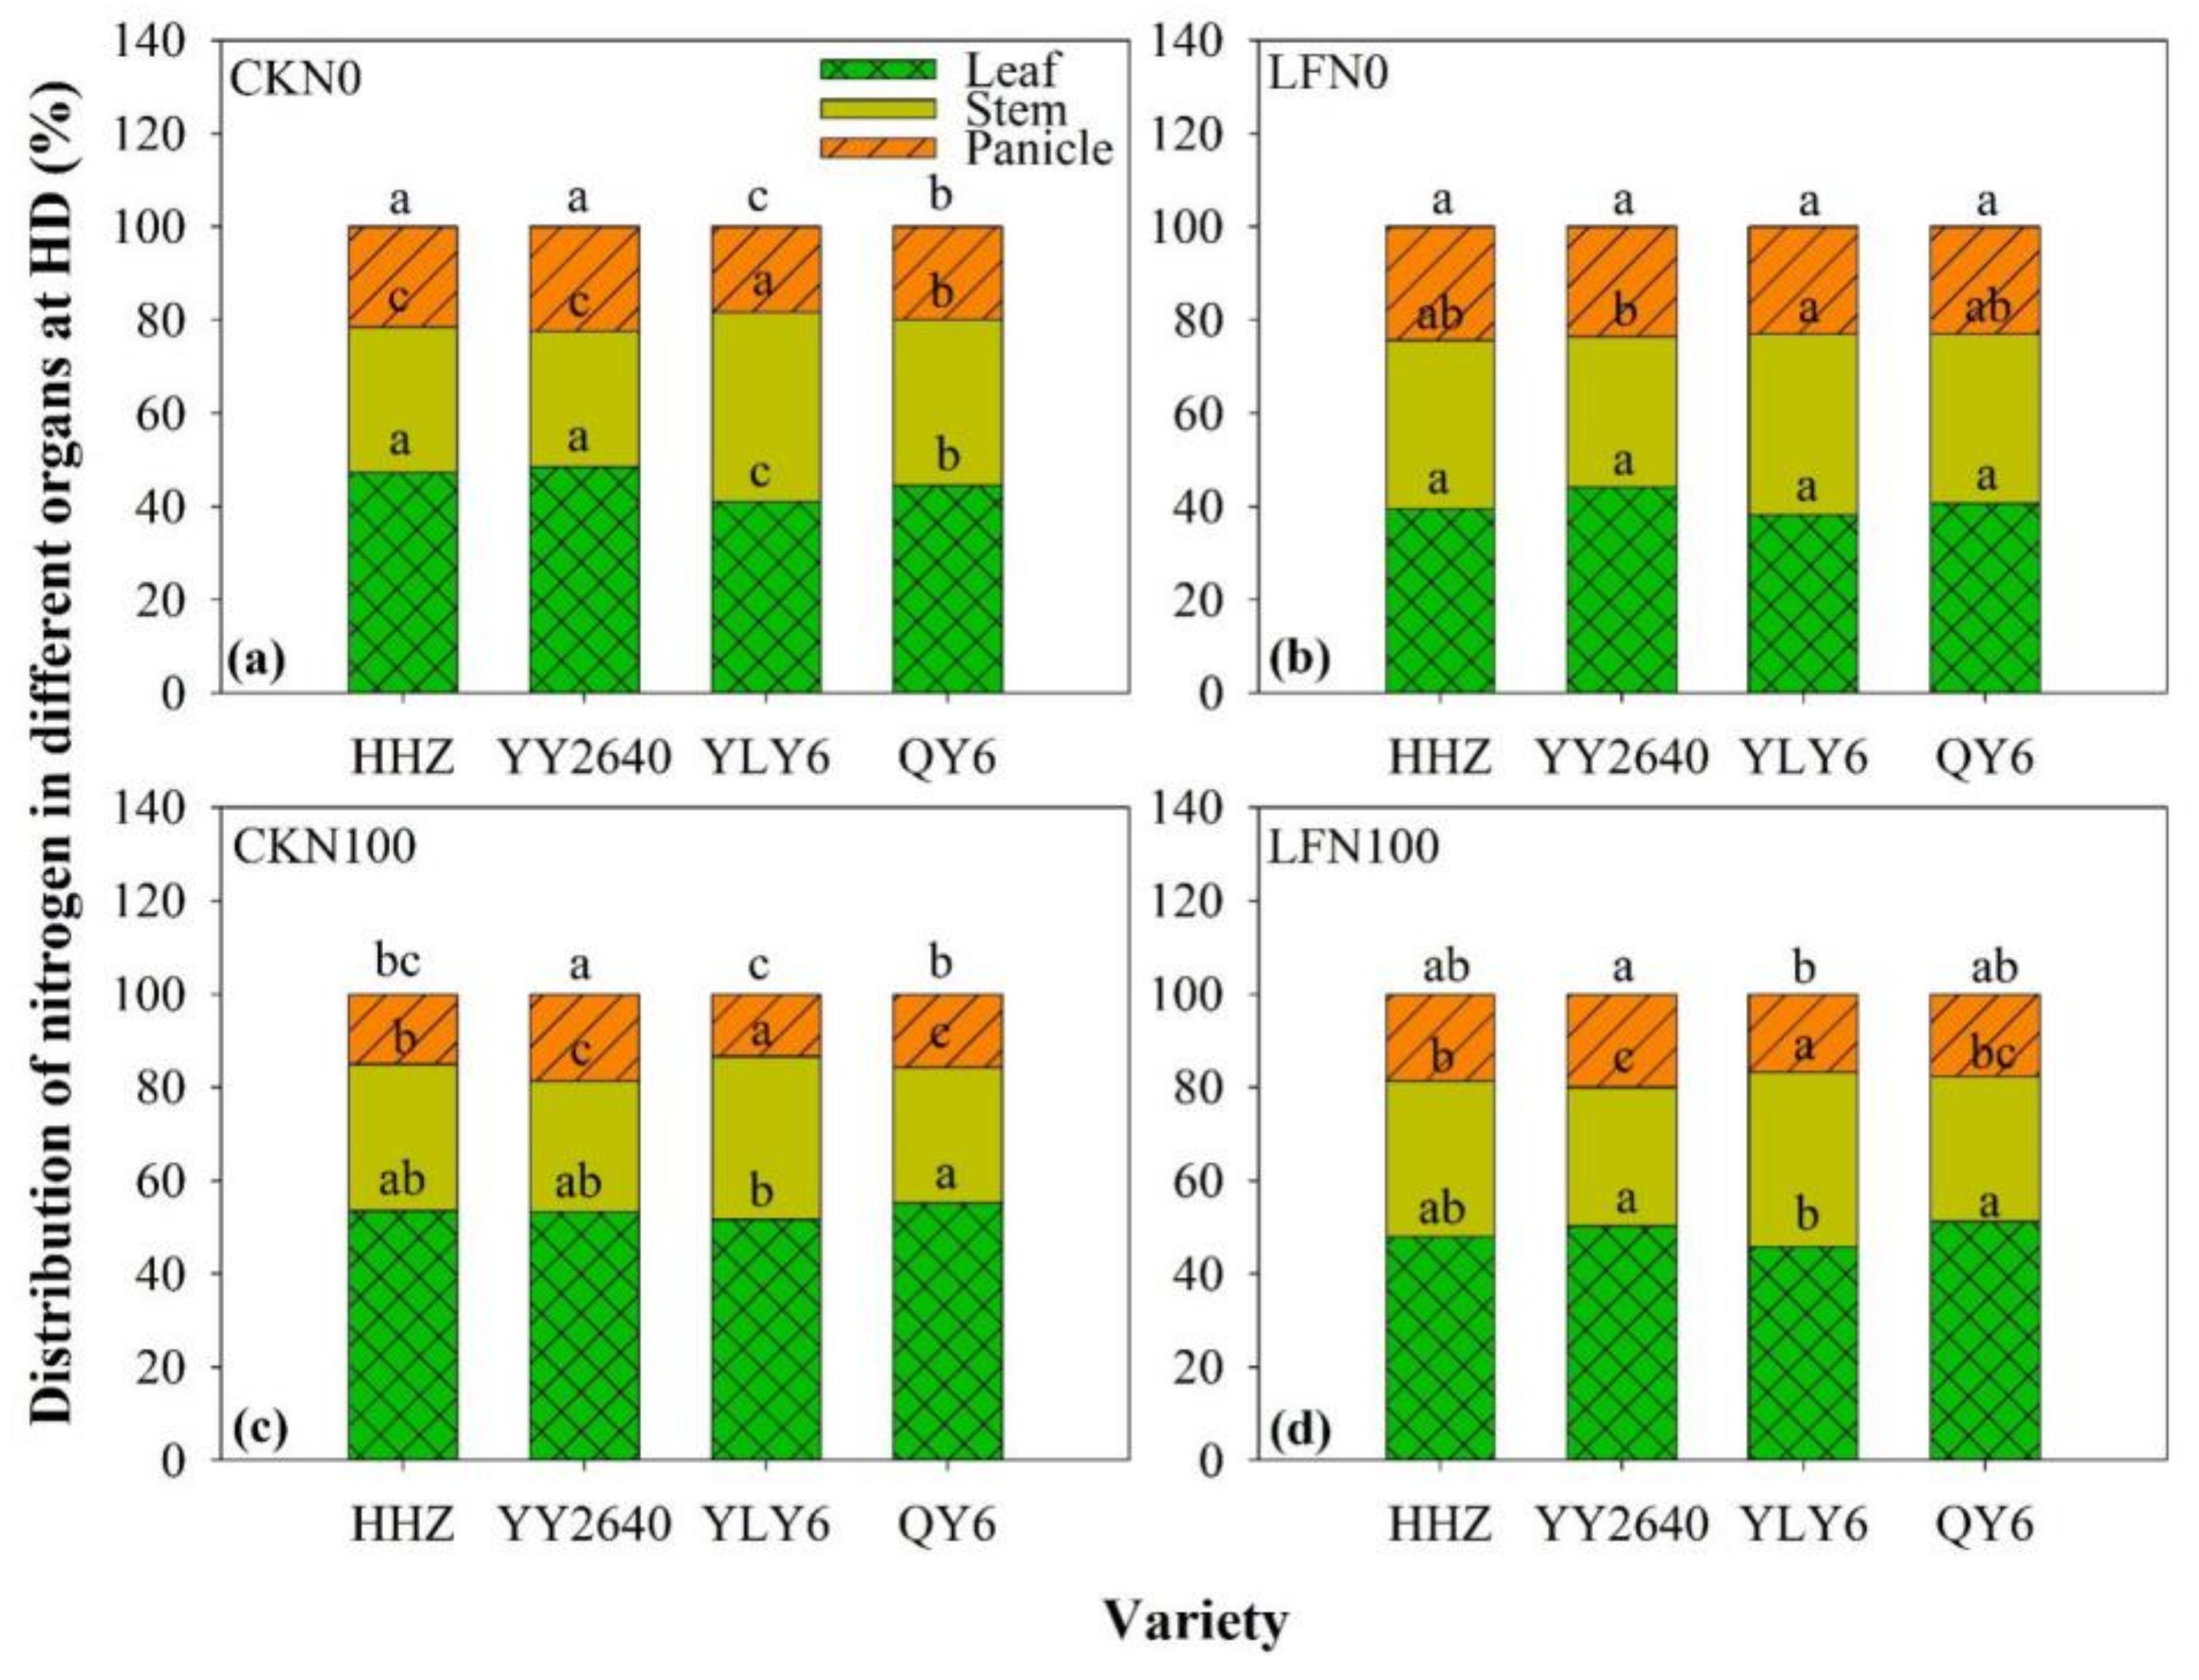
3.4. Dry Matter and Nitrogen Accumulation in Leaf, Stem, and Panicle at HD

In 2018, under the CK N100 treatment, the average dry weight distribution of the four varieties in leaf, stem, and panicle was 27.9%, 55.5%, and 16.7%; under the LF N100 treatment, it was 24.0%, 59.1%, and 16.9%; under the CK N0 treatment, it was 22.2%, 59.6%, and 18.2%, and under the LF N0 treatment, it was 19.2%, 62.4%, and 18.4% (Figure 4). With the N rate and soil fertility reduced, the dry weight percentage was increased in stem and panicle, but it was decreased in leaf. The dry weight percentage in the panicle of YY2640 was significantly higher than that of other varieties under different treatments, and YLY6 exhibited a significantly lower dry weight percentage than the other three varieties under the CK N0 and CK N100 treatments. The dry weight percentage in stem of YY2640 was significantly lower than that of the other three varieties under different treatments except for the LF N100 treatment. Moreover, the dry weight percentages in leaf of HHZ and YY2640 were lower than that of YLY6 and QY6 across soil fertility and N treatments.
In 2018, under the CK N100 treatment, the average N percentage of the four varieties in leaf, stem, and panicle was 53.4%, 30.9%, and 15.7%; under the LF N100 treatment, it was 48.8%, 32.9%, and 18.3%; under the CK N0 treatment, it was 45.3%, 34.1%, and 20.5%; and under the LF N0 treatment, it was 40.7%, 35.8%, and 23.5% (Figure 5). The percentage of N in stem and panicle was increased, and that in leaf was decreased with the N application rate and a reduction in soil fertility. The percentage of N in the panicle of YY2640 was highest, which was 13.1% higher than the average N percentage of the other three varieties. YLY6 exhibited the lowest N percentage in panicle among the four varieties, which was 11.4% lower than the average N percentage of the other three varieties across soil fertility and N treatments. The N percentage in the stem of YY2640 and YLY6 displayed an opposite trend in panicle. The N percentage in the stem of YY2640 was 14.0% lower than the mean value of the other three varieties, and that of YLY6 was 18.9% higher than the mean value of other three varieties across soil fertility and N treatments. Moreover, the N in the leaf of YLY6 was 8.1% lower than the mean value of the three other varieties under different soil fertility and N treatments.

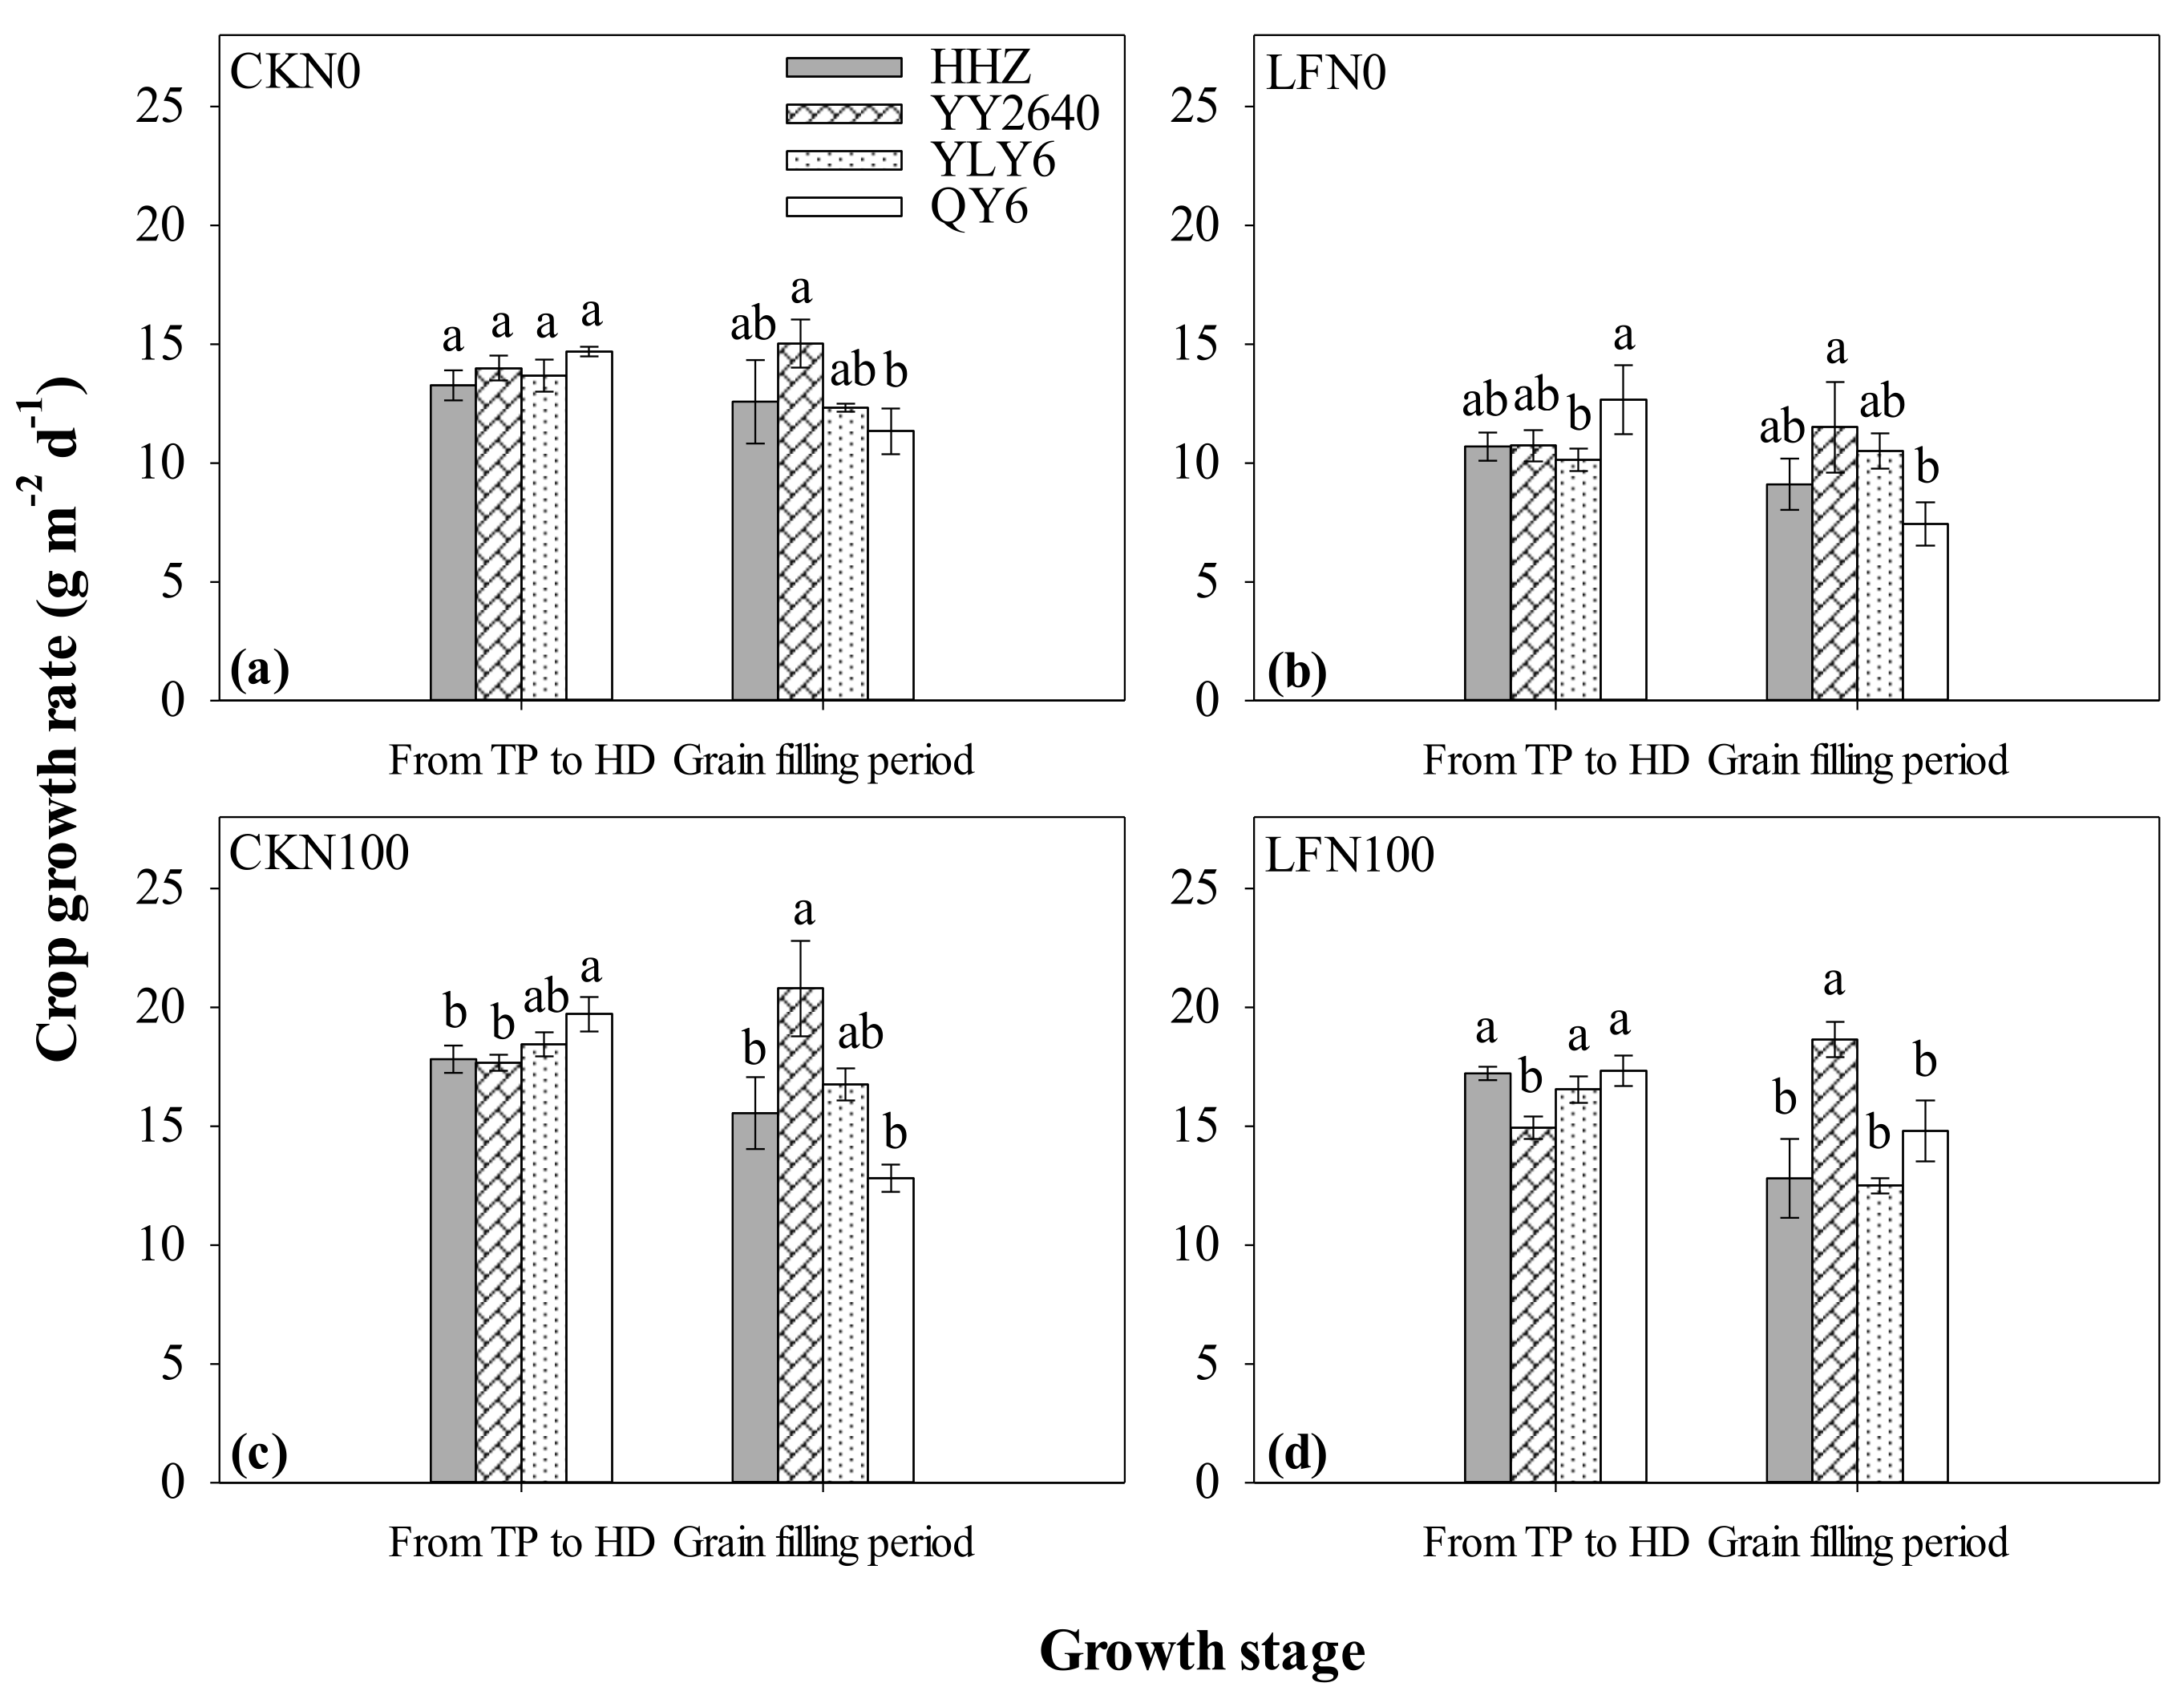
3.5. SPAD and Crop Growth Rate

The leaf SPAD value representing N concentration showed a decreasing trend with the growth progression from heading to maturity under different soil fertility and N treatments in 2018 (Figure 6). Specifically, at heading and day 21 after heading (DAH21), YY2640 displayed the highest SPAD value, whereas HHZ exhibited the lowest under different soil fertility and N treatments. At HD and DAH21, the SPAD value of YY2640 was 10.5% and 10.2% higher than the mean value of the three other varieties, respectively, whereas that of HHZ was 2.2% and 19.2% lower across soil fertility and N treatments. At maturity, the SPAD value of YY2640 was also highest among the four varieties, which was about 95.1% higher than mean SPAD value of the other varieties across soil fertility and N treatments.
From transplanting (TP) to heading (HD), the crop growth rate of the four varieties ranged within 11.1–18.4 g m−2 d−1, and during the grain filling period, it was 9.9–16.5 g m−2 d−1 across soil fertility and N treatments in 2018 (Figure 7). The crop growth rate of YY2640 was 5.2% lower than the mean value of the other varieties from TP to HD, but it was 32.4% higher than the mean value of other varieties during the grain filling period under different soil fertility treatments and N treatments.

4. Discussion

The response of grain yield to low soil fertility and low N input was different among varieties. The average rice yield of Yongyou2640 was comparable to that of YLY6 and QY6 under the CK N100 treatment, but it was significantly lower than that of YLY6 and QY6 under the LF treatment. The LF treatment (N0 and N100) reduced the yield of YY2640 by 11.0–29.1%, and that of HHZ by 8.8–30.7%. The yield reduction degree of YY2640 and HHZ was greater than that of YLY6 (reduced by 8.5–25.4%) and QY6 (by 1.7–21.6%). It has been reported that under CK N180 treatment, the yield of YY2640 was 19.4–42.3% higher than that of YLY6 and QY6 [41]. These results indicated that the large-panicle type variety YY2640 exhibited a high yield potential, but a poor yield stability under different soil N conditions. Our data showed that the large-panicle variety produced a low grain yield under low soil fertility and low N input, suggesting that this variety required a high N supply from indigenous N or N fertilizer to realize its advantage in a high-yield potential [37]. In this study, the inbred variety HHZ exhibited a low yield potential and poor yield stability, whereas YLY6 and QY6 had a moderate yield potential and high yield stability. YLY6 and QY6 produced a higher grain yield under low soil fertility and low N input. Our previous study found that an N input reduction by 50.0% (from 180 to 90 kg ha−1) caused a yield reduction of 1.7–8.8% for YLY6 and 7.7–12.8% for HHZ [42]. Taken together, variety with a moderate spikelet/leaf ratio had better adaptability to low soil fertility and low N input conditions than variety with a relatively large- or small-panicle type variety.
Rice yield is determined by the coordination of source and sink, and since the 1930s, the research on rice breeding aimed at improving yield potential has been devoted to increasing sink size, namely, the spikelet number per panicle [17,31]. Simultaneously, source-related traits including leaf area index, leaf N content, specific leaf weight, and stomatal density have also been significantly improved during genetic improvement [31,43]. In addition, canopy structure has also been optimized to increase solar radiation use efficiency [27]. Overall, genetic improvement aimed at increasing rice yield tends to result in allocating more resources to panicles than to leaf, which was supported by the increase in the spikelet/leaf ratio [31]. In soybean, a leaf area decrease led to a yield increase in newly developed varieties [44]. The indica-japonica hybrid rice varieties “Yongyou” series are the most popular varieties with a superhigh yield potential under ample N supply conditions [45]. Under a moderate to high N supply condition, the yield and NUEg of YY2640 was comparable to or significantly higher than that of YLY6 and QY6, which might be mainly attributed to its large panicle and high spikelet/leaf ratio [46,47], and the large-panicle Yongyou2640 has been reported to have high zeatin and zeatin riboside contents in young panicles and roots, high root activity, and high non-structural carbohydrates (NSC) accumulation in stems during the reproductive growth stage [47]. In the present study, the percentages of dry matter and N in panicle of YY2640 were higher than those of the other three varieties, and they were increased with the decreasing N supply. However, the physiological and molecular mechanisms regulating the distribution of dry matter and N among different plant organs during panicle development deserve further analysis.
Notably, all the above-mentioned studies were conducted under sufficient N supply conditions. In the present study, the larger spikelet number per panicle and higher spikelet/leaf ratio in YY2640 compared with YLY6 and QY6 under low soil fertility treatments resulted in significantly lower dry matter accumulation, eventually significantly reducing the grain yield and NUEg. Dry matter production mainly depends on canopy photosynthesis which is closely related to leaf area index (LAI), canopy structure, and photosynthesis per leaf area [48,49,50]. The genetically modified YY4949 has been reported to have a significantly higher grain yield and NUEg than YLY6 at the N100 application rate, despite its significantly lower LAI [27], which might be due to its improved leaf properties such as a high leaf N content, an optimized canopy structure, and a consistent distribution of N and light in the canopy during the grain filling stage [27]. YY2640 has also been reported to have a significantly higher photosynthetic rate than the inbred japonica super rice variety Liangeng 7 [46]. This might explain our results that YY2640 had a significantly higher crop growth rate and leaf SPAD value during the grain filling period under low soil fertility, but only a low increase in post-flowering dry matter production was observed which might be attributed to the lower LAI. Our results were consistent with previous reports that longer leaf stay-green duration and a higher crop growth rate after heading ensured more dry matter accumulation during grain filling to achieve a high grain yield of indica-japonica hybrid varieties [20,51]. However, the leaf property optimization of the YY2640 variety, such as the leaf N content increase, could not compensate for the adverse effect of low LAI, thus leading to significantly lower pre-flowering dry matter accumulation and dry matter translocation from stem to grain during grain filling, eventually lowering the grain yield of the YY2640 variety [52].
Long duration varieties (with longer vegetative and reproductive duration) exhibit higher yield even under a low N condition because of their advantage in higher N uptake from poor soil conditions and larger biomass accumulation over short duration genotypes [53]. In the present study, compared with YLY6 and QY6, the large-panicle variety YY2640 accumulated more dry matter and nitrogen in panicles across soil fertility and N treatments, which might be attributed to the fact that YY2640 entered the reproductive growth stage earlier. In addition, the growth period before heading of YY2640 was shorter than YLY6 and QY6, thus limiting dry matter and N accumulation for leaf area formation. In the case of insufficient N supply from soil fertility and additional N fertilizer, the reduced dry matter and N accumulation in YY2640 before heading has greater limiting effects on leaf area formation than on spikelet formation. Suriyagoda et al. [54] found that dry matter and N accumulation rates of short-duration rice varieties were only 64% and 87% of medium- and long-duration rice varieties in the low-fertile sites, and that these differences became less pronounced at the high-fertile site. In the present study, the crop growth rate of YY2640 before heading was 5.2% lower than that of other varieties, and thus longer crop duration and leaf area formation duration would be required for biomass accumulation at heading. Considering this, the total growth duration of YY2640 is suggested to be prolonged, so that the vegetative growth duration could be long enough for dry matter and N accumulation to supply nutrients for leaf area formation with the final purpose of controlling the yield reduction under low soil fertility and low N supply conditions. Therefore, prolonging the growth duration of a large-panicle variety via genetic improvement could be an important development direction in the future.

5. Conclusions

The present study compared the grain yield and NUEg of rice varieties with different source–sink relationships under low soil fertility and low N supply conditions. The grain yield of YY2640, an indica-japonica hybrid, was significantly higher than that of YLY6 and QY6 at N100 supply without a topsoil removal condition, but it was dramatically decreased with the reduction in soil fertility and N fertilizer rate, which might be mainly due to the lower biomass accumulation and NUEg in YY2640 at low nutrient supply conditions. The high spikelet/leaf ratio of YY2640 resulted in more biomass and N partition to panicles rather than to leaves, which led to the significantly lower LAI and biomass accumulation before flowering, eventually resulting in a source–sink imbalance. YLY6 and QY6 with a suitable spikelet/leaf ratio have a high yield stability under low soil fertility and low N supply conditions mainly due to the more reasonable distribution of dry matter and nitrogen in the organs. In conclusion, the present study indicated that source–sink relationships of varieties should be optimized according to soil fertility and N fertilizer input so as to increase grain yield and resource use efficiency.

Supplementary Materials

The following supporting information can be downloaded at: https://www.mdpi.com/article/10.3390/agronomy13030907/s1, Table S1: Analysis of variance (ANOVA) for grain yield and total N uptake of different cultivars grown under different soil fertility and nitrogen treatments at Wuxue County, Hubei Province, China in 2016–2018; Table S2: Grain yield and total N uptake of different cultivars grown under different soil fertility and nitrogen treatments at Wuxue County, Hubei Province, China in 2016–2018; Table S3: Yield components of four rice varieties grown under different soil treatments in 2016–2018.

Author Contributions

Conceptualization, F.W.; methodology, Y.Z.; software, P.S.; validation, X.W. and F.W.; formal analysis, X.W.; investigation, X.L.; resources, X.L.; data curation, X.L.; writing—original draft preparation, X.L.; writing—review and editing, F.W.; visualization, F.W.; supervision, S.P.; project administration, S.P.; funding acquisition, S.P. All authors have read and agreed to the published version of the manuscript.

Funding

This research was funded by [the National Natural Science Foundation of China] grant number [No. 32071948 and No.32272202].

Data Availability Statement

All relevant data are within the manuscript and its Supplementary Materials.

Acknowledgments

This work was supported by the National Natural Science Foundation of China (No. 32071948 and No.32272202).

Conflicts of Interest

The authors declare no conflict of interest.

References

  1. Chen, H.P. Rice consumption in China: Can China change rice consumption from quantity to quality? In Rice Is Life: Scientific Perspectives for the 21st Century; Toriyama, K., Heong, K.L., Hardy, B., Eds.; International Rice Research Institute: Los Banos, Philippines, 2005; pp. 497–499. [Google Scholar]
  2. Wang, G.H.; Zhang, Q.C.; Witt, C.; Buresh, R.J. Opportunities for yield increases and environmental benefits through site-specific nutrient management in rice systems of Zhejiang province, China. Agric. Syst. 2007, 94, 801–806. [Google Scholar] [CrossRef]
  3. Peng, X.L.; Liu, Y.Y.; Luo, S.; Fan, L.C.; Song, T.X.; Guo, Y.W. Effects of site-specific nitrogen management on yield and dry matter accumulation of rice from cold areas of Northeastern China. Agric. Sci. China 2007, 6, 715–723. [Google Scholar] [CrossRef]
  4. Yang, X.G.; Chen, F.; Lin, X.M.; Liu, Z.J.; Zhang, H.L.; Zhao, J.; Li, K.N.; Ye, Q.; Li, Y.; Lv, S.; et al. Potential benefits of climate change for crop productivity in china. Agric. Forest Meteorol. 2015, 208, 76–84. [Google Scholar] [CrossRef]
  5. Zhang, Q.F. Strategies for developing green super rice. Proc. Natl. Acad. Sci. USA 2007, 104, 16402–16409. [Google Scholar] [CrossRef] [Green Version]
  6. Li, Z.G.; Liu, Z.H.; Anderson, W.; Yang, P.; Wu, W.B.; Tang, H.J.; You, L.Z. Chinese rice production area adaptations to climate changes, 1949–2010. Environ. Sci. Technol. 2015, 49, 2032–2037. [Google Scholar] [CrossRef]
  7. Grassini, P.; Eskridge, K.M.; Cassman, K.G. Distinguishing between yield advances and yield plateaus in historical crop production trends. Nat. Commun. 2013, 4, 2918. [Google Scholar] [CrossRef] [Green Version]
  8. Jiang, Q.G.; Goto, S.; Takamura, H. LUCC and accompanied soil degradation in China from 1960s to 1990s. J. Geosci. Res. Northeast Asia 2002, 5, 62–71. [Google Scholar]
  9. Li, G.H.; Xue, L.H.; Gu, W.; Yang, C.D.; Wang, S.H.; Ling, Q.H.; Qin, X.; Ding, Y.F. Comparison of yield components and plant type characteristics of high-yield rice between Taoyuan, a ‘special eco-site’ and Nanjing, China. Field Crops Res. 2009, 112, 214–221. [Google Scholar] [CrossRef]
  10. Long, S.P.; Marshall-Colon, A.; Zhu, X.G. Meeting the global food demand of the future by engineering crop photosynthesis and yield potential. Cell 2015, 161, 56–66. [Google Scholar] [CrossRef] [Green Version]
  11. Jiang, P.; Xie, X.B.; Huang, M.; Zhou, X.F.; Zhang, R.C.; Chen, J.N.; Wu, D.D.; Xia, B.; Xiong, H.; Xu, F.X.; et al. Characterizing N uptake and use efficiency in rice as influenced by environments. Plant Prod. Sci. 2016, 19, 96–104. [Google Scholar] [CrossRef] [Green Version]
  12. Zeng, X.B.; Zhang, J.B.; Wei, C.F.; Yu, W.T.; Huang, D.Y.; Xu, M.G.; Xu, J.M. The status and reclamation strategy of low-yield fields in china. Acta Pedolo. Sin. 2014, 51, 675–682. [Google Scholar]
  13. Ying, J.F.; Peng, S.B.; He, Q.R.; Yang, H.; Yang, C.D.; Visperas, R.M.; Cassman, K.G. Comparison of high-yield rice in tropical and subtropical environments. I. Determinants of grain and dry matter yields. Field Crops Res. 1998, 57, 71–84. [Google Scholar] [CrossRef]
  14. Yuan, P.R.; Sun, C.Q.; Yang, C.D.; Zhou, N.; Ying, J.F.; Peng, S.B.; Wang, X.Y. Analysis on grain yield and yield components of the 15 t hm−2 high yielding Indica rice (Oryza sativa L.) in Yunnan. Acta Agron. Sin. 2000, 26, 756–762. (In Chinese) [Google Scholar]
  15. Zhang, H.; Chen, T.T.; Liu, L.J.; Wang, Z.Q.; Yang, J.C.; Zhang, J.H. Performance in grain yield and physiological traits of rice in the Yangtze River basin of china during the last 60 yr. J. Integr. Agric. 2013, 12, 57–66. [Google Scholar] [CrossRef]
  16. Li, H.W.; Liu, L.J.; Wang, Z.Q.; Yang, J.C.; Zhang, J.H. Agronomic and physiological performance of high-yielding wheat and rice in the lower reaches of Yangtze River of China. Field Crops Res. 2012, 133, 119–129. [Google Scholar] [CrossRef]
  17. Zhu, G.L.; Peng, S.B.; Huang, J.L.; Cui, K.H.; Nie, L.X.; Wang, F. Genetic improvements in rice yield and concomitant increases in radiation- and nitrogen- use efficiency in Middle Reaches of Yangtze River. Sci. Rep. 2016, 6, 21049. [Google Scholar] [CrossRef] [Green Version]
  18. Jiang, P. Characteristics, and high-yielding cultivation techniques for good quality rice yongyou 15. Fujian Sci. Technol. Rice Wheat 2013, 31, 47–48. (In Chinese) [Google Scholar]
  19. Hu, Y.J.; Xing, Z.P.; Gong, J.L.; Liu, G.T.; Zhang, H.C.; Dai, Q.G.; Huo, Z.Y.; Xu, K.; Wei, H.Y.; Guo, B.W.; et al. Study on Population Characteristics and Formation Mechanisms for High Yield of Pot-Seedling Mechanical Transplanting Rice. Sci. Agric. Sin. 2014, 47, 865–879. (In Chinese) [Google Scholar]
  20. Wei, H.Y.; Zhang, H.C.; Blumwald, E.; Li, H.L.; Cheng, J.Q.; Dai, Q.G.; Huo, Z.Y.; Xu, K.; Guo, B.W. Different characteristics of high yield formation between inbred japonica super rice and inter-sub-specific hybrid super rice. Field Crops Res. 2016, 198, 179–187. [Google Scholar] [CrossRef]
  21. Wang, X.Y.; Wei, H.H.; Zhang, H.C.; Sun, J.; Zhang, J.M.; Li, C.; Lu, H.B.; Yang, J.W.; Ma, R.R.; Xu, J.F.; et al. Population characteristics for super-high yielding hybrid rice Yongyou 12 (>13.5 t ha−1). Acta Agron. Sin. 2014, 40, 2149–2159. (In Chinese) [Google Scholar] [CrossRef]
  22. Venkateswarlu, B. Source-sink interrelationships in lowland rice. Plant Soil 1976, 44, 575–586. [Google Scholar] [CrossRef]
  23. Shi, W.J.; Xiao, G.; Struik, P.C.; Jagadish, K.S.V.; Yin, X.Y. Quantifying source-sink relationships of rice under high night-time temperature combined with two nitrogen levels. Field Crops Res. 2017, 202, 36–46. [Google Scholar] [CrossRef]
  24. Adachi, S.; Ohkubo, S.; San, N.S.; Yamamoto, T. Genetic determination for source capacity to support breeding of high-yielding rice (Oryza sativa). Mol. Breed. 2020, 40, 20. [Google Scholar] [CrossRef]
  25. Cao, X.Z.; Zhu, Q.S. Study on characteristics of the relationship between source and sink rice varieties and their classification. Acta Agron. Sin. 1987, 13, 265–272. (In Chinese) [Google Scholar]
  26. Zhou, W.X.; Lei, C.; Tu, N.M. Research trends on source-sink relationship of rice. J. Hunan Agric. Univ. 2004, 30, 389–393. (In Chinese) [Google Scholar]
  27. Huang, L.Y.; Yang, D.S.; Li, X.X.; Peng, S.B.; Wang, F. Coordination of high grain yield and high nitrogen use efficiency through large sink size and high post-heading source capacity in rice. Field Crops Res. 2019, 233, 49–58. [Google Scholar] [CrossRef]
  28. Ma, G.H.; Zhang, Y.Z. Relationship between source-sink in rice and its progress in research. J. Hubei Agric. Coll. 1992, 12, 61–67. (In Chinese) [Google Scholar]
  29. He, A.B.; Wang, W.Q.; Jiang, G.L.; Sun, H.J.; Jiang, M.; Man, J.G.; Cui, K.H.; Huang, J.L.; Peng, S.B.; Nie, L.X. Source-sink regulation and its effects on the regeneration ability of ratoon rice. Field Crops Res. 2019, 236, 155–164. [Google Scholar] [CrossRef]
  30. Liu, L.J.; Zhang, H.; Ju, C.X.; Xiong, Y.W.; Bian, J.L.; Zhao, B.H.; Yang, J.C. Changes in grain yield and root morphology and physiology of mid-season rice in the Yangtze River basin of China during the last 60 years. J. Agric. Sci. 2014, 6, 1–15. [Google Scholar] [CrossRef] [Green Version]
  31. Ju, C.X.; Tao, J.; Qian, X.Y.; Gu, J.F.; Zhang, H.; Zhao, B.H.; Liu, L.J.; Wang, Z.Q.; Yang, J.C. Leaf photosynthetic characteristics of mid-season indica rice varieties applied at different decades. Acta Agron. Sin. 2016, 42, 415–426. (In Chinese) [Google Scholar] [CrossRef]
  32. Zhu, K.Y.; Yan, J.Q.; Shen, Y.; Zhang, W.Y.; Xu, Y.J.; Wang, Z.Q.; Yang, J.C. Deciphering the morpho–physiological traits for high yield potential in nitrogen efficient varieties (NEVs): A japonica rice case study. J. Integr. Agric. 2022, 21, 947–963. [Google Scholar] [CrossRef]
  33. Yang, Z.F.; Gao, S.; Xiao, F.; Li, G.H.; Ding, Y.F.; Guo, Q.H.; Paul, M.J.; Liu, Z.H. Leaf to panicle ratio (LPR): A new physiological trait indicative of source and sink relation in japonica rice based on deep learning. Plant Methods 2020, 16, 117. [Google Scholar] [CrossRef]
  34. Zhong, X.H.; Peng, S.B.; Sanico, A.L.; Liu, H.X. Quantifying the interactive effect of leaf nitrogen and leaf area on tillering on rice. J. Plant Nutr. 2003, 26, 1203–1222. [Google Scholar] [CrossRef]
  35. Kropff, M.J.; Cassman, K.G.; van Laar, H.H.; Peng, S.B. Nitrogen, and yield potential of irrigated rice. Plant Soil 1993, 155/156, 391–394. [Google Scholar] [CrossRef] [Green Version]
  36. Yao, Y.L.; Yamamoto, Y.; Wang, Y.L.; Yoshida, T.; Miyazaki, A.; Nitta, Y.; Cai, J.L. Role of nitrogen regulation in sink and source formation of high-yielding rice cultivars. Soil Sci. Plant Nutr. 2000, 46, 825–834. [Google Scholar] [CrossRef]
  37. Wei, H.H.; Meng, T.Y.; Li, X.Y.; Dai, Q.G.; Zhang, H.C.; Yin, X.Y. Sink-source relationship during rice grain filling is associated with grain nitrogen concentration. Field Crops Res. 2018, 215, 23–38. [Google Scholar] [CrossRef]
  38. Fu, P.H.; Wang, J.; Zhang, T.; Huang, J.L.; Peng, S.B. High nitrogen input causes poor grain filling of spikelets at the panicle base of super hybrid rice. Field Crop Res. 2019, 244, 107635. [Google Scholar] [CrossRef]
  39. Li, X.X.; Cao, J.; Huang, J.L.; Xing, D.Y.; Peng, S.B. Effects of topsoil removal on nitrogen uptake, biomass accumulation, and yield formation in puddled-transplanted rice. Field Crops Res. 2021, 265, 10813. [Google Scholar] [CrossRef]
  40. Finlay, K.; Wilkinson, G. The analysis of adaptation in a plant-breeding programme. Aust. J. Agric. Res. 1963, 14, 742–754. [Google Scholar] [CrossRef] [Green Version]
  41. Shuai, P. Agronomic Performance of Super and Ordinary Hybrid Rice Varieties Grown under Different Level of Nitrogen Input. Master’s Thesis, Huazhong Agricultural University, Wuhan, China, 2019. (In Chinese). [Google Scholar]
  42. Yuan, S.; Nie, L.X.; Wang, F.; Huang, J.L.; Peng, S.B. Agronomic performance of inbred and hybrid rice cultivars under simplified and reduced-input practices. Field Crops Res. 2017, 210, 129–135. [Google Scholar] [CrossRef]
  43. Wu, L.L.; de Boer, H.J.; Zhang, Z.X.; Chen, X.L.; Shi, Y.Y.; Peng, S.B.; Wang, F. The coordinated increase in stomatal density and vein dimensions during genetic improvement in rice. Agron. J. 2020, 112, 2791–2804. [Google Scholar] [CrossRef]
  44. Srinivasan, V.; Kumar, P.; Long, S.P. Decreasing, not increasing, leaf area will raise crop yields under global atmospheric change. Global Change Biol. 2017, 23, 1626–1635. [Google Scholar] [CrossRef]
  45. Wang, F.; Peng, S.B. Yield potential and nitrogen use efficiency of China’s super rice. J. Integr. Agric. 2017, 16, 1000–1008. [Google Scholar] [CrossRef] [Green Version]
  46. Zhu, K.Y.; Zhou, Q.; Shen, Y.; Yan, J.Q.; Xu, Y.J.; Wang, Z.Q.; Yang, J.C. Agronomic and physiological performance of an indicajaponica rice variety with a high yield and high nitrogen use efficiency. Crop Sci. 2020, 60, 1556–1568. [Google Scholar] [CrossRef]
  47. Liu, K.; Li, T.T.; Chen, Y.; Huang, J.; Qiu, Y.Y.; Li, S.Y.; Wang, H.; Zhu, A.; Zhuo, X.X.; Yu, F.; et al. Effects of root morphology and physiology on the formation and regulation of large panicles in rice. Field Crops Res. 2020, 258, 107946. [Google Scholar] [CrossRef]
  48. Byrd, G.T.; Sage, R.F.; Brown, R.H. A comparison of dark respiration between C3 and C4 plants. Plant Physiol. 1992, 100, 191–198. [Google Scholar] [CrossRef] [Green Version]
  49. Loomis, R.S.; Connor, D.J. Crop Ecology: Productivity and Management in Agricultural Systems; Cambridge University Press: Cambridge, UK, 1992; p. 538. [Google Scholar]
  50. Mitchell, P.L.; Sheehy, J.E. Supercharging rice photosynthesis to increase yield. New Phytol. 2006, 171, 688–693. [Google Scholar] [CrossRef]
  51. Gong, J.L.; Xing, Z.P.; Hu, Y.J.; Zhang, H.C.; Dai, Q.G.; Huo, Z.Y.; Xu, K.; Wei, H.Y.; Gao, H. Difference of characteristics of photosynthesis, matter production and translocation between indica and japonica super rice. Acta Agron. Sin. 2014, 40, 497–510. (In Chinese) [Google Scholar] [CrossRef]
  52. Fu, J.; Huang, Z.H.; Wang, Z.Q.; Yang, J.C.; Zhang, J.H. Pre-anthesis non-structural carbohydrate reserve in the stem enhances the sink strength of inferior spikelets during grain filling of rice. Field Crops Res. 2011, 123, 170–182. [Google Scholar] [CrossRef]
  53. Sharma, N.; Sinha, V.B.; Gupta, N.; Rajpal, S.; Kuchi, S.; Sitaramam, V.; Parsad, R.; Raghuram, N. Phenotyping for nitrogen use efficiency: Rice genotypes differ in N-responsive germination, oxygen consumption, seed urease activities, root growth, crop duration, and yield at low N. Front. Plant Sci. 2018, 9, 1452. [Google Scholar] [CrossRef]
  54. Suriyagoda, L.; Sirisena, D.; Kekulandara, D.; Bandaranayake, P.; Samarasinghe, G.; Wissuwa, M. Biomass and nutrient accumulation rates of rice cultivars differing in their growth duration when grown in fertile and low-fertile soils. J. Plant Nutr. 2020, 43, 251–269. [Google Scholar] [CrossRef]
Figure 1. Topsoil removal progress before transplanting (a,b), low soil fertility treatment with topsoil removed to build bunds (c), and control soil fertility treatment using plastic baffles to prevent water and fertilizer after transplanting (d).
Agronomy 13 00907 g001
Figure 2. Daily minimum temperature and maximum temperature (a,c,e), solar radiation and rainfall (b,d,f), during rice growing season from transplanting to maturity at Wuxue County, Hubei Province, China in 2016 (a,b), 2017 (c,d), 2018 (e,f).
Agronomy 13 00907 g002
Figure 3. Yield stability linear regression of different cultivars under different soil fertility and N treatments in 2016, 2017, and 2018, and data in detail can be seen in Li et al. (2021). Environmental mean was calculated as the mean yield of the four varieties under each treatment combination and for each year following the procedure of Finlay and Wilkinson (1963). Error bars indicate ± SE (n = 4). ** represents statistical significance at p < 0.01., HHZ, Huanghuazhan; YLY6, Yangliangyou6; QY6, Quanyou6; YY2640, Yongyou2640.
Agronomy 13 00907 g003
Figure 4. Distribution of dry matter in leaf, stem, and panicle of different varieties under CKN0 (a), LFN0 (b), CKN100 (c), LFN100 (d) in 2018. Within a row, different lower-case letters are significantly different among varieties according to LSD (0.05). The two N treatments were 0 kg N ha−1 (N0) and 100 kg N ha−1 (N100). LF, low soil fertility; CK, control soil fertility; HHZ, Huanghuazhan; YLY6, Yangliangyou6; QY6, Quanyou6; YY2640, Yongyou2640.
Agronomy 13 00907 g004
Figure 5. Distribution of nitrogen in leaf, stem, and panicle of different varieties under CKN0 (a), LFN0 (b), CKN100 (c), LFN100 (d) in 2018. Within a row, different lower-case letters are significantly different among varieties according to LSD (0.05). The two N treatments were 0 kg N ha−1 (N0) and 100 kg N ha−1 (N100). LF, low soil fertility; CK, control soil fertility; HHZ, Huanghuazhan; YLY6, Yangliangyou6; QY6, Quanyou6; YY2640, Yongyou2640.
Agronomy 13 00907 g005
Figure 6. Leaf SPAD value of different cultivars at heading, 21 days after heading (DAH21), and maturity (MA) under CKN0 (a), LFN0 (b), CKN100 (c), LFN100 (d) in 2018. Error bars indicate ±SE (n = 4). Within a row, different lower-case letters are significantly different among varieties according to LSD (0.05). The two N treatments were 0 kg N ha−1 (N0) and 100 kg N ha−1 (N100). LF, low soil fertility; CK, control soil fertility; HHZ, Huanghuazhan; YLY6, Yangliangyou6; QY6, Quanyou6; YY2640, Yongyou2640.
Agronomy 13 00907 g006
Figure 7. Crop growth rate of different cultivars from transplanting (TP) to heading (HD) and during grain filling period under CKN0 (a), LFN0 (b), CKN100 (c), LFN100 (d) in 2018. Error bars indicate ± SE (n = 4). Within a row, different lower-case letters are significantly different among varieties according to LSD (0.05). The two N treatments were 0 kg N ha−1 (N0) and 100 kg N ha−1 (N100). LF, low soil fertility; CK, control soil fertility; HHZ, Huanghuazhan; YLY6, Yangliangyou6; QY6, Quanyou6; YY2640, Yongyou2640.
Agronomy 13 00907 g007
Table 1. Soil chemical properties of experimental fields at Wuxue County, Hubei Province, China in 2016–2018 [39].
YearTreatmentpHOM
(g kg−1)
TN
(g kg−1)
AN
(mg kg−1)
OP
(mg kg−1)
AK
(mg kg−1)
2016CK4.96 a30.64 a2.37 a/15.38 a152.38 a
LF4.84 b28.64 a2.19 a/13.46 b107.95 b
2017CK4.77 b28.50 a1.86 a172.18 a27.86 a107.48 a
LF5.02 a24.36 b1.60 b140.80 b21.18 b67.77 b
2018CK5.04 b29.02 a2.33 a139.48 a24.30 a112.15 a
LF5.12 a29.53 a2.20 a129.47 b21.70 b94.83 b
Within a column for each year, means followed by different letters are significantly different according to LSD (0.05). CK, control; LF, low fertility; OM, organic matter; TN, total nitrogen; AN, alkaline nitrogen; OP, Olsen phosphorus; AK, available potassium; /, not measured.
Table 2. Growth duration of different cultivars grown under different soil fertility and nitrogen treatments at Wuxue County, Hubei Province, China in 2016–2018.
YearN Rate
(kg ha−1)
VarietyTotal Growth Period (d)Vegetative Growth Period (d)Grain Filling Period (d)
CKLFCKLFCKLF
2016100HHZ13013061613939
YY264013211758584732
YLY615214571695146
QY614414366645051
Mean14013464634742
2017100HHZ13213062624041
YY264013213060604141
YLY615214670705047
QY614613865654943
Mean14113664644543
20180HHZ12312056563633
YY264012512254544138
YLY613513365654240
QY613613559624645
Mean13012859594139
2018100HHZ12412057564037
YY264012712254544338
YLY614113965654446
QY613813762594847
Mean13313060594442
CK: control soil fertility; LF, low soil fertility; HHZ, Huanghuazhan; YLY6, Yangliangyou6; QY6, Quanyou6; YY2640, Yongyou2640.
Table 3. NUEg of different cultivars grown under different soil fertility and nitrogen treatments at Wuxue County, Hubei Province, China in 2016–2018.
YearN Rate
(kg ha−1)
VarietyNUEg
(kg kg−1)
CKLF
2016100HHZ40.5 b43.7 c
YY264047.0 a51.8 b
YLY645.3 a55.6 a
QY645.9 a51.8 b
Mean44.7 B50.7 A
2017100HHZ37.8 b46.8 c
YY264041.1 a51.4 b
YLY642.7 a57.0 a
QY643.5 a58.9 a
Mean41.3 B53.5 A
20180HHZ49.5 c48.9 c
YY264054.6 b55.0 bc
YLY660.0 a60.9 ab
QY659.7 a65.9 a
Mean56.0 A57.7 A
2018100HHZ41.2 b49.6 b
YY264047.4 a56.4 a
YLY649.5 a57.4 a
QY648.7 a54.5 a
Mean46.7 B54.4 A
Within a column for each year, means followed by different lower-case letters are significantly different among varieties according to LSD (0.05). Within a row, means followed by different upper-case letters are significantly different between soil fertility treatments according to LSD (0.05). CK: control soil fertility; LF, low soil fertility; HHZ, Huanghuazhan; YLY6, Yangliangyou6; QY6, Quanyou6; YY2640, Yongyou2640.
Table 4. Spikelets m−2 at maturity (MA), leaf area index at heading (HD), and spikelet to leaf-area ratio of different cultivars grown under different soil fertility and nitrogen treatments at Wuxue County, Hubei Province, China in 2016–2018.
YearN Rate
(kg ha−1)
VarietySpikelets m−2 (×103) at MALeaf Area Index at HD
(m2 m−2)
Spikelets to Leaf-Area Ratio
(No. cm−2)
CKLFCKLFCKLF
2016100HHZ54.5 b 41.0 ab5.53 c3.95 b1.00 b1.04 b
YY264058.0 a46.6 a4.89 c3.77 b1.19 a1.25 a
YLY642.0 c40.7 b8.20 a5.42 a0.52 c0.76 c
QY641.1 c34.5 c7.28 b5.22 a0.57 c0.67 c
Mean48.9 A40.7 B6.48 A4.59 B0.82 B0.93 A
2017100HHZ51.0 b43.3 a6.42 c4.79 b0.80 b0.91 b
YY264058.4 a43.5 a6.00 c4.29 b0.98 a1.03 a
YLY641.4 c38.1 b9.45 a5.64 a0.44 c0.68 c
QY641.4 c36.3 b8.05 b5.94 a0.52 c0.61 c
Mean48.0 A40.3 B7.48 A5.16 B0.68 A0.81 A
20180HHZ45.3 a36.9 a3.29 b2.14 b1.39 a1.75 a
YY264044.2 a32.7 b3.07 b2.11 b1.45 a1.56 a
YLY631.4 c25.8 c4.00 a 2.32 ab0.79 b1.13 b
QY637.2 b31.3 b4.33 a3.13 a0.86 b1.06 b
Mean39.5 A31.7 B3.67 A2.42 B1.12 B1.37 A
2018100HHZ51.5 b 45.3 ab5.88 b4.71 b0.88 b0.97 b
YY264059.8 a46.4 a4.88 c3.68 c1.23 a1.26 a
YLY643.1 c38.0 c7.73 a 5.48 ab0.56 c0.70 c
QY645.4 c42.0 b7.83 a6.27 a0.58 c0.68 c
Mean50.0 A42.9 B6.58 A5.03 B0.81 B0.90 A
Within a column for each year, means followed by different lower-case letters are significantly different among varieties according to LSD (0.05). Within a row, means followed by different upper-case letters are significantly different between soil fertility treatments according to LSD (0.05). CK: control soil fertility; LF, low soil fertility; HHZ, Huanghuazhan; YLY6, Yangliangyou6; QY6, Quanyou6; YY2640, Yongyou2640.
Table 5. Dry matter accumulation and translocation of different cultivars grown under different soil fertility and nitrogen treatments at Wuxue County, Hubei Province, China in 2016–2018.
YearN Rate
(kg ha−1)
VarietyPre-Flowering
Dry Matter Accumulation
(g m−2)
Post-Flowering
Dry Matter Accumulation
(g m−2)
Pre-Flowering
Dry Matter Translocation
(g m−2)
CKLFCKLFCKLF
2016N100HHZ1026.2 b872.6 c672.0 bc471.4 b128.3 b119.4 b
YY2640851.3 c811.2 c1027.5 a650.3 a−19.2 c125.0 b
YLY61278.4 a1064.4 a559.3 c550.1 ab316.4 a253.1 a
QY61106.2 b961.0 b770.1 b629.6 a180.4 b165.2 ab
Mean1065.5 A927.3 B757.2 A575.3 B151.5 A165.7 A
2017N100HHZ915.8 c872.7 b695.2 a447.1 b50.0 b163.6 b
YY26401049.5 b897.8 b786.9 a547.5 a72.0 b141.1 b
YLY61223.5 a1052.4 a650.5 a560.4 a252.2 a277.3 a
QY61109.1 b1014.3 a738.1 a567.8 a175.2 ab273.2 a
Mean1074.5 A959.3 B717.7 A530.7 A137.3 A213.8 A
2018N0HHZ790.2 b640.8 b452.9 b300.6 b143.0 ab120.3 ab
YY2640805.6 b626.2 b616.1 a437.4 a95.9 b71.4 b
YLY6894.0 ab666.9 ab518.1 ab420.6 ab214.8 a125.2 ab
QY6917.6 a795.1 a521.8 ab334.5 ab206.4 ab242.9 a
Mean851.8 A682.3 B527.2 A373.2 B165.0 A139.9 A
2018N100HHZ1000.8 b950.6 b622.2 b473.9 b119.8 b213.7 a
YY26401007.4 b857.4 c894.4 a708.9 a81.8 b112.2 b
YLY61273.2 a1077.0 a737.5 ab575.0 ab252.2 a249.0 a
QY61225.2 a1079.9 a615.5 b695.8 a280.7 a185.4 ab
Mean1126.7 A991.2 B717.4 A613.4 A183.6 A190.1 A
Within a column for each year, means followed by different lower-case letters are significantly different among varieties according to LSD (0.05). Within a row, means followed by different upper-case letters are significantly different between soil fertility treatments according to LSD (0.05). CK: control soil fertility; LF, low soil fertility; HHZ, Huanghuazhan; YLY6, Yangliangyou6; QY6, Quanyou6; YY2640, Yongyou2640.
Table 6. N accumulation and translocation of different cultivars grown under different soil fertility and nitrogen treatments at Wuxue County, Hubei Province, China in 2016–2018.
YearN Rate
(kg ha−1)
VarietyPre-Flowering N (kg ha−1)Post-Flowering N (kg ha−1)Pre-Flowering N Translocation
(kg ha−1)
CKLFCKLFCKLF
2016100HHZ145.1 b104.9 a52.7 a 30.6 ab58.0 b43.5 b
YY2640 154.0 ab114.5 a60.5 a 36.3 ab 81.2 ab60.0 a
YLY6172.2 a118.4 a21.1 b26.3 b99.5 a70.4 a
QY6 154.1 ab115.7 a53.2 a38.0 a 78.9 ab58.6 a
Mean156.3 A113.4 B46.9 A32.8 A79.4 A58.1 B
2017100HHZ158.8 a110.6 a38.0 a20.4 a66.2 b52.3 b
YY2640179.6 a113.0 a29.9 a21.1 a 85.9 ab 62.4 ab
YLY6184.5 a122.8 a27.7 a24.4 a98.0 a73.9 a
QY6172.1 a122.3 a39.0 a20.7 a86.5 ab75.3 a
Mean173.7 A117.2 B33.6 A21.7 A84.1 A66.0 A
20180HHZ 83.5 b58.9 a37.0 ab26.4 ab33.1 b20.2 b
YY264089.8 ab60.1 a40.8 a32.4 ab44.7 ab24.0 ab
YLY691.4 ab58.9 a31.0 ab33.1 a52.3 a26.4 ab
QY6100.0 a71.0 a22.0 b17.3 b57.4 a41.4 a
Mean91.2 A62.2 B32.7 A27.3 A46.9 A28.0 B
2018100HHZ 142.9 b117.3 a37.8 ab22.0 b57.0 b57.1 b
YY2640148.9 ab98.5 b57.6 a47.5 a68.0 b45.8 c
YLY6166.0 a115.8 a34.4 b29.0 b90.1 a64.5 ab
QY6166.9 a131.8 a17.9 b32.3 ab96.4 a72.3 a
Mean156.2 A115.8 B36.9 A32.7 A77.9 A59.9 B
Within a column for each year, means followed by different lower-case letters are significantly different among varieties according to LSD (0.05). Within a row, means followed by different upper-case letters are significantly different between soil fertility treatments according to LSD (0.05). CK: control soil fertility; LF, low soil fertility; HHZ, Huanghuazhan; YLY6, Yangliangyou6; QY6, Quanyou6; YY2640, Yongyou2640.
Disclaimer/Publisher’s Note: The statements, opinions and data contained in all publications are solely those of the individual author(s) and contributor(s) and not of MDPI and/or the editor(s). MDPI and/or the editor(s) disclaim responsibility for any injury to people or property resulting from any ideas, methods, instructions or products referred to in the content.

