Article

Response of Soil and Plant Nutrients to Planting Years in Precious Ancient Camellia tetracocca Plantations

College of Agriculture, Guizhou University, Guiyang 550025, China
*
Author to whom correspondence should be addressed.
Agronomy 2023, 13(3), 914; https://doi.org/10.3390/agronomy13030914
Submission received: 21 February 2023 / Revised: 15 March 2023 / Accepted: 17 March 2023 / Published: 19 March 2023
(This article belongs to the Section Soil and Plant Nutrition)

Abstract

:
In order to explore the response of soil nutrient supply capacity and tea plant nutrient utilization capacity to tea-planting years in precious ancient tea garden, field investigation and indoor analysis methods were employed to research the soil and plant nutrient content, eco-stoichiometric characteristics and the correlation between them, with artificially bred Camellia tetracocca at different time periods (5 years, 15 years, 25 years and 40 years). The results showed that: (1) the contents of soil organic carbon and total nitrogen were higher in the 25- and 40-year teas than in 5- and 15-year teas. The soil pH and total phosphorus were the highest in the 40-year tea, and the available nutrient content was the lowest in the 40-year tea. (2) The contents of nitrogen, phosphorus and potassium in tea shoots were the highest in 15-year tea. The nutrient content of tea trees were highest according to the following order: new shoots > leaves > branches. (3) The N: P of soil and leaves was 4.11–7.55 and 6.37–11.76, respectively. Available nutrients and soil pH were the main factors affecting the contents of nitrogen, phosphorus and potassium in new shoots. In conclusion, the soil nutrient supply capacity and the nutrient utilization capacity of tea plants in the Camellia tetracocca garden were significantly different under different tea-planting years. The growth of the tea plants was restricted by the soil nitrogen supply. The nutrient absorption and utilization capacity of precious Camellia tetracocca were higher in the 15- and 25-year teas, respectively. The study provides the basis for the rational development and sustainable utilization of precious ancient tea plants, and the scientific management of tea gardens.

1. Introduction

As essential nutrient elements, nitrogen (N), phosphorus (P) and potassium (K), have important effects on plant growth and physiological processes. The structural element carbon (C) interacts with the functional elements, nitrogen, phosphorus and potassium, to jointly regulate plant growth. Nitrogen, phosphorus and potassium elements are the main components of important compounds, such as proteins, nucleic acids and enzymes in plants, which affect the growth and development of plants [1,2]. Soil is the foundation of plant growth, and the supply of nutrients in soil determines the absorption and utilization of nutrients by plants [3]. Studies have shown that the planting years, vegetation restoration and community structure can affect the accumulation of biomass and soil nutrient content [4,5]. As a leaf plant, the nutrient absorption, distribution, accumulation and the quality of tea plants largely depend on the soil nutrient status [6].
The stoichiometric ratio can reflect the limitation of elements and the utilization of nutrients, which plays an important role in judging the restrictive nutrient elements in the process of plant growth [7]. Previous studies on stoichiometric characteristics have primarily focused on different forest types, different succession stages and different regions, and most of the studies are about forest, grassland or wetland ecosystems [8,9,10,11,12,13]. However, the research on economic crops, such as tea gardens and orchards, under long-term planting conditions, is relatively scarce. This is an obstacle to effectively reflect the soil nutrient supply and is not conducive to the nutrient management of gardens. Therefore, it is very necessary to link the aboveground (different parts of trees) and underground (soil) as a whole, to study the nutrient cycle and element limitation of tea gardens.
Camellia tetracocca is one of the five-chamber tea series of the tea family, the subspecies tea group. This kind of tea is unique in the world, and more specifically to Pu’an county, Gui Zhou province, China. It is a precious ancient Camellia sinensis species, known as “a living fossil that can be drunk”, which has important academic value in the research of Camellia sinensis origin, evolution and classification. Camellia tetracocca has good adaptability to the environment and excellent germplasm resources. The Pu’an county is carrying out the artificial cultivation of the Camellia tetracocca, which has great significance in promoting local economic development and protecting seed resources.
At present, there are few studies on Camellia tetracocca, which are focused on the stability of soil aggregates in tea gardens [14], analysis of SSR locus information of Camellia tetracocca [15], comprehensive evaluation of the soil nutrients of ancient tea trees [16], and Camellia tetracocca population life table and survival analysis [17]. However, the study on the nutrient accommodate of soil and the nutrient limitation of tea plants under artificial planting conditions has not been reported. Studies have shown that with the increase of planting time (for example, after 50 years), the physical and chemical properties, and fertility of tea garden soil becomes worse [18,19]. However, the effect of tea-planting years on the soil nutrient supply and plant nutrient utilization capacity of Camellia tetracocca has not been clearly concluded. Therefore, the precious tea variety, Camellia tetracocca, was taken as the object, and the principle of stoichiometry was used to study the response of soil and tea nutrients in response to planting years. The main purpose is to solve the following problems: (1) understand the nutrient characteristics of Camellia tetracocca tea garden soil and tea plants under different planting years; (2) determine the main factors affecting the nitrogen, phosphorus and potassium content in the new shoots of Camellia tetracocca; (3) reveal the interaction and restriction relationship of nutrients within the soil–plant system, and provide theoretical guidance for the scientific management of tea garden nutrients, and the improvement of tea yield and quality.

2. Materials and Methods

2.1. Introduction to the Study Area

The study area was located in the Pu’an county, Guizhou province, China (104°51′10″–105°09′24″ E, 25°18′31″–26°10′35″ N). This location is known as the “hometown of ancient tea trees in China”, due to the discovery of the unique Camellia tetracocca ancient tea seed fossils 2 million years ago. The average elevation is 1400 m. The average annual temperature is 14 °C. The frost-free period is 290 days. The average annual sunshine is 1563 h, and the average annual precipitation is 1360 mm. It belongs to a humid, subtropical, monsoon climate, with a low latitude and high altitude. The outcrop is dominated by triassic carbonate rocks, and the soil type is yellow soil.

2.2. Experimental Design

Based on information and field surveys, and considering the geographic location and growth of the tea population, tea trees with relatively concentrated geographic location and different planting years (5 years, 15 years, 25 years, and 40 years) were selected as objects of interest within the ecological tea garden of the Pu’an county, Guizhou province, China. In each tea garden, 3 typical plots were randomly arranged as test plots, according to the tea planting age. The area of each test plot was about 40 m2, with a total of 12 test areas.
The tea garden was fertilized once a year, in December. The fertilizer was organic (pig manure) and the application amount was about 1.5 t/ha. The tea plant row spacing was 2 m × 3 m, with weeding once every year, in October.

2.3. Sample Collection

Soil and plant samples were collected in March 2021.
Soil sample collection: In each plot, 5 sampling points were set up in accordance with the S-shape, and soil drills with a diameter of 10 cm were used to collect soil at 0–20 cm and 20–40 cm layer within the canopy of the tea plants. After removal from the gravel and litter, the soil samples were air-dried and then passed through 1 mm and 0.149 mm sieve for analysis of the soil physical and chemical properties, and carbon, nitrogen, phosphorus and potassium content.
Plant sample collection: In each plot, 4 standard quadrats, with an area of 3 m × 3 m, were established.
Collection of branches: Tea trees with good growth were randomly selected from each standard quadrat and the branches of each tea plant in the east, west, south, and north directions collected. Collection of mature leaves: Healthy and mature leaves were collected from the upper-middle part of the collected branches. Collection of new shoots: Fresh leaves from the collected branches were picked, according to the standard of one bud and two leaves.
The samples were fixated at 105 °C for 1 h, and dried at 75–85 °C to a constant weight. The dried plant samples were crushed by a ball mill and then sieved for the determination of carbon, nitrogen, phosphorus and potassium.

2.4. Measurement Methods

2.4.1. Soil Physicochemical Properties

The pH was measured by the method in NY/T1377-2007. Alkaline hydrolysis nitrogen was measured by the method in DB51/T1975-2014. Available phosphorus was measured by the method in NY/T1849-2010. Available potassium was measured by the method in NY/T889-2004. Organic carbon was measured by the method in GB9834-1988. Total nitrogen was measured by the method in HJ717-2014. Total phosphorus was measured by the method in GB9837-1988. Total potassium was measured by the method in GB9836-88.

2.4.2. Nutrient Characteristics of Plants

Plant total carbon was measured by the method in GB9834-1988. Plant total nitrogen was measured by the method in HJ717-2014. Plant total phosphorus was measured by the method in NY/T2421-2013. Plant total potassium was measured by the method in NY/T2420-2013.

2.5. Data Processing and Analysis

The SPSS16.0 statistics software was adopted to analyze the data. A one-way ANOVA was adopted for the analysis of variance. The LSD method was adopted for multiple comparison. The Pearson method was adopted for correlation analysis and the Origins8.0 statistical software was used for mapping.

3. Results and Analysis

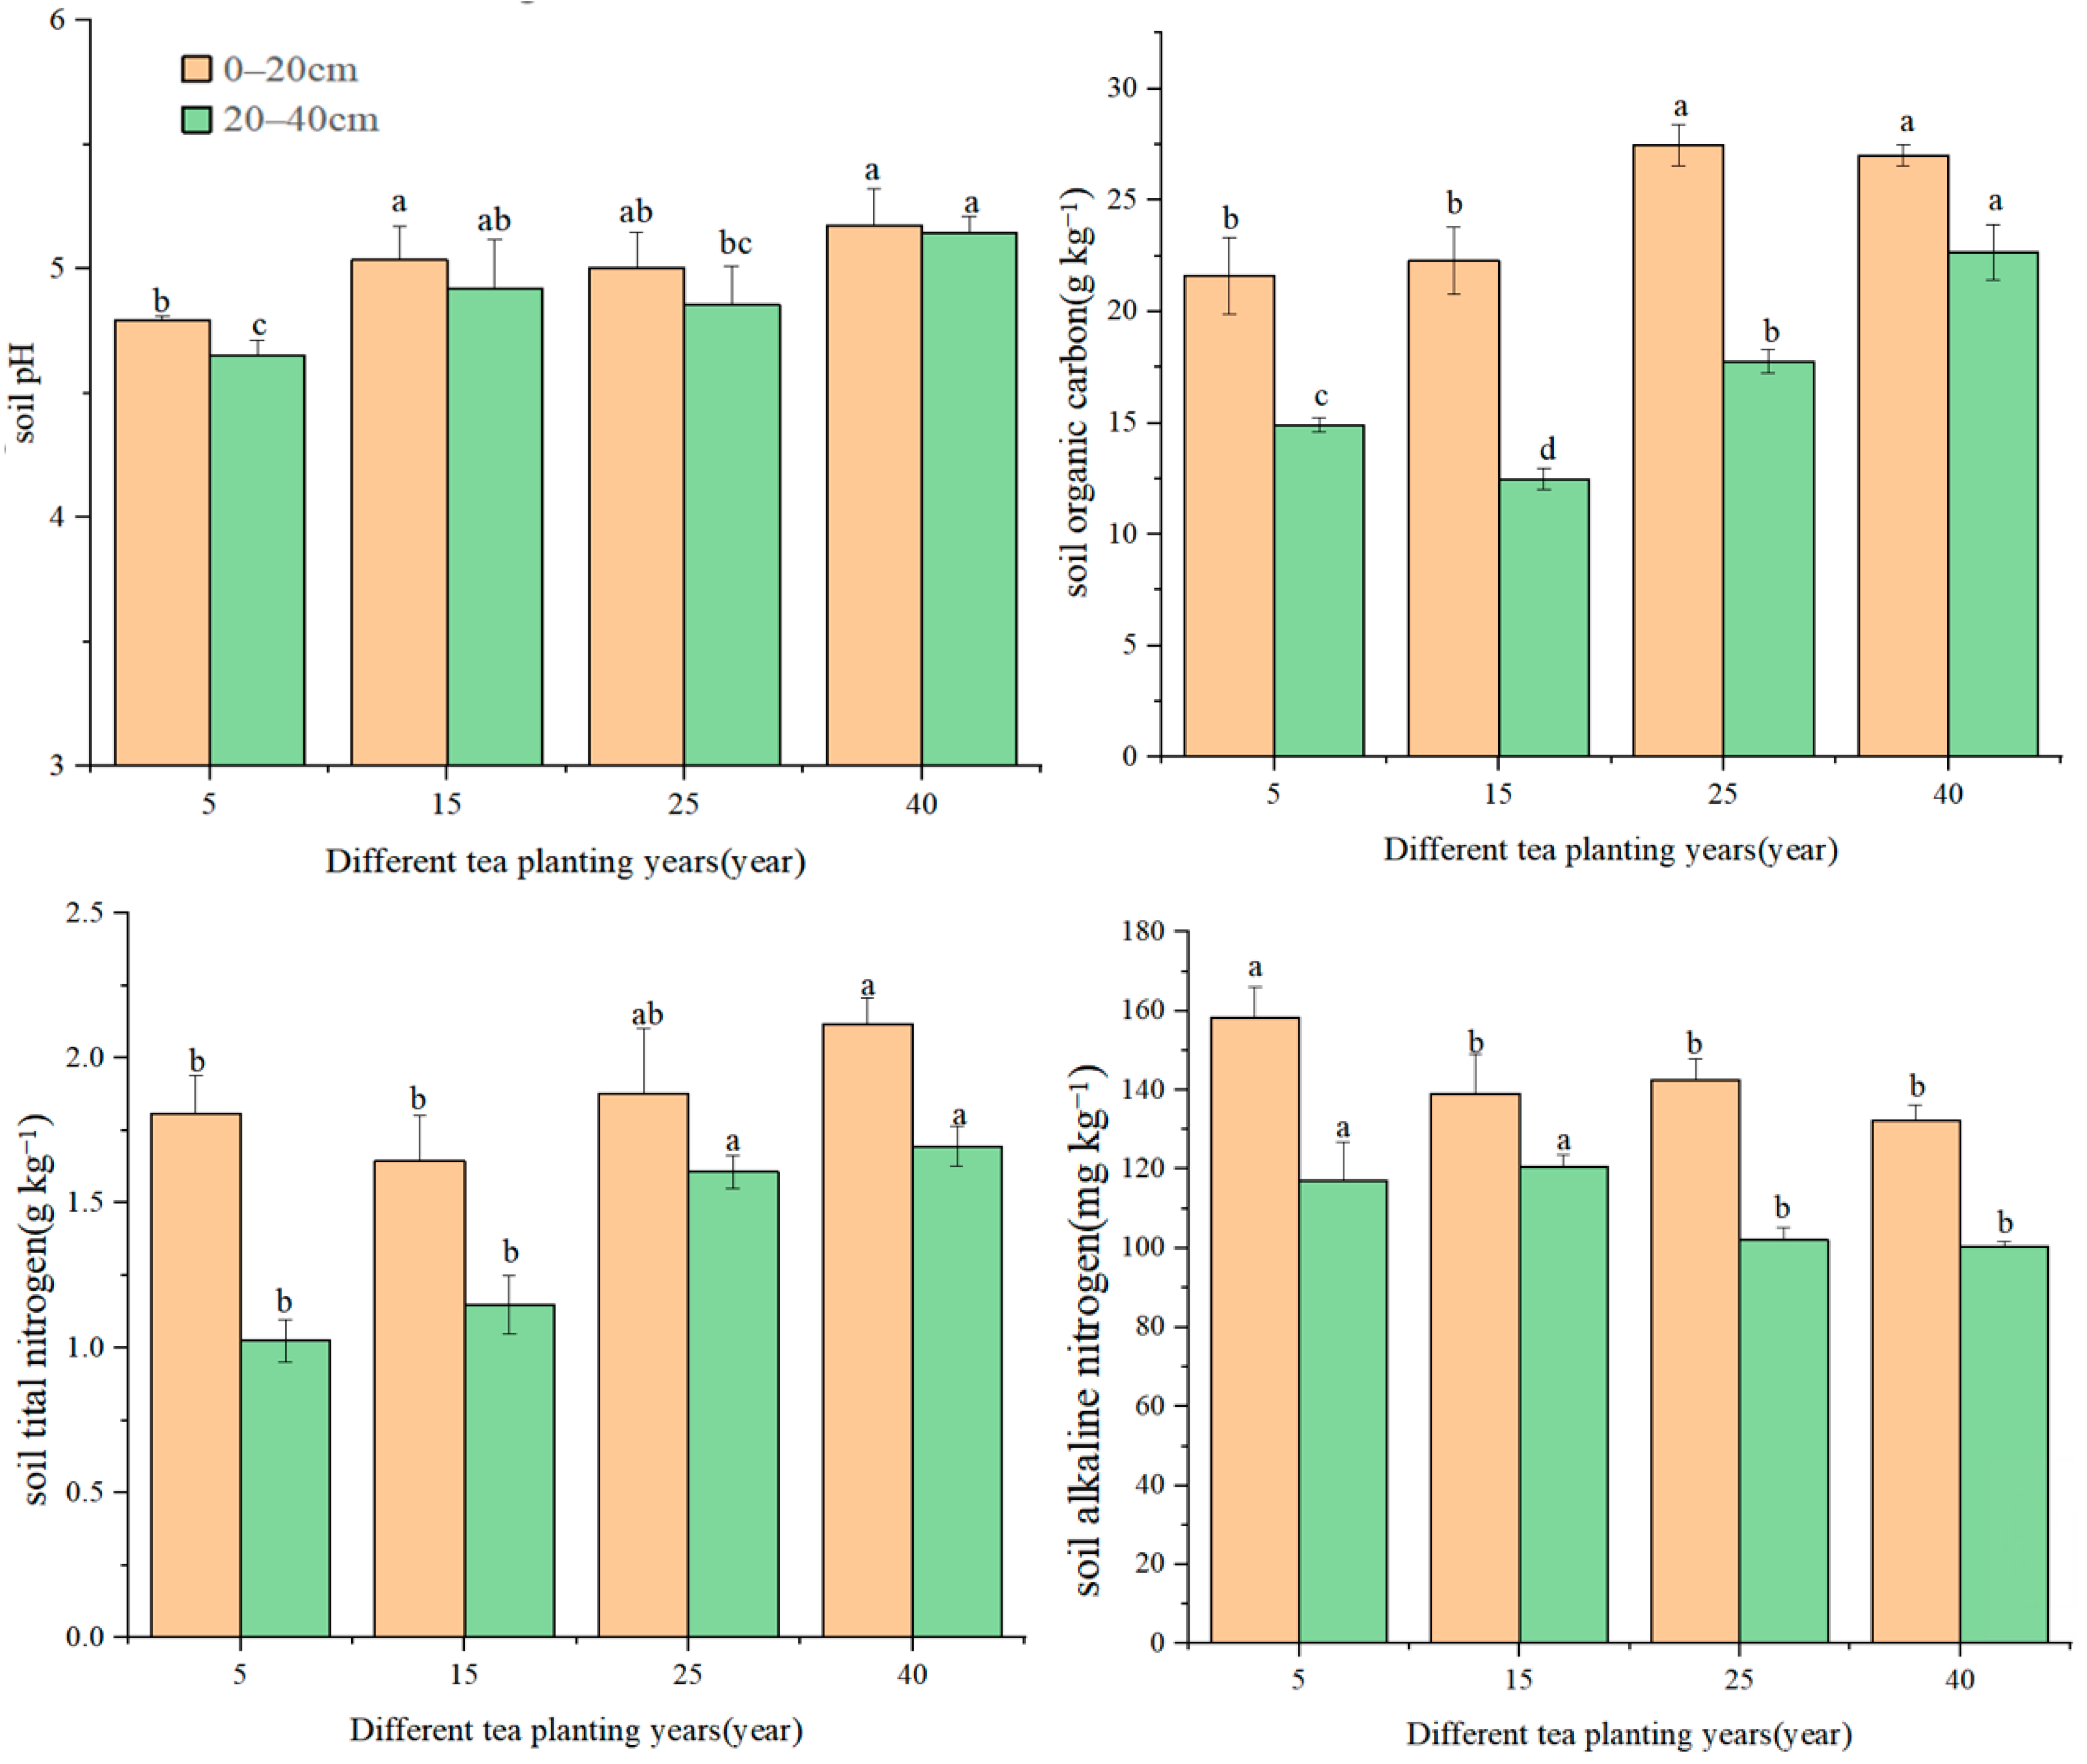
3.1. Soil Nutrient Characteristics of Tea Gardens with Different Tea-Planting Years

As shown in Figure 1, in the 0–20 cm soil layer, the soil pH was between 4.79 and 5.17. The soil pH gradually increased with the increase in tea-planting years. The pH of the 5-year tea was significantly lower than that of 15-, 25- and 40-year teas (p < 0.05), which were lower by 4.83%, 4.26% and 7.35%, respectively. The organic carbon content was between 21.59 and 27.19 (g kg−1), which first increased and then decreased with the increase in tea-planting years. The 25-year tea was higher in organic carbon content than the 5- and 15-year teas by 27.33% and 23.33%, respectively (p < 0.05). The total nitrogen content was between 1.81 and 2.12 (g kg−1), which was first decreased and then increased with the increase in the tea-planting years. The 40-year tea was higher in total nitrogen content than of the 5- and 15-year tea by 17.13% and 29.27%, respectively (p < 0.05). The content of total phosphorus in the soil was between 0.24 and 0.42 (g kg−1), which gradually increased with the increase of tea-planting years. The 40year tea was higher in total phosphorus content than the 5-, 15- and 25-year teas (p < 0.05). The total potassium content was between 14.60 and 17.73 (g kg−1), which first increased and then decreased with the increase in tea-planting years, and reached the highest amount within the 15-year of tea. The content of alkaline hydrolyzable nitrogen was between 132.24 and 158.21 (mg kg−1). The 5-year tea was significantly higher in alkaline hydrolysable nitrogen content than the 15-, 25-, and 40-year teas, by 13.78%, 11.05%, and 19.64%, respectively (p < 0.05). The available phosphorus content was between 3.29 and 4.11 (mg kg−1), which first increased and then decreased with the increase of tea-planting years. However, there was no significant difference between different tea-planting years and available phosphorus content (p > 0.05). The soil available potassium content was between 169.56 and 207.11 (mg kg−1). The 25-year tea was significantly higher in available potassium content than of the 5-, 15- and 40-year teas, by 13.94%, 31.18% and 22.15%, respectively (p < 0.05).
In the 20–40 cm soil layer, the soil pH was between 4.65 and 5.15, which gradually increased with the increase of tea-planting years. The soil pH of the 5-year tea was significantly lower than that of the 15- and 40-year teas, by 5.48% and 9.59%, respectively (p < 0.05). The soil organic carbon was between 12.77 and 22.64 (g/kg), which first decreased and then increased with the increase of tea-planting years. The 40-year tea was significantly higher in organic carbon than the 5-, 15- and 25-year teas, by 52.01%, 81.37% and 27.46%, respectively (p < 0.05). The content of total nitrogen was between 1.03 and 1.70 (g kg−1), and it gradually increased with the increase in tea-planting years. The 40-year tea was significantly higher in total nitrogen content than the 5- and 25-year teas, by 65.05% and 47.83%, respectively (p < 0.05). The content of total phosphorus in the soil was between 0.23 and 0.39 (g kg−1), and for the 40-year tea was significantly higher in total phosphorus content than the 5-, 15- and 25-year teas, by 69.57%, 39.29% and 44.44%, respectively (p < 0.05). The total potassium content of the soil was between 14.13 and 18.56 (g kg−1), which gradually decreased with the increase in tea-planting years. The content of alkaline hydrolyzable nitrogen in the soil was between 100.49 and 120.54 (mg kg−1), which first increased and then decreased with the increase in tea-planting years. The content of available phosphorus in the soil was between 2.77 and 3.04 (mg kg−1). It was the highest in the 15-year tea, and there was no significant difference between different years (p > 0.05). The content of available potassium in the soil was 109.89–137.37 (mg kg−1), which first increased and then decreased with the increase in the tea-planting years. The 40-year tea was significantly lower in available potassium content than the 5-, 15- and 25-year teas, by 18.87%, 19.66% and 19.98%, respectively (p < 0.05).
As shown in Figure 2, in the 0–20 cm soil layer, the C:N was the highest in 25-year tea, but there was no significant difference among different treatments (p > 0.05). The C:P was the highest 5 years after tea planting, which was significantly higher than that of the 40-year tea (p < 0.05). The N:P was decreased with the increase in the tea-planting years. The 5-year tea was significantly higher in this regard than the 15-, 25-, and 40-year teas, by 38.79%, 40.86%, and 49.21% (p < 0.05), respectively.
In the 20–40 cm soil layer, the C:N first decreased and then increased with the increase in tea-planting years. The C:N was the highest in the 5-year tea, which was significantly higher than that of the 15- and 25-year teas, by 33.12% and 31.56% (p < 0.05), respectively. The C:P was the highest in the 5-year tea, which was significantly higher than that of the 15- and 40-year teas, by 40.10% and 12.91% (p < 0.05), respectively. The N:P was the highest in the 25-year tea, which was significantly higher than that of the 5-, 15-, and 40-year teas, by 24.23%, 37.23%, and 28.77% (p < 0.05), respectively.

3.2. Plant Nutrient Characteristics of Camellia tetracocca with Different Tea-Planting Years

As shown in Figure 3, there was no significant difference in the total carbon content of new shoots across different tea-planting years (p > 0.05). The total carbon content of the leaves first decreased and then increased with the increase in tea-planting years. Tea that was 25 years was significantly lower in total carbon content than the 5-, 15- and 40-year teas (p < 0.05). The total carbon content of the branches gradually increased with the increase in the tea-planting years.
The total nitrogen content of new shoots was the highest in 15-year tea, which was significantly higher than that of the 5-, 25-, and 40-year teas (p < 0.05). The total nitrogen content of leaves and branches first decreased and then increased with the increase of tea-planting years, which reached its lowest after 25 years of planting (p < 0.05). For teas with the same planting years, the total nitrogen content of different parts of the plant according to the following order: was new shoots > leaves > branches.
The total phosphorus content of new shoots and leaves was the highest 15 years after planting, which was significantly higher than that of other planting years (p < 0.05). The total phosphorus content of the branches gradually decreased with the increase in the tea-planting years, and was significantly higher 5 years after planting than other planting years (p < 0.05). For teas with the same planting years, the total phosphorus content of different parts of the plant was according to the following order: new shoots > leaves > branches, except for the 25-year tea (p < 0.05).
The total potassium content of new shoots in the 15-year tea was significantly higher than in teas with other plating years (p < 0.05). The total potassium content of leaves first decreased and then increased with the increase in tea-planting years and tea-planting after 40 years showed significantly higher total potassium content than the 15- and 25-year teas (p < 0.05). The total potassium content of branches gradually decreased with the increase in the tea-planting years, and tea planting after 5 years showed significantly higher total potassium content than the 25- and 40-year teas (p < 0.05). For teas with the same planting years, the total potassium content of different parts of the plant was according to the following order: new shoots > leaves > branches (p < 0.05).
As shown in Figure 4, the C:N of new shoots, leaves and branches was the highest in teas 25 years after planting, which was significantly higher than that of teas with other years (p < 0.05). For teas with the same planting year, the C:N was according to the following order: branches > leaves > new shoots, and the C:N of branches was significantly higher than that of leaves and new shoots (p < 0.05).
The C:P of new shoots was the highest in teas 25 years after planting, which was significantly higher than other years (p < 0.05). The C:P of leaves was the highest in 5-year tea, which was significantly higher than that of 15-year tea (p < 0.05). The C:P of branches gradually increased with the increase in tea-planting years. For teas with the same planting year, the C:P was according to the following order: branches > leaves > new shoots, 5 and 40 years after planting, and branches > new shoots (leaves), 15- and 25- years after tea planting. The C:N of branches was significantly higher than that of leaves and new shoots (p < 0.05).
The N:P of new shoots was decreased with the increase in tea-planting years, which was the lowest in teas 25- and 40-years after planting. The N:P of leaves and branches was first decreased and then increased with the increase in tea-planting years, which was the lowest in teas 25 years after planting.
The K:P of new shoots and branches was the highest in teas 15 years after planting. The K:P of leaves was first decreased and then increased with the increase in tea-planting years, which was the lowest in teas 15 years after planting. For teas with the same planting year, K:P was according to the following order: branches > leaf > new shoots at 5 years, branches > new shoots > leaf at 15 years, new shoots > leaf > branches at 25 years, and leaves > new shoots > branches at 40 years.

3.3. Relationship between Soil Nutrients and New Shoot Nutrients

The path analysis method was used to evaluate the relationship between soil physical and chemical properties, and new shoot nutrient content. As shown in Table 1, new shoot nitrogen content had significant negative correlation with soil organic carbon and total phosphorus, which had a significant positive correlation with total potassium. Among the direct effects of soil physical and chemical properties on the nitrogen content of new shoots, total phosphorus, and alkaliline hydrolyzable nitrogen were positive values, and soil pH, organic carbon, total nitrogen, total potassium, available phosphorus and available potassium were negative values. The three indicators with a larger direct path coefficient for nitrogen content in new shoots were available potassium (−1.7) > pH (−1.235) > organic carbon (−1.099). The three indicators with a larger indirect path coefficient for nitrogen content in new shoots were available potassium (1.537) > pH (1.047) > total phosphorus (−0.977).
As shown in Table 2, the phosphorus content of new shoots was positively correlated with soil pH, total phosphorus, total potassium and available phosphorus, and negatively correlated with organic carbon, total nitrogen, available nitrogen and available potassium. Among the direct effects of soil physical and chemical properties on the phosphorus content of new shoots, soil pH, total potassium, available phosphorus and available potassium were positive values, while organic carbon, total nitrogen, total phosphorus and alkaline hydrolyzed nitrogen were negative values. The three indicators with a larger direct path coefficient for phosphorus content in new shoots were alkaline hydrolyzed nitrogen (−1.317) > available potassium (0.872) > available phosphorus (0.615). The three indicators with a larger indirect path coefficient for phosphorus content in new shoots were available potassium (−1.128) > alkaline hydrolyzed nitrogen (0.895) > pH (−0.401).
The three indicators with a larger direct path coefficient for nitrogen content in new shoots were available potassium (−1.7) > pH (−1.235) > organic carbon (−1.099). The three indicators with a larger indirect path coefficient for nitrogen content in new shoots were available potassium (1.537) > pH (1.047) > total phosphorus (−0.977). As shown in Table 3, the potassium content of new shoots was positively correlated with soil pH, total phosphorus, total potassium and available phosphorus, and negatively correlated with soil organic carbon, total nitrogen, available nitrogen and available potassium.
Among the direct effects of soil physical and chemical properties on the potassium content of new shoots, total phosphorus and alkaline hydrolyzed nitrogen were positive values, while pH, organic carbon, total nitrogen, total potassium, available phosphorus and available potassium were negative values. The three indicators with a relatively large direct path coefficient for potassium content in new shoots were available potassium (−1.571) > pH (−1.441) > organic carbon (−1.084). The three indicators with a a relatively large indirect path coefficient for potassium content in new shoots were pH (1.675) > soil available potassium (0.966) > organic carbon (0.838).

4. Discussion

4.1. Soil Nutrient Supply Capacity of Tea Gardens under Different Planting Years

Camellia sinensis is suitable for growing in an acidic environment, with a soil pH of 4.5–5.5 [20]. According to the research, the growth of Camellia sinensis would accelerate the acidification of soil [18]. However, in this study, soil pH gradually increased with the increase in years, which was inconsistent with the above-mentioned point of view. This may be related to the adaptability of this rare ancient tea tree [16], and specific reasons need to be further studied. Soil organic matter is an important indicator to measure the level of soil fertility [21]. In this study, the contents of soil organic carbon and total nitrogen were higher in 25- and 40-year teas than in 5- and 15-year teas, indicating that the accumulation of organic matter was greater than consumption in the later stages of tea planting (after 25 years). This is because with the increase of planting years, the biomass of tea plants and the number of litter increase, resulting in the accumulation of organic matter in the soil [22].
The available nutrients in soil decreased with the increase in tea-planting years, which was related to the consumption of available nutrients and nutrient loss during the growth of the tea plants [23]. With the increase in tea-planting years, the phosphorus content in surface soil increased gradually. This indicated that the increase in tea-planting years promoted the enrichment of soil with phosphorus, mainly because of the weak migration ability of phosphorus in soil. In this study, the content of soil potassium gradually decreased with the increase in planting years, which may be related to the climate and geological terrain of the study area. The study area belongs to sloping farmland, which is rainy, and the soil potassium is easily weathered and leached here [24].
Soil C:N, C:P and N:P are key indicators reflecting the mineralization rate of soil organic matter and the availability of soil nutrients [25]. The soil C:N indicates the soil fertility level and the decomposition rate of organic matter. A lower C:N indicates higher mineralization rate of organic matter [26]. In this study, the soil C:N firs increased and then decreased with the increase in planting years. The ratio was higher 25 years after the tea was planted, indicating the low decomposition and high accumulation of soil organic matter. Soil C:P reflects the potential of soil microorganisms to release phosphorus matter under mineralization. A lower C:P indicates higher soil phosphorus availability [27]. In this study, the C:P of topsoil was higher than the average level of land soil in China (52.70) [28], indicating that the availability of phosphorus in tea gardens was relatively low. Soil N:P is one of the important indicators to judge the restrictive effect of nitrogen and phosphorus [29]. N:P in this study area was far lower than the national average level (9.3) [30], which reflected the accumulation of phosphorus and the lack of nitrogen in tea garden soil, and the growth of tea plants was mainly limited by nitrogen. The decreases of C:P and N:P in soil with the increase in planting years were the result of the low turnover speed and gradual accumulation of phosphorus in soil.

4.2. The Nutrient Utilization Capacity of Tea Trees under Different Planting Years

Nitrogen, phosphorus and potassium are essential mineral elements in the process of plant growth, and their content changes play an important role in regulating plant carbon metabolism [10,31,32]. Higher nitrogen and phosphorus contents are conducive to the synthesis of amino acids, caffeine, polyphenols and other biochemical substances in tea [33], which further affect the quality of tea. The nutrient content of tea and its distribution in different organs are affected by soil nutrient supply and plant physiological characteristics. In this study, the carbon content in different parts of the tea tree changed slightly with the increase in tea-planting years, indicating that the carbon content remained relatively stable in the plant [34]. The carbon content was observed in new shoots > leaves > branches, which was due to the strong photosynthesis of new shoots and the effective accumulation of carbohydrates [35,36]. The contents of nitrogen, phosphorus and potassium in shoots were the highest 15 years after tea planting, indicating that tea plants have the strongest absorption capacity of nutrients at 15 years. The main reason was that tea plants have strong photosynthetic capacity and fast growth speed during this period, and need a lot of nitrogen, phosphorus and potassium in the process of protein synthesis [37]. With the increase in tea-planting years, the contents of nitrogen, phosphorus and potassium in branches gradually decreased, which was the result of tea plants supplying nutrients to the growth of new shoots, and also reflected the adaptability of artificially planted ancient tea trees.
The stoichiometric characteristics of C, N and P in different organs of plants are the result of plants adapting to the environment and coordinating the growth of different organs [38,39]. The C:N and C:P can be used to characterize the ability of plants to absorb mineral elements and assimilate organic matter [28]. The C:N and C:P of new shoots were the highest in 25-year tea, indicating the highest nutrient utilization efficiency of tea plants. The research showed that N:P of leaves can indicate the limiting factor of soil nutrients [40]. When N:P < 14, nitrogen is the limiting element, and when N:P > 16, phosphorus is the limiting element. When N:P is between 14 and 16, plant growth is jointly limited by N and P [29]. In this study, the N:P of new shoots, leaves and branches were less than 14, indicating that the growth of artificially planted ancient tea trees was generally limited by nitrogen.

4.3. Relationship between Nutrient Content in Soil and New Shoots

Path analysis can decompose the correlation coefficients of independent variables and dependent variables into direct path coefficients and indirect path coefficients [41]. Through the absolute value of the direct path coefficient and indirect path coefficient, the direct and indirect effects of environmental factors on target variables can be analyzed, which can explain the relationship between environmental factors and target variables more accurately [42]. As a leaf plant, the nitrogen content of tea shoots was closely related to the main biochemical components of tea (amino acids, polyphenols, carbohydrates, etc.) [43]. Phosphorus can increase the content of polyphenols in fresh leaves of tea plants and improve the aroma and taste of tea [44]. Phosphorus deficiency in plants reduces the contents of tea water extract, polyphenols, flavonoids and total free amino acids [45]. Potassium can enhance the photosynthesis of tea plants and affect the activity of the photosynthetic system [46].
Plant growth and nutrient metabolism are closely related to the supply of soil nutrients [18]. In this study, the direct effect of soil available potassium and pH on the nitrogen content of new shoots was much greater than other factors, and the indirect effect of other factors through these two variables was also greater. Therefore, soil available potassium and pH were the main direct factors affecting the nitrogen content of new shoots. Because the direct and indirect effects of soil available potassium and pH were opposite and offset each other, the correlation coefficient between them and nitrogen content of new shoots was small. Alkaline hydrolyzed nitrogen, available potassium and available phosphorus were the main direct factors affecting the phosphorus content of new shoots. The direct effect of alkaline hydrolyzed nitrogen and available potassium on the phosphorus content of new shoots was much greater than other factors, and the indirect effect of other factors through these two variables was also greater. Because the direct and indirect effects of alkaline hydrolyzed nitrogen and available potassium were opposite and offset each other, the correlation coefficient between them and the phosphorus content of the new shoots was small. The direct effect of soil available potassium and pH on the potassium content of new shoots was much greater than other factors, and the indirect effects of other factors through these two variables were also greater. Therefore, soil available potassium and pH were the main direct factors affecting the potassium content of new shoots. However, because the direct and indirect effects of soil available potassium and pH were opposite and offset each other, the correlation coefficient between them and the potassium content of new shoots was small.
Previous studies on the nutrient status of tea garden soil under the conditions of intercropping and chemical fertilizer reduction are abundant, but research on the relationship between nutrient supply and demand for artificially bred ancient tea plants is scarce.
At present, there are a large number of studies on the soil nutrient status of tea gardens under the conditions of intercropping and fertilizer reduction, etc., but there are few studies on the relationship between nutrient supply and demand for artificially ancient tea trees. In this study, the growth of the artificially planted ancient tea trees was mainly limited by nitrogen. Balancing the soil nutrients and promoting the yield and quality of tea can be realized by increasing nitrogen fertilizer. This study provides a strong scientific basis for the propagation, rational development and utilization of high-quality ancient tea plants. Soil available nutrients and pH were the main factors that affect the content of nitrogen, phosphorus and potassium in new shoots. However, the relationship between soil nutrients and plant nutrients was not simply linear, and the correlation between the two was weak, which means that there was an imbalance in the supply of elements, or the nutrient absorption was restricted by other limiting factors in the tea garden [47]. Therefore, it is necessary to carry out the effect of the physiological characteristics, environmental factor and tea garden management measures on the soil and tea plant nutrients.

5. Conclusions

In the planted ancient tea garden, soil pH and total phosphorus content gradually increased with the increase in planting years. The contents of soil organic carbon and total nitrogen were higher after 25 and 40 years of planting, and the contents of soil potassium and available nutrients content gradually decreased with the increase in planting years. Phosphorus accumulated gradually in the tea garden, but its availability was low.
In the planted ancient tea garden, there was no significant difference in carbon content in different parts of the tea plant between different planting years. The contents of nitrogen, phosphorus and potassium in tea shoots were the highest in 15-year tea, indicating the strongest nutrient absorption capacity. The C:N of new shoots reached the highest 25 years after planting, indicating the strongest utilization ability of nutrients and the fastest growth rate of the tea tree.
The soil and leaf N:P were 4.11–7.55 and 6.37–11.76, respectively, which indicated that the growth of the tea plant was limited by nitrogen. The relationship of soil and plant nutrients was not simply linear, and they had a weak correlation. Available nutrients and soil pH were the main factors affecting the content of nitrogen, phosphorus and potassium of new shoots.

Author Contributions

Conceptualization, J.H. and H.L.; methodology, J.H.; software, Q.L.; validation, J.H., Q.L. and C.W.; formal analysis, J.H.; investigation, C.W. and Q.L.; resources, C.W. and Q.L.; data curation, J.H.; writing—original draft preparation, H.L.; writing—review and editing, H.L.; visualization, J.H.; supervision, H.L.; project administration, J.H.; funding acquisition, J.H. All authors have read and agreed to the published version of the manuscript.

Funding

This research was funded by the Guizhou Provincial Science and Technology Project, grant number Qiankehejichu-ZK [2021] YB133 and the Guizhou Provincial Science and Technology Project, grant number Qiankehehoubuzhu [2020] 3001.

Data Availability Statement

The authors confirm that the data supporting the findings of this study are available within the article.

Conflicts of Interest

The authors declare no conflict of interest.

References

  1. Ping, C.; Wang, C.K.; Quan, X.K. Influence of environmental changes on stoichiometric traits of nitrogen and phosphorus for Larix gmelinii trees. Acta Ecol. Sin. 2014, 34, 1965–1974. [Google Scholar]
  2. Xiang, W.H.; Huang, Z.H.; Yan, W.D.; Tian, D.L.; Lei, P.F. Review on coupling of interactive functions between carbon and nitrogen cycles inforest ecosystems. Acta Ecol. Sin. 2006, 26, 2365–2372. [Google Scholar]
  3. Li, C.; Xu, X.W.; Sun, Y.Q.; Qiu, Y.Z.; Li, S.Y.; Gao, P. Stoichiometric characteristics of C,N,P for three desert plants leaf and soil at different habitats. Geogr. Arid Area 2014, 37, 996–1004. [Google Scholar]
  4. Xiao, H.B.; Li, Z.W.; Dong, Y.T.; Chang, X.F.; Deng, L.; Huang, J.Q.; Nie, X.D.; Liu, C.; Liu, L. Changes in microbial communities and respiration following the revegetation of eroded soil. Agric. Ecosyst. Environ. 2017, 246, 30–37. [Google Scholar] [CrossRef]
  5. He, H.F.; Wu, N.; Liu, J.L.; Chen, J.; Liu, X.X.; Chang, W.W. Effects of planting years of Panicum virgatum on soil physical and chemical properties. Ecol. Environ. Sci. 2020, 29, 285–292. [Google Scholar]
  6. Li, X.Y.; Zhang, Z.M.; Zhang, Q.H.; He, T.B.; Lin, C.H. Research progress of relationship among nitrogen, phosphorus, potassium and tea quality. Guangdong Agric. Sci. 2014, 41, 56–60. [Google Scholar]
  7. Vitousek, P.M.; Porder, S.; Houlton, B.Z. Terrestrial phosphorus limitation: Mechanisms, implications, and nitrogen-phosphorus interactions. J. Appl. Ecol. 2010, 20, 5–15. [Google Scholar] [CrossRef] [Green Version]
  8. Zhang, Y.B.; Zhou, C.; Lv, W.; Dai, L.; Tang, J.; Zhou, S. Comparative study of the stoichiometric characteristics of karst and non-karst forests in Guizhou. China J. For. Res. 2019, 30, 799–806. [Google Scholar] [CrossRef]
  9. Xu, S.; Gong, J.R.; Zhang, Z.Y.; Liu, M.; Wang, Y.H.; Luo, Q.P. Ecological stoichiometric characteristics of grassland dominant plants under different utilization patterns. Acta Prataculturae. 2014, 23, 45–53. [Google Scholar]
  10. Wang, W.Q.; Sardans, J.; Wang, C.; Zeng, C.S. Ecological stoichiometry of C, N, and P of invasive Phragmites australis and native Cyperus malaccensis species in the Minjiang River tidal estuarine wetlands of China. Plant Ecol. 2015, 216, 809–822. [Google Scholar] [CrossRef] [Green Version]
  11. Ren, L.L.; Zhang, B.X.; Han, F.P.; Zhang, X.C. Ecological stoichiometric characteristics of soils in robinia pseudoacacia forests of different ages on the Loess Plateau. J. Soil Water Conserv. 2017, 31, 339–344. [Google Scholar]
  12. Bai, Y.; Chen, S.; Shi, S.; Qi, M.; Jiang, C. Effects of different management approaches on the stoichiometric characteristics of soil C, N, and P in a mature Chinese fir plantation. Sci. Total Environ. 2020, 723, 137868. [Google Scholar] [CrossRef] [PubMed]
  13. Zhang, Y.; Cui, D.; Yang, Y.H.; Liu, H.; Zhao, Y. Ecological stoichiometric characteristics and influencing factors of carbon, nitrogen, and phosphorus in the leaves of Sophora alopecuroides L. in the Yili River Valley. Xinjiang Peer. J. 2021, 9, e1170. [Google Scholar] [CrossRef] [PubMed]
  14. Lu, Q.; Wu, C.M.; Liu, H.Y.; Huang, C.Y.; Yang, J.M.; Gan, Z.G.; He, J. Effects of tea-planting years on soil aggregate distribution and stability at Camellia tetracocca tea plantations. Acta Tea Sin. 2021, 62, 16–21. [Google Scholar]
  15. Li, R.Y.; Xing, H.; Shen, T. Analysis of SSR information in Camellia tetracocca Zhang transcriptome. J. Anhui Agric. Univ. 2017, 44, 558–562. [Google Scholar]
  16. Niu, S.Z.; Song, Q.F.; Fan, W.G. Analysis on site soil nutrients of ancient tea trees in the Southwest State of Guizhou Province. Acta Agric. Zhejiangensis 2013, 25, 1348–1353. [Google Scholar]
  17. Zeng, H.; Guo, Y.; Tang, W.C.; Xiang, Y.Z. Life table and surival analysis of Camellia tetracocca in the Pubai Forest Farm. J. Temp. For. Res. 2018, 1, 48–51. [Google Scholar]
  18. Yu, S.; He, Z.L.; Chen, G.Z.; Huang, C.Y. The chemical properties of the root layer soil of tea plants of different ages and their effects on the microbial flora and quantity. Acta Pedol. Sin. 2003, 40, 433–439. [Google Scholar]
  19. Xue, D.; Yao, H.Y.; Huang, C.Y. Soil mineralization and nitrification characteristics of tea gardens with different utilization years. Acta Pedol. Sinica. 2007, 44, 373–378. [Google Scholar]
  20. Liao, W.Y. Acidification and control of soil in tea gardens in my country. J. Agro Environ. Sci. 1998, 17, 178–180. [Google Scholar]
  21. Qi, Q.W. Distribution of Soil Organic Matter, Nitrogen, Phosporus and Potassium Nutrition in Cultivated Land of Xi’an City. Master’s Thesis, Northwest Agriculture and Forestry University, Xianyang, China, 2018. [Google Scholar]
  22. Zhong, Y.Q.; Yan, W.M.; Wang, R.W. Differential responses of litter decomposition to nutrient addition and soil water availability with long-term vegetation recovery. Biol. Fertil. Soils 2017, 53, 939–949. [Google Scholar] [CrossRef]
  23. Zheng, L. Effects of Microbial Fertilizer on Soil Nitrogenand Phosphorus Leaching and Soil Enzymeactivity and Microorganism. Master’s Thesis, Zhejiang Univiversity, Zhejiang, China, 2018. [Google Scholar]
  24. Cao, J.; Chen, Y.P.; Jiang, Y.; Wu, J.H.; Wang, H. Spatial and temporal variation of soil available potassium and its influencing factors in Shanxi Province. J. Soil Water Conserv. 2021, 35, 296–302 + 311. [Google Scholar]
  25. Yan, E.R.; Wang, X.H.; Guo, M.; Zhong, Q.; Zhou, W. C:N:P stoichiometry across evergreen broad-leaved forests, evergreen coniferous forests and deciduous broad-leaved forests in the Tiantong region, Zhejiang Province, Eastern China. Chin. J. Plant Ecol. 2010, 34, 48–57. [Google Scholar]
  26. Li, T.P. Soil Carbon, Nitrogen, Phosphorus Ecological Stoichiometry of Different Trees in Mixed Broad-Leaved Forest in the Hill Region of Northern Hunan. Master’s Thesis, Central South University of Forestry and Technology, Changsha, China, 2015. [Google Scholar]
  27. Zhu, Q.L.; Xing, X.Y.; Zhang, H.; An, S.S. Soil ecological stoichiometry under different vegetation area on loess hilly-gully region. Acta Ecol. Sin. 2013, 33, 4674–4682. [Google Scholar]
  28. Tian, H.Q.; Chen, G.S.; Zhang, C.; Hall, C.A.S. Pattern andvariation of C:N:P ratios in China’s soils: A synthesis of observational data. Biogeochemistry 2010, 98, 139–151. [Google Scholar] [CrossRef]
  29. Güsewell, S.; Koerselman, W.; Verhoeven, J.T.A. Biomass N:P ratios as indicators of nutrient limitation for plant populations in wetlands. Ecol Appl. 2003, 13, 372–384. [Google Scholar] [CrossRef]
  30. Yuan, Z.Y.; Chen, H.Y.; Reich, P.B. Global-scale latitudinal patterns of plant fine-root nitrogen and phosphorus. Nat. Commun. 2011, 2, 344. [Google Scholar] [CrossRef] [PubMed] [Green Version]
  31. Hu, P.L.; Wang, K.L.; Zeng, Z.X.; Zhang, H.; Li, S.S.; Song, X.J. Ecological stoichiometric characteristics of plants, soil, and microbes of Pennisetum purpureum cv.Guimu-1 pastures at different rehabilitation ages in a karst rocky desertification region. Acta Ecol. Sin. 2017, 37, 896–905. [Google Scholar]
  32. Zhao, C.; Chen, L.; Ma, F. Altitudinal differences in the leaf fitness of juvenile and mature alpine spruce trees (Picea crassifolia). Tree Physiol. 2008, 28, 133–141. [Google Scholar] [CrossRef] [PubMed] [Green Version]
  33. Wang, F.; Wu, Z.D.; Chen, Y.Z.; Jiang, F.Y.; Zhu, L.G.; Zhang, W.J.; Weng, B.Q.; You, Z.M. Effects of the combined application of biochar and nitrogen on growth and nitrogen use efficiency of tea plants. J. Tea Sci. 2018, 38, 331–341. [Google Scholar]
  34. Chen, J.Q.; Zhang, R.; Hou, Y.C.; Ma, L.N.; Ding, L.M.; Long, R.J.; Shang, Z.H. Relationships between species diversity and C, N and P ecological stoichiometry in plant communities of sub-alpine meadow. Chin. J. Plant Ecol. 2013, 37, 979–987. [Google Scholar] [CrossRef]
  35. Sinsabaugh, R.L.; Lauber, C.L.; Weintraub, M.N. Stoichiometry of soil enzyme activity at global scale. Ecol. Lett. 2008, 11, 1252–1264. [Google Scholar] [CrossRef]
  36. Cleveland, C.C.; Liptzin, D. C:N:P stoichiometry in soil: Is there a “Redfield ratio” for the microbial biomass. Biogeochemistry 2007, 85, 235–252. [Google Scholar] [CrossRef]
  37. Jiang, P.P.; Cao, Y.; Chen, Y.M.; Wang, F. Variation of C, N, and P stoichiometry in plant tissue, litter, and soil during stand development in Pinus tabulaeformis plantation. Acta Ecol. Sin. 2016, 36, 6188–6197. [Google Scholar]
  38. Elser, J.J.; Sterner, R.W.; Gorokhova, E.; Fagan, W.F.; Markow, T.A.; Cotner, J.B. Biological stoichiometry fromgenes toecosystems. Ecol. Lett. 2010, 3, 540–550. [Google Scholar] [CrossRef] [Green Version]
  39. Yang, S.S.; Wen, Z.M.; Miao, L.P.; Qi, D.H.; Hua, D.W. Responses of plant functional traits to micro-topographical changes in hilly and gully region of the Loess Plateau, China. Chin. J. Appl. Ecol. 2014, 25, 3413–3419. [Google Scholar]
  40. Tang, S.S.; Yang, W.Q.; Wang, H.P.; Xiong, L.; Nie, F.Y.; Xu, Z.F. Stoichiometri characteristics and controlling factors of N and P in forest leaf litter of China. Chin. J. Appl. Environ. Biol. 2015, 21, 316–322. [Google Scholar]
  41. Cao, X.Y.; Li, J.P.; Zhang, C.C.; Fang, X.N.; Xie, X.Y. Variation of contents of organic carbon and physic-chemical properties of soil and path analysis for their relations in different age group Chinese Fir Plantations. J. Soil Water Conserv. 2014, 28, 200–205. [Google Scholar]
  42. Liao, Q.L.; Long, C.L.; Xue, F.; Zheng, L. Soil enzyme and nutrient characteristics of different terrains in Maolan karst forest. J. For. Environ. 2020, 40, 164–170. [Google Scholar]
  43. Li, J.; Xia, J.G. Summary on nitrogen (N), phosphorus (P), potassium (K) and tea quality. Chin. Agric. Sci. Bull. 2005, 21, 62–65 + 75. [Google Scholar]
  44. Shi, J.P. Physiology of Tea Cultivation; China Agriculture Press: Beijing, China, 1992. [Google Scholar]
  45. Lin, Z.H.; Qi, Y.P.; Chen, R.B. Effects of phosphorus supply on the quality of green tea. Food Chem. 2012, 130, 908–914. [Google Scholar] [CrossRef]
  46. Geng, J.M.; Wang, W.B. Research progress of tea potassium nutrition. Chin. Agric. Sci. Bull. 2005, 21, 175–177. [Google Scholar]
  47. Shaver, G.R.; Chapin, G., III. Long-term responses to factorial, N P K fertilizer treatment by Alaskan wet andmoist tundra sedge species. Ecography 1995, 18, 259–275. [Google Scholar] [CrossRef]
Figure 1. Nutrient characteristics of soil under different tea-planting years. Different lowercase letters under the same soil layer represent that the data in different planting years are significantly different (p < 0.05).
Agronomy 13 00914 g001aAgronomy 13 00914 g001b
Figure 2. Stoichiometric ratio of soil nutrients in tea gardens under different planting years. Different lowercase letters under the same soil layer represent that the data in different planting years are significantly different (p < 0.05).
Agronomy 13 00914 g002
Figure 3. Nutrient characteristics of tea plants under different tea-planting years. Different capital letters indicate significant differences between planting years, different lowercase letters indicate significant differences between different parts (p < 0.05).
Agronomy 13 00914 g003
Figure 4. Stoichiometric ratio of plant nutrients under different planting years. Different capital letters indicate significant differences between planting years, different lowercase letters indicate significant differences between different parts (p < 0.05).
Agronomy 13 00914 g004
Table 1. Path coefficients of soil physical and chemical properties for the nitrogen content in the new shoots of tea.
Action FactorpHOrganic CarbonTotal NitrogenTotal PhosphorusTotal PotassiumAlkaline NitrogenAvailable PhosphorusAvailable Potassium
Correlation coefficient−0.189−0.793 **−0.331−0.533 *0.517 *0.1540.335−0.163
Direct action−1.235−1.099−0.0270.445−0.2010.268−0.297−1.7
Indirect effect
(Total)
1.0470.307−0.304−0.9770.717−0.1130.6331.537
pH −0.652−0.457−0.7640.7480.9140.4381.008
Organic carbon−0.581 −0.292−0.8120.6620.6250.2520.406
Total nitrogen−0.01−0.007 −0.0140.0080.0060.0190
Total phosphorus0.2750.3290.228 −0.228−0.324−0.113−0.174
Total potassium0.1220.1210.0570.103 −0.089−0.098−0.043
Alkaline nitrogen−0.198−0.152−0.055−0.1950.118 0.0440.201
Available phosphorus0.1050.0680.2040.076−0.145−0.048 0.026
Available potassium1.3870.627−0.0030.664−0.361−1.2750.146
* represented significant correlation (p < 0.05), ** represented extremely significant correlation (p < 0.01).
Table 2. Path coefficients of the physical and chemical properties of the soil surface for the phosphorus content in the new shoots of tea.
Action FactorpHOrganic CarbonTotal NitrogenTotal PhosphorusTotal PotassiumAlkaline NitrogenAvailable PhosphorusAvailable Potassium
Correlation coefficient0.024−0.118−0.3060.1190.138−0.4220.422−0.256
Direct action0.424−0.34−0.053−0.250.145−1.3170.6150.872
Indirect effect
(Total)
−0.4010.223−0.3780.369−0.0070.895−0.191−1.128
pH 0.2240.1570.262−0.257−0.313−0.15−0.346
Organic carbon−0.18 −0.09−0.2520.2050.1940.0780.126
Total nitrogen−0.02−0.014 −0.0270.0150.0110.0370
Total phosphorus−0.155−0.185−0.128 0.1290.1820.0640.098
Total potassium−0.088−0.087−0.041−0.074 0.0640.0710.031
Alkaline nitrogen0.9740.7490.2710.959−0.582 −0.214−0.988
Available phosphorus−0.218−0.141−0.422−0.1570.3010.1 −0.053
Available potassium−0.712−0.3220.002−0.3410.1850.654−0.075
Table 3. Path coefficients of the physical and chemical properties of the soil surface for the potassium content in the new shoots of tea.
Action FactorpHOrganic CarbonTotal NitrogenTotal PhosphorusTotal PotassiumAlkaline NitrogenAvailable PhosphorusAvailable Potassium
Correlation coefficient0.234−0.247−0.3230.0350.222−0.4440.417−0.604 *
Direct action−1.441−1.084−0.1640.765−0.7710.102−0.147−1.571
Indirect effect
(Total)
1.6750.838−0.16−0.7280.993−0.5450.5650.966
pH −0.761−0.533−0.890.8721.0660.511.175
Organic carbon−0.572 −0.287−0.8010.6530.6160.2480.4
Total nitrogen−0.061−0.043 −0.0840.0470.0340.1130
Total phosphorus0.4730.5650.393 −0.393−0.557−0.195−0.299
Total potassium0.4670.4650.2190.396 −0.341−0.377−0.164
Alkaline nitrogen−0.075−0.058−0.021−0.0740.045 0.0170.076
Available phosphorus0.0520.0340.1010.038−0.072−0.024 0.013
Available potassium1.2810.58−0.0030.614−0.334−1.1780.135
* represented significant correlation (p < 0.05).
Disclaimer/Publisher’s Note: The statements, opinions and data contained in all publications are solely those of the individual author(s) and contributor(s) and not of MDPI and/or the editor(s). MDPI and/or the editor(s) disclaim responsibility for any injury to people or property resulting from any ideas, methods, instructions or products referred to in the content.

