Article

Does the Soil Tillage Affect the Quality of the Peanut Picker?

by
Armando Lopes de Brito Filho
1,*,
Franciele Morlin Carneiro
2,
Jarlyson Brunno Costa Souza
1,
Samira Luns Hatun de Almeida
1,
Bruno Patias Lena
3 and
Rouverson Pereira da Silva
1
1
Department of Engineering and Mathematical Sciences, School of Agricultural and Veterinarian Sciences, São Paulo State University (Unesp), Jaboticabal 14884-900, São Paulo, Brazil
2
Federal Technological University of Paraná (UTFPR), Santa Helena 85892-000, Paraná, Brazil
3
University of Nebraska–Lincoln, Columbus, NE 68601, USA
*
Author to whom correspondence should be addressed.
Agronomy 2023, 13(4), 1024; https://doi.org/10.3390/agronomy13041024
Submission received: 8 January 2023 / Revised: 30 January 2023 / Accepted: 2 February 2023 / Published: 30 March 2023

Abstract

:
Machine harvesting is an essential step of crop production, considering a dynamic operation, and is subject to losses due to several factors that affect its quality. The objective of this study was to evaluate the quality of mechanized peanut pickers in the three soil tillage operations using Statistical Quality Control (SQC) tools. We conducted the experiments in a peanut field located at 21°20′23″ S and 47°54′06″ W of Brazilian peanut farmers. We used Statistic Control Quality (SQC) experimental design to monitor peanut losses during machine harvesting. The treatments evaluated were three soil tillage operations: conventional (CT), rotary tillers (RT), and hoe (RH). The quality indicators were collected inside the picker’s bulk tank. Statistical analyses used were descriptive statistics and SQC tools (run charts, control charts, and the Ishikawa diagram). The process was considered stable for indicators: whole pods (CT, RT, and RH), broken pods (CT, RT, and RH), and hatched pods (CT, RT, and RH), while the other indicators showed points that were out of control. With the application of SQC tools, it was possible to identify the factors that caused the increase of variability in peanut harvesting, listing the points to be improved to support decision-making, always aiming to increase this operation’s quality.

Graphical Abstract

1. Introduction

Peanut (Arachis hypogaea L.) is globally highlighted as one of the main produced oilseeds being an essential feedstock for food and biodiesel production due to its high energy value [1,2]. China is the world’s leading peanuts producer with 38%, followed by India with 13.7%, Nigeria with 7.6%, and the United States with 5.4% [3]. Brazil ranks at twelfth (1.3%), with a yearly estimated production of 558,400 thousand tons, of which 95% is produced by the state of São Paulo [4]. In which São Paulo has the primary agricultural production strategy cultivated under the conventional preparation system right after sugarcane succession [5,6].
Usually, sugarcane production areas have issues with soil compaction, and it occurs due to the intensive traffic of heavy machinery during the crop growth stage [7,8]. The peanut crop has hypogeal growth habits. Thus, compacted soil can negatively influence peanut pods, making it hard for peanut pegs and decreasing pod numbers per plant [9,10]. Therefore, soil preparation is one of the solutions for this problem because of driving proper crop development, increased productivity, and loss reduction [6,11].
Conventional preparation provides soil segregation, promoting greater conditions for germination [12]. Moreover, facility peanut pegs enter the ground and develop the peanut pods during reproductive growth because there is no physical barrier. Thus, this is one main motive by which Brazilian farms use this type of soil tillage. Although conventional preparation benefits are widely recognized in annual crops, there has been limited quantification of appropriate soil tillage management strategies for peanut crops in Brazil. Therefore, selecting a proper soil tillage practice that creates suitable soil conditions could be an excellent agronomic management strategy for enhancing peanut yield in a continuous cropping system [10].
Thereby, some studies developed in the United States [13,14,15,16] and China [17,18,19,20] showed that additional soil preparation practices other than conventional before peanut planting could improve soil quality and, therefore, provide favorable conditions for the development of the crop. Among the existing cultivation techniques, the use of beds for peanut cultivation is considered an alternative soil preparation practice that could potentially improve the performance of the culture [15,21] and the quality of the harvesting operation. According to Carvalho Filho et al. [22], when there is greater soil mobilization, the bed preparation allows a greater plant root system, which positively correlates with productivity. In addition, in other crops such as wheat, the use of beds can be more efficient, providing higher yields, weed control, and higher quality in the application of water [23,24].
On the order hand, with the increased demand for food production, agricultural mechanization has become an essential practice for optimizing operating capacity and efficiency [25]. Among all mechanized operations, harvest is considered the most sensitive operation related to the return of the investment on a crop production system [26]. The time of completion is one of the relevant factors that may influence the presence of losses in peanut since it may suffer the action of external mechanisms, such as the occurrence of climatic factors, machine (adjustments), man (labor) [27], the culture (plant phenology, cycle, and growth habits), and the environment, such as the influence of dry or compacted soil.
One of the main factors leading to the reduction of harvest operation efficiency is high field variability [28], which results in quality-quantitative losses that can be economically significant [29]. Therefore, the use of quality control techniques can be a feasible strategy since the harvest’s performance can be affected by the soil’s preparation [30,31] and the phenological behavior of the plant (non-uniform ripening of the fruit) [32].
Since the quality of each operation is one of the main factors driving the success of peanut production [2], the development of a quality management plan is imperative to prevent yield losses. Several authors have recently used Statistical Quality Control (SQC) in the quality analysis of agricultural processes to identify non-random or special causes resulting from the instability or variability of mechanized processes [6,27,31,33]. This quality tool has demonstrated excellent efficiency in data extraction, providing optimization of mechanized harvesting quality management to the best decision support.
Thereby, there are few studies that have evaluated the soil tillage in peanut harvest operation quality among existing studies. Thus, considering that the confection of beds provides more significant soil mobilization and can facilitate the development and the harvesting of peanut pods, it is assumed that the harvesting operation will present better operational quality since the physical and physiological qualities of the pods will be better preserved by the beds, as well as there may be less occurrence of impurities in the harvesting process. In this study, we propose to evaluate the operational quality of mechanized peanut harvesting when performed in three soil tillage operations, using statistical quality control tools.

2. Materials and Methods

2.1. Description of the Experimental Area

We conducted the experiments in a peanut field located at 21°20′23″ S and 47°54′06″ W of Brazilian peanut farmers. The soil from the experimental area is classified as Latossolo Vermelho according to the Brazilian Soil Classification System [34] and as Oxisol [35]. Peanut was cultivated in the MEIOSI (Inter Rotational Method Occurring Simultaneously) system, in which it is characterized for a crop rotation system with sugarcane. This system also reduces implementation costs and improves the characteristics of the cultivation area, such as soil microbiota and biota, soil physical and chemical conditions, as well as the logistics system [36]. The climate of the region is tropical with dry winter (Aw) according to the Köppen classification [37].

2.2. Equipment and Operations Performed

Before the implantation of the treatments, the subsoiling operations were carried out at 0.45 m of depth with a subsoiler composed of five rods with winged tips that had the objective of eliminating sugarcane knuckles and the compacted layers due to the intensive traffic of heavy machines used on previous crop. After this operation, the treatments were designed, which consisted of three soil tillage operations: Conventional Tillage (CT), Rotary Tillers (RT), and Rotary Hoe (RH) treatments. Table 1 shows the details of each equipment used according to the soil tillage, and Figure 1 shows the results of soil tillage operations.
To perform the soil tillage operations, a John Deere 7815 tractor was used, with a nominal power of 149 kW (199.237 hp) at 1950 rpm engine speed, with average speeds of 5 km h−1 (subsoiling), 7 km h−1 (harrowing), and 3.5 km h−1 (rotary tillers and rotary hoe). The adjustments of each equipment used for the preparation of the beds are present in Table 2. The preparation of the beds with the rotary tillers and rotary hoe were performed at 0.2 and 0.14 m high, with widths of 1.38 and 1.42 m, respectively. In addition, the rotary tillers and hoe equipment had different adjustments, such as the number of knives and PTO rotation.
Peanut was planted at a 0.9 m spacing between rows on November 2, 2019. Peanut digging was carried out 123 days after sowing (DAS) using a John Deere 7195J tractor, 4 × 2 TDA (143.5 kW/195 hp) pantograph starter, model KBM Flex 6 × 3, with every six rows harvested, forming three crop lions. Harvesting occurred three days after (126 DAS) using the same John Deere 7195 J tractor, using the following settings: average speed of 3.5 km h−1, 2000 rpm at the engine, and 805 rpm at the power take-off. The waste picker used was a Twin Master (MIAC), with a 5.40 m wide platform, 8 cm height of the beating pins, 430 rpm of rotation of the trailing cylinder, and the capacity to pick up 3 peanut trees (6 lines).

2.3. Experimental Design

The experimental design followed the premises of the CEQ (Statistical Quality Control), collecting, over time, 26 sample points in conventional tillage, 29 points in preparation with rotary tillers, and, with the rotary hoe, 30 points, all with 80 m spacing intervals.

2.4. Quality Indicator

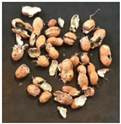
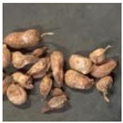
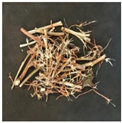
The quality indicators used were the characteristics of the material collected in the bulk tank, as to the purity and physical quality of the beans, which were whole pods (WHP), broken pods (BP), wilted pods (WP), loose grains (LG), vegetal impurity (VI), mineral impurity (MI), and water content (WT) related to pod water moisture. At each sampling point, samples were collected in a two-liter volumetric container and packed inside plastic bags. These samples were fractioned and characterized according to the methodology described by Simões [38], as presented in Table 3, and, subsequently, had their mass measured.
After the characterization and separation of the samples, the percentages of each material over the total mass of the samples were determined. All quality indicators had the water content of the pod corrected to 8% using Equation (1):
W C = 100 × M m M t
where:
WC: water content (%);
M: wet mass (g);
m: dry mass (g);
t: container tare with its lid (g).

2.5. Statistical Analysis

The data were analyzed using descriptive statistics, evaluating their behavior based on measures of position (mean, median, and quartiles), dispersion (standard deviation and coefficient of variation), asymmetry, and kurtosis, in addition to the Ryan–Joiner normality test (p > 0.10) of the probability of occurrence. The existence or not of discrepant data in the process was also identified using boxplot diagrams.
The box diagram is a graph that makes it possible to represent the distribution of a data set based on its descriptive parameters, such as the median, lower quartile, upper quartile, interquartile range, and minimum and maximum values. Thus, allowing us to evaluate the symmetry and dispersion of the results and the existence or not of outliers.
Variability analysis was monitored using run charts and control charts. Run charts provide information on non-random variation due to the influence of special causes, which generate patterns of trends, oscillations, mixtures, and grouping, for a better understanding of control charts.
The control chart used was of the individual type, which contains the individual values sampled at each point and the lower and upper control limits. This type of graph allows the evaluation of the quality of a process using the distance between the upper and lower control limits, which are calculated as a function of the mean and standard deviation (Equations (2) and (3)) so that the more distant they are from the mean, the greater the variability of the process. Since Montgomery [39] reports that variability and quality are inversely proportional, when you have more distance from the limits concerning the average, the greater the variability and the lower the quality of the process.
UCL   =   x _   +   3 .   σ
LCL   =   x _     3 .   σ
where:
UCL: Upper Control Limit;
LCL: Lower Control Limit (zero value was established when the calculated lower limit was negative because there are no negative values of losses.);
σ: standard deviation;
x _ : arithmetic mean.
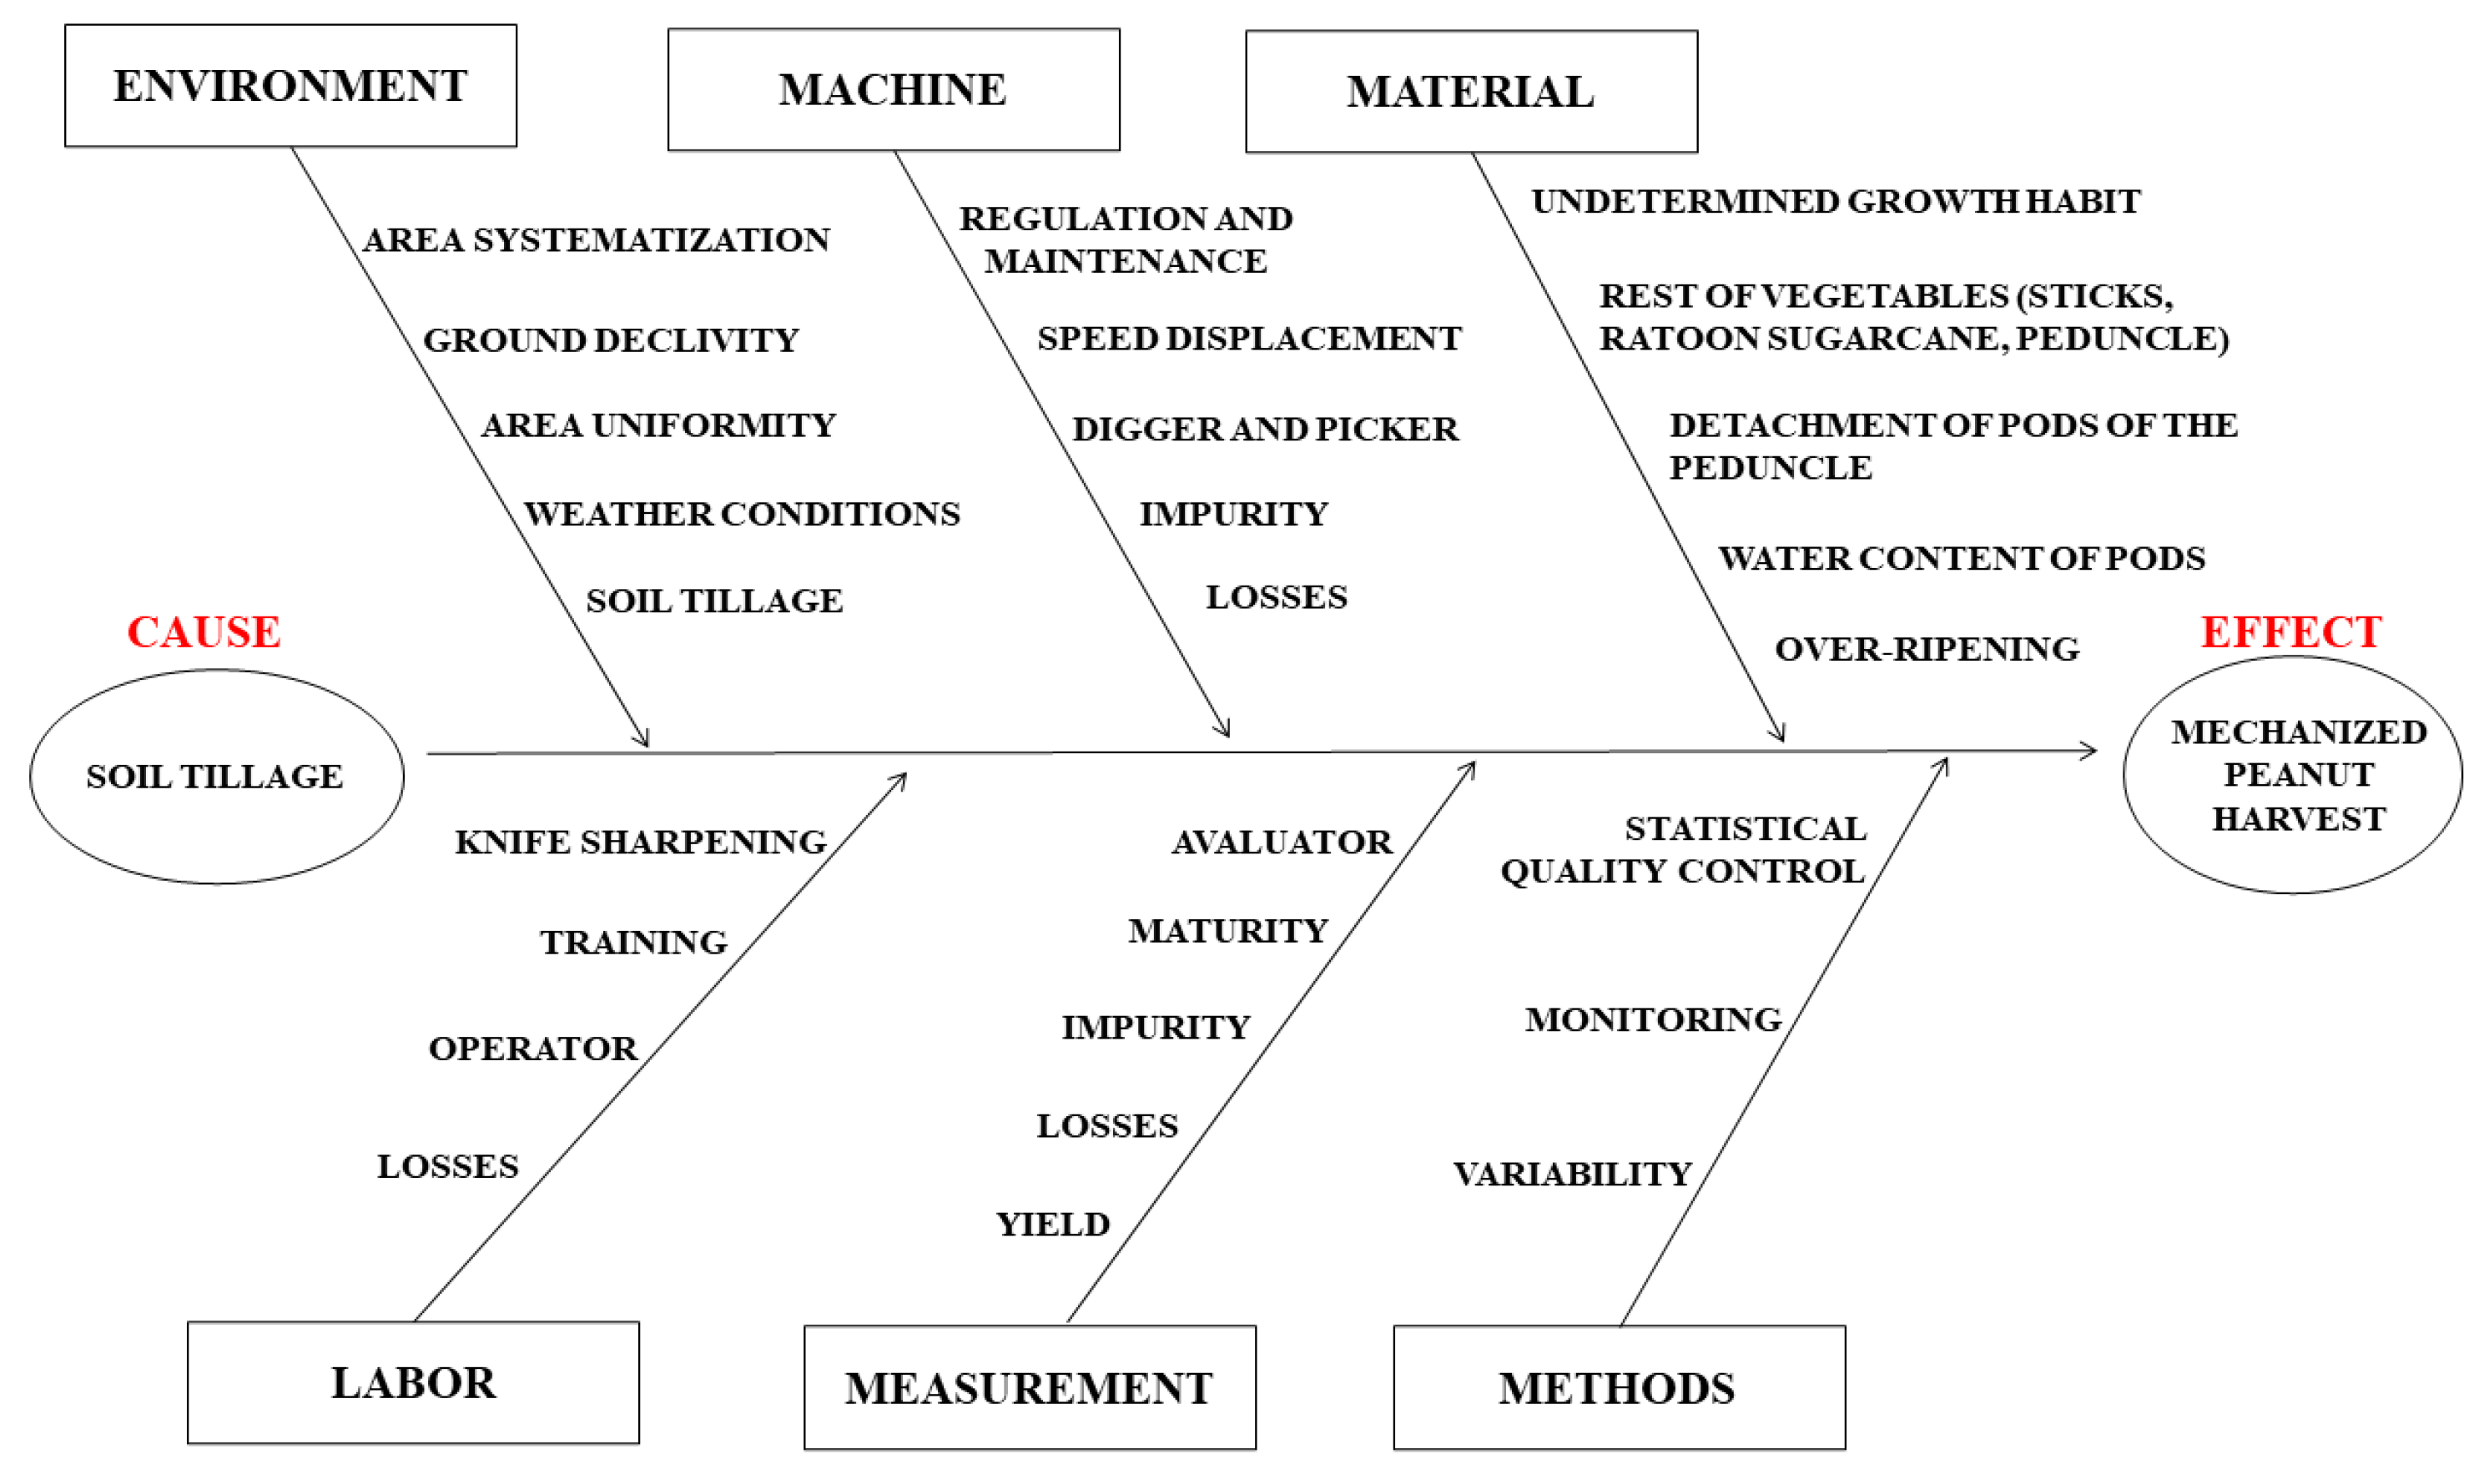
After the process analysis, the cause and effect diagram (Ishikawa diagram) was created based on the factors that affect the quality of the mechanized peanut harvesting, classified as People, Method, Machine, Material, Environment, and Measurement, thus facilitating the elaboration of a plan with possible improvements.

3. Results

3.1. Descriptive Statistics

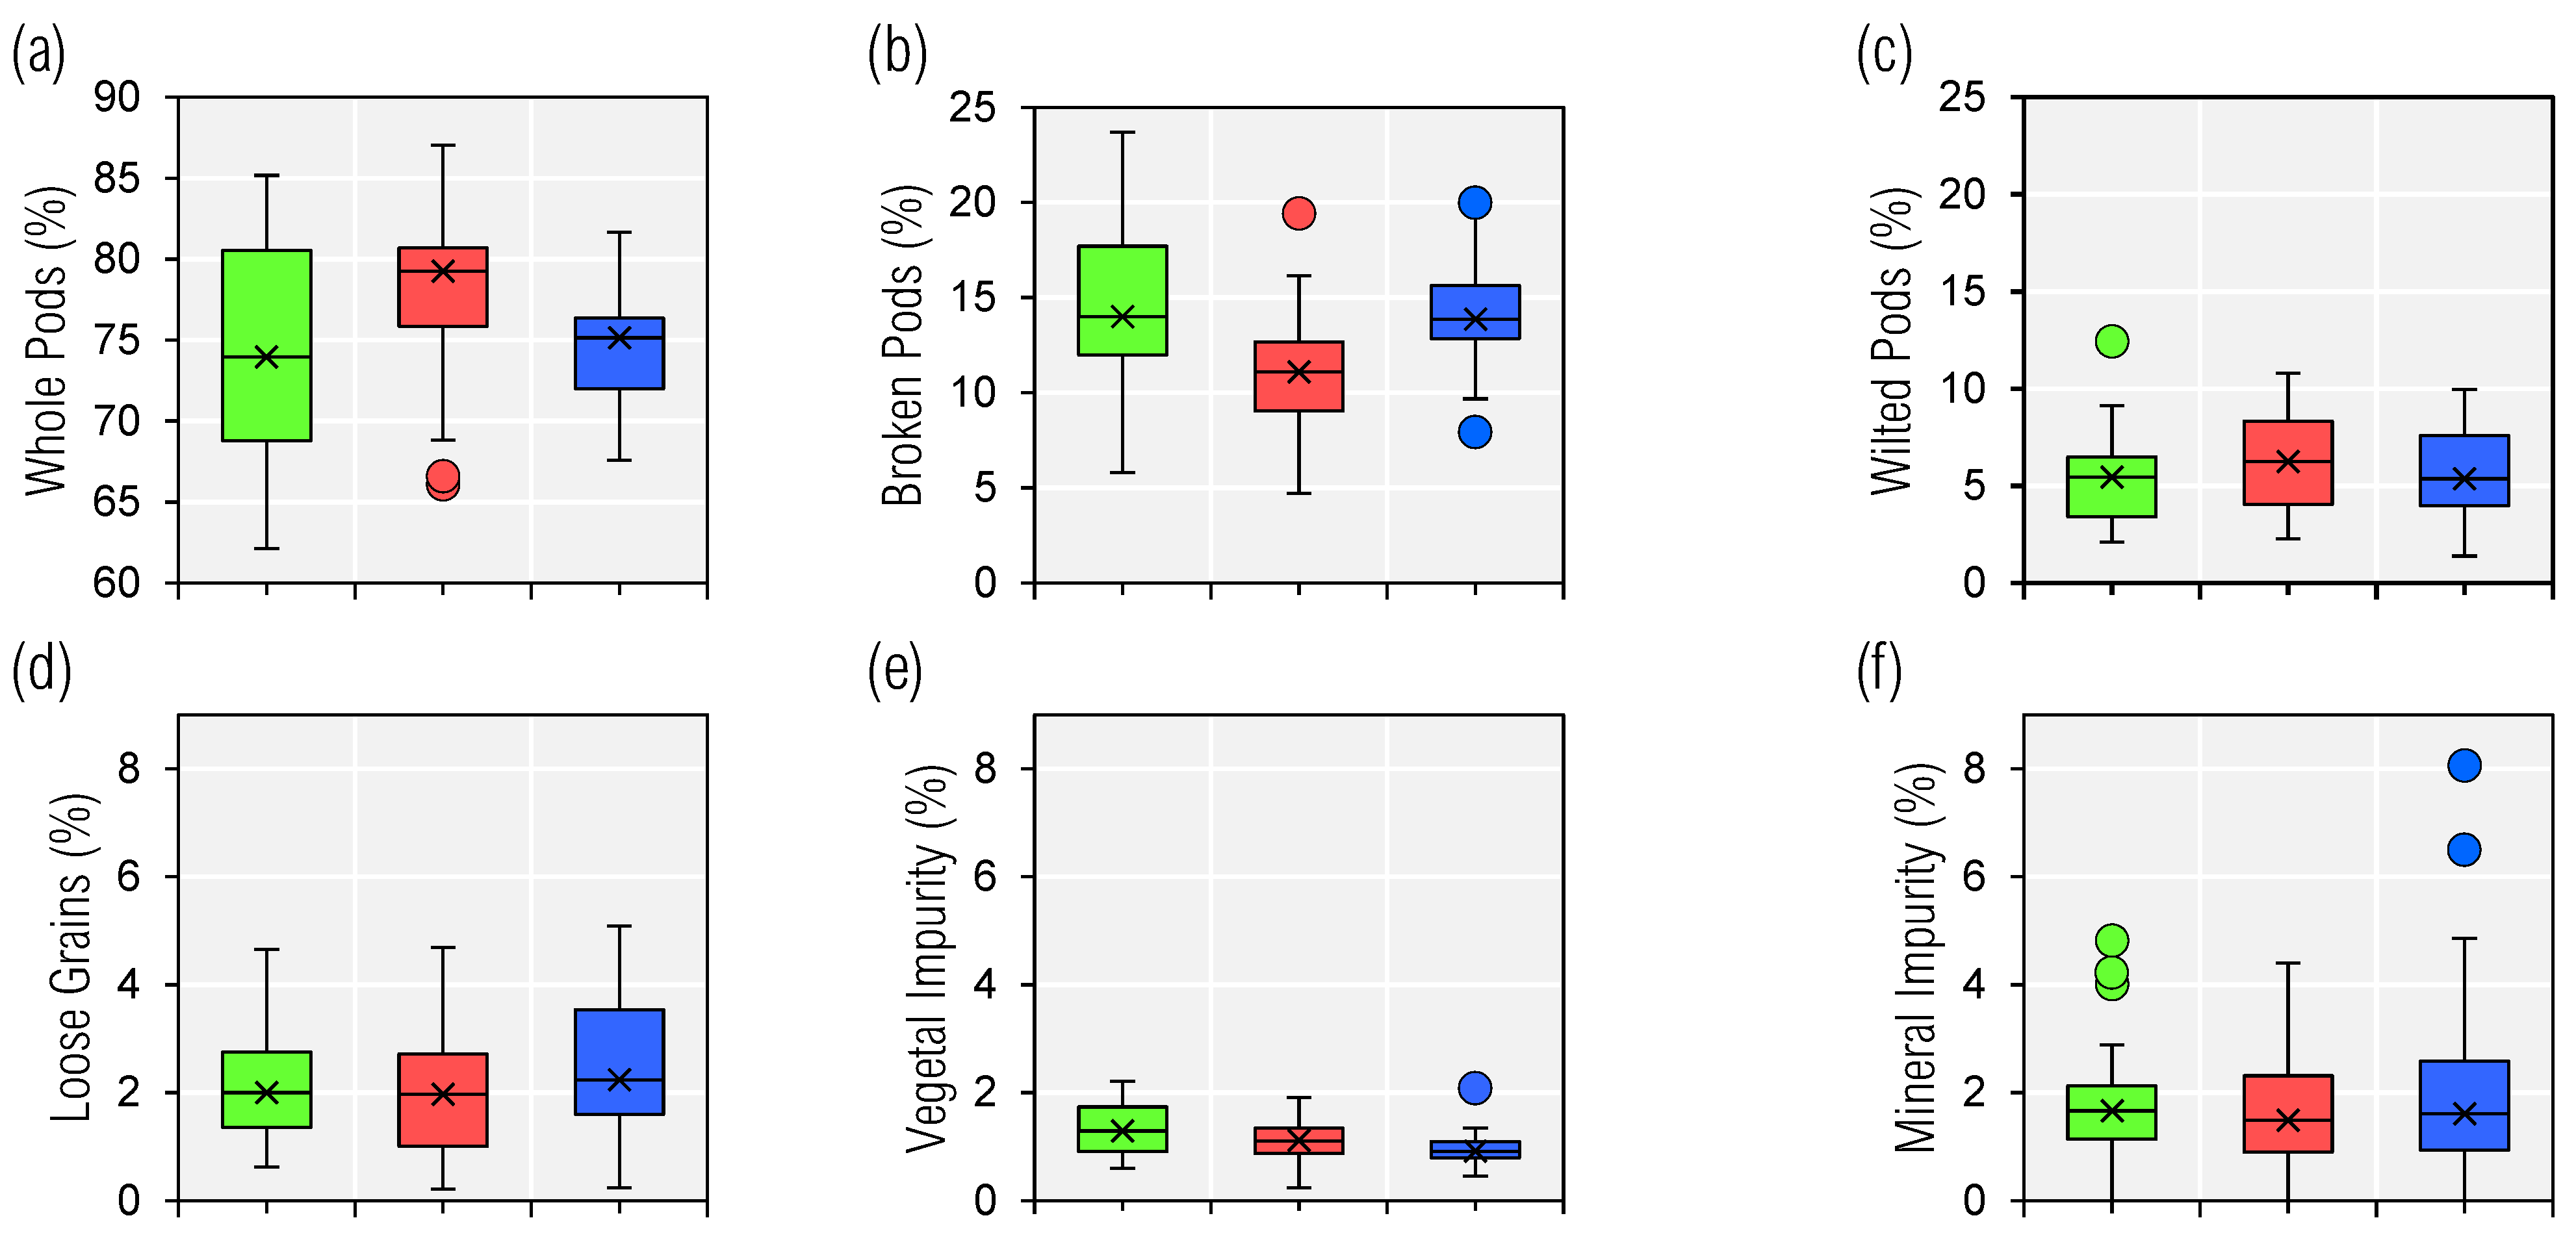
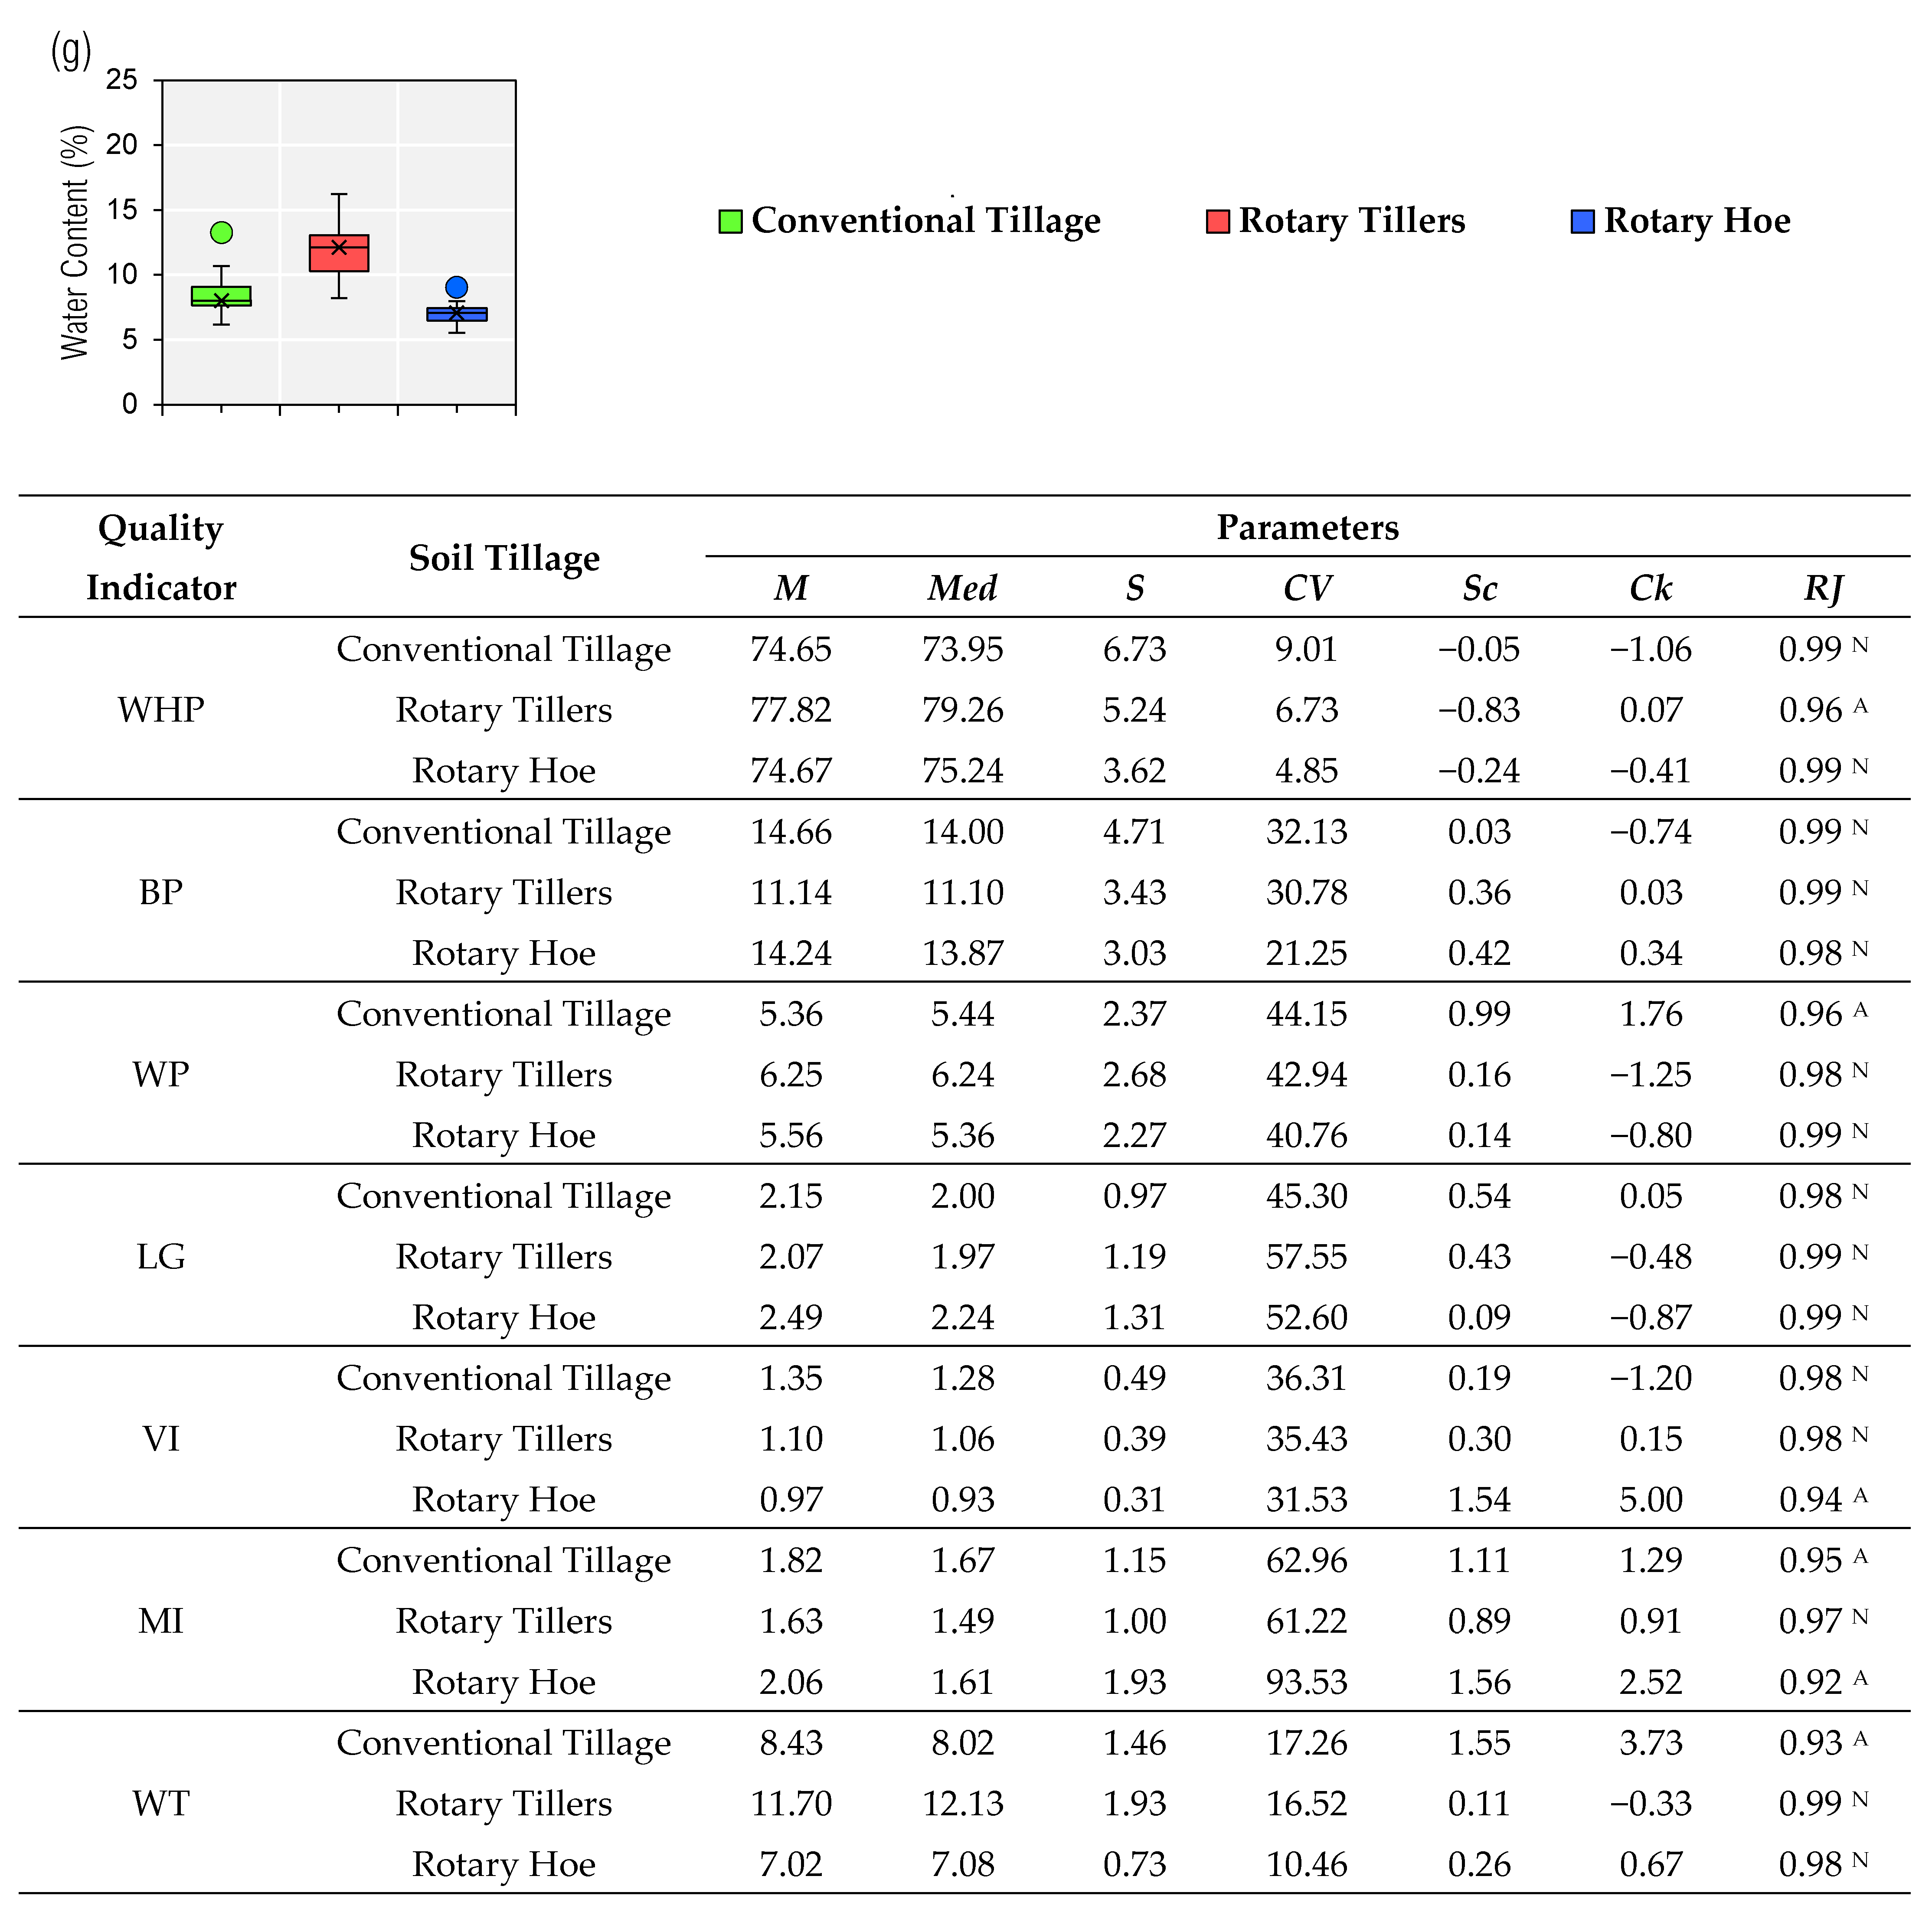
The preparation with beds (RT and RH) obtained values close to the CT (Figure 2). Although this is a pilot work in Brazil, the results were satisfactory for the preparation with beds, so that the confection of beds presented values consistent with the traditional method (CT).
The central measurement parameters (mean and median) presented values close to each other for all indicators, as well as most of the asymmetry and kurtosis coefficients that were close to zero, being able to express that a good part of the data set presents symmetric distribution. However, when evaluating the dispersion parameters (coefficient of variation and standard deviation), only the WHP indicator presented a low coefficient of variation (CV) (<10%), while the others presented moderate (10–20%), high (21–30%), and very high value (>35%; Pimentel-Gomes and Garcia [40]), suggesting a high variability of the data, that is, the existence of more dispersed values concerning the central measurement value (mean).
The WHP indicator (in all preparations) presented negative asymmetry, i.e., elongation of the distribution curve of the data on the left, indicating that the highest concentration of data has higher values. Thus, there is an opportunity for decision-making that can be applied to reduce losses, with the correction of possible actions that increase the variability of the process and directly influence producers’ economic return.
As for the kurtosis coefficient, values for the quality indicators varied, presenting a platykurtic distribution (Ck < 0) with flatter curves, representing that the dispersion values were high, with greater chances of the data being distant from the mean; as well as leptokurtic distribution (Ck > 0), characterizing a curve with a higher tapering degree.
Analyzing the normality test (Ryan–Joiner), most of the quality indicators presented normal distributions, except for the indicators WHP (RT), WP (CT), VI (RH), MI (all soil tillage), and WT (CT) that presented non-normal distributions, which could be justified due to the high values of kurtosis and asymmetry, these being far from zero, and the presence of outliers detected by the box diagram (Figure 2), which influence the increase in data dispersion, and all these indicators mentioned above presented outliers.
The identification of outliers is of utmost importance, as these can be considered unique points that potentially do not represent the real behavior of the data set, reflecting a more significant variability of the process. However, they should be investigated, as there might be signs of possible errors in the process, in which it is highlighted that all indicators that did not show normal distribution had the presence of outliers.

3.2. Statistical Quality Control

3.2.1. Run Charts

All the quality indicators presented non-random standards (Table 4), implying that the process may be under the effect of special causes, indicating high variability in the process, which may end up affecting its behavior predictably, making it impossible to obtain standard values due to the action of causes that can be identified through the factors (Labor, Material, Method, Machines, Environment, and Measures). Because of this, the probability test (p < 0.05) showed patterns of clustering, trends, and oscillation behavior. Clustering patterns indicate the presence of special causes resulting from measurement errors or readings during data collection; oscillation occurs when the data fluctuate up and down, indicating that its process is not constant, while trends are a sustained deviation of the data, which can be up or down, expressing that the process tends to become out or will soon become out of control [41].
Not all soil tillage presented a non-random pattern (p > 0.05), as shown in Table 4, indicating only the presence of natural causes inherent to the process. However, it is essential to emphasize that when special causes occur, the use of a complimentary analysis that is generally done through the control charts is required, allowing a greater clarification of whether special causes are involved in mitigating actions.

3.2.2. Individual Value Control Charts

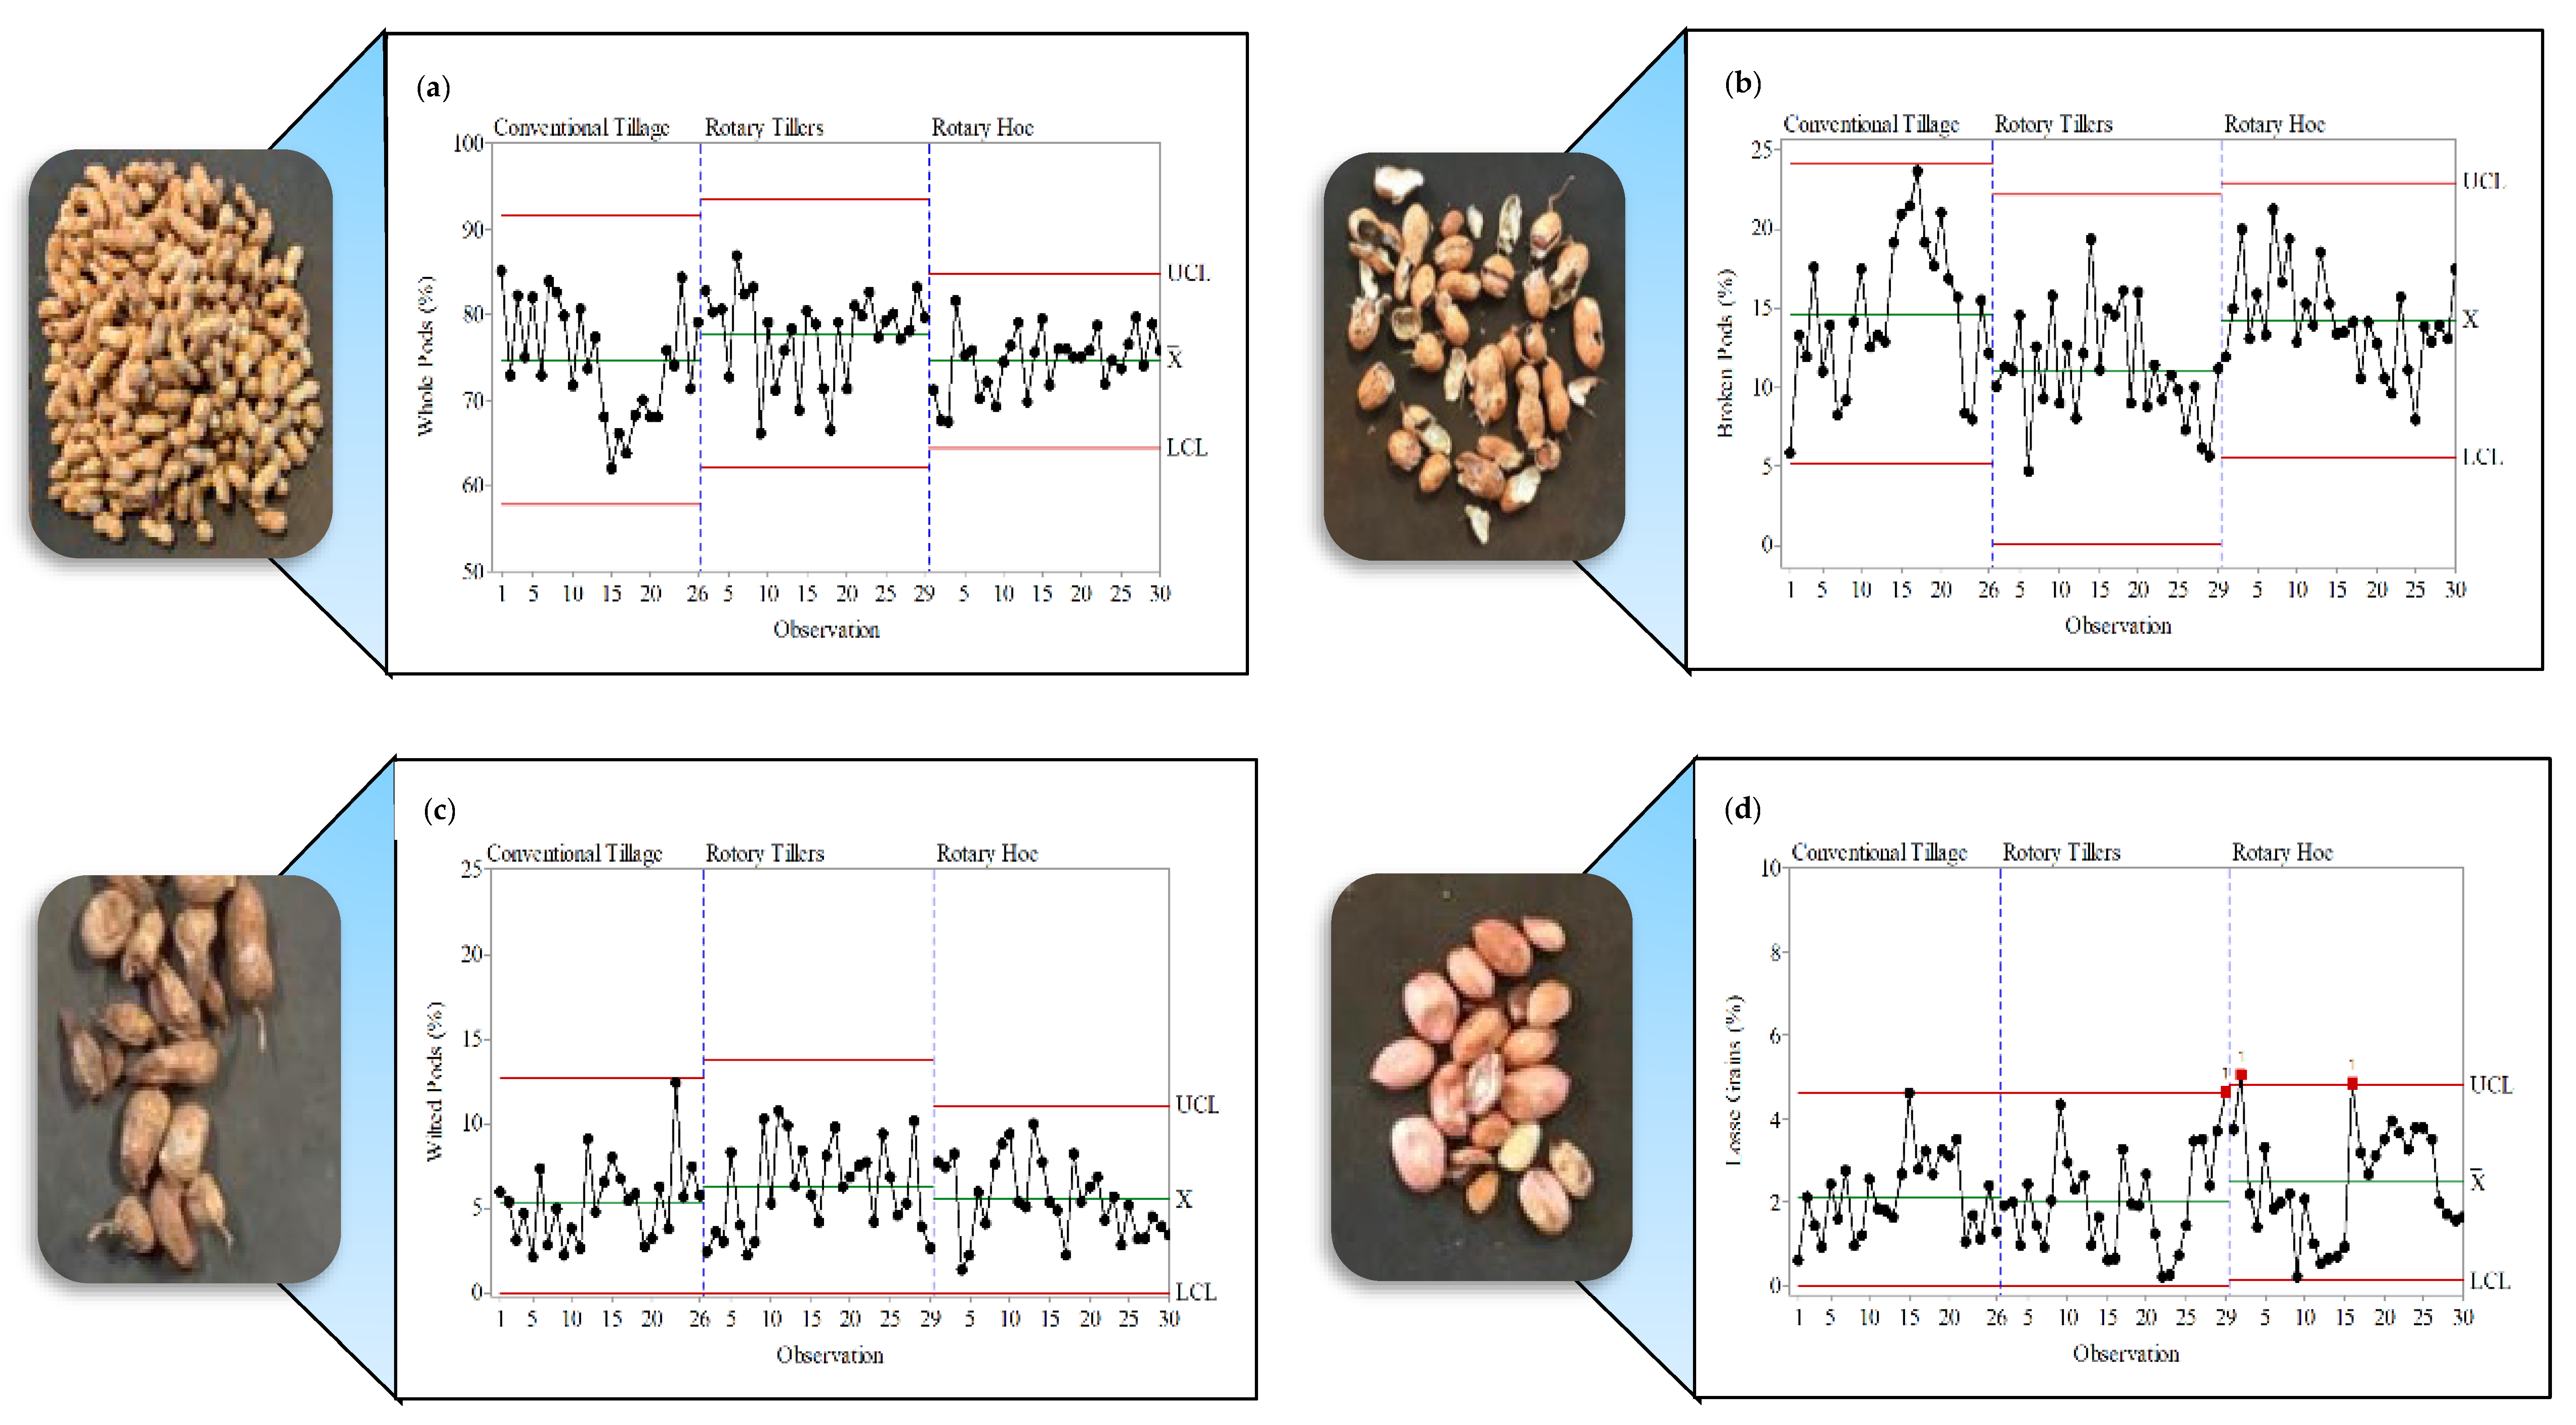
The individual value control charts (Figure 3) indicated that RH was the one that stood out the most compared to CT and RT because it presented less data variability for most quality indicators (except for MI indicator), corroborating with the results presented in the descriptive analysis (Figure 2), in which the dispersion parameters (standard deviation and CV) had lower values in relation to the other preparations, indicating less variation in the process and, consequently, higher quality.
The higher quality of the process identified for RH can be explained due to the higher soil mobilization than the other preparations, since it presented a higher amount of operation than CT and higher numbers of knives per RH flange in relation to the RT (Table 2). In a study investigating soil tillage performance in harvest quality, Rós [42] found that preparation with beds has favored greater benefits for the cultivation of sweet potatoes, presenting better root development of the crop, increased productivity, and higher quality in the final product. In other research, Silva et al. [30] and Tavares et al. [31] verified during mechanized coffee harvesting that quality operation was influenced by soil tillage, wherein different soil tillage studied showed distinct variability.
However, when evaluating the whole process, regarding the presence of special causes, it was found that CT and RT were the ones that showed the greatest stability in the individual value charts (Figure 3), presenting themselves with the lowest points out of control. These special causes were detected only for the LG quality indicators (RT and RH), VI (only RH), MI (RT and RH), and WT (all preparations). For indicator VI, CT and RT preparations did not present out-of-control points, however, the presence of non-randomness patterns was found. Thus, such instabilities imply special causes, which can be considered a failure or error occurring during the conduct of the experiment.
The other indicators (WHP, BP, and WP) did not present out-of-control points, demonstrating stability for the process. However, it is essential to point out non-random patterns (clustering and oscillation), observed in Table 4, for the indicators, in some cases only in the CT, another in the RT, or both. These findings indicate that more attention should be paid to the process, as it can become unstable, demonstrating that it should be monitored frequently to avoid special causes.

4. Discussion

The results of quality of material harvested along with the presence of impurities given in Figure 2 for CT, which is the most common management practice for peanut production in Brazil, shows that there are a lot of issues related to this management practice. In this way, it is possible to observe that the RT and RH preparations proved to be capable of reaching similar or even higher yield values than the CT, which can be attributed to the fact that the preparations with beds presented additional soil operation that may have led to better soil conditions for peanut development. Additionally, it is important to emphasize that the area where the study was conducted was previously cultivated with sugarcane, which is notorious for presenting higher soil compaction levels because of intensive mechanization operations. Therefore, the rotary hoe and rotary tillers provided greater soil disaggregation, enabling better root and crop development for the RT and RH in comparison with CT [22].
Based on the results of the control charts (Figure 3), RH presented higher quality in the peanut harvest process due to the lower variability of the data than the other preparations. These findings can be explained by the higher soil mobilization of RH than CT due to the higher numbers of knives per flange of the RT (Table 2). Thus, in a study investigating soil preparation performance on crop quality, Rós [40] found that preparation with ridges favored more significant benefits for sweet potato cultivation, showing better root development of the crop, increased productivity, and higher quality in the final product. In addition, Silva et al. [30] and Tavares et al. [31] observed that soil preparation also improved the mechanized coffee harvesting quality.
It is important to emphasize that the high variability of the results detected by the dispersion parameters is common in studies in the area of agricultural mechanization, as found for mechanized harvesting in soybean [26], peanut [33], and coffee [31], among others. High CV values obtained, mainly in this type of operation, are usually associated with external factors such as machine (operating speed, incorrect regulation of the harvester), labor (operator experience) [27], plant (phenology and bedding), climate (precipitation, wind, air temperature, and humidity) and soil (humidity and topography).
After the process of quality analysis, the cause and effect diagram was synthesized (Figure 4) to identify and demonstrate possible factors that influence the harvesting process concerning soil preparation. Additionally, with the visualization of these results, it is possible to elaborate strategies to improve the mechanized process of peanut harvesting.
Considering the six factors (labor, environment, machine, measurement, material, and method), it was possible to list the leading critical indicators of the collection operation. Thus, it was verified that the new form of management was a challenge for the operators (labor factor), who faced a new scenario to which they were not adapted, which would realize the mechanized operations of peanut cultivation on beds. Because of this, the lack of experience may have led to errors while conducting the operations. Therefore, it was observed that the same adaptations of the mechanized setting (machine factor) for the CT were preserved for the operations in the preparation with beds, and this may have originated errors since they did not seek an adaptation of the operations for a new form of preparation.
As for the environment factor, the non-uniform behavior of the area preparation was observed throughout the crop development due to climatic factors (rain and wind). In this way, the irregular area contributed to the operator’s difficulty positioning the mechanized set on the lines for harvesting. Such events may also have contributed to the increase of impurities of harvested material due to the area’s irregularity, and, in some sample points, the accumulation of larger quantities of vegetal and mineral material (formed hills) was verified. During peanut collection, the machine may have taken larger quantities of this material to the cleaning process, influencing the efficiency of the operation. For example, during the start-up operation for the RT and RH, there was an accumulation of plant material harvested in certain places of the beds, resulting in “stuffing” (accumulation of plant remains to prevent the flow of material into the machine) of the waste picker, so this problem may have influenced the appearance of discrepant points (outliers, which can be seen in Figure 3e,f), affecting the quality of the process.
Another cause that must be taken into consideration for these indicators (VI and MI) is the raw material. These indicators still have a limitation in the inconsistency of their measurement because the VI is characterized as plant remains (sticks, sugarcane knuckles, peduncles) with different masses, and solids represent the MI with different granulometry. The different masses caused inconsistencies in measuring the percentage of the indicator, being visible results in the descriptive analysis (Figure 2) that presented high variability (high CV), and, in some cases, even non-significant data for the normality test. In addition to the fact that CT and RT did not present out-of-control points for indicator VI, non-random patterns were found, implying that the process is unstable or following an instability.
Another factor that calls attention is the fact that the harvest was performed late since the water content of the pods was below recommended (18–24%), as presented by the averages of the descriptive analysis (Figure 2), expressing that the pods were exposed to the field for more time, curing, than was necessary. For this indicator, we have also observed out-of-control points in the three preparations, which can be explained by the environmental factors (sunlight, rain, wind, and irradiation) that are difficult to control and cause variability in the process. As observed in the descriptive analysis results, the presence of non-normal data in the CT and non-randomization patterns (trends) for the RH were detected by the run charts.
As a result, this action directly affected the quality of the final product, causing higher percentages of broken pods and loose grains, which is an undesirable situation for producers due to the depreciation of the physical quality of the final product and the reduction of economic gains. Pods with low water content are more susceptible to break because they are drier, generating BP, and, consequently, LG. Based on these results and the studies shown, Figure 2 shows that RH had the lowest water content compared to CT and RT, showing the highest percentage of BP and LG. Furthermore, it was identified in the sequential graphs that the WC presented non-randomization patterns for RH (Table 4) due to special causes that interfered in the process, which was the late harvesting of the pods in the field.
This is an undesirable situation for producers, since it causes depreciation in the physical quality of the final product and reduction of economic gains. However, few studies have considered the quality of peanut picking in the function of the pod WC, aiming at the quality of the raw material. Thus, it would demonstrate the need to implement future studies that explore the relationship of the pod WC with the qualitative losses from the mechanized harvest, whereas an ideal WC could be established to guarantee a higher percentage of whole pods in the harvest.
Thus, through the SQC tools, it became possible to analyze the collection process and identify the possible causes that affect this mechanized system. With this, it is possible to elaborate improvement plans to help the producer support decision-making with preventive and corrective measures.

5. Conclusions

Soil tillage operations influence the quality of mechanized peanut harvesting. From the process control charts, it was possible to verify that most of the indicators analyzed in this work showed less variability for the treatment with a rotary hoe. Thus, our results show that the rotary hoe presents higher quality than other treatments. In addition, we observed that some indicators were under the effect of special causes that tend to decrease the quality of the process. With this, we observe a gap that can be explored and further improve the result’s response. In the present study, just one soil type was evaluated. In future works, we need to explore more compounds (soil compaction, soil types, and characterize soil parameters). Field behavior observation is needed to explain better the complex interaction between soil and soil tillage operations. Our study will undoubtedly be helpful for better mechanized agricultural production. Our results offer a new understanding of the application of SQC tools and guidance for selecting factors that cause variability in peanut harvesting, listing the points to be improved to support decision-making, always aiming to increase this operation’s quality.

Author Contributions

Conceptualization, A.L.d.B.F. and R.P.d.S.; methodology, A.L.d.B.F., F.M.C., J.B.C.S., S.L.H.d.A. and R.P.d.S.; software, A.L.d.B.F. and R.P.d.S.; validation, A.L.d.B.F. and R.P.d.S.; formal analysis, A.L.d.B.F., F.M.C. and R.P.d.S.; investigation, A.L.d.B.F., F.M.C., J.B.C.S., S.L.H.d.A. and R.P.d.S.; resources, R.P.d.S.; data curation, A.L.d.B.F. and R.P.d.S.; writing—original draft preparation, A.L.d.B.F., F.M.C., J.B.C.S., S.L.H.d.A., B.P.L. and R.P.d.S.; writing—review and editing, A.L.d.B.F., F.M.C., J.B.C.S., S.L.H.d.A., B.P.L. and R.P.d.S.; visualization, A.L.d.B.F., F.M.C., J.B.C.S., S.L.H.d.A., B.P.L. and R.P.d.S.; supervision, R.P.d.S.; project administration, R.P.d.S.; funding acquisition, R.P.d.S. All authors have read and agreed to the published version of the manuscript.

Funding

This research received no external funding.

Data Availability Statement

Not applicable.

Acknowledgments

The authors thank the Coordination for the Improvement of Higher Education Personnel—Brazil (CAPES) for financial support (Financing Code 001) of the scholarship granted to the first author, and the Laboratory of Machinery and Agricultural Mechanization (LAMMA) of the Department of Engineering and Mathematical Sciences—Unesp/FCAV for infrastructure and support.

Conflicts of Interest

The authors declare that they do not have conflict of interest.

References

  1. Santos, R.F.; Todeschini, A.; Rosa, H.A.; Chaves, L.I.; Bassegio, D.; Veloso, G. Evolução e perspectiva da cultura do amendoim para biocombustível no Brasil. Acta Iguazu 2012, 1, 20–35. [Google Scholar]
  2. Santos, R.C.; Freire, R.M.M.; Lima, L.M. O Agronegócio do Amendoim no Brasil, 2nd ed.; Embrapa: Brasília, DF, Brazil, 2013. [Google Scholar]
  3. USDA, United States Department of Agriculture. World Agricultural: Production: Peanut Area, Yield, and Production. 2020. Available online: https://apps.fas.usda.gov/psdonline/circulars/production.pdf (accessed on 9 August 2020).
  4. Conab, Companhia Nacional de Abastecimento. Acompanhamento da Safra Brasileira. 2021. Available online: https://www.conab.gov.br/info-agro/safras (accessed on 10 November 2020).
  5. Fachin, G.M.; Duarte Júnior, J.B.; Glier, C.A.D.S.; Mrozinski, C.R.; Costa, A.C.; Guimarães, V.F. Agronomic characteristics of six peanut cultivars grown in conventional and no-tillage system. Rev. Bras. Eng. Agríc. Ambient. 2014, 18, 165–172. [Google Scholar] [CrossRef] [Green Version]
  6. Ormond, A.T.S.; Santos, A.F.; Alcantara, A.S.; Zerbato, C.; Furlani, C.E.A. Tillage interference in the quality of peanut mechanized harvest. Eng. Agríc. 2018, 38, 251–259. [Google Scholar] [CrossRef]
  7. Souza, G.S.D.; Souza, Z.M.D.; Cooper, M.; Tormena, C.A. Controlled traffic and soil physical quality of an Oxisol under sugarcane cultivation. Sci. Agric. 2015, 72, 270–277. [Google Scholar] [CrossRef] [Green Version]
  8. Gírio, L.A.S.; Silva, R.P.; Menezes, P.C.; Carneiro, F.M.; Zerbato, C.; Ormond, A.T.S. Quality of multi-row harvesting in sugarcane plantations established from pre-sprouted seedlings and billets. Ind. Crops Prod. 2019, 142, 111831. [Google Scholar] [CrossRef]
  9. Haro, R.J.; Dardanelli, J.L.; Otegui, M.E.; Collino, D.J. Seed yield determination of peanut crops under water deficit: Soil strength effects on pod set, the source-sink ratio and radiation use efficiency. Field Crops Res. 2008, 109, 24–33. [Google Scholar] [CrossRef]
  10. Yang, D.; Liu, Y.; Wang, Y.; Gao, F.; Zhao, J.; Li, Y.; Li, X. Effects of soil tillage, management practices, and mulching film application on soil health and peanut yield in a continuous cropping system. Front. Microbiol. 2020, 11, 570924. [Google Scholar] [CrossRef]
  11. Carvalho, T.L.; Rocha, A.C.; Campos, B.F.J.; Cunha, F.N.; Silva, N.F.; Teixeira, M.B. Genótipos de amendoim cultivados em semeadura direta e convencional sob regime hídrico do sudoeste goiano. Rev. Bras. Agric. Irrig. 2014, 8, 432–443. [Google Scholar] [CrossRef]
  12. Molina, W.F., Jr. Comportamento Mecânico do Solo em Operações Sgrícolas; ESALQ/USP: Piracicaba, SP, Brasil, 2017. [Google Scholar] [CrossRef]
  13. Brandenburg, R.L.; Herbert Júnior, D.A.; Sullivan, G.A.; Naderman, G.C.; Wright, S.F. The Impact of Tillage Practices on Thrips Injury of Peanut in North Carolina and Virginia. Peanut Sci. 1998, 25, 27–31. [Google Scholar] [CrossRef]
  14. Sorensen, R.B.; Brenneman, T.B.; Lamb, M.C. Peanut yield response to conservation tillage, winter cover crop, peanut cultivar, and fungicide applications. Peanut Sci. 2010, 37, 44–51. [Google Scholar] [CrossRef] [Green Version]
  15. Jackson, J.L.; Beasley Júnior, J.P.; Tubbs, R.S.; Lee, R.D.; Grey, T.L. Fall-Bedding for Reduced Digging Losses and Improved Yield in StripTill Peanut. Peanut Sci. 2011, 38, 31–40. [Google Scholar] [CrossRef] [Green Version]
  16. Truman, C.C.; Potter, T.L.; Nuti, R.C. Quantifying variable rainfall intensity events on seasonal runoff and sediment losses from strip and conventionally tilled peanuts. Peanut Sci. 2012, 39, 62–68. [Google Scholar] [CrossRef]
  17. Shen, P.; Wu, Z.; Wang, C.; Luo, S.; Zheng, Y.; Yu, T.; Sun, X.; Sun, X.; Wang, C.; He, X. Contributions of rational soil tillage to compaction stress in main peanut producing areas of China. Sci. Rep. 2016, 6, 38629. [Google Scholar] [CrossRef] [Green Version]
  18. Huang, S.; Lin, W.; Chuan, Y.; QianRu, H.; YanHong, C.; Kun, Z.; ChangQiang, W.; QiNa, Z.; XiaoHua, Y.; YiJun, Z. Efeitos da profundidade do preparo do solo no crescimento da raiz e na atividade do amendoim em campo com declive de solo vermelho. Acta Agric. Jiangxi 2018, 30, 9–12. [Google Scholar]
  19. Wang, Y.; Fan, J.; Cao, L.; Zheng, X.; Ren, P.; Zhao, S. The influence of tillage practices on soil detachment in the red soil region of China. Catena 2018, 165, 272–278. [Google Scholar] [CrossRef]
  20. Shen, P.; Wang, C.; Wu, Z.; Wang, C.; Zhao, H.; Shan, S.; Wu, M.; Sun, X.; Yu, T.; Zheng, Y.; et al. Peanut macronutrient absorptions characteristics in response to soil compaction stress in typical brown soils under various tillage systems. J. Soil Sci. Plant Nutr. 2019, 65, 148–158. [Google Scholar] [CrossRef]
  21. Jordan, D.L.; Johnson, P.D. Reduced tillage research with peanut in North Carolina (1997–2005). In Proceedings of the 28th Annual Southern Conservation Systems Conference, Amarillo, Texas, 26–28 June 2006; pp. 134–141. [Google Scholar]
  22. Carvalho Filho, A.; Centurion, J.F.; Silva, R.P.; Furlani, C.E.A.; Carvalho, L.C. Métodos de preparo do solo: Alterações na rugosidade do solo. Eng. Agríc. 2007, 27, 229–237. [Google Scholar] [CrossRef] [Green Version]
  23. Fahong, W.; Xuqing, W.; Sayre, K. Comparison of conventional, flood irrigated, flat planting with furrow irrigated, raised bed planting for winter wheat in China. Field Crops Res. 2004, 87, 35–42. [Google Scholar] [CrossRef]
  24. Majeed, A.; Muhmood, A.; Niaz, A.; Javid, S.; Ahmad, Z.A.; Shah, S.S.H.; Shah, A.H. Bed planting of wheat (Triticum aestivum L.) improves nitrogen use efficiency and grain yield compared to flat planting. Crop J. 2015, 3, 118–124. [Google Scholar] [CrossRef] [Green Version]
  25. Emami, M.; Almassi, M.; Bakhoda, H. Agricultural mechanization, a key to food security in developing countries: Strategy formulating for Iran. Agric. Food Secur. 2018, 7, 24. [Google Scholar] [CrossRef] [Green Version]
  26. Menezes, P.C.; Silva, R.P.; Carneiro, F.M.; Girio, L.A.S.; Oliveira, M.F.; Voltarelli, M.A. Can combine headers and travel speeds affect the quality of soybean harvesting operations? Rev. Bras. Eng. Agríc. Ambient. 2018, 22, 732–738. [Google Scholar] [CrossRef]
  27. Zerbato, C.; Furlani, C.E.A.; Silva, R.P.; Voltarelli, M.A.; Santos, A.F. Statistical control of processes aplied for peanut mechanical digging in soil textural classes. Eng. Agríc. 2017, 37, 315–322. [Google Scholar] [CrossRef] [Green Version]
  28. Santinato, F.; Silva, R.P.; Cassia, M.T.; Santinato, R. Qualitative analysis of mechanized harvesting of coffee in two harvests. Coffee Sci. 2014, 9, 495–505. [Google Scholar]
  29. Marcondes, M.C.; Miglioranza, É.; Fonseca, I.C.B. Qualidade de sementes de soja em função do horário de colheita e do sistema de trilha de fluxo radial e axial. Eng. Agríc. 2010, 30, 316–321. [Google Scholar] [CrossRef]
  30. Silva, R.P.; Voltarelli, M.A.; Cassia, M.T.; Vidal, D.O.; Cavichioli, F.A. Quality of the operations of reduced soil preparation and mechanized transplanting of coffee plants. Coffee Sci. 2014, 9, 51–60. [Google Scholar]
  31. Tavares, T.O.; Borba, M.A.P.; Oliveira, B.R.; Silva, R.P.; Voltarelli, M.A.; Ormond, A.T.S. Effect of soil management practices on the sweeping operation during coffee harvest. Agron. J. 2018, 110, 1689–1696. [Google Scholar] [CrossRef] [Green Version]
  32. Silva, F.C.; Silva, F.M.; Alves, M.C.; Ferraz, G.A.S.; Sales, R.S. Efficiency of coffee mechanical and selective harvesting in different vibration during harvest time. Coffee Sci. 2015, 10, 56–64. [Google Scholar]
  33. Santos, A.F.; Silva, R.P.; Zerbato, C.; Menezes, P.C.; Kazama, E.H.; Paixão, C.S.S.; Voltarelli, M.A. Use of real- time extend GNSS for planting and inverting peanuts. Precis. Agric. 2019, 20, 840–856. [Google Scholar] [CrossRef]
  34. Santos, H.G.; Jacomine, P.K.T.; Anjos, L.H.C.; Oliveira, V.Á.; Lumbreras, J.F.; Coelho, M.R.; Almeida, J.A.; Araújo Filho, J.C.; Oliveira, J.B.; Cunha, T.J.F. Istema Brasileiro de Classificação de Solos, 5th ed.; Embrapa: Brasília, DF, Brazil, 2018; 356p. [Google Scholar]
  35. Soil Survey Staff. Keys to Soil Taxonomy, 12th ed.; USDA-Natural Resources Conservation Service: Washington DC, USA, 2014. [Google Scholar]
  36. Sociedade Nacional de Agricultura. Meiosi: Sistema antigo volta a ser opção para aumentar pordutividade da cana. 2016. Available online: https://www.sna.agr.br/meiosi-sistema-antigo-volta-a-ser-opcao-para-aumentar-produtividade-da-cana/ (accessed on 1 July 2020).
  37. Alvares, C.A.; Stape, J.L.; Sentelhas, P.C.; Gonçalves, J.L.d.M.; Sparovek, G. Koppen’s climate classification map for Brazil. Meteorol. Z. 2014, 22, 711–728. [Google Scholar] [CrossRef]
  38. Simões, R.R. Controle Estatístico Aplicado ao Processo de Colheita Mecanizada de Sementes de Amendoim. Master’s Thesis, Universidade Estadual Paulista Faculdade de Ciências Agrárias e Veterinárias, Câmpus de Jaboticabal, Jaboticabal, SP, Brazil, 2009. [Google Scholar]
  39. Montgomery, D.C. Introdução ao Controle Estatístico da Qualidade, 7th ed.; Grupo Gen-LTC: Rio de Janeiro, RJ, Brazil, 2016. [Google Scholar]
  40. Pimentel-Gomes, F.P.; Garcia, C.H. Estatística Aplicada a Experimentos Agronômicos e Florestais: Exposição com Exemplos e Orientações Para Uso de Aplicativos; FEALQ: Piracicaba, SP, Brazil, 2022; 309p. [Google Scholar]
  41. Minitab, L.L.C. Introdução ao Minitab 19. 2023. Available online: https://www.minitab.com/content/dam/www/en/uploadedfiles/documents/getting-started/Minitab19GettingStarted_PT.pdf (accessed on 8 January 2023).
  42. Rós, A.B. Sistemas de preparo do solo para o cultivo da batata-doce. Bragantia 2017, 76, 113–124. [Google Scholar] [CrossRef] [Green Version]
Figure 1. Soil tillage operation treatments: conventional (a), rotary tillers (b), and hoe (c).
Agronomy 13 01024 g001
Figure 2. The behavior of quality indicators using a boxplot and descriptive analysis as a function of soil tillage. M (mean); Med (median); S (standard deviation); CV (coefficient of variation); Sc (skewness coefficient); Ck (coefficient of kurtosis); RJ—Ryan–Joiner normal test; p-value (>0.1); N—normal probability distribution; A—non-normal distribution of probability; WHP (whole pods (a)); BP (broken pods (b)); WP (wilted pods (c)); LG (loose grains (d)); VI (vegetal impurity (e)); MI (mineral impurity (f)); WC (water content (g)).
Agronomy 13 01024 g002aAgronomy 13 01024 g002b
Figure 3. Individual value cards for (a) whole pods; (b) broken pods; (c) wilted pods; (d) loose grains; (e) vegetal impurity; (f) mineral impurity as a function of soil tillage; and (g) water content related to pod water moisture. UCL: Upper Control Limit; LCL: Lower Control Limit;   x ¯ : arithmetic mean.
Agronomy 13 01024 g003aAgronomy 13 01024 g003b
Figure 4. Ishikawa diagram for the quality of the peanut mechanized harvest pods.
Agronomy 13 01024 g004
Table 1. Operations performed according to the soil tillage.
Conventional TillageRotary TillersRotary Hoe
Ratoon EliminationRatoon EliminationRatoon Elimination
SubsoilingSubsoilingSubsoiling
Heavy HarrowingHeavy HarrowingHeavy Harrowing
Intermediate HarrowingIntermediate HarrowingIntermediate Harrowing
Light HarrowingLight HarrowingLight Harrowing
Rotary TillersRotary Hoe
Table 2. Characterization of the settings used for the construction of the beds according to the equipment.
Equipment 1Working Width (m)PTO Rotation 2 (rpm)Number of Knives per FlangeType of Knife
Rotary Tillers1.505404Universal (“L”)
Rotary Hoe1.50122 35Universal (“L”)
1 Used gear: 3rd gear in the range A; 2 PTO: power take-off; 3 rotation in the gearbox with the combination of gears 20 (left) and 15 (right), resulting in 122 rpm rotation in the rotor.
Table 3. Characterization of the material collected in the granary tank of the peanut picker.
ImageIndicatorDescription
Agronomy 13 01024 i001Whole podsPods without breaks and cracks.
Agronomy 13 01024 i002Broken podsBroken, fragmented, or cracked pods.
Agronomy 13 01024 i003Wilted podsPods formed, but which do not have mature grains or pods formed with smaller size and without grains.
Agronomy 13 01024 i004Loose grainsLoose or broken grains.
Agronomy 13 01024 i005Vegetal impurityBranches, leaves, peduncles, and accent residues.
Agronomy 13 01024 i006Mineral impuritySoil present in the sample in the form of earth and clods.
Table 4. Non-random pattern analysis with sequence plots for the qualitative loss indicators in different preparations.
Quality IndicatorSoil TillageParameters
1CMTO
WHPConventional Tillage0.344 ns0.656 ns0.926 ns0.074 ns
Rotary Tillers0.045 *0.955 ns0.966 ns0.034 *
Rotary Hoe0.229 ns0.771 ns0.724 ns0.276 ns
BPConventional Tillage0.023 *0.977 ns 0.315 ns0.685 ns
Rotary Tillers0.830 ns0.170 ns0.997 ns0.003 *
Rotary Hoe0.771 ns0.229 ns0.932 ns0.068 ns
WPConventional Tillage0.115 ns0.885 ns0.973 ns0.027 *
Rotary Tillers0.427 ns0.573 ns0.325 ns0.675 ns
Rotary Hoe0.069 ns0.931 ns0.383 ns0.617 ns
LGConventional Tillage0.344 ns0.656 ns0.926 ns0.074 ns
Rotary Tillers0.094 ns0.906 ns0.181 ns0.819 ns
Rotary Hoe0.001 *0.999 ns0.019*0.981 ns
VIConventional Tillage0.055 ns0.945 ns0.027*0.973 ns
Rotary Tillers0.830 ns0.170 ns0.966 ns0.034 *
Rotary Hoe0.355 ns0.645 ns0.932 ns0.068 ns
MIConventional Tillage0.656 ns0.344 ns0.685 ns0.315 ns
Rotary Tillers0.045 *0.955 ns0.675 ns0.325 ns
Rotary Hoe0.013 *0.987 ns0.117 ns0.883 ns
WTConventional Tillage0.212 ns0.788 ns0.315 ns0.685 ns
Rotary Tillers10.094 ns0.906 ns0.181 ns0.819 ns
Rotary Hoe0.069 ns0.931 ns0.001 *0.999 ns
1C—clustering; M—mixtures; T—trends; O—oscillation; * normal non-randomness values detected by the probability test at p < 0.05; ns randomness values detected by the probability test at p > 0.05.
Disclaimer/Publisher’s Note: The statements, opinions and data contained in all publications are solely those of the individual author(s) and contributor(s) and not of MDPI and/or the editor(s). MDPI and/or the editor(s) disclaim responsibility for any injury to people or property resulting from any ideas, methods, instructions or products referred to in the content.