Article

The Controlling Factors of Soil Selenium Content in a Selenium-Deficient Area in Southwest China

1
College of Resources and Environment, Southwest University, Beibei, Chongqing 400715, China
2
College of Computer and Information Science, Southwest University, Beibei, Chongqing 400715, China
*
Author to whom correspondence should be addressed.
Agronomy 2023, 13(4), 1031; https://doi.org/10.3390/agronomy13041031
Submission received: 8 February 2023 / Revised: 24 March 2023 / Accepted: 27 March 2023 / Published: 30 March 2023
(This article belongs to the Section Soil and Plant Nutrition)

Abstract

:
Selenium (Se) is a beneficial microelement for humans, and its varying abundances and shortages have attracted widespread concern. The accumulation process of soil Se is quite complicated, being controlled by multiple factors. However, the influence mechanism of soil properties, climate, and topographic conditions on Se distribution is still unclear in Se-deficient areas. For this study, we collected 2804 samples from cropland soil to assess the levels of Se and the factors that influence those levels in Se-deficient areas of southwestern China. The Se content in this area (0.17 mg/kg) was less than the mean value of China as a whole (0.29 mg/kg). Moran’s I index and a random forest (RF) model showed that higher Se levels were mostly observed in the southern and northern sections of the area we studied. The RF model had excellent performance in predicting soil Se content, with an accuracy of 64%. The use of Shapley additive explanations indicated that soil organic matter (SOM) and mean annual precipitation (MAP) were the critical factors determining Se distribution. The areas with high SOM and MAP showed high Se levels. The information obtained from this work can provide guidance for agricultural planning in Se-deficient areas.

1. Introduction

Selenium (Se) is not only a microelement, but also a vital nutrient for humans [1]. As the central component of both Se-enzyme and Se-protein, Se is key to promoting the gene expression of organisms [2]. There is little difference between Se-deficient and Se-toxic values [1,3]. Numerous studies have indicated that an appropriate Se level has many beneficial biological functions in the human body, including immune system regulation, cancer prevention, and antioxidation [2,4]. However, insufficient Se intake may cause Keshan disease [5], and too much Se entering the body can lead to an additional series of adverse reactions (i.e., hair loss and skin damage) [6]. The Se that is needed by the human body mostly comes from soil, absorbed via the food chain [7]. Due to the differences between geographical environments, Se is unevenly distributed in soil (covering a range of 0.01–2 mg/kg) [8]. Studies have shown that about 15% of the population in the world is at risk of Se deficiency [9]. In this regard, China is a typical Se-poor country, with a mean Se content of 0.29 mg/kg [1]. As a consequence, understanding the levels and driving factors of Se, especially in low-Se areas, is the key to the effective regulation of soil Se levels, with which we might better promote Se absorption in humans.
The accumulation process of soil Se is quite complicated, being controlled by multiple environmental factors (e.g., soil properties, climate, and topography) [10,11]. Previous studies have shown that both soil parent material and precipitation are the main sources of soil Se in Se-rich areas [10,11,12]. Regarding parent material, being the material basis for soil development, its mineral composition directly determines the initial level of soil nutrients [13]. Song et al. [14] explored the reasons for soil Se enrichment in the agroecosystems of China, and found that the contribution of parent material on Se levels was significantly greater than that of human activities (e.g., fertilization and irrigation). Furthermore, Nascimento et al. [15] suggested that precipitation and rock type are the most critical variables determining the level of Se on a regional scale. Climatic conditions (i.e., temperature, precipitation) determine the formation and development of soils on a large scale and greatly change the soil Se level [16]. Some research has indicated that an atmospheric deposition caused by precipitation is an important component for supplementing Se levels in terrestrial ecosystems [16,17]. Meanwhile, precipitation can affect the biochemical cycle of Se by controlling soil properties (e.g., SOM and soil pH) [18]. Wang et al. [19] and Liu et al. [20] both found that, in Se-lack regions, SOM and precipitation were tightly associated with Se levels, while the contribution of parent material to the overall soil Se was relatively small. Therefore, it is necessary to further clarify the influencing mechanisms of potential factors on Se distribution in different regions.
SOM and pH are important properties of soil [21], and they are regarded as key factors in the regulation of Se levels [22]. Se content usually increases along with SOM [18,20]. Studies have reported that most of the Se exist in the form of organic matter or organic minerals [23,24]. SOM controls the mobility of Se by forming OM bonds, thus reducing the intake of Se by plants [25]. In addition, acidic soil and potential anoxic zones can promote the conversion of the soluble Se (IV, VI) into the insoluble Se (0, −II) [26], which prevents the loss of Se through leaching. Likewise, topography affects hydrothermal conditions [22]. Se levels are low in areas with steep terrain and serious soil erosion [19]. Land use is related to SOM, and thus also determines Se content [27]. The relationship between environmental factors and soil Se is quite complex, being both linear and nonlinear. However, the majority of studies have only explored the relationship between them from a linear perspective [18,22], and hence, it is difficult to fully reveal the influence of these factors on Se content.
Complex network theory describes the topological relationship in a network based on graph theory and statistical principles [28]. Its primary function is to visualize the structural characteristics of the whole network, which is independent of the position of nodes and edges [29]. The application of the Complex network theory in explaining interactions between soil properties and external environmental factors is relatively rare, mainly focusing on a few macronutrient elements (e.g., C, N, and P) and heavy metals (e.g., Cr, Pb, and Zn) [30,31,32]. For instance, Zhang et al. [32] investigated the effects of 50 environmental factors on soil organic carbon (SOC) storage in a mining area by constructing a complex network graph; ultimately, they found that soil moisture content and bulk density were closely related to SOC storage. Dai et al. [31] applied the complex network theory to visualize the correlation between heavy metals and soil properties in different soil layers, and argued that the high correlation coefficients among heavy metals (e.g., Cu, Pb, Zn, and Cr) in topsoil might be due to the fact that these metals come from the same source. Random forest (RF) is an advanced machine learning approach [33]. Compared with classical statistical methods [34,35], RF shows an outstanding performance in explaining the nonlinear relationship between variables [36]. As such, it has often been used to predict soil properties [36,37]. Zeraatpisheh et al. [36] employed the RF model to link environmental covariates with soil properties to effectively predict SOC content in the semi-arid zone of Iran. Zhang et al. [37] explained the effect of variables on the level of available nutrients in paddy soil using the RF model [37]. However, the weak interpretability caused by the associated “black-box” mechanism greatly limits the application of the RF model. Shapley additive explanations (SHAP) are an emerging approach for interpreting machine learning model outputs [38]. Unlike previous contribution factor methods (i.e., gini, permutation) [39], SHAP not only indicates the effect of factors on the model, but also determines the influence direction (positive or negative) of factors on the model results [40]. Zhou et al. [39] employed SHAP to analyze the importance of each variable in soil texture prediction. Yang et al. [40] determined the effect of factors on soil heavy metal adsorption by calculating SHAP values. However, thus far, studies on the application of SHAP in visualizing the influence of environmental factors on Se remain limited.
Although many scholars have explored the distribution and potential sources of soil Se, they are mainly concentrated in Se-rich areas rather than in Se-lacking areas. Furthermore, the attempt to explore the relationship between Se and soil properties, and topographic and climatic conditions from a nonlinear perspective is still insufficient. Kaizhou is located in a low-Se belt in southwest China [1], which is a major agricultural region. Thus, this study applied the complex network graph, Moran’s Index, RF, and SHAP methods to reveal the content characteristics of Se and its relationship with environmental factors in Kaizhou. The special aims were to (1) explore the content and spatial distribution of soil Se; (2) visualize the influence of environmental factors on Se; and (3) identify the key factors controlling Se content. On the basis of the above literature, we suspect that Kaizhou, as a Se-lacking area, has controlling factors of soil Se that may differ from those in Se-rich areas.

2. Materials and Methods

2.1. Study Area

Kaizhou (30°00′–31°20′ N, 107°55′–108°37′ E), located in the Three Gorges reservoir area, is a major agricultural region of China (Figure 1). It is a mountainous area with an elevation of 118 m to 1275 m. The climate belongs to subtropical monsoon climate, with MAP and MAT values of 1244 mm and 17 °C, respectively. Paddy fields and dry land are the main land uses in the area. The predominant soil parent materials include Xujiahe Formation of Triassic (T3xj), Suining Formation of Jurassic (J1sn), Ziliujing Formation of Jurassic (J3zl), and Shaximiao Formation of Jurassic (J2s), all of which are developed in purple sandstone and shale with low Se content [41].

2.2. Sample Collection and Processing

In November 2016, 2804 soil samples (0–20 cm) were obtained from cropland in Kaizhou (Figure 1). Within 10 m of the sampling location, about 3 to 5 subsamples were obtained to form a mixed soil sample. At the same time, the global positioning system (GPSmap 669 s, GarMin) was applied to record the location information (e.g., longitude and latitude) of each site.
All samples were air-dried in the laboratory and passed through a screen (2 mm). The soil pH value was measured using a pH meter (HT-P15) [42], and the SOM content was measured via the oxidation method using potassium dichromate [43]. The soil total Se was extracted using mixed acid (HNO3 and HClO4) at 180 °C and analyzed by hydride generation atomic fluorescence spectrometry (SK-2003A) [27].

2.3. Data Acquisition

According to the soil formation factors model proposed by Jenny [44], two types of environmental factors were selected (Table 1), namely, (1) categorical factors (e.g., land use and soil parent material) and (2) numerical factors (e.g., soil properties and climatic and topographic factors). Among them, data on land use types were obtained from land use maps (1:10,000) [45] (Figure S1), whereas data on soil parent material were collected from geological maps (1:250,000) (Figure 1). Data on climate factors, including MAT (Figure S1) and MAP (Figure 1), spanning 30 years (1970–2000), were collected from the WorldClim dataset with a spatial resolution of 1 km. The topographic parameters (i.e., elevation, slope, VD, aspect, and TWI) were calculated by SAGA GIS 8.0.0 (Figure S1) based on the digital elevation model (30 × 30 m). Soil property data include soil pH and SOM content, which were measured in the laboratory. Soil texture information (e.g., clay, silt, and sand) were obtained from the “soil particle size distribution in China” dataset [46].

2.3.1. Descriptive Statistics

The basic data analysis of soil Se was implemented in SPSS 25.0. The homogeneity of variance and normality of data were checked before further analysis. The differences in Se levels among the parent materials were evaluated using ANOVA. An independent samples t-test was employed to examine the significant effect of land use on Se content. Two-way ANOVA was performed to reveal the interaction effect of environmental factors on soil Se.

2.3.2. Spatial Autocorrelation Analysis

Moran’s I index is a common method for spatial autocorrelation analysis, consisting of global and local Moran’s I index [47]. Global Moran’s I measures the overall degree of association in the study area, and its value ranges from −1 to 1 [48]. An index approaching 0 suggests that the position of samples is random, an index of <0 indicates a negative spatial autocorrelation among the samples, and an index of >0 suggests a positive autocorrelation among the samples [48]. Meanwhile, the local Moran’s I reflects the distribution of spatial clusters and outliers [49] and can be expressed as follows [50]:
I i = M i M ¯ Q 2 j = 1 , j i n W i j M j M ¯
where Mi represents the value of soil Se at position i, M ¯ denotes the average value of M, Mj represents the Se content at other positions (j ≠ i), and the Wij is a weight measured by a distance band.

2.3.3. Complex Network Theory

Complex network theory was employed to visualize the relationship among the factors. First, SPSS 25.0 was used to obtain the Pearson correlation coefficients, and factor pairs with a correlation coefficient of more than 0.1 (p < 0.01) were selected to build a complex topology network graph in Gephi v0.9.7. A total of 14 nodes comprising environment factors and soil Se were obtained, and these nodes were connected based on their correlation. The nodes and lines have no practical spatial significance. In the complex topology network graph, the width and color of the edges represent the degree and direction of correlation among variables, respectively.

2.3.4. Random Forest

The RF model was used to draw the spatial distribution map of soil Se in Kaizhou. RF is a tree model that relies on a decision tree to obtain the prediction results [33]. Compared with other machine learning models, RF can reduce noise interference and prevent overfitting [36]. It was performed by the package named “scikit-learn” in Python v3.8. During the modeling process, two main parameters were considered, namely, the number of decision trees and the number of variables used to grow each tree [37,51], which were set to 500 and 3, respectively. All samples were randomly divided into training set (80%) and verification set (20%). The coefficient of determination (R2), mean absolute error (MAE), and root mean square error (RMSE) were used to assess the RF model performance [52].
M A E = 1 n j = 1 n M j N j
R M S E = 1 n j = 1 n M j N j 2
R 2 = 1 j = 1 n ( M j N ) 2 j = 1 n ( M j M ) 2
where Mj represents the observed values, Nj denotes the predicted values of the jth sample, M suggests the mean of observed variables, and n denotes the number of samples.

2.3.5. Shapley Additive Explanations

The RF model demonstrates superior performance in handling nonlinear relationships among variables. However, its “black-box” mode greatly limits its interpretability. The SHAP value is an additive attribution approach derived from coalitional game theory [53] that can show the importance of each factor for model prediction [40]. The SHAP method has three prominent features, including local accuracy, missing values, and consistency [54], which allow an effective interpretation of machine learning models. SHAP can be expressed as follows [39]:
f N = ϕ 0 + j = 1 M ϕ j N j
where N ∈ (0,1). M indicates the existence or absence of a factor. ϕ 0 is the average predicted value of the target factor. M denotes the number of factors in the model. ϕ j is the contribution of factor j (i.e., SHAP value).
In this work, the “SHAP” package in Python v3.8 was implemented to rank the importance of environmental factors affecting soil Se level.

3. Results

3.1. Data Analysis of Se and Environmental Factors

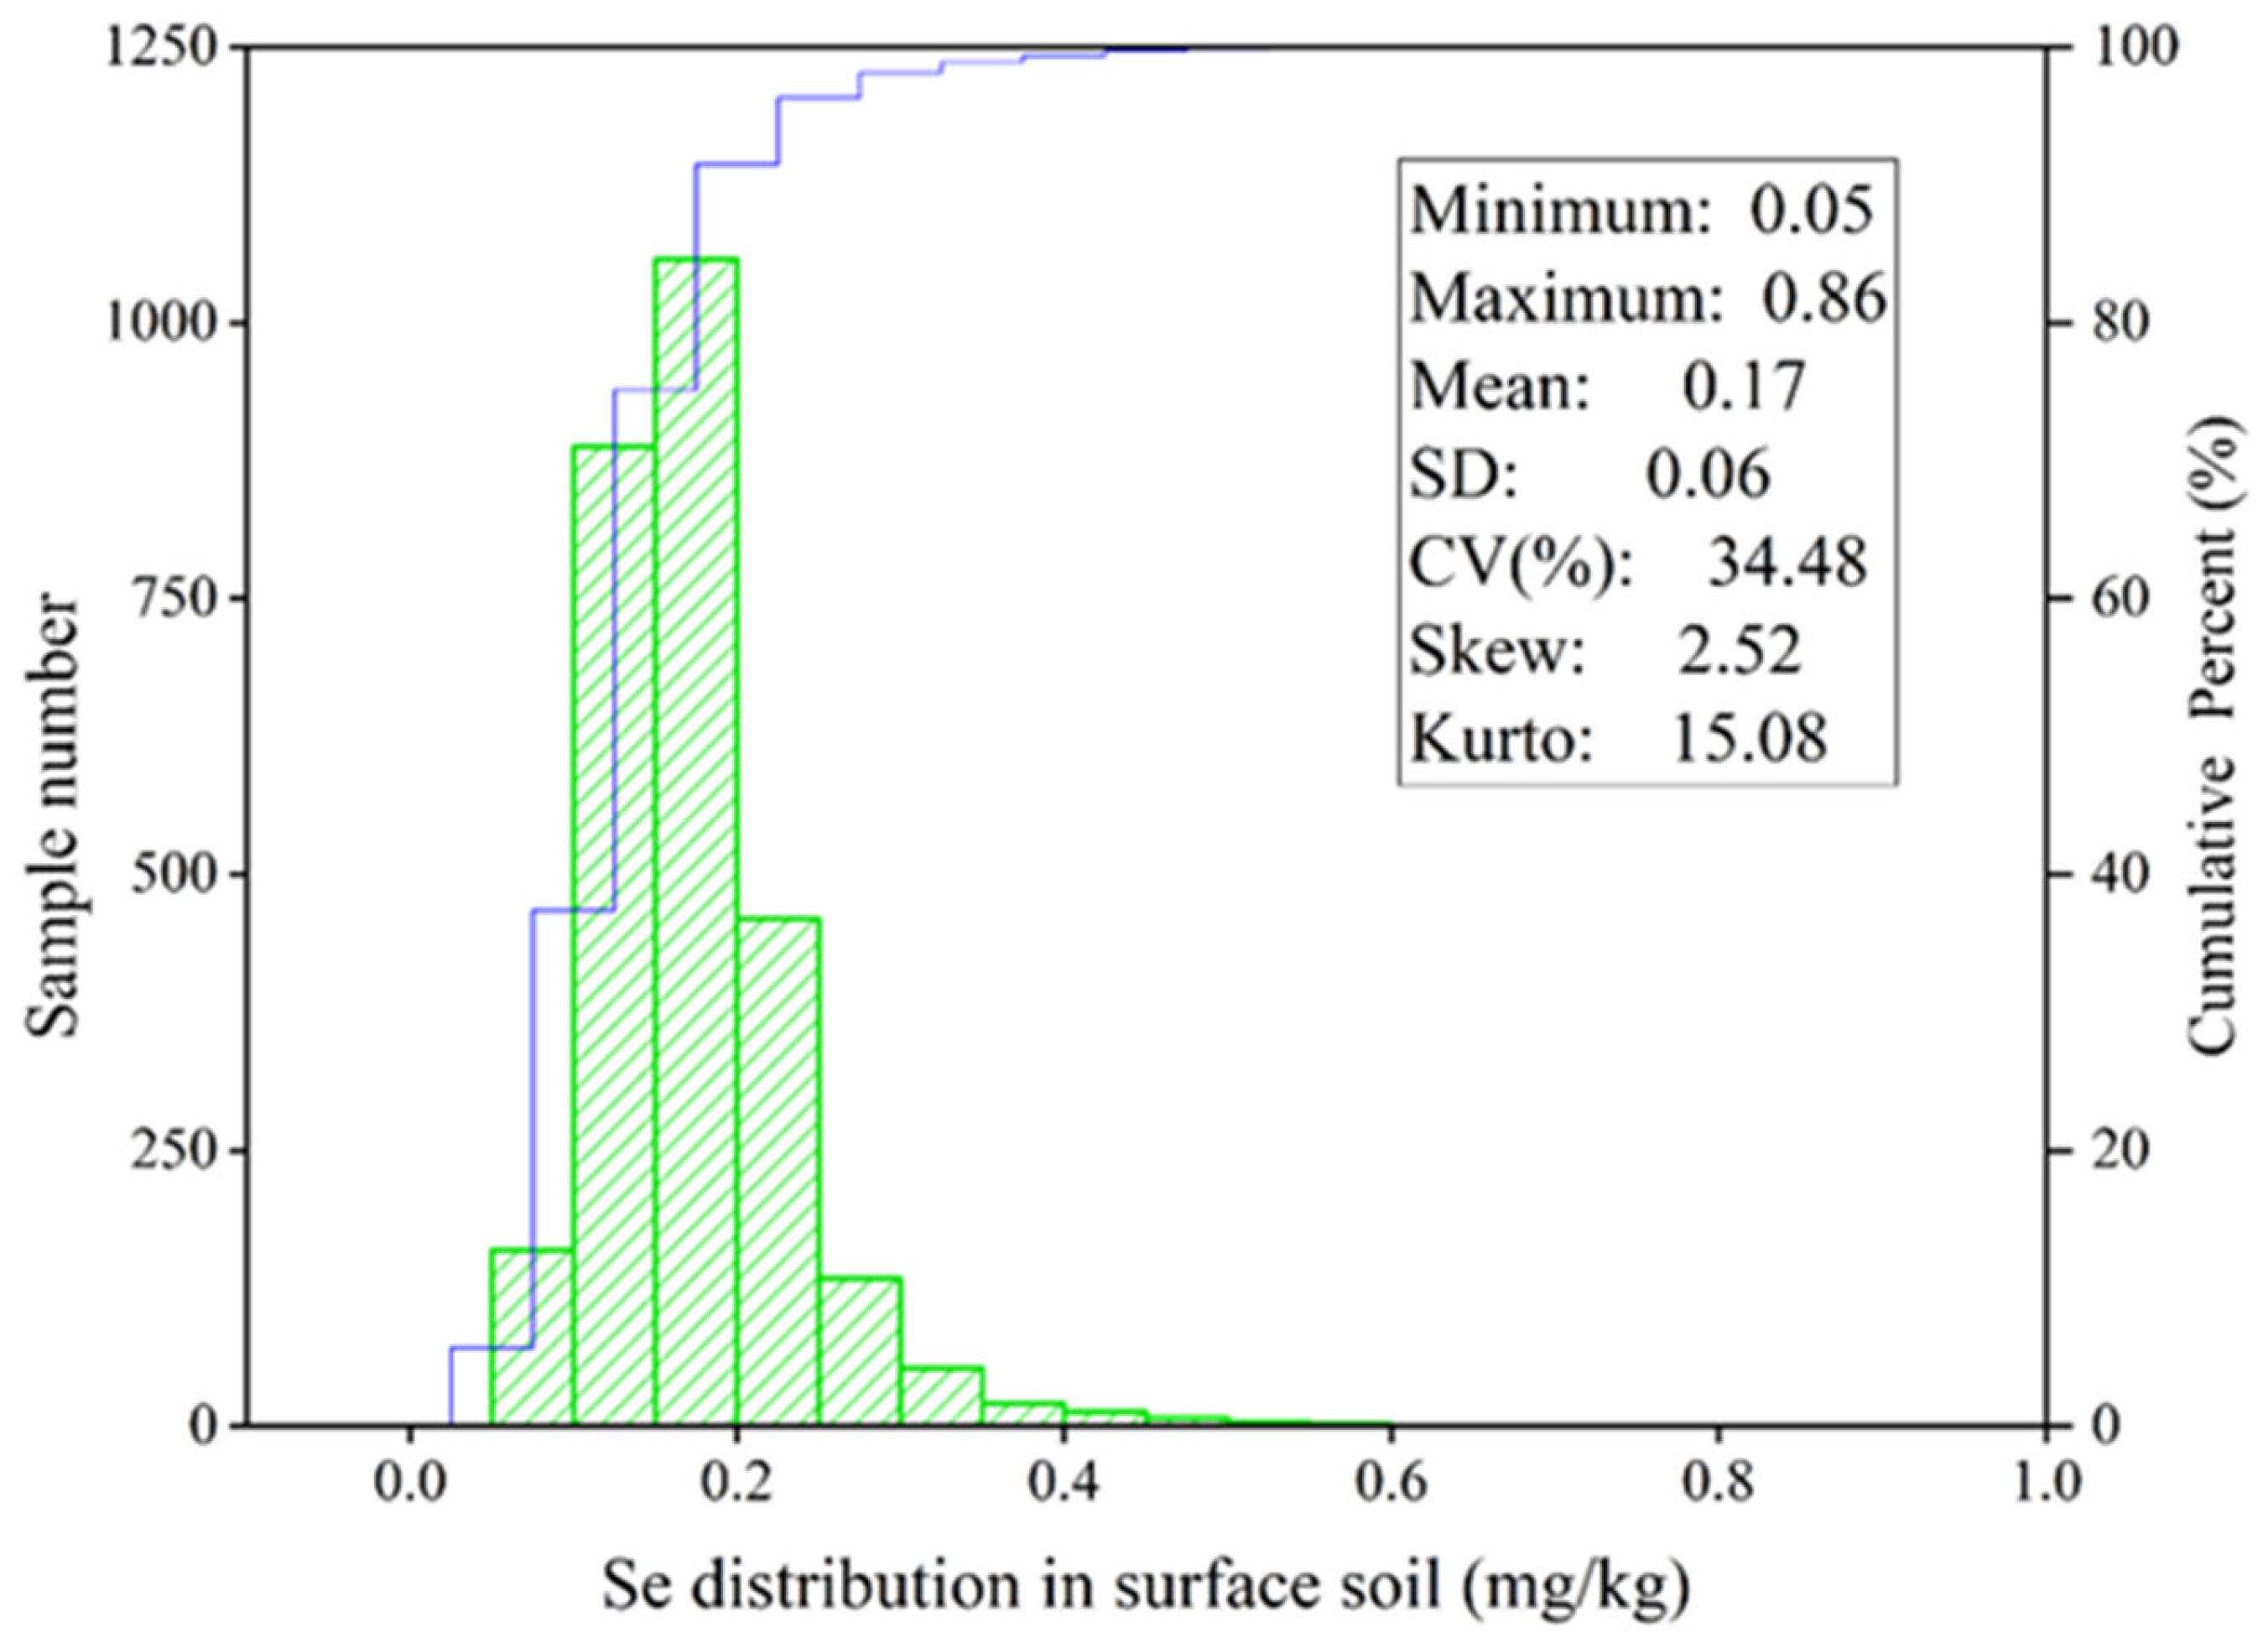
The basic statistics of soil Se and environmental factors in Kaizhou are shown in Figure 2 and Table 2, respectively. The Se content ranged from 0.05 mg/kg to 0.86 mg/kg, with the average being 0.17 mg/kg. The coefficient of variation (CV) of Se was 34.48%, indicating a moderate variation. Following the classification standard of soil total Se [41], 17.08% of the samples collected in Kaizhou were Se-deficient (<0.125 mg/kg), 42.22% were on marginal Se deficiency (0.125–0.175 mg/kg), 39.60% had a moderate Se level (0.175–0.400 mg/kg), 1.06% had abundant Se content (0.400–3.000 mg/kg), and none of the collected samples was Se-excessive (>3.000 mg/kg). All topographic factors and soil properties showed a moderate variation, and their CVs ranged between 10% and 100%. Meanwhile, the climatic factors (i.e., MAP and MAT) showed a weak variation. Figure 3 presents the complex network graph between environmental factors and soil Se. In the topology graph, obvious different correlations between environmental factors and Se can be observed (p < 0.01). Among them, SOM, MAP, elevation, aspect, TWI, and clay were positively correlated with Se content, with SOM showing the highest correlation (Figure 3 and Figure S2). Meanwhile, the other environmental factors (i.e., pH, MAT, silt, and slope) had a significant negative effect on Se content. Results of one-way ANOVA and independent samples t-test showed that parent material and land use had significant influences on Se level (Table 3 and Table 4, p < 0.01). Meanwhile, results of the two-way ANOVA indicated that SOM and parent material had strong interaction effects on soil Se content (p < 0.05), whereas SOM, pH, and elevation had no strong interaction effects (Table 5). A significant interaction effect on Se content was also observed between MAP and parent material (p < 0.05), and no strong interactions were observed between MAP, pH, and elevation (Table 5).

3.2. Spatial Distribution Characteristics of Soil Se

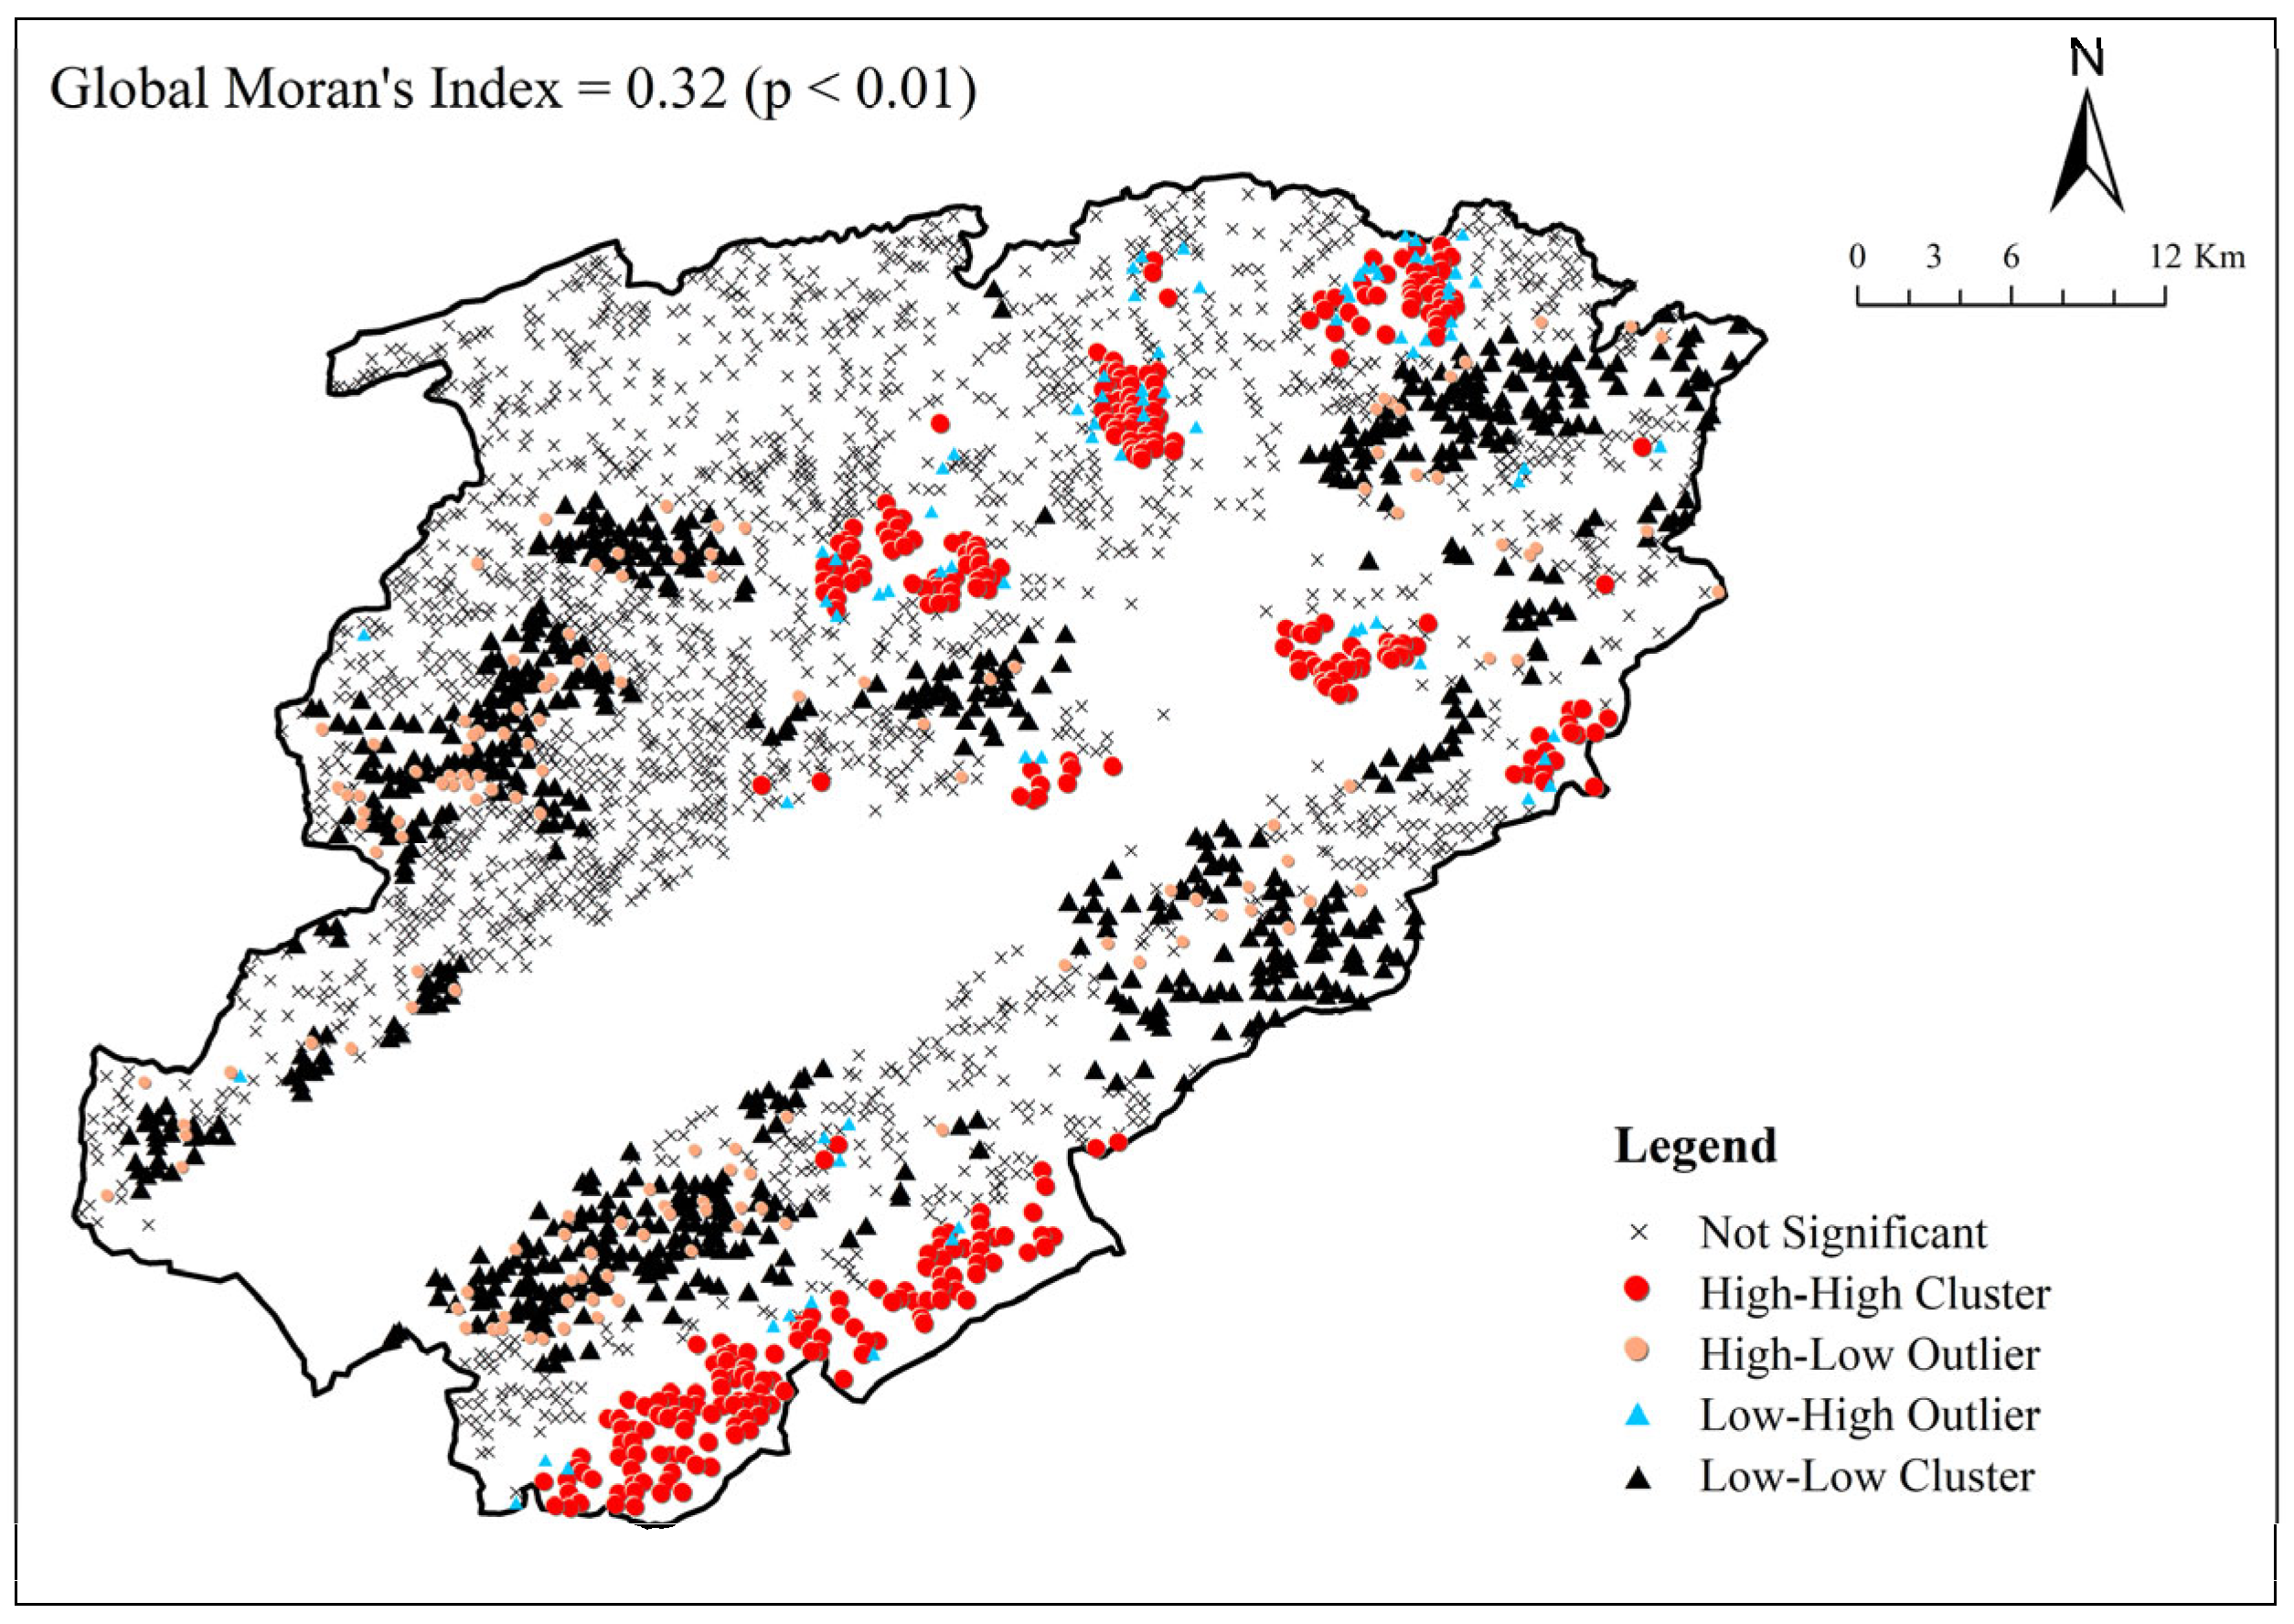
Moran’s I indicated that soil Se content had a strong positive spatial autocorrelation (Moran’s I = 0.32, p < 0.01) (Figure 4). Most of the high-high clusters of Se were observed in some local areas, such as the southern and northern parts of Kaizhou, whereas the low-low clusters were scattered all over the study area.
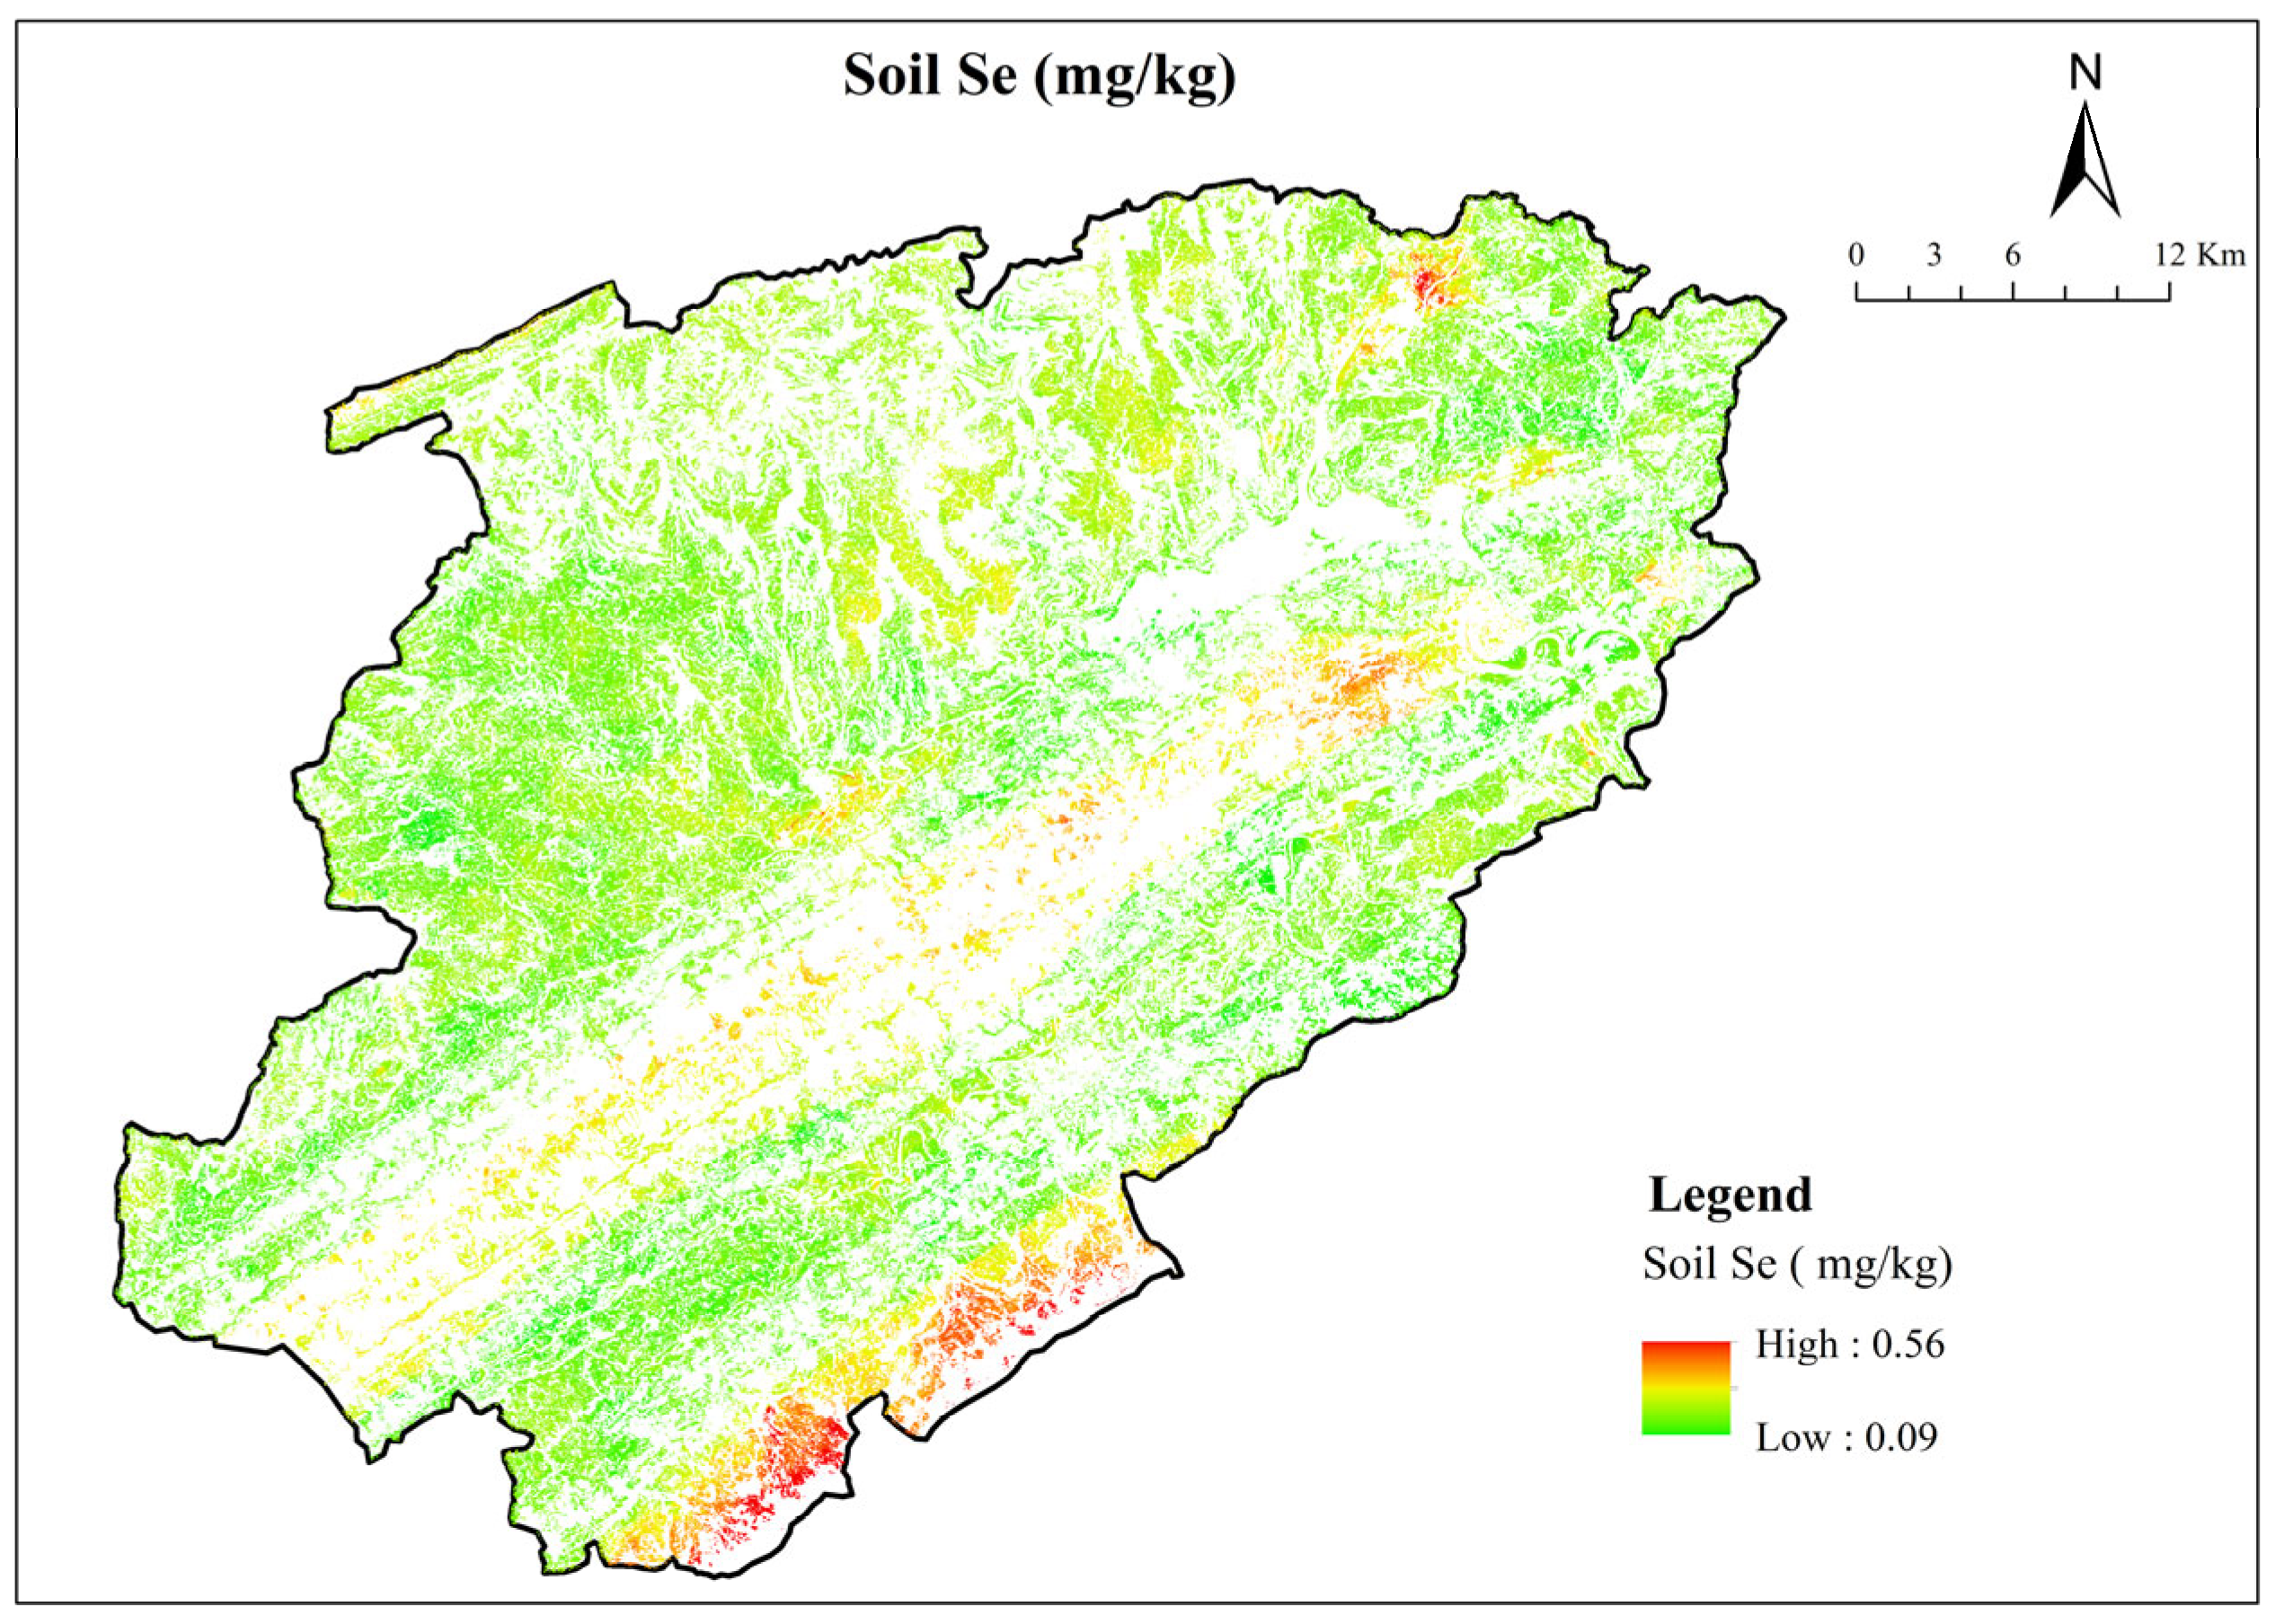
The RF model was used to further reveal the distribution pattern of soil Se. The accuracy evaluation indexes MAE, RMSE, and R2 of the RF model were 0.03, 0.04 and 0.64, respectively, thereby suggesting that 64% of the spatial variation of soil Se can be explained by the RF model. Higher Se values were mostly observed in the south and middle parts of Kaizhou (Figure 5), which was consistent with the results of Moran’s I analysis (Figure 4).

3.3. Control Factors for Soil Se Content

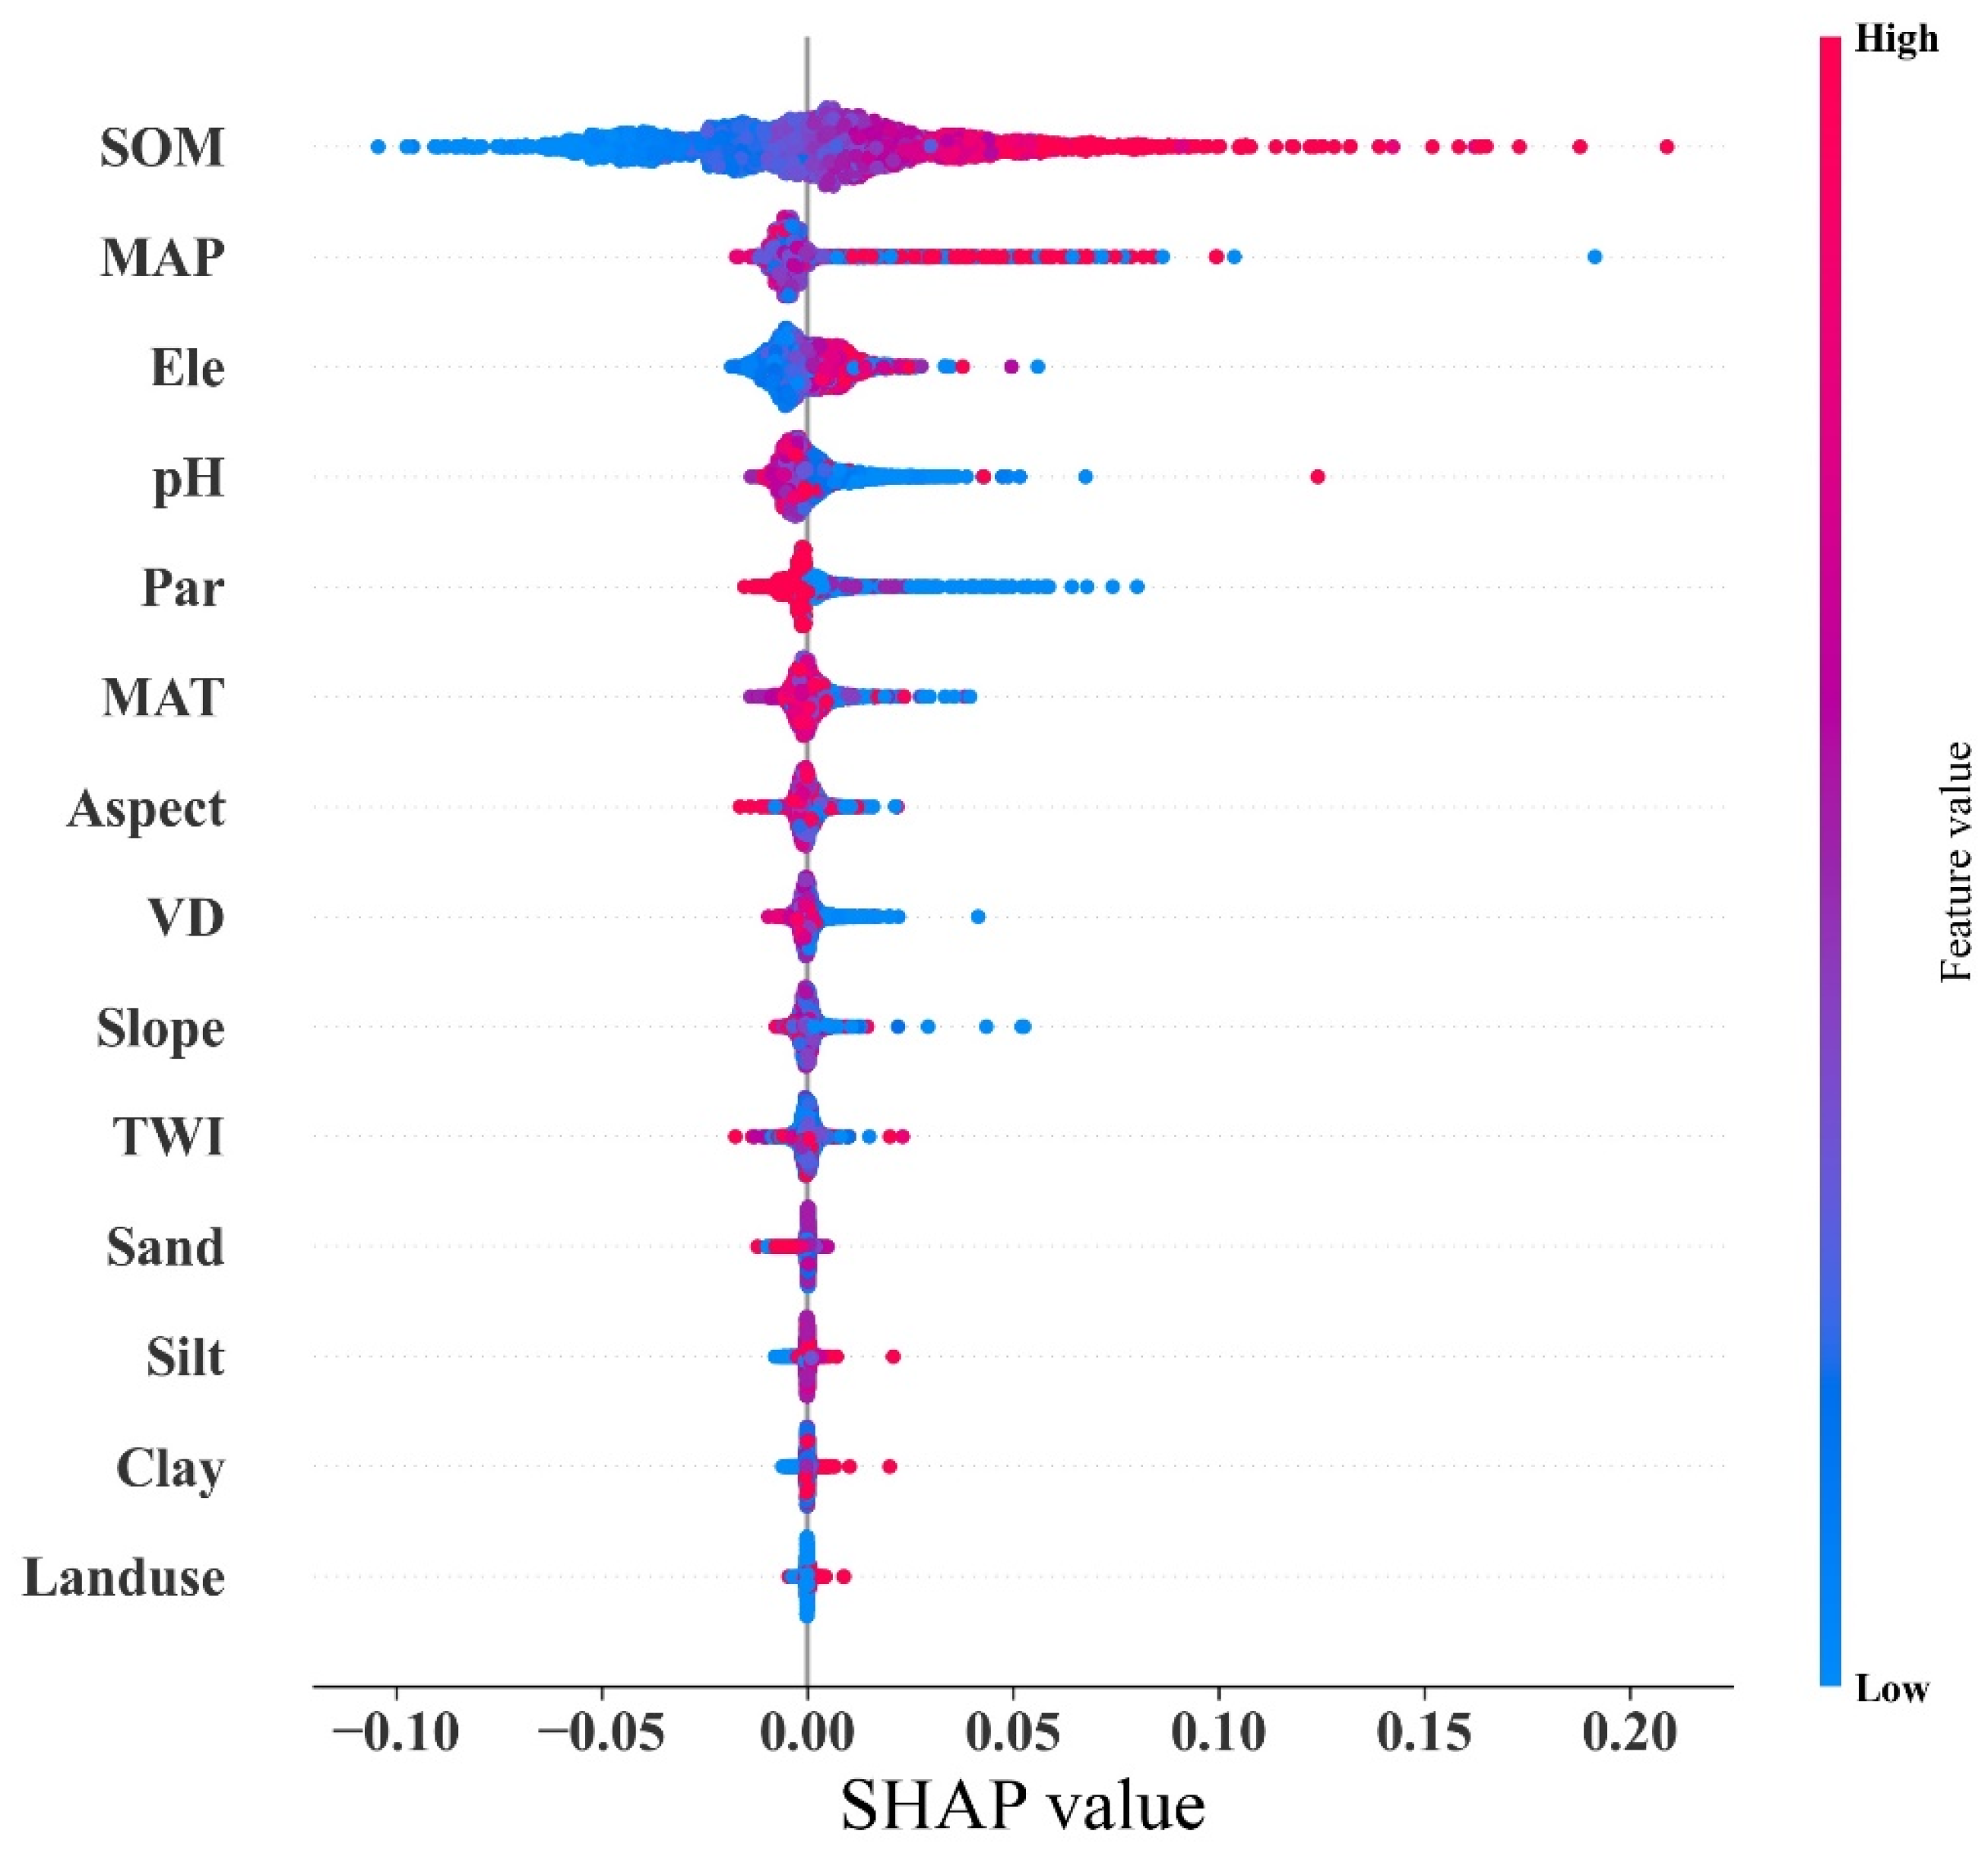
The effect of environmental factors on Se content was visualized using SHAP. In the SHAP summary plot (Figure 6), the Y-axis represents the environmental factors, and their influence on Se decreases from top to bottom. Meanwhile, the X-axis is controlled by the SHAP value of the selected factors. The color of the point reflects the high (red) and low (blue) values of environmental factors. As shown in Figure 6, SOM was ranked as the most important factor affecting soil Se content. Samples with low SOM (blue) were mostly distributed on the left side (SHAP value < 0), whereas samples with high SOM (red) were mainly distributed on the right side (SHAP value > 0), thus demonstrating a positive correlation between SOM and Se content. Meanwhile, MAP was ranked the second most important environmental factor for determining soil Se content. Samples with similar MAP values (i.e., sharing similar colors) were distributed on both the left (SHAP value < 0) and right sides (SHAP value > 0), thereby suggesting that soil Se was influenced by other factors besides MAP. The other factors were ranked as follows in terms of their effects on soil Se content: pH > elevation > parent material > MAT > valley depth. All of the factors showed negative contributions to the accumulation of Se, except for elevation (positive contribution) and parent material (categorical variable). These results supported the findings from the correlation analysis between environmental factors and soil Se (Figure 3).

4. Discussion

4.1. Se Content in Surface Soil

China is a typical Se-poor country with an average Se content that is 0.4, 0.3, 0.6 and 0.2 times lower than those of the entire world, Japan, Brazil, and Scotland [15,55,56], respectively. Located in the Three Gorges reservoir area, Kaizhou had a Se content of 0.17 mg/kg, which was close to the background value of the reservoir area (0.16 mg/kg) [20] yet less than the national average (0.29 mg/kg) [41]. The frequency distribution of soil Se showed that more than 50% of the collected samples had low Se content (<0.175 mg/kg) and that almost none of the samples had abundant Se content (>0.4 mg/kg). These results indicated that Kaizhou can be considered a Se-deficient area. The Se content in the human body is largely controlled by soil Se [25]. As a major agricultural region, people in Kaizhou may be at risk of having insufficient Se intake. Therefore, the Se level of soil in this area should be strictly regulated to protect human health.

4.2. Spatial Distribution Characteristics of Soil Se

Spatial distribution information is useful in understanding the regional soil Se level. The high-high clusters of soil Se were mainly observed in some local areas, such as the southern and northern parts of Kaizhou (Figure 4). These areas had high Se content mainly for two reasons: (1) the soil parent material in the south of Kaizhou is the Ziliujing Formation of Jurassic, which had higher Se values compared with other soil parent materials in the region [20] (Table 3); and (2) the scattered high Se value in the northern part of Kaizhou was consistent with the distribution of SOM (Figure S3). Multiple studies reported that Se can be bound to SOM and thus immobilized in the soil [10,25]. Meanwhile, low-low clusters were scattered all over the study area. It might be attributed to a combination of many environmental factors [10]. First, the biochemical cycle of Se is greatly driven by hydrological processes [1]. Kaizhou is a mountainous and hilly area with a complex topography and an elevation ranging from 113 m to 1375 m, and its parent materials mostly include purple shale and sandstone, thereby resulting in the loss of soil Se on steep slopes [19]. Second, atmospheric deposition is a key factor controlling Se content. Kaizhou is located in the southwest inland area of China, and its Se content is rarely supplemented by the wet deposition of Se from the East Asian summer monsoon [17]. At the same time, this region is not affected by dry deposition caused by the Asian winter monsoon from the Asian desert [1].

4.3. Driving Factors of Se Content

4.3.1. Effect of SOM on Soil Se Content

The average SOM content of Kaizhou is 16.44 g/kg, which is considered marginal [57]. The SHAP summary plot revealed that SOM was the most important factor that determines the Se content of Kaizhou (Figure 6). In addition, Figure 1 and Figure 5 showed similar distribution patterns of Se and SOM. Those areas with high SOM content were often accompanied by high Se content, while low Se level was mainly distributed in those areas with low SOM. This result also confirms the close relationship between SOM and Se.
The influence of SOM on soil Se has been explored by many scholars, and they held that there was a strongly positive relationship between SOM and Se level [13,20]. SOM can promote soil Se accumulation through two mechanisms. The first is a direct effect, which immobilizes Se in the soil via organic-inorganic associations. When the soil is in a Se-deficiency state, the immobilization effect of SOM on soil Se becomes more obvious [25]. For example, Supriatin et al. [24] found that in agricultural land with low Se levels in the Netherlands, most Se exists in organic forms, whereas inorganic forms only accounted for about 5%. Second, SOM can indirectly influence soil Se level in combination with other environmental factors [1]. Table 5 presented that SOM and parent material have a significant interaction effect on soil Se content (p < 0.05). Furthermore, SOM and soil Se also showed similar distribution trends under different parent materials (Figure 1 and Figure 5), and they all obtained the highest values in J3zl, thereby suggesting that SOM and parent material may jointly affect the soil Se content. Parent material is the main source of soil Se [11] that can directly determine Se content. In addition, parent material can indirectly control the Se biochemical cycle by regulating SOM reserves [1]. However, numerous studies showed that low-Se parent material (purple shale and sandstone) only has little effect on soil Se level compared with other environmental factors (e.g., SOM and MAP) [19,20]. Therefore, although both SOM and parent material could affect the soil Se level in Kaizhou, SOM was the dominant factor rather than the soil parent material.

4.3.2. Effect of MAP on Se Content

Besides SOM, MAP was another key factor regulating the level of soil Se (Figure 6), consistent with previous research [17,58]. Those areas with high MAP usually had higher Se content than those with low MAP (Figure 1 and Figure 5). Atmospheric deposition caused by precipitation was identified as the main way of soil Se accumulation [59]. Most of the soluble Se in the ocean volatilizes into gaseous selenides, which then migrate to terrestrial ecosystems through precipitation [60]. Sun et al. [17] calculated the Se deposition based on the Se level in rainwater and found that when the precipitation was 2000 mm/year, the input of Se to soil reached as high as 0.2–0.4 mg/m2/year. Furthermore, MAP affects the biochemical cycle of Se by controlling soil properties (e.g., SOM and soil pH). Liu et al. [20] and Xu et al. [22] reported that MAP has a negative contribution to soil pH. Soil pH can change the valence state of Se and thus determine its mobility [18]. The study area had acidic soil with an average pH of 6.05 (Table 2). Under acidic conditions, soil Se exists as insoluble Se (0, −II) instead of soluble Se (IV, VI) [26]. Therefore, MAP may reduce the loss of Se from the soil by affecting soil acidity.
Parent material and MAP had significant interaction effects on Se content (Table 5). Similar to atmospheric deposition, parent material was a major source of Se [14]. In some cases, the contribution of the parent material to Se was greater than that of precipitation [11,14], which contradicted the findings of this work (Figure 6). It is probably due to the environmental background of the study area. Specifically, the parent material of Kaizhou is mostly purple shale and sandstone, which are classified as low-Se parent materials [20]. Many studies also identified MAP and SOM, instead of soil parent material, as the main factors that control the Se level in low-Se soil [16,17].

4.3.3. Land Use with Little Influence on Soil Se

In this work, land use only had minimal influence on soil Se level, while the opposite findings were reported in previous works [18,27]. Pang et al. [18] examined the distribution of Se in agroecosystems and found that the Se levels of paddy fields and dry land were obviously different, mainly due to SOM and soil pH. Xiao et al. [27] found that land use had a strong effect on total Se content and that the Se content in forest soil was generally higher than that in grassland and agricultural soil. Land use patterns usually change soil properties [18,61], especially SOM content. Therefore, in this research, land use might affect Se content through SOM, which was consistent with the result where SOM ranked first in the SHAP summary plot while land use ranked last (Figure 6). In agricultural practice, the SOM level can be improved by changing land use types to accelerate the accumulation of Se, especially in Se-lacking areas.

5. Conclusions

This study explored the content and driving factors of Se in the cropland soil of southwestern China. The Se level in Kaizhou was less than the national average, and this area can thus be regarded as a Se-deficient area. Meanwhile, the spatial distribution of soil Se in the area was uneven, and higher Se values were mostly observed in its southern and northern parts.
The RF and SHAP results verified the hypothesis that the potential controlling factors of soil Se content differed between Se-rich and Se-lacking (i.e., Kaizhou) areas. SOM and MAP were closely associated with Se accumulation in Kaizhou. Those areas with high SOM and MAP were usually accompanied by a high Se level. Furthermore, land use may regulate Se level through SOM, although land use had little influence on Se indicated by the SHAP summary plot. Therefore, in future agricultural practice, the contribution of various factors to soil Se, especially SOM, MAP, and land use, should be considered.

Supplementary Materials

The following supporting information can be downloaded at https://www.mdpi.com/article/10.3390/agronomy13041031/s1. Figure S1: Maps of environmental factors in Kaizhou; Figure S2: The correlation analysis plot between Se and environmental factors; Figure S3: The scatter plot between soil Se and SOM.

Author Contributions

Conceptualization, H.-S.W., W.W. and H.-B.L.; methodology, H.-S.W. and W.-C.Z.; software, W.-C.Z.; resources, H.-B.L.; data curation, H.-B.L.; writing—original draft, H.-S.W.; writing—review and editing, W.W. All authors have read and agreed to the published version of the manuscript.

Funding

This research received no external funding.

Data Availability Statement

Data are contained within the article.

Acknowledgments

We thank the local farmers for their help during the sample collection.

Conflicts of Interest

The authors declare no conflict of interest.

References

  1. Dinh, Q.T.; Cui, Z.; Huang, J.; Tran, T.A.T.; Wang, D.; Yang, W. Selenium Distribution in the Chinese Environment and Its Relationship with Human Health: A Review. Environ. Int. 2018, 112, 294–309. [Google Scholar] [CrossRef] [PubMed]
  2. Roman, M.; Jitaru, P.; Barbante, C. Selenium Biochemistry and Its Role for Human Health. Metallomics 2014, 6, 25–54. [Google Scholar] [CrossRef] [PubMed]
  3. Kieliszek, M.; Błazejak, S. Current Knowledge on the Importance of Selenium in Food for Living Organisms: A Review. Molecules 2016, 21, 609. [Google Scholar] [CrossRef] [PubMed] [Green Version]
  4. Hawkes, W.C.; Turek, P.J. Effects of Dietary Selenium on Sperm Motility in Healthy Men. J. Androl. 2001, 22, 764–772. [Google Scholar]
  5. Selinus, O.; Alloway, B.; Centeno, J.A.; Finkelman, R.B.; Fuge, R. Essentials of Medical Geology: Revised Edition; Springer: Berlin/Heidelberg, Germany, 2013; ISBN 9789400743755. [Google Scholar]
  6. Bajaj, M.; Eiche, E.; Neumann, T.; Winter, J.; Gallert, C. Hazardous Concentrations of Selenium in Soil and Groundwater in North-West India. J. Hazard. Mater. 2011, 189, 640–646. [Google Scholar] [CrossRef]
  7. Hartikainen, H. Biogeochemistry of Selenium and Its Impact on Food Chain Quality and Human Health. J. Trace Elem. Med. Biol. 2005, 18, 309–318. [Google Scholar] [CrossRef]
  8. Sharma, V.K.; McDonald, T.J.; Sohn, M.; Anquandah, G.A.K.; Pettine, M.; Zboril, R. Biogeochemistry of Selenium. A Review. Environ. Chem. Lett. 2015, 13, 49–58. [Google Scholar] [CrossRef]
  9. Haug, A.; Graham, R.D.; Christophersen, O.A.; Lyons, G.H. How to Use the World’s Scarce Selenium Resources Efficiently to Increase the Selenium Concentration in Food. Microb. Ecol. Health Dis. 2007, 19, 209–228. [Google Scholar]
  10. Gong, J.; Yang, J.; Wu, H.; Gao, J.; Tang, S.; Ma, S. Spatial Distribution and Environmental Impact Factors of Soil Selenium in Hainan Island, China. Sci. Total Environ. 2022, 811, 151329. [Google Scholar] [CrossRef]
  11. Li, M.; Yang, B.; Xu, K.; Zheng, D.; Tian, J. Distribution of Se in the Rocks, Soil, Water and Crops in Enshi County, China. Appl. Geochem. 2020, 122, 104707. [Google Scholar] [CrossRef]
  12. Gong, J.; Gao, J.; Fu, Y.; Tang, S.; Cai, Y.; Yang, J.; Wu, H.; Ma, S. Vertical Distribution and Major Influencing Factors of Soil Selenium in Tropical Climate: A Case Study of Chengmai County, Hainan Island. Chemosphere 2023, 312, 137207. [Google Scholar] [CrossRef] [PubMed]
  13. Lei, W.; Cicchella, D.; Liu, T.; Yang, S.; Zhou, Y.; Hu, B. Origin, Distribution and Enrichment of Selenium in Oasis Farmland of Aksu, Xinjiang, China. J. Geochem. Explor. 2021, 223, 106723. [Google Scholar] [CrossRef]
  14. Song, T.; Cui, G.; Su, X.; He, J.; Tong, S.; Liu, Y. The Origin of Soil Selenium in a Typical Agricultural Area in Hamatong River Basin, Sanjiang Plain, China. Catena 2020, 185, 104355. [Google Scholar] [CrossRef]
  15. Nascimento, C.W.A.D.; Bruno Viera da Silva, F.; de Brito Fabricio Neta, A.; Miranda Biondi, C.; Aparecida da Silva Lins, S.; Bezerra de Almeida Júnior, A.; Preston, W. Geopedology-Climate Interactions Govern the Spatial Distribution of Selenium in Soils: A Case Study in Northeastern Brazil. Geoderma 2021, 399, 115119. [Google Scholar] [CrossRef]
  16. Blazina, T.; Sun, Y.; Voegelin, A.; Lenz, M.; Berg, M.; Winkel, L.H.E. Terrestrial Selenium Distribution in China Is Potentially Linked to Monsoonal Climate. Nat. Commun. 2014, 5, 4717. [Google Scholar] [CrossRef] [PubMed] [Green Version]
  17. Sun, G.X.; Meharg, A.A.; Li, G.; Chen, Z.; Yang, L.; Chen, S.C.; Zhu, Y.G. Distribution of Soil Selenium in China Is Potentially Controlled by Deposition and Volatilization? Sci. Rep. 2016, 6, 20953. [Google Scholar] [CrossRef] [Green Version]
  18. Pang, Y.; He, J.; Niu, X.; Song, T.; Fu, L.; Liu, K.; Bi, E. Selenium Distribution in Cultivated Argosols and Gleyosols of Dry and Paddy Lands: A Case Study in Sanjiang Plain, Northeast China. Sci. Total Environ. 2022, 836, 155528. [Google Scholar] [CrossRef] [PubMed]
  19. Wang, Z.; Gao, Y. Biogeochemical Cycling of Selenium in Chinese Environments. Appl. Geochem. 2001, 16, 1345–1351. [Google Scholar] [CrossRef]
  20. Liu, Y.; Tian, X.; Liu, R.; Liu, S.; Zuza, A.V. Key Driving Factors of Selenium-Enriched Soil in the Low-Se Geological Belt: A Case Study in Red Beds of Sichuan Basin, China. Catena 2021, 196, 104926. [Google Scholar] [CrossRef]
  21. Laik, R.; Kumara, B.H.; Pramanick, B.; Singh, S.K.; Nidhi; Alhomrani, M.; Gaber, A.; Hossain, A. Labile Soil Organic Matter Pools Are Influenced by 45 Years of Applied Farmyard Manure and Mineral Nitrogen in the Wheat—Pearl Millet Cropping System in the Subtropical Condition. Agronomy 2021, 11, 2190. [Google Scholar] [CrossRef]
  22. Xu, Y.; Li, Y.; Li, H.; Wang, L.; Liao, X.; Wang, J.; Kong, C. Effects of Topography and Soil Properties on Soil Selenium Distribution and Bioavailability (Phosphate Extraction): A Case Study in Yongjia County, China. Sci. Total Environ. 2018, 633, 240–248. [Google Scholar] [CrossRef] [PubMed]
  23. Qin, H.B.; Zhu, J.M.; Su, H. Selenium Fractions in Organic Matter from Se-Rich Soils and Weathered Stone Coal in Selenosis Areas of China. Chemosphere 2012, 86, 626–633. [Google Scholar]
  24. Supriatin, S.; Weng, L.; Comans, R.N.J. Selenium Speciation and Extractability in Dutch Agricultural Soils. Sci. Total Environ. 2015, 532, 368–382. [Google Scholar] [CrossRef] [PubMed]
  25. Li, Z.; Liang, D.; Peng, Q.; Cui, Z.; Huang, J.; Lin, Z. Interaction between Selenium and Soil Organic Matter and Its Impact on Soil Selenium Bioavailability: A Review. Geoderma 2017, 295, 69–79. [Google Scholar] [CrossRef]
  26. Tolu, J.; Thiry, Y.; Bueno, M.; Jolivet, C.; Potin-Gautier, M.; Le Hécho, I. Distribution and Speciation of Ambient Selenium in Contrasted Soils, from Mineral to Organic Rich. Sci. Total Environ. 2014, 479–480, 93–101. [Google Scholar] [CrossRef] [PubMed]
  27. Xiao, K.; Tang, J.; Chen, H.; Li, D.; Liu, Y. Impact of Land Use/Land Cover Change on the Topsoil Selenium Concentration and Its Potential Bioavailability in a Karst Area of Southwest China. Sci. Total Environ. 2020, 708, 135201. [Google Scholar] [CrossRef]
  28. Dai, J.; Huang, K.; Liu, Y.; Yang, C.; Wang, Z. Global Reconstruction of Complex Network Topology via Structured Compressive Sensing. IEEE Syst. J. 2021, 15, 1959–1969. [Google Scholar] [CrossRef]
  29. Zhang, Z.; Xu, E.; Zhang, H. Complex Network and Redundancy Analysis of Spatial-Temporal Dynamic Changes and Driving Forces behind Changes in Oases within the Tarim Basin in Northwestern China. Catena 2021, 201, 105216. [Google Scholar] [CrossRef]
  30. Li, P.; Hao, H.; Zhang, Z.; Mao, X.; Xu, J.; Lv, Y.; Chen, W.; Ge, D. A Field Study to Estimate Heavy Metal Concentrations in a Soil-Rice System: Application of Graph Neural Networks. Sci. Total Environ. 2022, 832, 155099. [Google Scholar]
  31. Dai, L.; Wang, L.; Liang, T.; Zhang, Y.; Li, J.; Xiao, J.; Dong, L.; Zhang, H. Geostatistical Analyses and Co-Occurrence Correlations of Heavy Metals Distribution with Various Types of Land Use within a Watershed in Eastern QingHai-Tibet Plateau, China. Sci. Total Environ. 2019, 653, 849–859. [Google Scholar] [CrossRef]
  32. Zhang, Z.; Wang, J.; Li, B. Determining the Influence Factors of Soil Organic Carbon Stock in Opencast Coal-Mine Dumps Based on Complex Network Theory. Catena 2019, 173, 433–444. [Google Scholar] [CrossRef]
  33. Jin, Z.; Shang, J.; Zhu, Q.; Ling, C.; Xie, W.; Qiang, B. RFRSF: Employee Turnover Prediction Based on Random Forests and Survival Analysis. In Proceedings of the 21st International Conference on Web Information Systems Engineering—WISE 2020, Amsterdam, The Netherlands, 20–24 October 2020, Part II; Springer: Berlin/Heidelberg, Germany, 2020; pp. 503–515. [Google Scholar]
  34. Hengl, T.; Heuvelink, G.B.M.; Kempen, B.; Leenaars, J.G.B.; Walsh, M.G.; Shepherd, K.D.; Sila, A.; MacMillan, R.A.; De Jesus, J.M.; Tamene, L.; et al. Mapping Soil Properties of Africa at 250 m Resolution: Random Forests Significantly Improve Current Predictions. PLoS ONE 2015, 10, e0125814. [Google Scholar] [CrossRef] [PubMed]
  35. Yao, X.; Yu, K.; Deng, Y.; Liu, J.; Lai, Z. Spatial Variability of Soil Organic Carbon and Total Nitrogen in the Hilly Red Soil Region of Southern China. J. For. Res. 2020, 31, 2385–2394. [Google Scholar] [CrossRef] [Green Version]
  36. Zeraatpisheh, M.; Ayoubi, S.; Jafari, A.; Tajik, S.; Finke, P. Digital Mapping of Soil Properties Using Multiple Machine Learning in a Semi-Arid Region, Central Iran. Geoderma 2019, 338, 445–452. [Google Scholar] [CrossRef]
  37. Zhang, H.; Wang, D.; Su, B.; Shao, S.; Yang, J.; Fan, M.; Wu, J.; Gao, C. Distribution and Determinants of Organic Carbon and Available Nutrients in Tropical Paddy Soils Revealed by High–Resolution Sampling. Agric. Ecosyst. Environ. 2021, 320, 107580. [Google Scholar] [CrossRef]
  38. Lundberg, S.M.; Lee, S.I. A Unified Approach to Interpreting Model Predictions. Adv. Neural Inf. Process. Syst. 2017, 30, 4766–4775. [Google Scholar]
  39. Zhou, Y.; Wu, W.; Liu, H. Exploring the Influencing Factors in Identifying Soil Texture Classes Using Multitemporal Landsat-8 and Sentinel-2 Data. Remote Sens. 2022, 14, 5571. [Google Scholar] [CrossRef]
  40. Yang, H.; Huang, K.; Zhang, K.; Weng, Q.; Zhang, H.; Wang, F. Predicting Heavy Metal Adsorption on Soil with Machine Learning and Mapping Global Distribution of Soil Adsorption Capacities. Environ. Sci. Technol. 2021, 55, 14316–14328. [Google Scholar] [CrossRef]
  41. Tan, J.; Zhu, W.; Wang, W.; Li, R.; Hou, S.; Wang, D.; Yang, L. Selenium in Soil and Endemic Diseases in China. Sci. Total Environ. 2002, 284, 227–235. [Google Scholar] [CrossRef]
  42. Faithfull, N.T. Methods in Agricultural Chemical Analysis: A Practical Handbook; CABI: Wallingford, UK, 2002. [Google Scholar]
  43. Nelson, D.W.A.; Sommers, L. Total Carbon, Organic Carbon, and Organic Matter. In Methods of Soil Analysis: Part 2 Chemical and Microbiological Properties; Wiley: Hoboken, NJ, USA, 1983; Volume 9, pp. 539–579. [Google Scholar]
  44. Jenny, H. Factors of Soil Formation: A System of Quantitative Pedology; Courier Corporation: North Chelmsford, MA, USA, 1994; ISBN 0486681289. [Google Scholar]
  45. Zhang, W.C.; Wan, H.S.; Zhou, M.H.; Wu, W.; Liu, H. bin Soil Total and Organic Carbon Mapping and Uncertainty Analysis Using Machine Learning Techniques. Ecol. Indic. 2022, 143, 109420. [Google Scholar] [CrossRef]
  46. Shang, G.W.; Dai, Y.; Liu, B.; Ye, A.; Yuan, H. A Soil Particle-Size Distribution Dataset for Regional Land and Climate Modelling in China. Geoderma 2012, 171–172, 85–91. [Google Scholar] [CrossRef]
  47. Tiefelsdog, M. The Saddlepoint Approximation of Moran’s I and Local Moran’s Ii’s Reference Distribution and Their Numerical Evaluation. Geogr. Anal. 2002, 34, 187–206. [Google Scholar]
  48. Fu, W.; Zhao, K.; Zhang, C.; Wu, J.; Tunney, H. Outlier Identification of Soil Phosphorus and Its Implication for Spatial Structure Modeling. Precis. Agric. 2016, 17, 121–135. [Google Scholar] [CrossRef]
  49. Zhang, C.; Tang, Y.; Luo, L.; Xu, W. Outlier Identification and Visualization for Pb Concentrations in Urban Soils and Its Implications for Identification of Potential Contaminated Land. Environ. Pollut. 2009, 157, 3083–3090. [Google Scholar] [CrossRef]
  50. Anselin, L. Local Indicators of Spatial Association—LISA. Geogr. Anal. 1995, 27, 93–115. [Google Scholar] [CrossRef]
  51. Zhang, X.; Zhang, W.C.; Wu, W.; Liu, H. Bin Horizontal and Vertical Variation of Soil Clay Content and Its Controlling Factors in China. Sci. Total Environ. 2023, 864, 161141. [Google Scholar] [CrossRef] [PubMed]
  52. Lin, L.I.-K. A Concordance Correlation Coefficient to Evaluate Reproducibility. Biometrics 1989, 45, 255. [Google Scholar] [CrossRef]
  53. Wang, F.; Wang, Y.; Zhang, K.; Hu, M.; Weng, Q.; Zhang, H. Spatial Heterogeneity Modeling of Water Quality Based on Random Forest Regression and Model Interpretation. Environ. Res. 2021, 202, 111660. [Google Scholar] [CrossRef]
  54. Hou, L.; Dai, Q.; Song, C.; Liu, B.; Guo, F.; Dai, T. Revealing Drivers of Haze Pollution by Explainable Machine Learning. Environ. Sci. Technol. Lett. 2022, 9, 112–119. [Google Scholar] [CrossRef]
  55. Shand, C.A.; Eriksson, J.; Dahlin, A.S.; Lumsdon, D.G. Selenium Concentrations in National Inventory Soils from Scotland and Sweden and Their Relationship with Geochemical Factors. J. Geochem. Explor. 2012, 121, 4–14. [Google Scholar] [CrossRef]
  56. Yamada, H.; Kamada, A.; Usuki, M.; Yanai, J. Total Selenium Content of Agricultural Soils in Japan. Soil Sci. Plant Nutr. 2009, 55, 616–622. [Google Scholar] [CrossRef]
  57. National Soil Survey Office. Soil Species of China; China Agriculture Press: Beijing, China, 1998; pp. 318–336. [Google Scholar]
  58. Jones, G.D.; Droz, B.; Greve, P.; Gottschalk, P.; Poffet, D. Selenium Deficiency Risk Predicted to Increase under Future Climate Change. Proc. Natl. Acad. Sci. USA 2017, 114, 2848–2853. [Google Scholar] [CrossRef] [Green Version]
  59. Roulier, M.; Bueno, M.; Coppin, F.; Nicolas, M.; Thiry, Y.; Rigal, F.; Le Hécho, I.; Pannier, F. Atmospheric Iodine, Selenium and Caesium Depositions in France: I. Spatial and Seasonal Variations. Chemosphere 2021, 273, 128971. [Google Scholar] [CrossRef] [PubMed]
  60. Wen, H.; Carignan, J. Ocean to Continent Transfer of Atmospheric Se as Revealed by Epiphytic Lichens. Environ. Pollut. 2009, 157, 2790–2797. [Google Scholar] [CrossRef] [PubMed]
  61. Zheng, S.; Xia, Y.; Hu, Y.; Chen, X.; Rui, Y. Stoichiometry of Carbon, Nitrogen, and Phosphorus in Soil: Effects of Agricultural Land Use and Climate at a Continental Scale. Soil Tillage Res. 2021, 209, 104903. [Google Scholar] [CrossRef]
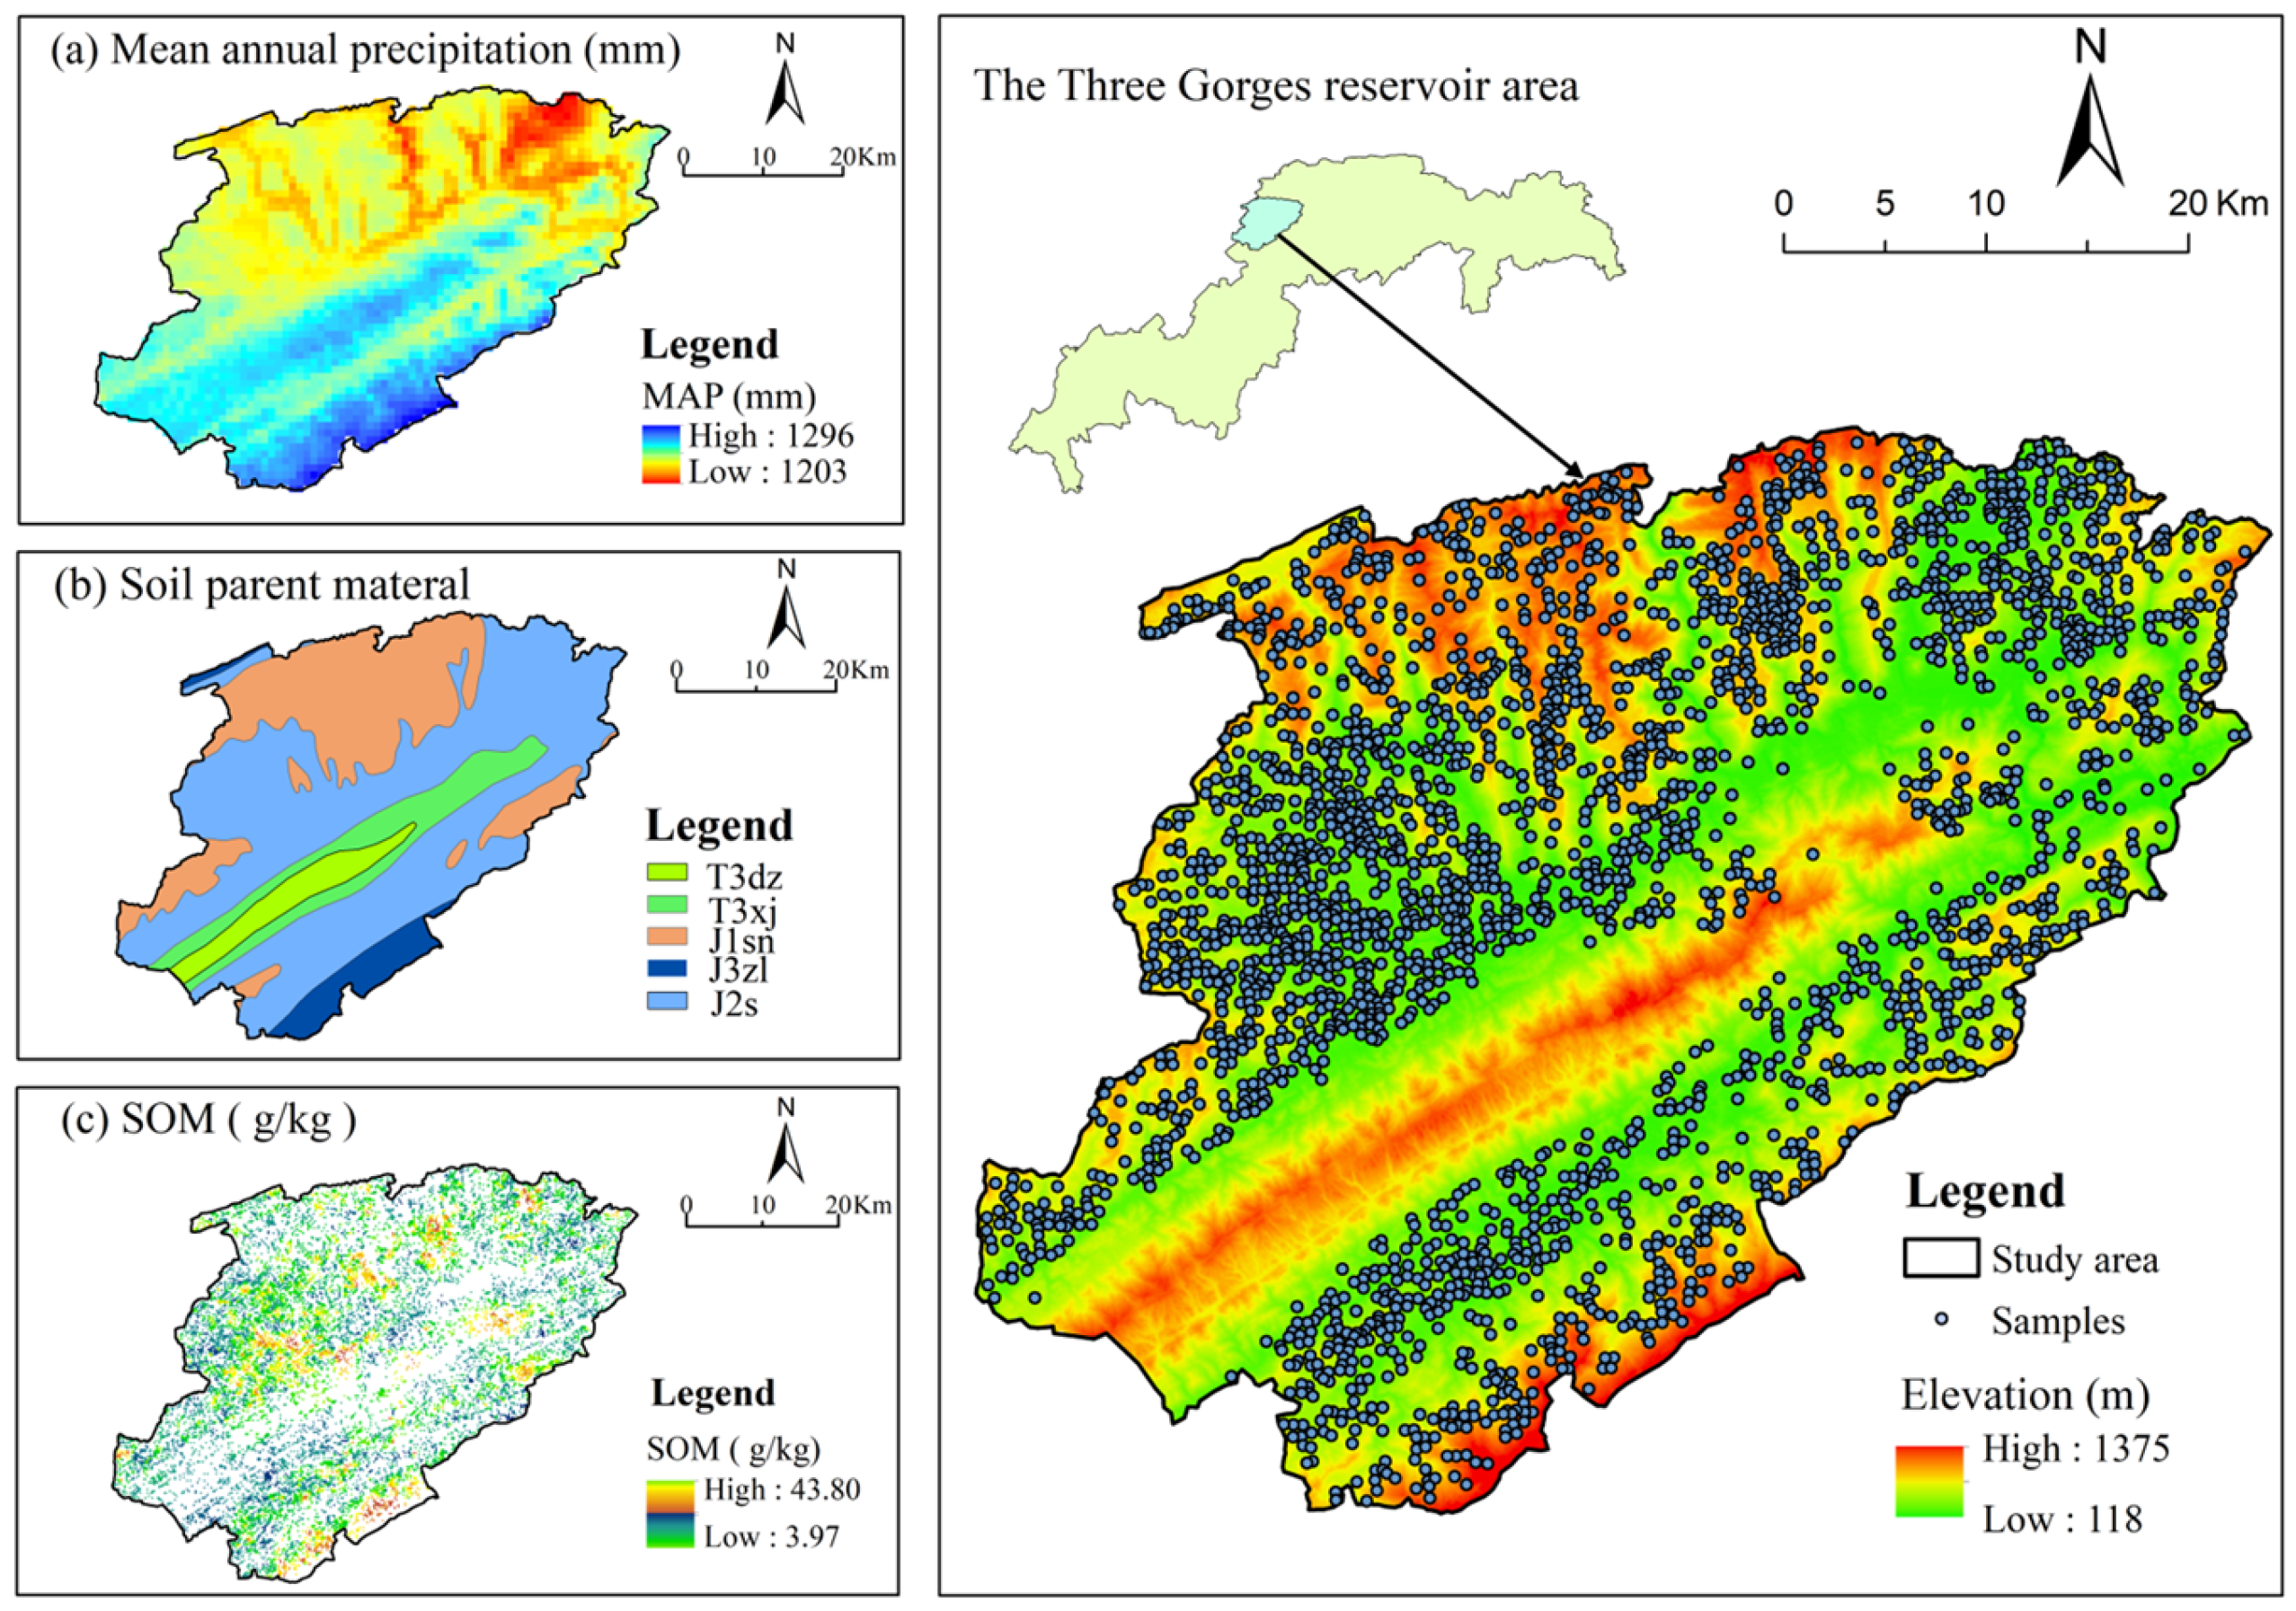
Figure 1. The sampling sites, mean annual precipitation (a), soil parent material (b), and soil organic matter (SOM) (c) distribution in Kaizhou, the Three Gorges reservoir area, China.
Agronomy 13 01031 g001
Figure 2. Basic statistics and sample distribution of soil Se content in Kaizhou.
Agronomy 13 01031 g002
Figure 3. The complex topology network graph between soil Se and environmental factors. The color of edges suggests positive (red) and negative (green) correlation between nodes, and the stronger the correlation, the thicker the edges. The range of correlation coefficients between the factors is −0.10–0.66. Ele: elevation.
Agronomy 13 01031 g003
Figure 4. Moran’s index analysis of soil Se content.
Agronomy 13 01031 g004
Figure 5. The spatial distribution map of soil Se content in Kaizhou.
Agronomy 13 01031 g005
Figure 6. Shapley additive explanations (SHAP) summary plot of environmental factors for soil Se content. Environment factors are arranged along the Y-axis according to their importance, with the most key factors ranked at the top. The color of the points represents the high (red) or low (blue) values of the environmental factor. Ele: elevation; Par: soil parent material.
Agronomy 13 01031 g006
Table 1. The information on environmental factors.
Environmental FactorsType aResolution (m) or ScaleSource
TopographyElevationNF30DEM e (https://www.usgs.gov/, accessed on 17 May 2022)
Valley depth (VD)NF30DEM
AspectNF30DEM
SlopeNF30DEM
Topographic wetness index (TWI)NF30DEM
ClimateMean annual
precipitation (MAP)
NF1000WorldClim dataset (https://www.worldclim.org/, accessed on 8 May 2022)
Mean annual
temperature (MAT)
NF1000WorldClim database
Soil propertiesSoil pH (pH)NF-Laboratory analysis
Soil organic matter (SOM)NF-Laboratory analysis
Soil texture bNF1000The “soil particle size
distribution in China” dataset
OthersLand use cCF1:10,000Land use map
Parent material dCF1:250,000Geological map
a CF: categorical factors, NF: numerical factors. b Soil texture: clay, silt, sand. c Land use: paddy land and dry land. d Parent material: Xujiahe Formation of Triassic (T3xj), Suining Formation of Jurassic (J1sn), Ziliujing Formation of Jurassic (J3zl), Shaximiao Formation of Jurassic (J2s). e DEM: digital elevation model.
Table 2. The basic statistics of environmental factors.
Environmental FactorsMinimumMaximumMeanCV(%)SkewKurtosis
TopographyElevation (m)154127847050.590.59−0.71
VD (m)052011670.410.800.62
Aspect (°)036019053.71−0.08−1.12
Slope (°)054.7511.3460.94−0.870.95
TWI3.4925.237.6740.821.954.56
ClimateMAP (mm)1203129212441.250.300.19
MAT (°)13.2518.1716.856.12−0.83−0.30
Soil propertiesSoil pH3.988.556.0516.900.56−0.63
SOM (g/kg)2.5945.7416.4443.030.780.41
Silt (%)29.6757.9045.9412.00−0.800.63
Sand (%)16.1150.1132.0827.480.36−0.71
Clay (%)17.0031.4021.9818.900.68−1.02
Table 3. Soil Se content (mean ± standard deviation, mg/kg) in different soil parent materials (n = 2804).
T3xj (n = 63)J1sn (n = 866)J3zl (n = 131)J2s (n = 1744)
0.23 ± 0.08 b0.18 ± 0.05 c0.29 ± 0.09 a0.16 ± 0.06 c
The different letters represent significant differences in Se level among the parent materials (p < 0.01). T3xj: Xujiahe Formation of Triassic; J1sn: Suining Formation of Jurassic; J3zl: Ziliujing Formation of Jurassic; J2s: Shaximiao Formation of Jurassic.
Table 4. Soil Se content (mean ± standard deviation, mg/kg) in different land uses (n = 2804).
Paddy Field (n = 1810)Dry Land (n = 994)
0.17 ± 0.06 b0.18 ± 0.07 a
The different letters represent significant differences in Se level between the land uses (p < 0.01).
Table 5. Test of interaction of main environmental factors on Se content (two-way ANOVA).
ItemFactorSum of SquaresdfMean SquareFSig
SeSOM and Par0.902870.0031.540.000 **
SOM and pH4.921040.0020.940.672
SOM and Ele3.8117580.0020.770.919
MAP and Par0.57930.0062.200.000 **
MAP and pH6.6220630.0030.920.817
MAP and Ele5.2617290.0031.170.072
Par: soil parent material; Ele: elevation; df: degree of freedom, **: significant interaction (p < 0.05).
Disclaimer/Publisher’s Note: The statements, opinions and data contained in all publications are solely those of the individual author(s) and contributor(s) and not of MDPI and/or the editor(s). MDPI and/or the editor(s) disclaim responsibility for any injury to people or property resulting from any ideas, methods, instructions or products referred to in the content.