Abstract
The nutritional diagnosis of crops is carried out through costly elemental analyses of different plant organs, particularly leaves, in the laboratory. However, visible and near-infrared (Vis-NIR) spectroscopy of unprocessed plant samples has a high potential as a faster, non-destructive, environmental-friendly alternative to elemental analyses. In this work, the potential of this technique to estimate the concentrations of macronutrients such as nitrogen (N), phosphorus (P), potassium (K), calcium (Ca), and magnesium (Mg), and micronutrients such as iron (Fe), manganese (Mn) and boron (B), in persimmon (Diospyros kaki L.) ‘Rojo Brillante’ leaves, has been investigated. Throughout the crop cycle variable rates of N and K were applied to obtain six nutritional status levels in persimmon trees in an experimental orchard. Then, leaves were systematically sampled throughout the cropping season from the different nutritional levels and spectral reflectance measurements were acquired in the 430–1040 nm wavelength range. The concentrations of nutrients were determined by inductively coupled plasma optical emission spectrometry (ICP-OES) for P, K, Ca, Mg, Fe, Mn and B after microwave digestion, while the Kjeldahl method was used for N. Then, partial least squares regression (PLS-R) was used to model the concentrations of these nutrients from the reflectance measurements of the leaves. The model was calibrated using 75% of the samples while the remaining 25% were left as the independent test set for external validation. The results of the test set indicated an acceptable validation for most of the nutrients, with determination coefficients (R2) of 0.74 for N and P, 0.54 for K, 0.77 for Ca, 0.60 for Mg, 0.39 for Fe, 0.69 for Mn and 0.83 for B. These findings support the potential use of Vis-NIR spectrometric techniques as an alternative to conventional laboratory methods for the persimmon nutritional status diagnosis although more research is needed to know how the models developed one year perform in ensuing years.
1. Introduction
Persimmon (Diospyros kaki L.) ‘Rojo Brillante’ is the most common variety cultivated in Spain, with 95% of the Spanish production. The Valencian Community cultivated around 429,000 tons of this fruit in 2021 under a Protected Designation of Origin (PDO) certified by the Regulatory Council of PDO ‘Kaki Ribera del Xúquer’. Additionally, for this variety Diagnosis and Recommendation Integrated System (DRIS) norms and standardized tables for Nutritional Optimal Ranges (NOR) have been established [1].
Accurately determining the nutritional status of plants in different phenological stages is necessary to achieve adequate fertilization and to tailor fertilizer applications to match their exact needs. A foliar analysis is the most suitable method for assessing nutrient status because it provides precise information about the amount of nutrients absorbed and assimilated by plants [2]. Quantifying macro and micronutrients in leaves is essential for any farmer because they are the primary organ of plant metabolism and the easiest to collect and analyze [3,4].
Nitrogen (N) is the nutrient that most significantly affects the vegetative development of plants; it is a crucial element for the physiological processes of plants and is required in large amounts [5]. N deficiency leads to smaller leaves and noticeable yellowing. Phosphorus (P) is essential for some macromolecules such as nucleic acids, phospholipids and sugar phosphates used by plants to develop new roots, fruits and flowers [6,7]. Potassium (K) is the element that most influences production and is necessary for enzymatic reactions, maintaining osmotic potential, and water uptake during plant development [8]. Calcium (Ca) is a secondary macronutrient that promotes the growth and development of roots, driving the absorption of nutrients and water present in the soil. Ca deficiency first appears on young leaves, showing a typical deformation and chlorosis. The primary role of magnesium (Mg) is as a constituent of chlorophyll, involved in the synthesis of carotenoids and xanthophylls. Mg deficiency is characterized by chlorosis on the leaf borders. Micronutrients, such as iron (Fe), manganese (Mn) and boron (B), are essential for plant growth and development as they participate in numerous enzymatic and metabolic processes, as well as in the synthesis of chlorophyll [9].
The most appropriate method for determining the nutrient concentration in leaves is through ionomic analysis, which provides important information about plant nutritional status and helps to identify nutrient disorders that can guide balanced fertilization programs [10,11,12]. However, reference methods such as inductively coupled plasma optical emission spectroscopy (ICP-OES), atomic absorption spectroscopy (AAS) and X-ray fluorescence spectroscopy (XRFS) require a large number of leaf samples and expensive reagents, and they also have negative environmental impacts [13,14]. These characteristics often make it difficult to achieve optimal nutrition for deciduous plants, such as persimmon.
To overcome these drawbacks, visible and near-infrared (Vis-NIR) spectroscopy is a promising alternative for determining leaf nutrient concentration. Vis–NIR spectroscopy is commonly used as a remote, non-destructive method for rapid analysis of many attributes of fresh leaves. The visible region is where photosynthetic pigments, such as carotenoids, chlorophylls, and xanthophyll, strongly absorb energy. However, the reflection in NIR is dominated by the structural reflection of turgid plant cells of the mesophyll [15].
In case of nutritional deficiency, the plant may be affected by the loss of vegetative, structural, photosynthetic and enzymatic compounds essential for plant development [16]. N is one of the elements associated with chlorophyll, which is why it interacts with electromagnetic radiation [17]. Other elements, such as P, may not be directly detected when irradiated with Vis-NIR frequencies, but organic compounds and other complex plant components containing these elements can be detected [18]. Concerning Mg, this nutrient is part of the structure of the chlorophyll molecule, which presents a strong interaction with electromagnetic radiation [19]. The rest of the nutrients, such as K, Ca, Fe, Mn, Zn and Cu, do not present specific spectral absorption characteristics in the Vis-NIR region but can bind electrostatically or act as binders for larger compounds containing carbon [15].
Previous studies have demonstrated the potential of Vis-NIR-based technologies to estimate the concentration of several elements in the leaves of different crops. The best predictive model was obtained for potassium (K) in citrus (R2 = 0.982) and the analyzed elements showed coefficients of determination ranging from R2 = 0.883 for magnesium (Mg) to R2 = 0.481 for phosphorus (P). The calibration curves for all nutrients in sugarcane showed high correlations (CV > 0.9) and low standard deviations (σ < 0.15) in all cases with an R2 = 0.90.
Menesatti et al. [20] used Vis-NIR spectroscopy (400–1000 nm) to evaluate the concentration of N, P, K, Ca, Mg, Fe, Zn, and Mn in citrus. To increase variability, they applied five different nitrogen input levels (0, 200, 400, 600 and 800 g N tree−1 year−1) while all treatments received the same amount of P and K. The best predictive model for a single nutrient was achieved for K with an R2 of 0.982. When all chemical parameters were considered together, coefficients of determination ranged from R2 = 0.883 for Mg to R2 = 0.481 for P. Other study performed by Ordoñez et al. [21] used a functional linear regression and non-parametric methods to predict chemical characteristics such as moisture, dry mass, and concentrations of N, P, K, Ca, Fe and Mg in vine leaves from spectral reflectance measurements taken from 350–2500 nm. Yarce et al. [22] and Chen et al. [23] used NIR spectroscopy (NIRS) to study the concentrations of macro and micronutrients in sugarcane. They obtained high correlations (>0.9) and low standard deviation (<0.15) with an R2 of 0.90 for all nutrients. Regarding persimmon, Visconti & de Paz [24] developed a regression model to estimate Cl− from foliar reflectance, achieving the best results with an R2 of 0.78 and a root mean square error (RMSE) of 0.34% for Cl− concentrations above 1.5%, and finding that the most important wavelengths for Cl− estimation were between 390–472 nm and 690–692 nm.
Due to the importance of the persimmon ‘Rojo Brillante’ cropping in Spain, it is crucial to develop fast, environmental-friendly, non-destructive and accurate enough nutritional status estimation tools. However, to our knowledge, only one study has been found related to estimating nutrient contents in persimmon leaves using Vis-NIR spectroscopy [24] but focused only on chloride (Cl−). Therefore, the objective of this work was to develop models able to estimate the most relevant macro and micronutrients by Vis-NIR spectroscopy in conjunction with PLS-R, which may be an alternative to the conventional laboratory foliar analyses for the assessment of persimmon nutritional status.
2. Materials and Methods
2.1. Experimental Design
The experiment was conducted on an experimental persimmon ‘Rojo ‘Brillante’ orchard located at the Instituto Valenciano de Investigaciones Agrarias (IVIA, Moncada, Valencia, Spain; 39°32′ N, 0°23′ W).
To increase the range of foliar nutrient concentrations and build more accurate models, an experiment was conducted on persimmon trees using six different treatments with varying N and K dosage rates (Table 1). These treatments included four levels of N (0%, 33%, 50%, and 100%) and three levels of K (0%, 50%, and 100%). The control doses (100%) were set considering the tree requirements, which were 106 kg·ha−1 for N and 110 kg·ha−1 for K. Each treatment was replicated twice with two trees per replicate, resulting in four trees per treatment and a total of 24 trees.

Table 1.
Doses of nitrogen and potassium (kg/ha) applied in each treatment of the persimmon tree nutrient experiment.
Leaf samples were taken monthly throughout a complete vegetative cycle in April (after flowering), June (fruit enlargement), July (70% fruit size), September (color break), October and (fruit at harvest) November (lethargy) 2020. Six leaves from each tree, which were the third or fourth one from the axilla of reproductive sproutings, were collected per treatment, resulting in 144 leaves per sampled month (864 total leaves sampled).
Once collected, the leaves were washed with phosphate-free soap and rinsed with milliQ water to remove any remaining dust or contamination. Figure 1 shows four leaves of persimmon in different phenological stages. As they are deciduous leaves, they show slight color changes.
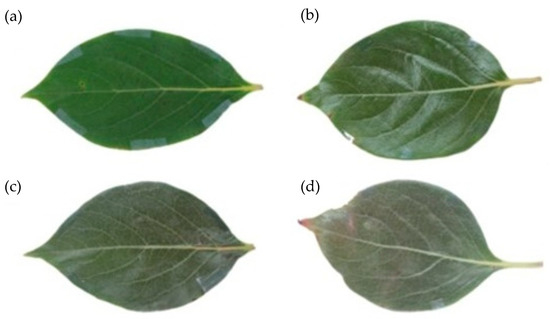
Figure 1.
Persimmon leaves collected in (a) April (after flowering), (b) July (70% fruit size), (c) October (fruit at harvest) and (d) November (lethargy).
2.2. Vis-NIR Spectral Measurements
Leaf reflectance measurements were performed in the laboratory, employing a portable CI-710 Miniature Leaf Spectrometer (CID Bio-Science, Inc., Camas, WA, USA), which is shown in Figure 2 (left panel). Two spectral recordings were performed per leaf, one near the tip of the midrib and the other near the petiole, but always at an inter-nervation point. Spectral measurements were taken in the Vis-NIR range from 430 to 1040 nm in steps of 2.6 nm (232 values). Both spectra were averaged to obtain a single representative reflectance spectrum per leaf. Figure 2 shows the arrangement for the spectral recording, highlighting the points of measurement on the leaf (Figure 2, right). The reflectance data were acquired using the software Spectra Snap! v1.1.3.150 (CID Bio-Science, Inc., Camas, WA, USA).
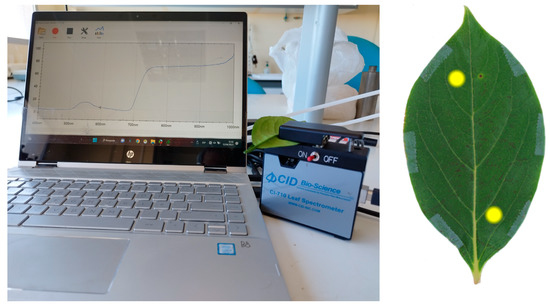
Figure 2.
(Left): Vis-NIR spectral measurements on persimmon leaves, reflectance mode. (Right): measurement points.
2.3. Chemical Analysis
After the spectral measurements, the leaves were dried in an air-forced oven at 65 °C for at least 72 h until constant weight. Then, they were crushed in a grinder (IKA M 20, IKA Labortechnik, Staufen, Germany) and stored until analysis. Organic digestion was performed first, using microwave-assisted wet extraction in a microwave digestion system (ETHOS UP, Milestone Inc., Santa Clara, CA, USA). Subsequently, the macro (P, K, Ca and Mg) and micronutrients (Fe, Mn and B) were measured using inductively coupled plasma optical emission spectroscopy (ICP-OES 7000; Thermo Scientific, Cambridge, UK) [25,26,27,28]. The Kjeldahl method (Kjeltec 8200, Foss Tecator AB, Sweden) was used to determine N contents [29]. Six leaves were necessary to obtain the minimum dry matter weight required to conduct a single ionomic analysis.
2.4. Chemometric Analysis
Spectral data were obtained by measuring at two points on the leaf that were averaged to obtain a single value per leaf. However, the accuracy of these measurements can be adversely affected by noise [30], which can be caused by factors such as electrical currents in the instrument, temperature and humidity changes during measurements, and variations due to the nature of the sample, like texture, size or geometry. This noise causes unwanted variations in the spectral data that must be corrected [31]. To address these issues, five data pretreatments were used: mean center (MC) [32], Savitzky-Golay (SG) [33], standard normal variate (SNV) [34], first (1D) and second derivatives (2D) [35,36]. These pretreatments helped to reduce random noise and dispersion, eliminate constant baseline offsets, and highlight the variations among individual samples instead of using the absolute signal level. Once the corrections were made, a table was created for each macro and microelement, with rows representing the leaf samples and columns representing the wavelengths (predictor variables X). An additional column containing the reference values obtained through ionomic analysis (response variable Y) was added to each table. This table was the input to build partial least squares regression (PLS-R) models.
PLS-R is a soft modeling method for constructing predictive models when the factors are many and highly collinear [37]. Different models were created for each nutrient and the samples were randomly split into a calibration set (75%) for model building and an independent test set (25%) for external validation. In PLS, one goal is to find a reduced number of latent variables (LV) that capture the maximum amount of variation in the data [38]. A method based on 20-fold cross-validation (CV) was used for internal validation [39,40] and to determine the number of LV that balances model complexity and predictive performance. The performance of the PLS-R models was evaluated using the root mean square error of prediction (RMSEP), which expresses the uncertainty that can be expected when predicting new samples, and the coefficient of determination (R2) that indicates the proportion of the variance of ionomic values (variable Y) that is predicted or explained by linear regression and the spectral measurements (variables X) [41]. The lower the RMSEP and the higher the R2, the better a model fits a dataset. The models were built using the statistical program Unscrambler version 9.7 (Camo Software, Oslo, Norway).
3. Results
Descriptive statistics of each element identified from destructive ionomic analysis through the sampling period are shown in Table 2. The nutrient concentrations for the samples collected in July are also shown as this month is considered one of the most suitable for foliar sampling for persimmon in Spain [42]. All values are within the expected ranges.
Table 2.
Descriptive statistics of the leaf macro and micronutrient concentration determined in the vegetative cycle (April-November 2020) by conventional analytical methods. Macronutrients (N, P, K, Ca and Mg) are expressed in (%) of dry matter. Micronutrients (Fe, Zn and B) are expressed in (ppm).
Table 3 shows the RMSEP, the R2 and the number of LV achieved for the macronutrients. Based on the independent test set (external validation), the best results for N were obtained using the MC + 1D with R2 = 0.78 and RMSEP = 0.18. The better model for P was obtained with the raw data, achieving an R2 of 0.75 and RMSEP = 0.02. The best performance for K was achieved using MC + SG with R2 = 0.52 and RMSEP = 0.34. Ca achieved R2 = 0.77 and RMSEP = 0.60, while for Mg, the best model had an R2 = 0.63 and RMSEP = 0.11 in these two cases using MC + 1D.
Table 3.
Comparative statistics on reflectance for the test sets of the model generated by PLS-R for prediction of macronutrients (N, P, K, Ca and Mg). Mean center (MC), Savitzky-Golay (SG), Standard Normal Variate (SNV), First Derivative (1D) and Second Derivative (2D).
The results for micronutrients are shown in Table 4. In this case, the best model for Fe was based on using MC + 1D, reaching a low R2 = 0.39 and high RMSEP = 11.56. Concerning Mn, the best model was obtained with the raw data with a determination coefficient of R2 = 0.69 and RMSEP = 40.75. Finally, B achieved an R2 = 0.83 and RMSEP = 8.59 using MC + 1D.
Table 4.
Comparative statistics and uncertainty indices (R2 and RMSEP) on reflectance for the test sets of the model generated by PLS-R for micronutrients (Fe, Mn and B). Mean center (MC), Savitzky-Golay (SG), Standard Normal Variate (SNV), First Derivative (1D) and Second Derivative (2D).
4. Discussion
The R2 values for the macronutrients (N, P, K, Ca and Mg) prediction model ranged from 0.50 to 0.78, with N having the highest R2. For the micronutrients (Fe, Mn and B), the R2 values ranged from 0.39 to 0.83, with B having the highest R2. Previous studies on predicting nutrients in persimmon leaves using spectroscopy have not been reported, but similar studies on other crops can be found. The strength of this study lies in two factors: the variability introduced in the models due to natural concentration variations during a vegetative cycle and the direct correlation between the spectra measured and the concentration of the crop leaves.
The PLS-R model developed to predict foliar N concentration using Vis-NIR spectroscopy achieved high accuracy with an R2 of 0.78 and low uncertainty indicated by an RMSEP of 0.18 in the external validation set. In previous studies for citrus leaves, better outcomes were obtained in trees fertilized with very different N doses, resulting in a similar R2 of 0.91 and RMSE of 1.06 using a spectral range of 380–1100 nm [19,43]. Ulissi et al. [32] achieved an R2 of 0.88 with RMSEP = 0.40 for N in tomato leaves. In olive, Rotbart et al. [44] reported an R2 of 0.91 with RMSEP = 0.07 for N in a spectral range from 1100 to 1700 nm. However, they obtained results similar to those presented in this work using the 450 to 1000 nm range, which suggests that NIR can be better than Vis-NIR in predicting N concentration. Wang et al. [45,46] obtained similar R2 values of 0.85 with RMSEP = 0.15 and 4.48 in pear leaves but in the range of 350–2500 nm, which requires more expensive and complex equipment than other studies. Oliveira and Santana [47] predicted the N leaf concentration in eucalyptus with an R2 of 0.95, using leave-one-out cross-validation and leaves of different colours, from dark green to yellow.
In this work, P was well predicted with an R2 of 0.75 and an RMSEP of 0.02. Another study on citrus leaves [43] achieved a similar R2 of 0.77. In contrast, other work predicted P concentration for sugarcane with an R2 of 0.98 and an RMSEP of 0.008, using a broader spectral range of 780–2500 nm based on Fourier Transform NIRS (FT-NIRS) [21], which required very complex equipment. The spectral data did not show a strong correlation with K concentration, with an R2 of 0.54 and an RMSEP of 0.34. Other studies have achieved higher R2 values in experiments designed to create extreme variability [19]. Furthermore, Oliveira and Santana [47] achieved an R2 of 0.76 with an RMSEP of 1.30 when examining eucalyptus leaves of varying colours and conditions, including healthy leaves and those showing symptoms of the damage. The PLS-R model developed to predict Ca showed good accuracy, as evidenced by an R2 value of 0.77 and a low RMSEP of 0.60. Comparable results have been found for citrus [19]. Osco et al. [43] determined four spectral ranges between 545 and 1020 nm and predicted Ca levels with an R2 value of 0.62 and an RMSEP of 9.40. Furthermore, Oliveira and Santana [47] used logarithmic transformation preprocessing and iterative predictor weighting PLS to predict Ca concentrations in eucalyptus with an R2 value of 0.81 but a higher RMSEP of 1.80. Ca concentration was predicted in grapevine with a higher R2 of 0.88 using NIRS with a spectral range of 908–1676 nm [48]. Mg was predicted with acceptable R2 = 0.63 and a low RMSEP = 0.11. Other researchers could predict the Mg of leaves with a better value in other crops, as in citrus [19,43] with R2 = 0.83–0.94 but a relatively high error of RMSEP = 0.40–0.34 under laboratory conditions. Furthermore, in sugarcane, Yarce and Rojas [21] predicted Mg with an R2 = 0.97 and an RMSEP = 0.005, using multiple linear regression (MLR) and PLS-R in the spectral range of 780–2500 nm. On the contrary, Oliveira and Santana [47] were not able to predict Mg in eucalyptus leaves.
Concerning micronutrients, a relatively low correlation was found for Fe (R2 = 0.39, RMSEP = 11.56). Other researchers were also unable to predict Fe successfully, as in eucalyptus [47] or citrus [43]. The Mn concentration was predicted to a reasonably satisfactory extent (R2 = 0.69, RMSEP = 40.75). Other studies predicted Mn with reasonable accuracy, as for Valencia oranges [43]. However, as stated, this work has misconceptions, was based on few samples, and the sampling method was unreliable since the reflectance of the leaves indicated leaves with very different conditions, including reflectance that apparently corresponded to dead leaves. Additionally, for citrus, [15] reported higher results but with a particular experimental design favouring extreme variability not found in nature. B could be predicted with a high level of estimation with an R2 = 0.83 and an RMSEP = 8.59, which surpasses other works as in eucalyptus [47], in which the predicted values were less accurate (R2 = 0.68 and RMSEP = 22.66).
The positive results of this study indicate that Vis-NIR spectroscopy has excellent potential as a non-destructive diagnostic tool for estimating nutrients in persimmon leaves and improving fertilizer recommendations. The results confirmed that a portable computer-based system, such as the Vis-NIR spectrometer, can provide good predictions for the nutritional status of micro and macronutrients in persimmons. Due to its speed, affordability, and non-destructive nature, the technology can be used in precision agriculture applications that require a significant number of samples. Despite other studies reporting the use of the NIRS range for predicting nutrients in plants, this research shows that using the Vis-NIR range (430 to 1040 nm) has the potential to develop satisfactory prediction models for nutrient prediction, especially for N, P, Ca, Mn and B.
5. Conclusions
The results showed that Vis-NIR reflectance spectroscopy is a feasible technique to estimate the concentrations of macro and micronutrients in persimmon leaves throughout a complete vegetative cycle. Results achieved using spectral reflectance in the range 430–1040 nm to predict the concentration of N, P, Ca, Mn and B were satisfactory, with a coefficient of determination greater than 0.70. Lower scores were obtained for K, Mg and Fe. Moreover, the RMSEP in all cases was relatively low, which indicates a high degree of accuracy. Notwithstanding, more research is needed to know how these models, which have been developed with data for only one year, perform in succeeding years.
Author Contributions
Conceptualization A.Q., J.M.d.P., FV., J.B. and M.A.; methodology A.Q., J.M.d.P., M.A. and F.V.; software F.V. and M.A.; validation F.V. and M.A.; formal analysis A.Q., J.M.d.P., J.B., M.A. and F.V.; investigation A.Q., J.M.d.P., J.B., M.A. and F.V.; resources A.Q., J.M.d.P. and J.B.; data curation A.Q., J.M.d.P., J.B., M.A. and F.V.; writing original draft preparation M.A.; writing-review and editing, A.Q., J.M.d.P., J.B., M.A. and F.V.; supervision A.Q., J.M.d.P. and J.B.; project administration, A.Q. and J.B.; funding acquisition, A.Q., J.M.d.P. and J.B. All authors have read and agreed to the published version of the manuscript.
Funding
This work was co-funded by the Programa de Becas IFARHU-SENACYT, subprograma Becas excelencia-PNDR (Panamá, reference: 270-2021-020), the Instituto Valenciano de Investigaciones Agrarias (IVIA-GVA, SostE-SABio project: references 52204, 51920) and by the EU through the European Regional Development Fund (ERDF) from GVA 2021–2027.
Data Availability Statement
Not applicable.
Conflicts of Interest
The authors declare no conflict of interest.
References
- Morales, J.; Rodríguez-Carretero, I.; Martínez-Alcántara, B.; Canet, R.; Quiñones, A. DRIS Norms and Sufficiency Ranges for Persimmon ‘Rojo Brillante’ Grown under Mediterranean Conditions in Spain. Agronomy 2022, 12, 1269. [Google Scholar] [CrossRef]
- Menino, R. Leaf Analysis in Citrus: Interpretation Tools. In Advances in Citrus Nutrition; Springer: Dordrecht, The Netherlands, 2012; pp. 59–79. [Google Scholar] [CrossRef]
- Embleton, T.W.; Jones, W.W.; Labanauskas, C.K.; Reuther, W. Leaf analysis as a diagnostic tool and guide to fertilisation. Citrus Ind. 1973, 3, 183–210. [Google Scholar]
- Güsewell, S. N: P ratios in terrestrial plants: Variation and functional significance. New Phytol. 2004, 164, 243–266. [Google Scholar] [CrossRef]
- Bondada, B.R.; Oosterhuis, D.M. Canopy photosynthesis, specific leaf weight, and yield components of cotton under varying nitrogen supply. J. Plant Nutr. 2001, 24, 469–477. [Google Scholar] [CrossRef]
- Raghothama, K.G.; Karthikeyan, A.S. Phosphate Acquisition. Plant Soil 2005, 274, 37–49. [Google Scholar] [CrossRef]
- George, A.; Nissen, B.; Broadley, R. Persimmon Nutrition: A Practical Guide to Improving Fruit Quality and Production; Department of Primary Industries, Queensland Horticulture Institute: Indooroopilly, QLD, Australia, 2005. [Google Scholar]
- Dong, H.; Kong, X.; Li, W.; Tang, W.; Zhang, D. Effects of plant density and nitrogen and potassium fertilization on cotton yield and uptake of major nutrients in two fields with varying fertility. Field Crops Res. 2010, 119, 106–113. [Google Scholar] [CrossRef]
- Dasy, R.K.; Avasthe, S.K. Plant Nutrition Management Strategy: A Policy for Optimum Yield. Acta Sci. Agric. 2018, 2, 65–70. [Google Scholar]
- Alva, A.; Paramasivam, S.; Obreza, T.; Schumann, A. Nitrogen best management practice for citrus trees. Sci. Hortic. 2006, 107, 233–244. [Google Scholar] [CrossRef]
- Intrigliolo, F.; Tittarelli, F.; Roccuzzo, G.; Canali, S. Fertilizzazione degli agrumi. Inf. Agrar. 1998, 54, 79–86. [Google Scholar]
- Obreza, T.A.; Alva, A.K.; Hanlon, E.A.; Rouse, R.E. Citrus Grove Leaf Tissue and Soil Testing: Sampling, Analysis, and Interpretation. In Cooperative Extension Service Bulletin, SL; University of Florida: Lake Alfred, FL, USA, 1992; Volume 115, pp. 1–4. [Google Scholar]
- Shenk, J.; Westerhaus, M.; Hoover, M. Analysis of Forages by Infrared Reflectance. J. Dairy Sci. 1979, 62, 807–812. [Google Scholar] [CrossRef]
- Jones, J.B., Jr. Plant Nutrition and Soil Fertility Manual; CRC Press: Boca Raton, FL, USA, 2012. [Google Scholar]
- Pandey, P.; Ge, Y.; Stoerger, V.; Schnable, J.C. High Throughput In vivo Analysis of Plant Leaf Chemical Properties Using Hyperspectral Imaging. Front. Plant Sci. 2017, 8, 1348. [Google Scholar] [CrossRef] [PubMed]
- Da Fonseca, I.L.; Caresani, J.R.F.; Varella, A.C. Caracterização espectral multitemporal dos cereais de estação fria em imagens de satélite com média resolução espacial Multitemporal spectral characterization of cool season cereals in satellite images with moderate spatial resolution. Ciência Rural. 2010, 40, 2053–2059. [Google Scholar] [CrossRef]
- Ge, Y.; Atefi, A.; Zhang, H.; Miao, C.; Ramamurthy, R.K.; Sigmon, B.; Yang, J.; Schnable, J.C. High-throughput analysis of leaf physiological and chemical traits with VIS–NIR–SWIR spectroscopy: A case study with a maize diversity panel. Plant Methods 2019, 15, 66. [Google Scholar] [CrossRef] [PubMed]
- Zhang, X.; Liu, F.; He, Y.; Gong, X. Detecting macronutrients content and distribution in oilseed rape leaves based on hyperspectral imaging. Biosyst. Eng. 2013, 115, 56–65. [Google Scholar] [CrossRef]
- Ferwerda, J.G.; Skidmore, A. Can nutrient status of four woody plant species be predicted using field spectrometry? ISPRS J. Photogramm. Remote Sens. 2007, 62, 406–414. [Google Scholar] [CrossRef]
- Menesatti, P.; Antonucci, F.; Pallottino, F.; Roccuzzo, G.; Allegra, M.; Stagno, F.; Intrigliolo, F. Estimation of plant nutritional status by Vis–NIR spectrophotometric analysis on orange leaves [Citrus sinensis (L) Osbeck cv Tarocco]. Biosyst. Eng. 2010, 105, 448–454. [Google Scholar] [CrossRef]
- Ordoñez, C.; Rodriguez-Perez, J.R.; Moreira, J.J.; Sanz, E. Using Hyperspectral Spectrometry and Functional Models to Characterize Vine-Leaf Composition. IEEE Trans. Geosci. Remote Sens. 2012, 51, 2610–2618. [Google Scholar] [CrossRef]
- Yarce, C.J.; Rojas, G. Near infrared spectroscopy for the analysis of macro and micro nutrients in sugarcane leaves. Sugar Ind. 2012, 137, 707–710. [Google Scholar] [CrossRef]
- Chen, M.; Glaz, B.; Gilbert, R.A.; Daroub, S.H.; Barton, F.E.; Wan, Y. Near-Infrared Reflectance Spectroscopy Analysis of Phosphorus in Sugarcane Leaves. Agron. J. 2002, 94, 1324–1331. [Google Scholar] [CrossRef]
- Visconti, F.; de Paz, J.M. Non-destructive assessment of chloride in persimmon leaves using a miniature visible near-infrared spectrometer. Comput. Electron. Agric. 2019, 164, 104894. [Google Scholar] [CrossRef]
- McQuaker, N.R.; Brown, D.F.; Kluckner, P.D. Digestion of environmental materials for analysis by inductively coupled plasma-atomic emission spectrometry. Anal. Chem. 1979, 51, 1082–1084. [Google Scholar] [CrossRef]
- Steckenmesser, D.; Vogel, C.; Herzel, H.; Félix, R.; Adam, C.; Steffens, D. Thermal treatment of sewage sludge for phosphorus fertilizer production: A model experiment. J. Plant Nutr. 2022, 45, 1123–1133. [Google Scholar] [CrossRef]
- Romanov, S. The Intertech Equipment for Laboratory Analysis and Scientific Research. Sci. Innov. 2014, 10, 18–24. [Google Scholar] [CrossRef]
- Cassap, M. Method development for ICP-OES. Spectroscopy 2016, 31, 14–15. [Google Scholar]
- Bremner, J.M.; Norman, A.G. Inorganic Forms of Nitrogen. In Methods of Soil Analysis, Part 2: Chemical and Microbiological Properties; Wiley: New York, NY, USA, 2016; pp. 1179–1237. [Google Scholar] [CrossRef]
- Bertrand, D.; Dufour, E. Infrared spectroscopy and its analytical applications. In Infrared Spectroscopy and Its Analytical Applications; Editions Tec&Doc: Paris, France, 2006. [Google Scholar]
- Grassi, S.; Jolayemi, O.; Giovenzana, V.; Tugnolo, A.; Squeo, G.; Conte, P.; De Bruno, A.; Flamminii, F.; Casiraghi, E.; Alamprese, C. Near Infrared Spectroscopy as a Green Technology for the Quality Prediction of Intact Olives. Foods 2021, 10, 1042. [Google Scholar] [CrossRef] [PubMed]
- Ulissi, V.; Antonucci, F.; Benincasa, P.; Farneselli, M.; Tosti, G.; Guiducci, M.; Tei, F.; Costa, C.; Pallottino, F.; Pari, L.; et al. Nitrogen Concentration Estimation in Tomato Leaves by VIS-NIR Non-Destructive Spectroscopy. Sensors 2011, 11, 6411–6424. [Google Scholar] [CrossRef]
- Savitzky, A.; Golay, M.J.E. Smoothing and Differentiation of Data by Simplified Least Squares Procedures. Anal. Chem. 1964, 36, 1627–1639. [Google Scholar] [CrossRef]
- Barnes, R.J.; Dhanoa, M.S.; Lister, S.J. Standard Normal Variate Transformation and De-Trending of Near-Infrared Diffuse Reflectance Spectra. Appl. Spectrosc. 1989, 43, 772–777. [Google Scholar] [CrossRef]
- Alchanatis, V.; Schmilovitch, Z.; Meron, M. In-Field Assessment of Single Leaf Nitrogen Status by Spectral Reflectance Measurements. Precis. Agric. 2005, 6, 25–39. [Google Scholar] [CrossRef]
- Li, Y.; Sun, Y.; Jiang, J.; Liu, J. Spectroscopic determination of leaf chlorophyll content and color for genetic selection on Sassafras tzumu. Plant Methods 2019, 15, 73. [Google Scholar] [CrossRef] [PubMed]
- Tobias, R.D. An introduction to partial least squares regression. In Proceedings of the Twentieth Annual SAS Users Group International Conference; SAS Institute Inc.: Cary, NC, USA., 1995; pp. 1250–1257. [Google Scholar]
- Wold, S.; Sjöström, M.; Eriksson, L. PLS-regression: A basic tool of chemometrics. Chemom. Intell. Lab. Syst. 2001, 58, 109–130. [Google Scholar] [CrossRef]
- Cawley, G.C.; Talbot, N.L. Efficient leave-one-out cross-validation of kernel fisher discriminant classifiers. Pattern Recognit. 2003, 36, 2585–2592. [Google Scholar] [CrossRef]
- Cheng, J.-H.; Sun, D.-W. Partial Least Squares Regression (PLSR) Applied to NIR and HSI Spectral Data Modeling to Predict Chemical Properties of Fish Muscle. Food Eng. Rev. 2017, 9, 36–49. [Google Scholar] [CrossRef]
- Johnson, J.-M.; Sila, A.; Senthilkumar, K.; Shepherd, K.D.; Saito, K. Application of infrared spectroscopy for estimation of concentrations of macro- and micronutrients in rice in sub-Saharan Africa. Field Crops Res. 2021, 270, 108222. [Google Scholar] [CrossRef]
- Albiach, R.; Climent, C.; Canet, R.; Pomares, F. Soil Fertility and Nutritional State of Persimmon Rojo Brillante Plantations in the Ribera Alta (Valencia, Spain). Commun. Soil Sci. Plant Anal. 2012, 43, 2767–2776. [Google Scholar] [CrossRef]
- Osco, L.P.; Ramos, A.P.M.; Pinheiro, M.M.F.; Moriya, A.S.; Imai, N.N.; Estrabis, N.; Ianczyk, F.; de Araújo, F.F.; Liesenberg, V.; Jorge, L.A.D.C.; et al. A Machine Learning Framework to Predict Nutrient Content in Valencia-Orange Leaf Hyperspectral Measurements. Remote Sens. 2020, 12, 906. [Google Scholar] [CrossRef]
- Rotbart, N.; Schmilovitch, Z.; Cohen, Y.; Alchanatis, V.; Erel, R.; Ignat, T.; Shenderey, C.; Dag, A.; Yermiyahu, U. Estimating olive leaf nitrogen concentration using visible and near-infrared spectral reflectance. Biosyst. Eng. 2012, 114, 426–434. [Google Scholar] [CrossRef]
- Wang, J.; Shen, C.; Liu, N.; Jin, X.; Fan, X.; Dong, C.; Xu, Y. Non-Destructive Evaluation of the Leaf Nitrogen Concentration by In-Field Visible/Near-Infrared Spectroscopy in Pear Orchards. Sensors 2017, 17, 538. [Google Scholar] [CrossRef] [PubMed]
- Wang, J.; Zhao, H.-b; Shen, C.-w.; Chen, Q.-w.; Dong, C.-x.; Xu, Y.-c. Determination of Nitrogen Concentration in Fresh Pear Leaves by Visible/Near-Infrared Reflectance Spectroscopy. Agron. J. 2014, 106, 1867–1872. [Google Scholar] [CrossRef]
- De Oliveira, L.F.R.; Santana, R.C. Estimation of leaf nutrient concentration from hyperspectral reflectance in Eucalyptus using partial least squares regression. Sci. Agric. 2020, 77, 1–10. [Google Scholar] [CrossRef]
- Cuq, S.; Lemetter, V.; Kleiber, D.; Levasseur-Garcia, C. Assessing macro- (P, K, Ca, Mg) and micronutrient (Mn, Fe, Cu, Zn, B) concentration in vine leaves and grape berries of vitis vinifera by using near-infrared spectroscopy and chemometrics. Comput. Electron. Agric. 2020, 179, 105841. [Google Scholar] [CrossRef]


Disclaimer/Publisher’s Note: The statements, opinions and data contained in all publications are solely those of the individual author(s) and contributor(s) and not of MDPI and/or the editor(s). MDPI and/or the editor(s) disclaim responsibility for any injury to people or property resulting from any ideas, methods, instructions or products referred to in the content. |
© 2023 by the authors. Licensee MDPI, Basel, Switzerland. This article is an open access article distributed under the terms and conditions of the Creative Commons Attribution (CC BY) license (https://creativecommons.org/licenses/by/4.0/).