Article

Residual Carbon Derived from Different Maize Parts Differed in Soil Organic Carbon Fractions as Affected by Soil Fertility

1
College of Land and Environment, Shenyang Agricultural University, Shenyang 110866, China
2
National Engineering Research Center for Efficient Utilization of Soil and Fertilizer, National Development and Reform Commission, Shenyang 110866, China
3
Key Laboratory of Arable Land Conservation in Northeast China, Ministry of Agriculture and Rural Affairs, Shenyang 110866, China
*
Author to whom correspondence should be addressed.
Agronomy 2023, 13(4), 1121; https://doi.org/10.3390/agronomy13041121
Submission received: 7 March 2023 / Revised: 10 April 2023 / Accepted: 12 April 2023 / Published: 14 April 2023
(This article belongs to the Special Issue Effects of Arable Farming Measures on Nutrient Dynamics)

Abstract

:
Maize straw returning is one of the important measures to improve dryland soil organic carbon (SOC). However, the effects of different maize parts on SOC fractions with different soil fertility levels in situ are not exactly clear. Therefore, an in situ field incubation experiment over 540 days, by adding different 13C-labeled maize parts (root, stem and leaf) into low- (no fertilizer treatment) and high- (manure treatment) fertility soils, was conducted at a long-term brown earth experimental site in Shenyang of China to figure out the effects of different maize parts on SOC fractions (dissolved organic carbon (DOC) and particulate organic carbon (POC)). The results showed that the distribution–DOC ratio of low-fertility treatment was higher than that of high-fertility treatment in the period of rapid decomposition of straw. In both low- and high-fertility soils, the ratio of carbon to DOC in leaf residue was higher than that in root and stem residues. The proportion of root, stem and leaf residue converted to DOC in low-fertility soil was 4.51%, 3.89% and 5.00%, respectively. The proportion of root, stem and leaf residue converted to DOC in high-fertility soil was 4.10%, 3.65% and 4.11%, respectively. As for the distribution–POC ratio, during the period of rapid decomposition of straw, the ratio of carbon conversion from root and stem residue to POC was generally higher than that from leaf residue. The ratio of carbon conversion to POC of root, stem and leaf residues in high-fertility treatment was higher than that in low-fertility treatment. In low-fertility treatment, the proportion of root, stem and leaf residues converted to POC was 41.34%, 46.33% and 36.11%, respectively. The proportion of root, stem and leaf residue converted to POC in high-fertility soil was 46.48%, 44.45% and 41.14%, respectively. The results showed that, for DOC, a low fertility level and more leaf residue types were beneficial. While, for POC, root and stem residues with a high fertility level were beneficial. These results provide evidence that the addition of different parts of maize residues would have differing effects on DOC and POC. Leaf residues in low-fertility soils were more suitable for increasing DOC. Root and stem residues in high-fertility soils were more suitable for increasing POC. Nevertheless, we could not ignore the unmeasured SOC fractions that some of the residues could be converted to.

1. Introduction

Soil is the largest organic carbon pool in terrestrial ecosystems, and its carbon pool capacity exceeds the sum of vegetation and atmospheric storage [1]. Soil organic carbon can provide nutrients for vegetation growth and maintain the good physical structure of the soil. Soil organic carbon (SOC) plays an important role in the global carbon cycle and in mitigating climate change [2]. In particular, soil labile organic carbon is the first link in the turnover of the soil organic carbon pool and serves as an early-warning indicator of soil fertility and environmental health changes. Most studies classify it into dissolved organic carbon, microbial biomass carbon, easily oxidized organic carbon, light group of organic carbon and particulate organic carbon [3,4,5]. In terms of the transformation capacity and characterization contents of each component, dissolved organic carbon (DOC) mainly represents the transformation capacity, while particulate organic carbon (POC) mainly represents the fixed trend, that is, the tendency to transformation of carbon components that are difficult to decompose, which is considered as the main index to describe the transformation and fixation of soil labile organic carbon [6,7,8].
Many studies have shown that the application of exogenous organic matter can improve the level of soil organic carbon [9]. Some studies have found that increasing the input of exogenous organic matter is an important measure to improve the turnover capacity of soil organic carbon, maintain and increase the level of soil organic matter and improve soil fertility [10]. The addition of exogenous organic materials effectively increased the soil organic carbon content, which was conducive to soil organic carbon accumulation and soil stability [11]. Maize straw (including root, stem and leaf residues) is one of the main sources of exogenous organic matter in farmland soil, which not only provides physical protection for the soil but also improves soil organic matter, biological activity and nutrient availability. Maize straw return to the field is a vital agronomic practice for increasing soil organic carbon and its labile fractions, as well as soil aggregates and organic carbon associated with water-stable aggregates [12]. In addition, it can increase soil aggregate, structure and organic carbon activity and improve soil fertility [13]. As an important source of soil organic carbon, straw returning not only promoted SOC decomposition but also increased the total soil organic carbon content. Crop residue improvement is an effective measure to increase soil organic carbon content and soil productivity [13]. Straw returning significantly increased soil total organic carbon and particulate organic carbon content. Moreover, combined application of nitrogen fertilizer can increase soil organic matter content and microbial activity, which is helpful to improve soil fertility [14]. Previous studies showed that the contents of total organic carbon, microbial biomass carbon and particulate organic carbon in the surface soil increased significantly after 2~10 years of straw returning to the field [8]. It was also found that the conversion and accumulation of soil organic carbon (especially labile organic carbon) in the rhizosphere of maize straw after returning to the field were different due to the different carbon compounds and C/N factors derived from different crop residues [15,16,17]. However, the quantitative difference in situ derived by different crop residues on soil labile organic carbon components was still unclear.
Therefore, an in situ experiment for 540 days was carried on at a long-term (over 30 years) experiment site of dryland soil in northeast China by means of a tracing method of 13C-labeled maize root, stem and leaf residue addition. The total soil organic carbon (total SOC) and its δ13C signature, soil labile organic carbon components including dissolved soil organic carbon (DOC) and its δ13C signature and soil particulate organic carbon (POC) and its δ13C signature were measured periodically. Moreover, the ratio of straw carbon in total SOC and those DOC fractions were calculated as well. We hypothesized that low-fertility soil would promote more added residue carbon to DOC, while high-fertility soil would promote more to POC. In addition, more carbon from leaf residue was distributed to DOC than from root and stem residues, but root and stem residues were more likely to contribute to POC.

2. Materials and Methods

2.1. Study Site and Tested Materials

The in-situ experiment was carried out at a long-term brown earth site (41.82° N, 123.57° E) of Shenyang Agricultural University in northeast China. This site is flat with an elevation of 75 m and is located in the northern temperate continental monsoon climate zone with a cold and dry winter and a concentrated high temperature and rainy summer condition. The annual average temperature, the annual average precipitation, the accumulated temperature over 10 °C and the frost-free period are 7.5 °C, 706 mm, 3350 °C and 153 days, respectively. The local soil type was classified as brown earth (a Hapli-Udic Alfisol according to the U.S. soil taxonomy), which was developed on a loess-like parent material, showing there is no hydrochloric acid reaction in the whole profile. The site was established in the spring of 1987 with continuous cultivation of maize in the recent 30 years, with conventional field management for sowing and fertilizing. The harvest to remove the maize straw were around 25 September every year. The plowing of the soil and sowing were in the end of April of next year. The fertilizers used were applied to the soil as base fertilizers. In this study, the tested topsoil (0–20 cm) with two fertility levels was collected in October 2018. After removing impurities, those samples were air-dried and passed through a 2 mm sieve for utilization in the in situ experiment. The basic properties of the tested soil are shown in Table 1.
Maize residue labeled with stable 13C isotope was obtained by a 13C pulse labeling test [18]. The labeling experiment was carried out on a fine day of the summer in 2014, and 13CO2 gas was produced by the reaction of HCl (2 M) and Na213CO3 (99% atom % 13C, Sigma-Aldrich, Shanghai). The marking chamber was composed of transparent agricultural plastic film and adjustable support (length, width and height of 5 m, 1 m and 1.5 m, respectively). The gap between the marking chamber and the soil was sealed with wet soil. Before injecting the 13CO2, a vacuum pump was used to extract CO2 from the labeling room (2.2 m length × 0.5 m width, covered 20 plants). After starving plants for a period of time, the 13CO2 gas was injected to improve the absorption and assimilation rate of 13CO2. After injecting 13CO2 gas into the marking room, the fan was started at the same time to fully mix the gas in the marking room. Maize residues were harvested and washed at autumn maturity, blanked for 30 min at 105 °C and dried to constant weight at 60 °C. Then, the roots, stems and leaves of the maize residues were separated with scissors and cut into small pieces, which were crushed with a straw crusher and passed through a 40-mesh sieve (0.425 mm) for the in situ experiment. In addition, a small amount of the crushed residue was ground with a hybrid grinder (Retsch MM 200, Germany) to determine its basic physical and chemical properties. The total carbon content, total nitrogen content and the δ13C value of the labeled maize root residue were 40.75%, 1.25% and 208.82‰, respectively. Those of the labeled maize stem residue were 44.08%, 1.44% and 252.70‰, respectively, and those of the labeled maize leaf residue were 42.80%, 1.25% and 234.92‰, respectively.

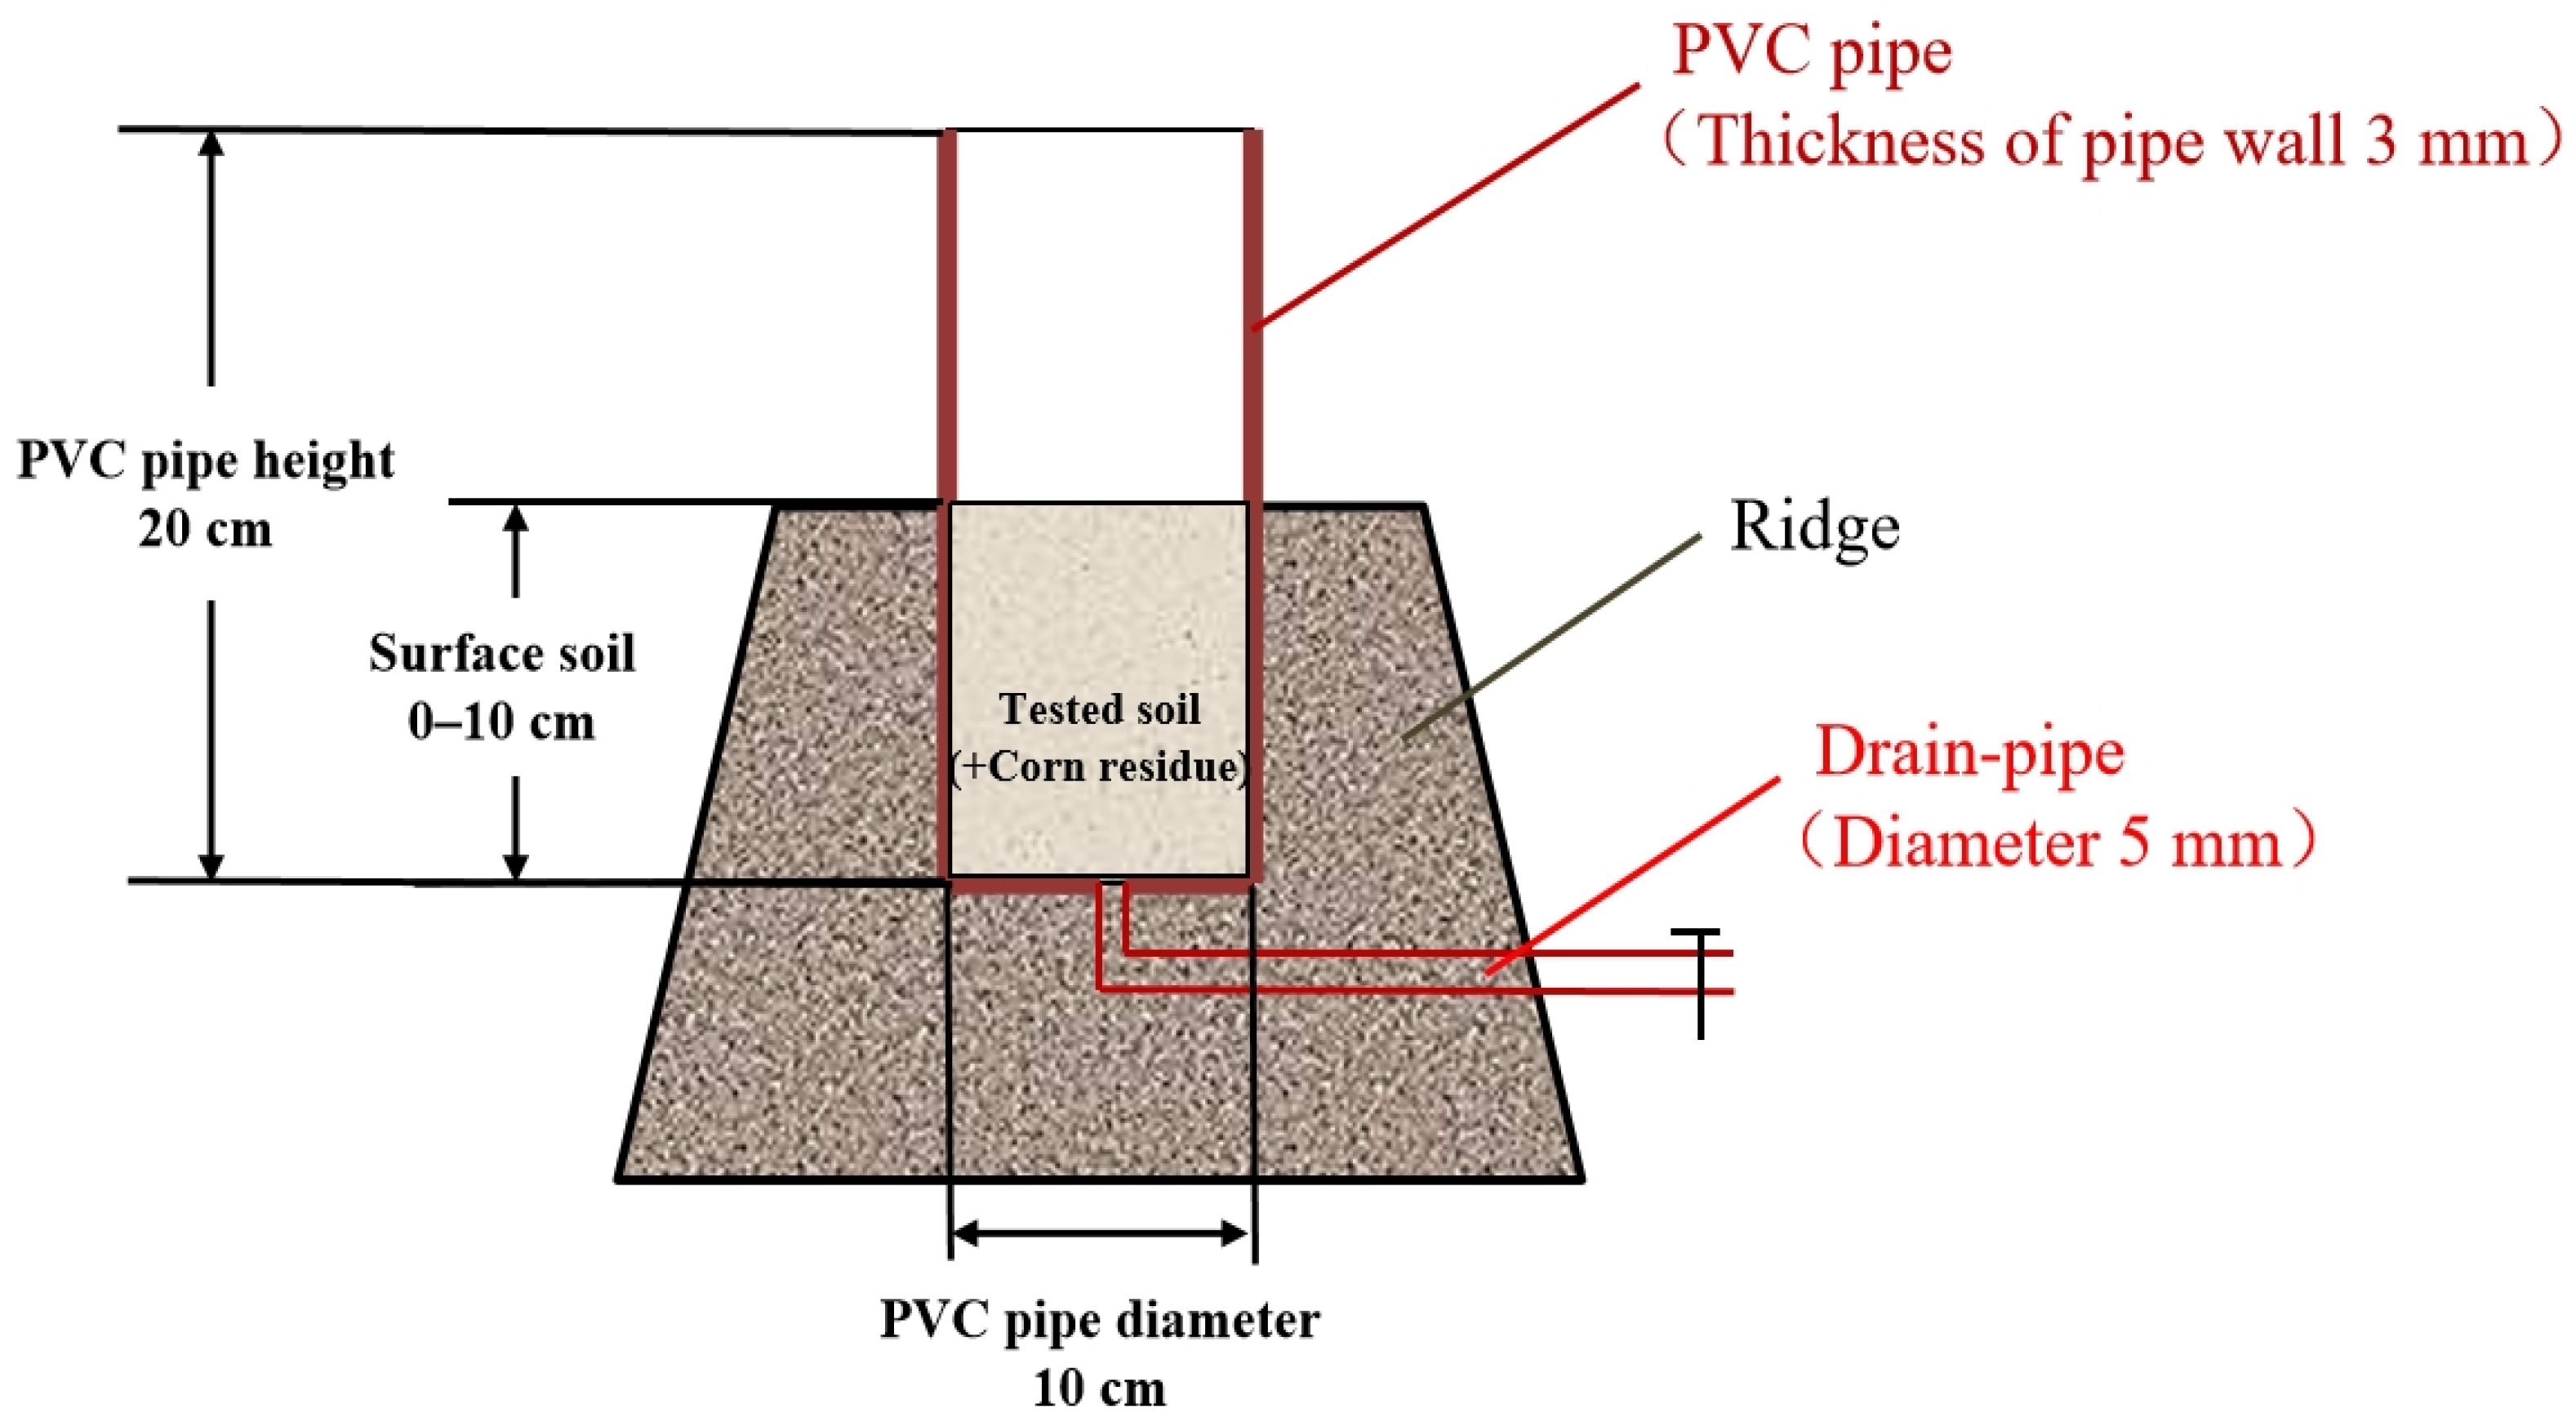
2.2. In Situ Experiment Design and Sampling

A total of 120 experimental devices were set up in this experiment (1 PVC device represented 1 replicate), including 2 kinds of soil fertility (low and high), 3 kinds of maize residue addition (root, stem and leaf) and 1 control treatment without any residue addition. Each treatment was designed to have 3 replicates. A total of 8 treatments were administered: (1) low-fertility soil (LF); (2) low-fertility soil plus root residue (LF + R); (3) low-fertility soil plus stem residue (LF + S); (4) low-fertility soil plus leaf residue (LF + L); (5) high-fertility soil (HF); (6) high-fertility soil plus root residue (HF + R); (7) high-fertility soil plus stem residue (HF + S); (8) high-fertility soil plus leaf residue (HF + L).
The 13C-labeled root, stem and leaf of maize residues were ground by a 0.425 mm sieve. Then, 1000 g soil samples (equivalent to the weight of dried soil) and 10 g maize residues samples were mixed, respectively, and distilled water was added to adjust the water content to reach 70% field water capacity in each mixed treatment. A blank control treatment had no maize residues but only the water content was adjusted to reach 70% field water capacity. Then, each mixed sample was filled into a designed device (Figure 1) and vertically buried into the surface layer (0–20 cm) of the ridge in the corresponding soil plot treated by fertilization on 2 June 2019 (the upper end of the PVC pipe was about 10 cm above the ground, as shown in Figure 1), and no crops were planted in each PVC pipe. The PVC pipe device had an inner diameter of 10 cm, a height of 20 cm and a wall thickness of about 3 mm. The bottom was sealed except for a hole linking to a hard PVC water pipe (5 mm in diameter). The water pipe was usually used to adjust the soil water content in the PVC device. The soil temperature and water content inside were monitored on the sampling day (5, 20, 60, 180 and 540 days, starting with all the PVC pipes buried), with a soil temperature and water content TDR meter from IMKO TRIME-PICO 64, Germany. For each sampling period, the control valve of the water pipe was first closed to reduce DOC loss in the samples, and then the whole PVC pipes of all treatments were removed from the field.

2.3. Determination of Soil Organic Carbon Fractions

2.3.1. Total Soil Organic Carbon

After sampling, the soil samples were taken back to the laboratory to air dry. The air-dried soil samples were ground to pass a 0.15 mm sieve, which were examined using elemental analyzer–stable isotope ratio mass spectrometry (EA-IRMS) to get the sample’s values of total soil organic carbon (SOC) and its δ13C.

2.3.2. Soil Dissolved Organic Carbon

The soil’s dissolved organic carbon (DOC) was extracted with a K2SO4 solution. The soil sample was transferred to a 100 mL oscillation flask, and 40 mL of 0.5 mol L−1 K2SO4 solution was added. All the flasks were oscillated at 25 °C for 30 min (180 r min−1), and then centrifuged for 15 min with a speed of 4000 r min−1. After centrifugation, the supernatant was filtered using a 0.45 µm filter membrane. The filtrate was freeze-dried and ground until it passed through a 0.15 mm sieve. The soil dissolved organic carbon (DOC) and δ13C values were determined using EA-IRMS.

2.3.3. Soil Particulate Organic Carbon

The soil particulate organic carbon (POC) was extracted using the sodium hexametaphosphate dispersion method. The air-dried soil (equivalent to 10 g oven-dried soil) after passing through a 2 mm sieve was put into 150 mL triangular bottle, and 30 mL of sodium hexametaphosphate solution with a concentration of 5 g L−1 was added. Those bottles were oscillated in a reciprocating oscillator for 15 h (180 r min−1). The dispersed soil solution was passed through a 0.053 mm filter membrane and rinsed with DI water several times. Furthermore, the residual materials left on the membrane were oven dried at 50 ℃ and weighed before being ground to pass through a 0.15 mm sieve to determine soil particulate organic carbon content and δ13C value using EA-IRMS.

2.4. Calculations

The contribution rate of different maize residues’ carbon to the soil organic carbon fractions was calculated using the following formula [19]):
F maize ( % ) = δ 13 C add   δ 13 C ck   δ 13 C maize 0   δ 13 C ck × 100
where Fmaize (%) represents the contribution rate derived from maize residues in the treatment of maize residue plus soil. δ13Cadd and δ13Cck represent the δ13C values (‰) of soil organic carbon fractions in the treatments of maize residue plus soil and soil alone, respectively. δ13Cmaize0 represents the δ13C value (‰) of the initially added maize residue.
The content of soil organic carbon derived from maize straw (Mplant, g kg−1) was calculated using the following formula:
M plant ( g   kg 1 ) = M × F maize / 100
where M (g kg−1) represents the soil organic carbon fraction content in each treatment of maize residue plus soil.
The distributions of the residue C to DOC or POC (D, %) were calculated using the following formula:
D ( % ) = M plant / C maize 0 × 100
where D (%) represents the ratio of maize residues’ carbon distributed in DOC or POC fractions to the initial corresponding added maize residues’ C. Cmaize0 represents the C content (g kg−1) of the initial added maize residue.

2.5. Statistical Analysis

All statistical tests were performed using SPSS Statistical 23 software (IBM Corporation, New York, USA). The significant difference in different treatments was determined using ANOVA analysis and Duncan’s test. Figures were generated using the Origin 2018 program (Origin Lab, Northampton, MA, USA).

3. Results

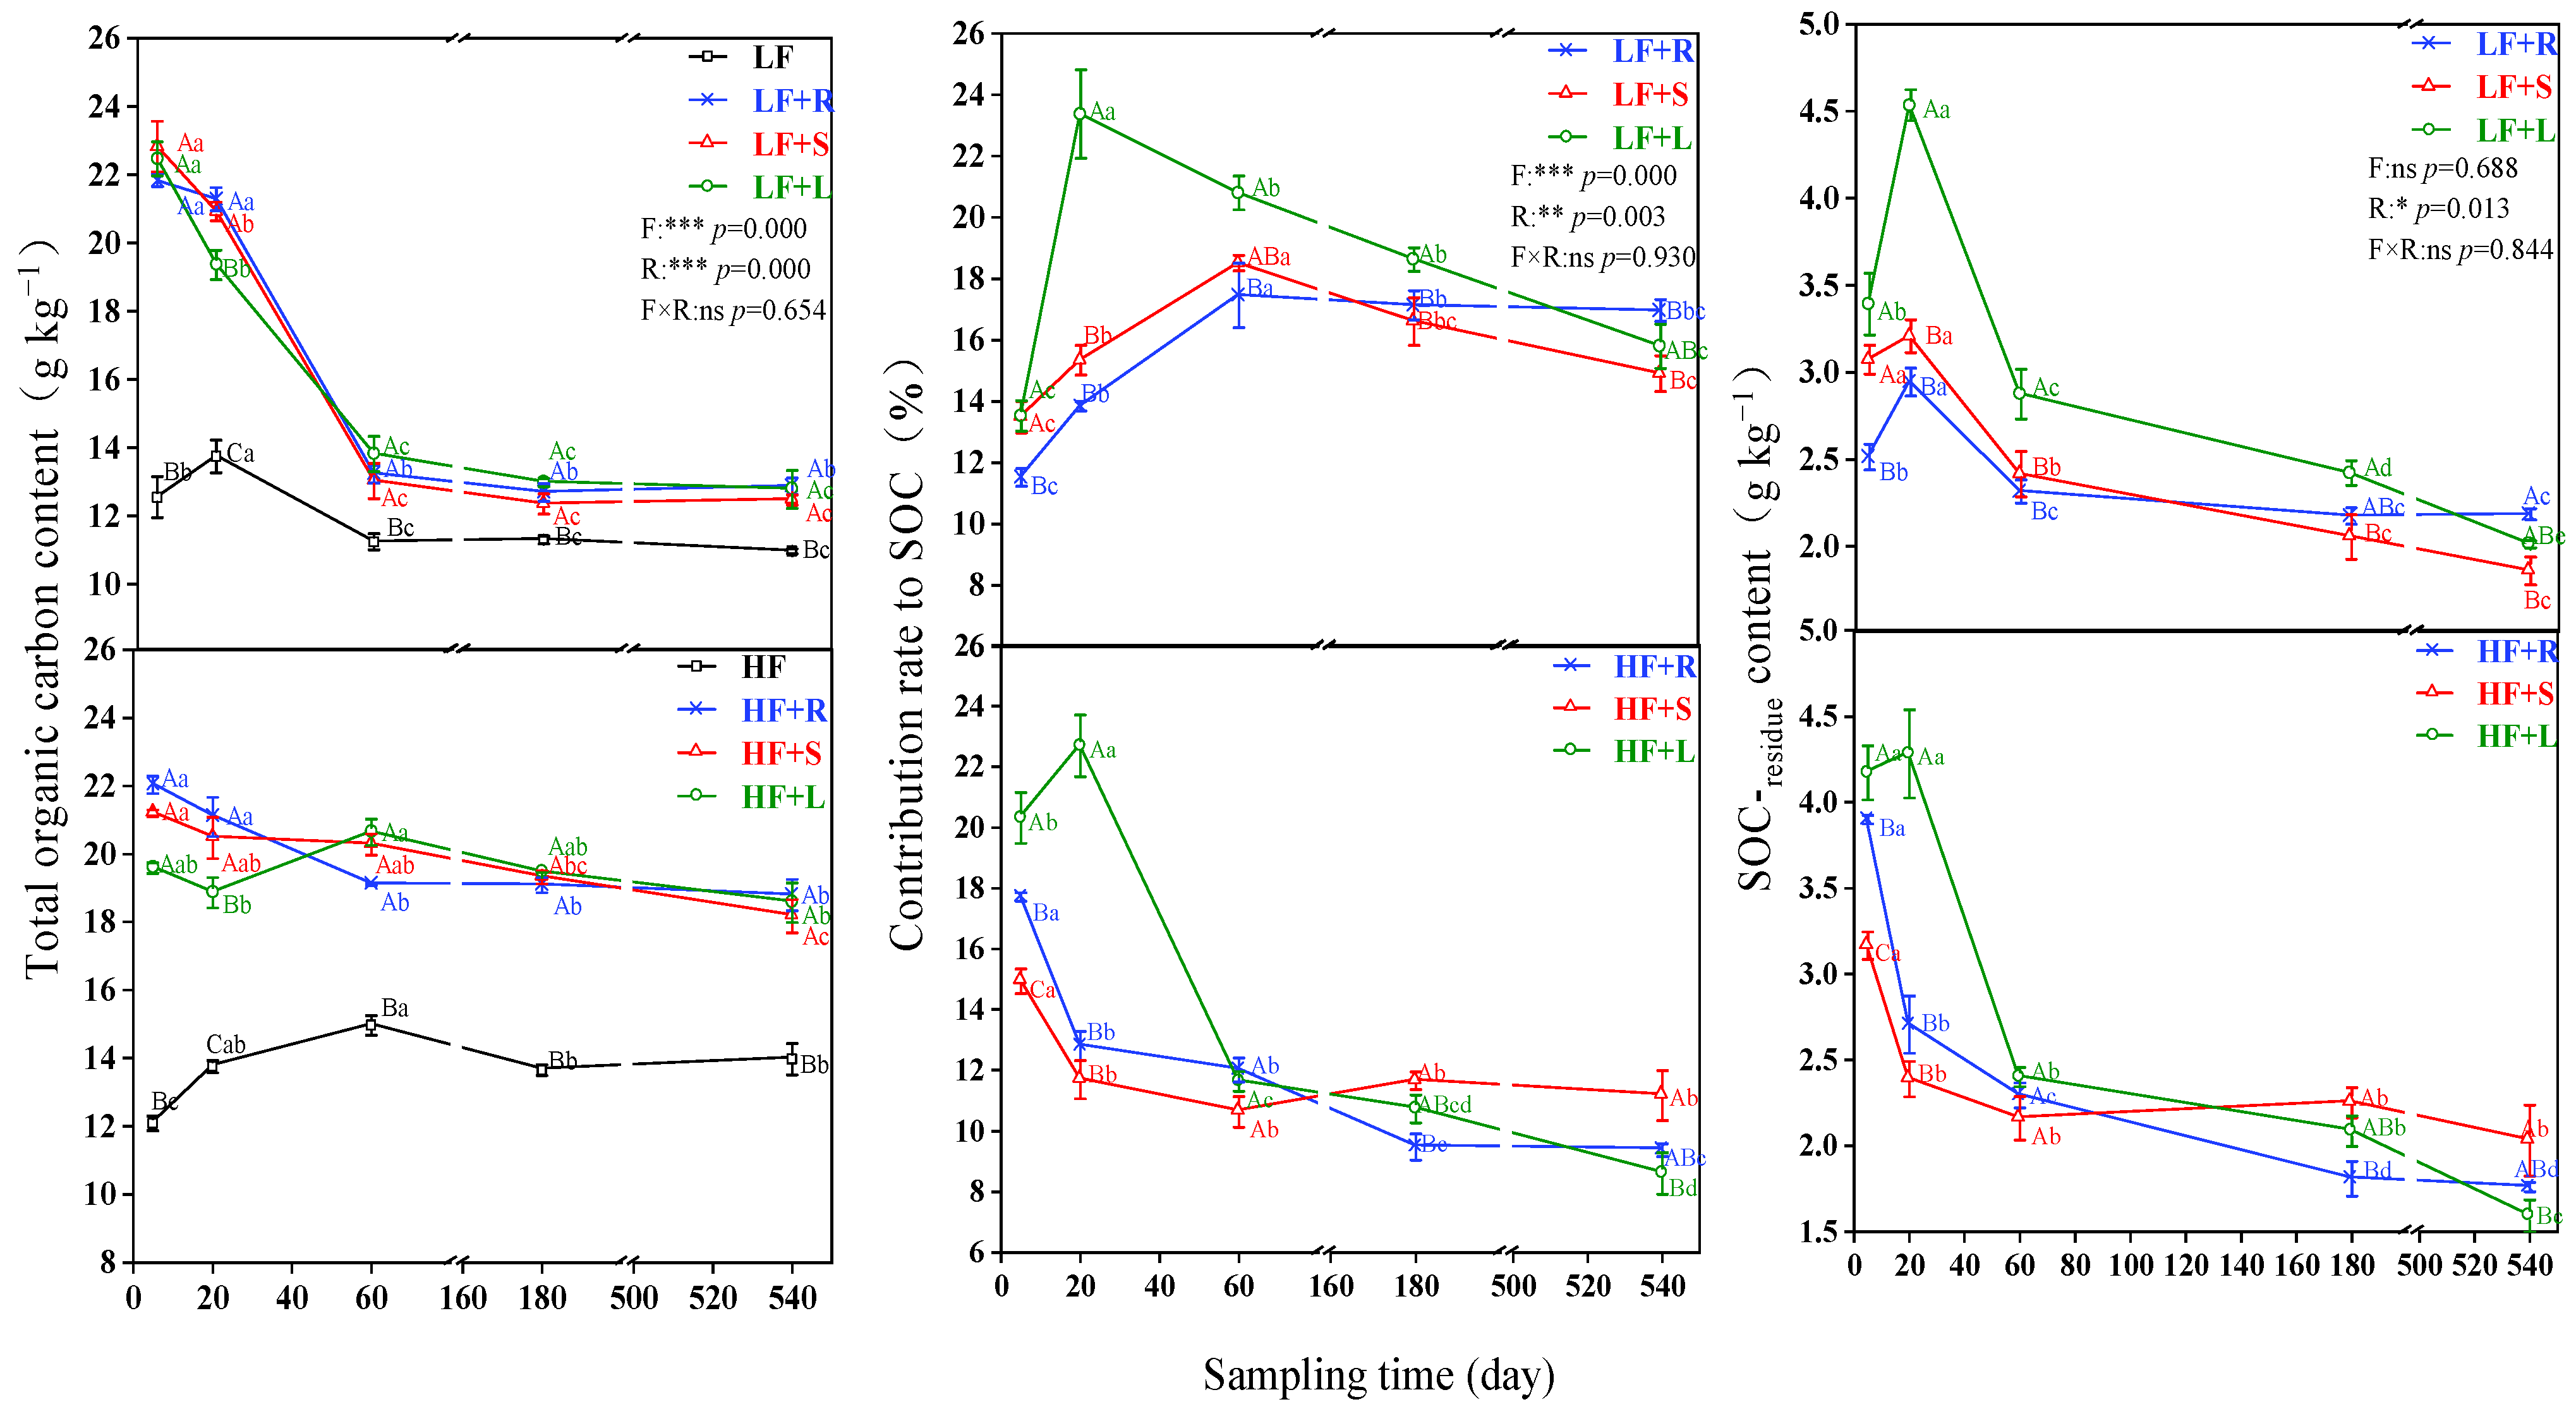
3.1. Distribution of Different Straw Carbon in SOC

After returning maize straw to the field, the SOC content increased, with a significant effect according to fertility level or residue type (p < 0.001). The SOC-residue derived from the residues of root, stem and leaf showed significant difference as well (p < 0.05). During the 540-day incubation period, the content of SOC-residue of different straw types showed a trend of general decline over time (Figure 2). In both low- and high-fertility treatments, the indices fluctuated greatly in the first 60 days (Figure 2) and then changed slowly. In low-fertility soil, the leaf carbon content of SOC was generally higher than that of root and stem carbon contents before 180 days. During the 540-day incubation period, the peak value appeared on the 20th day of sampling in the low-fertility treatment, the content of SOC-residue was 2.94 g kg−1 (LF + R), 3.21 g kg−1 (LF + S) and 4.53 g kg−1 (LF + L). It appeared on the fifth day of sampling in the high-fertility treatment, with peak values of 3.90 g kg−1 (HF + R), 3.16 g kg−1 (HF + S) and 4.28 g kg−1 (HF + L); meanwhile, the content of SOC-residue in the HF + L treatment was similar on the 5th day and the 20th day.

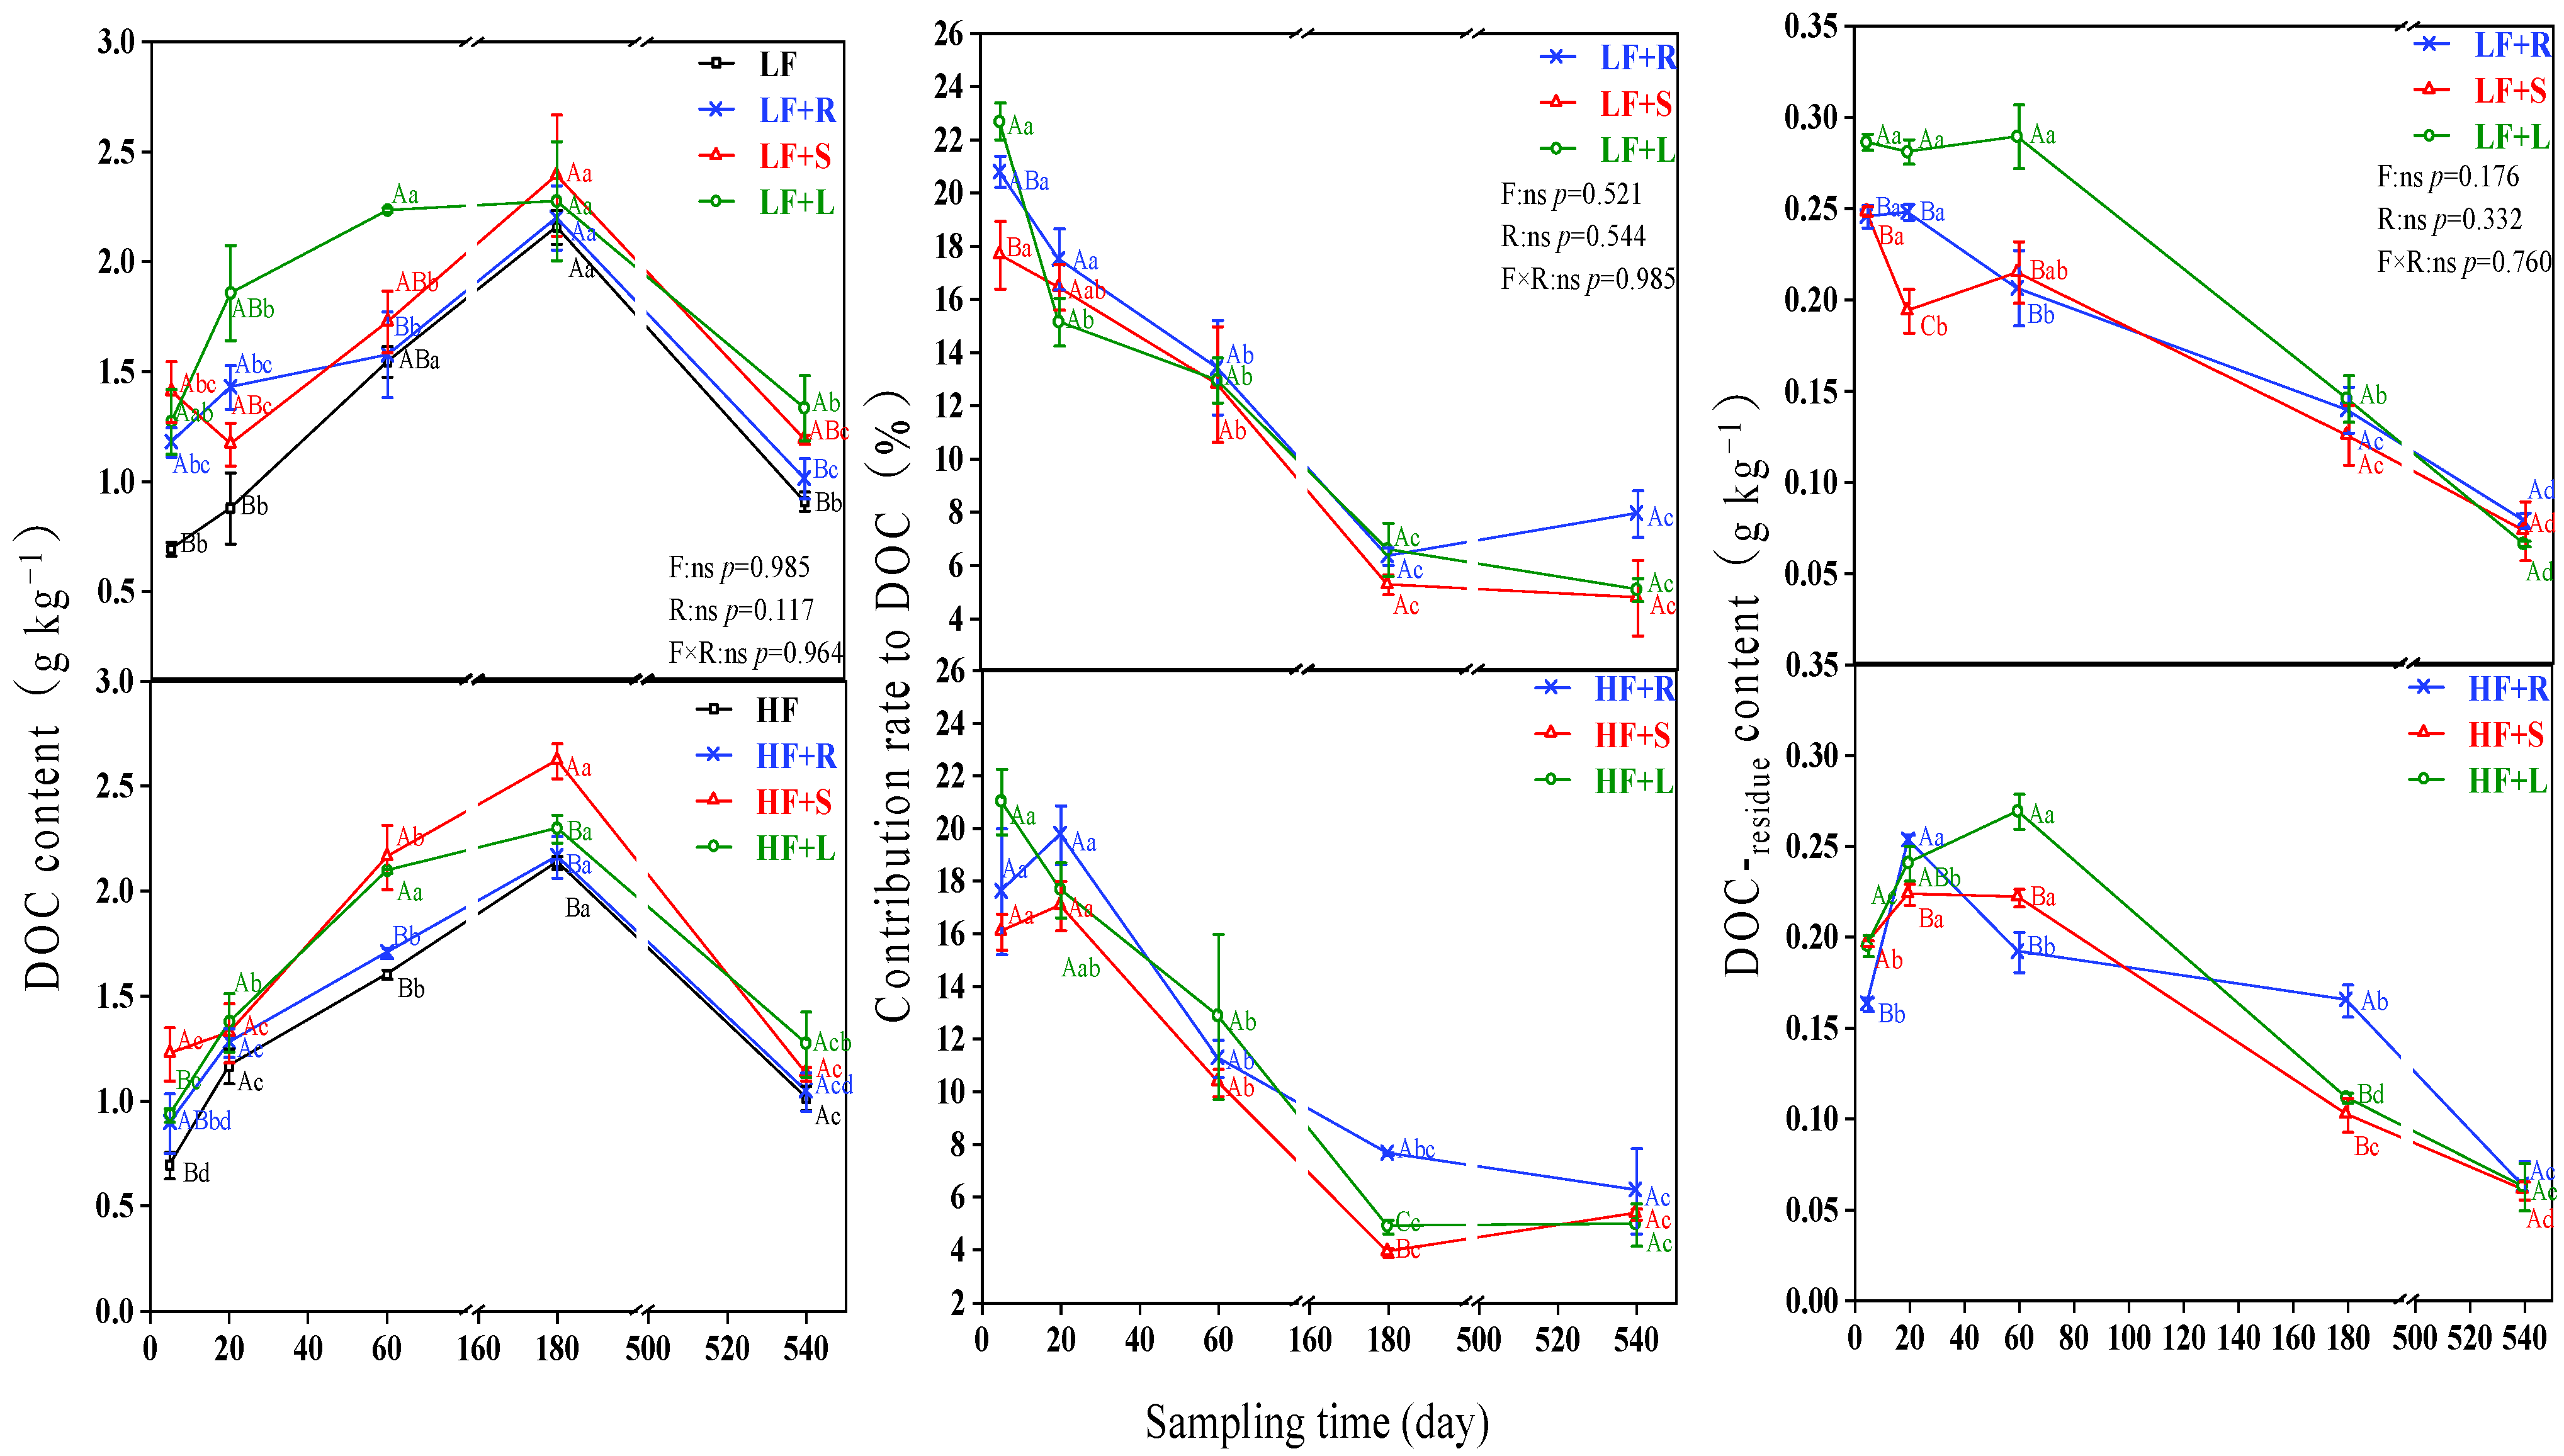
3.2. Distribution of Different Straw in DOC in Soils with Different Fertility

DOC content was increased before 180 days during the 540-day incubation period after returning maize straw to the field. The content of DOC-residue with different residue types showed a fluctuating downward trend (Figure 3). Before 180 days of the incubation period, the content of DOC-residue in leaf residues was higher than that in root and stem residues, while it showed an opposite trend after 180 days. At the beginning (on the fifth day of sampling), the content of DOC-residue in the low-fertility treatment was higher than that in the high-fertility treatment, with the contents of 0.24 g kg−1 (LF + R), 0.25 g kg−1 (LF + S) and 0.29 g kg−1 (LF + L), respectively. Moreover, in the high-fertility treatment it was 0.16 g kg−1 (HF + R), 0.20 g kg−1 (HF + S) and 0.20 g kg−1 (HF + L), respectively.

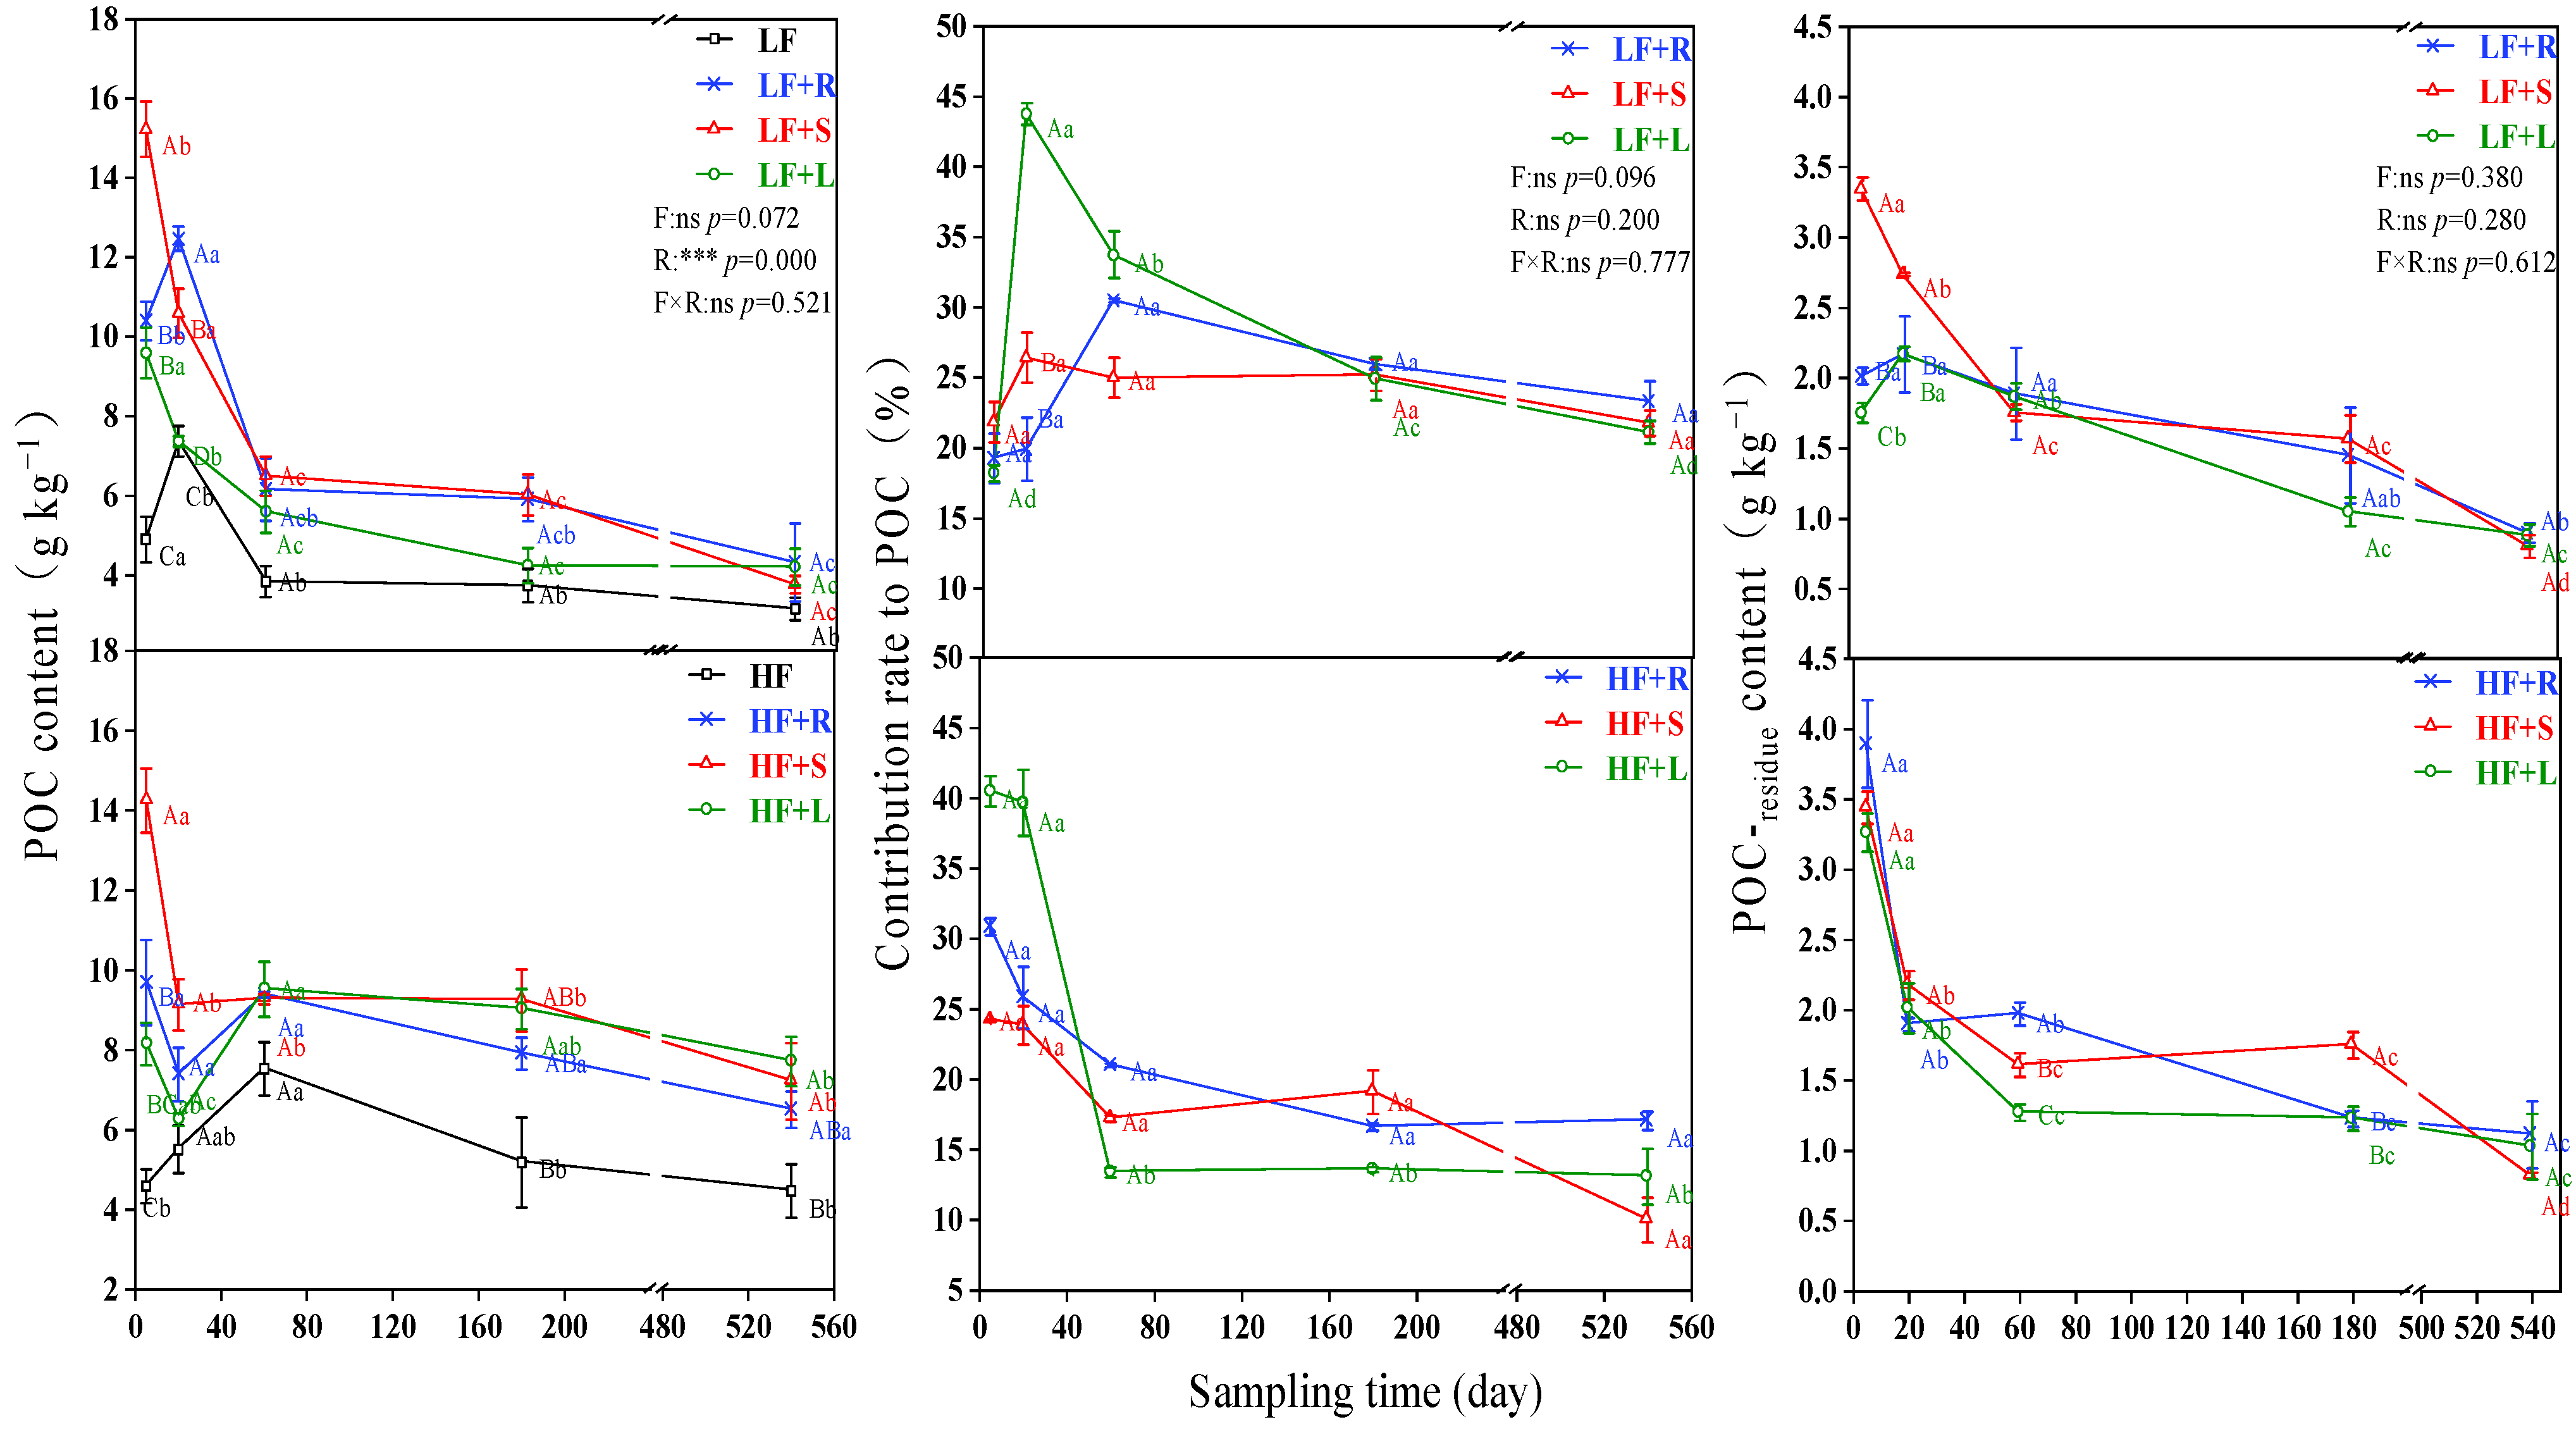
3.3. Distribution of Different Straw in POC in Soils with Different Fertility

The POC content also increased after returning maize straw to field. Over the incubation period, the content of POC-residue with different straw types showed a fluctuating downward trend (Figure 4). POC derived from root and stem residues was generally higher than that from leaf residue except for the first 60 days. Meanwhile, on the fifth day of sampling, POC derived from stem residue in the low-fertility treatment was higher than that of root and stem residues, with values of 3.35 g kg−1 (LF + S), 2.01 g kg−1 (LF + R) and 1.75 g kg−1 (LF + L), respectively. A similar trend was also observed in the high-fertility treatment, with values of 3.89 g kg−1 (HF + R), 3.44 g kg−1 (HF + S) and 3.26 g kg−1 (HF + L), respectively.

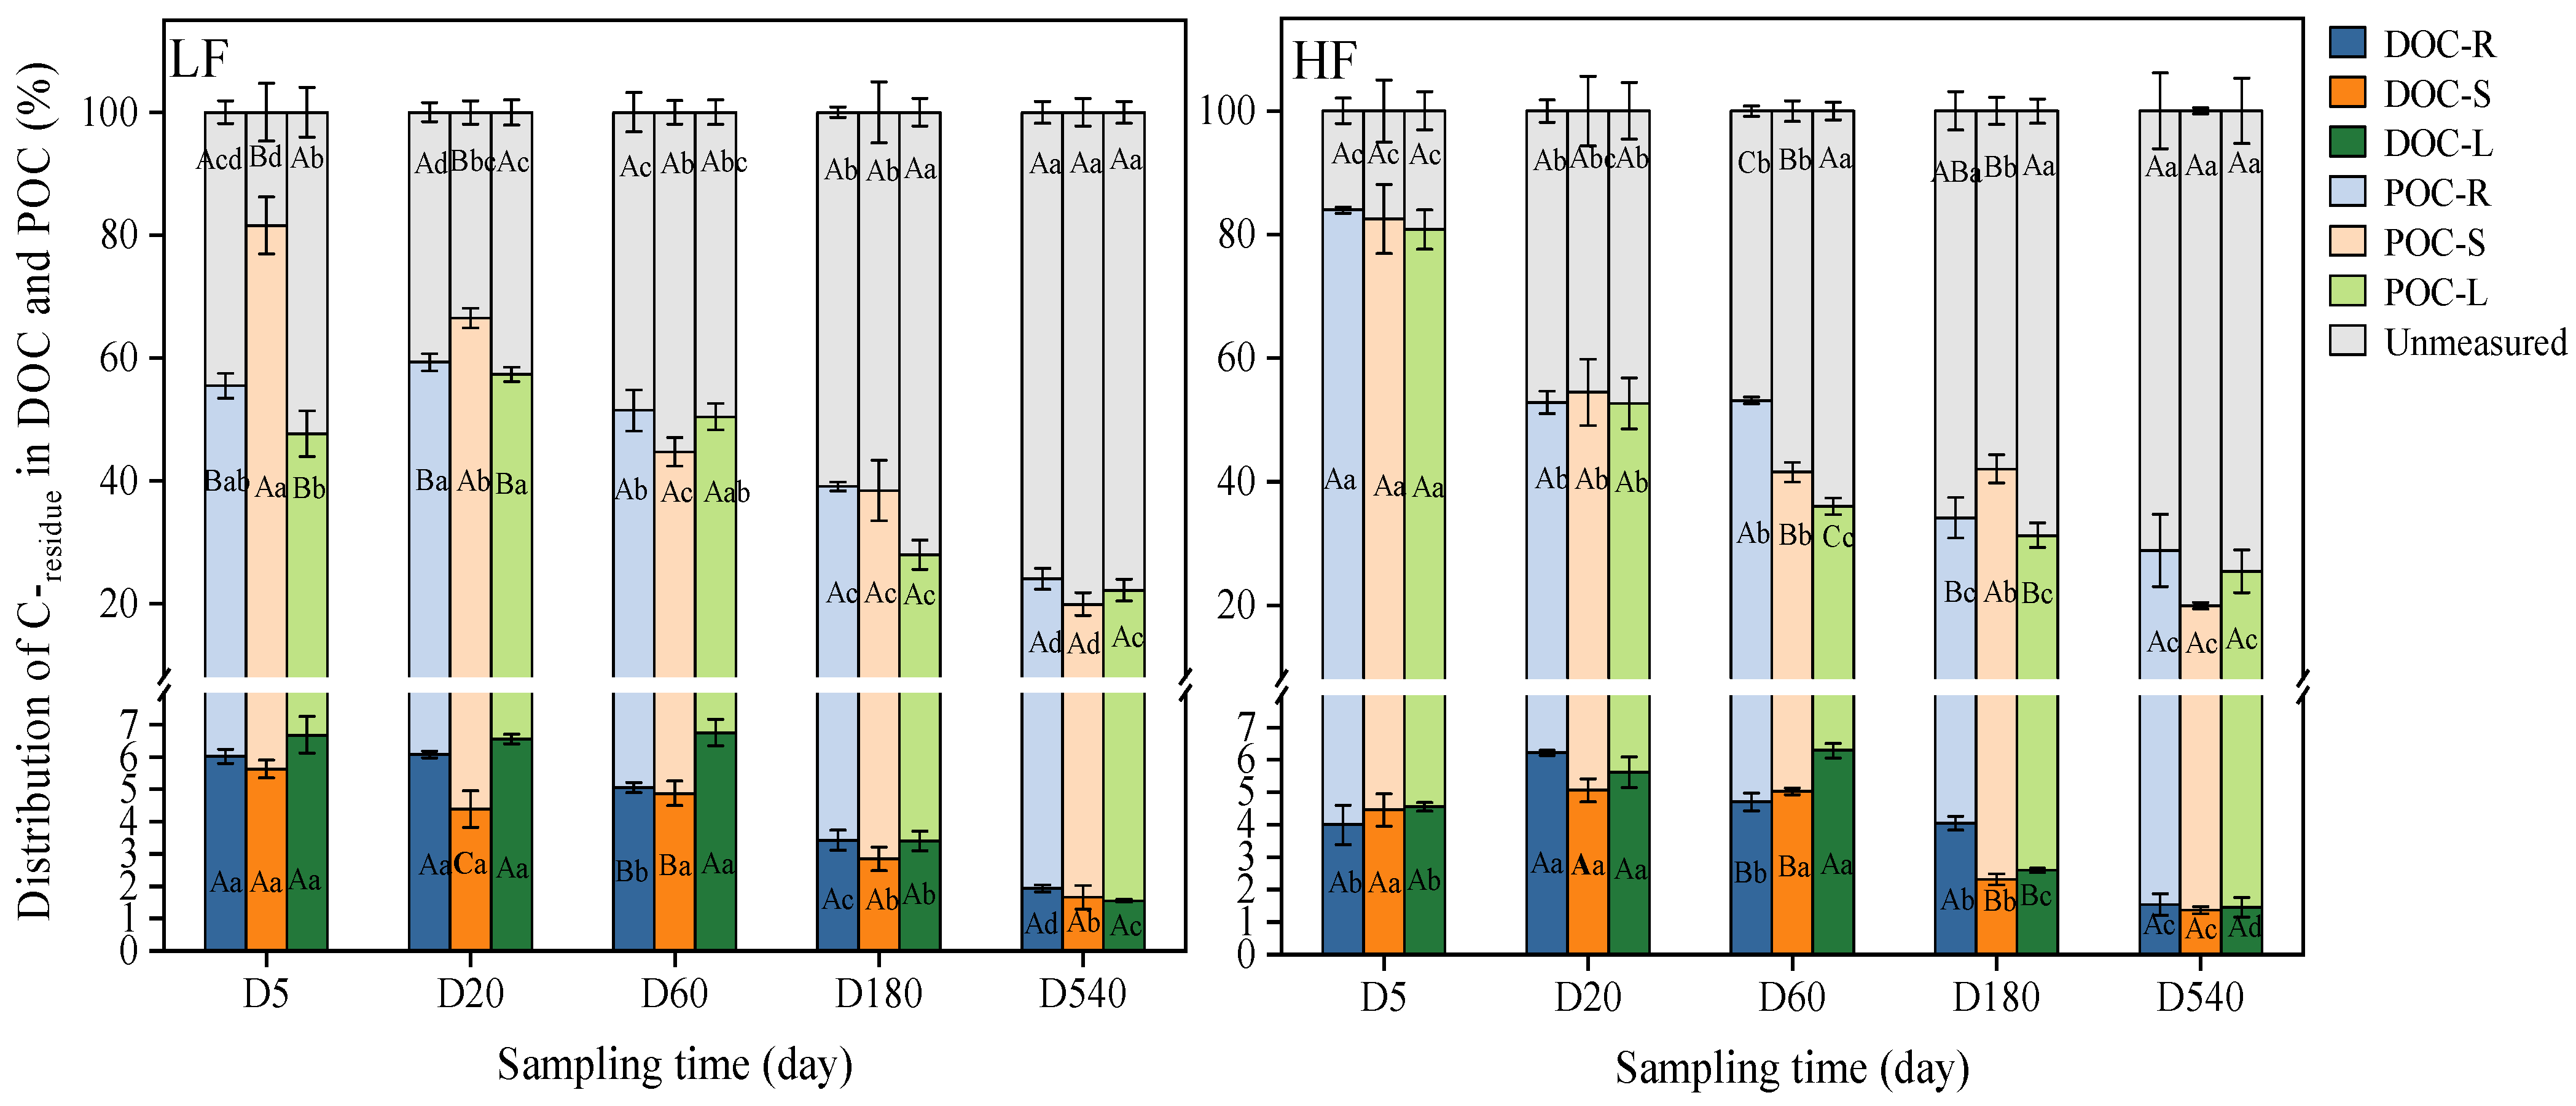
3.4. Distribution of C-residue among SOC Fractions

Figure 5 shows the distribution situation of the ratio (C derived from root, stem or leaf in soil and the initial corresponding C in root, stem or leaf) of C-residue among the fractions of DOC, POC and unmeasured parts (such as C-gas lost, other labile organic fractions or recalcitrant C fractions that we did not measure in this study). The trends of DOC and POC showed a general fluctuation and decline, while the unmeasured parts showed the opposite trend.
The distribution of C-residue ratio in DOC was significantly affected by sampling time, fertility level and residue type (p < 0.01); moreover, there was an interaction between the sampling time and residue type (p < 0.01), sampling time and fertility level (p < 0.001) and sampling time, fertility level and residue type (p < 0.01) (Table 2). During the 60-day incubation period, the ratio of residual carbon in DOC in the low-fertility treatment was higher than that in high-fertility treatment. In both low-fertility and high-fertility treatments, DOC derived from leaf residue was generally higher than that from root and stem residues.
The distribution of C-residue ratio in POC was significant affected by sampling time (p < 0.001), fertility level (p < 0.001) and residue type (p < 0.001), and there was an interaction between sampling time and residue type (p < 0.001), sampling time and fertility level (p < 0.001), fertility level and residue type (p < 0.01) and even among these three factors (p < 0.01) (Table 2). POC derived from the root and stem residues was higher than that from the leaf residue in the soil at both fertility levels. On the fifth day of sampling, the C-residue ratio in POC in the high-fertility treatments was generally higher than that in the low-fertility treatments (Figure 5). In addition, we also calculated the unmeasured fractions’ ratio that was not determined, showing a generally fluctuating increase trend, with the significant differences (p < 0.01) based on one factor, between any two factors, and among three factors (Table 2).

4. Discussion

4.1. Impact of Residue Types on DOC in the Soil

The maize residues’ carbon content decreased over the incubation time (Figure 3). During the 60-day incubation period, the content of DOC-residue fluctuated greatly because the decomposition of the easily decomposed components was fast and fluctuated greatly in the early stage of maize residue decomposition [20,21], especially in the low-fertility soil that was lacking an organic carbon source, thereby needing more exogenous organic carbon [22,23]. In the first 180 days of incubation, the content of DOC-residue in leaf residue was higher than that in root and stem residues, mainly more-soluble carbohydrate, cellulose and hemicellulose in the leaf residues would be decomposed quickly and used, while more-recalcitrant C components such as lignin components in the root and stem residues were relatively slowly decomposed [16,24]. After 180 days, the recalcitrant C components would be more decomposed, so root addition treatments contributed more significantly than the treatments with stem or leaf residue [22,24,25]. Additionally, the degradation degree of lignin in leaves was lower than that of root and stem residues, so the content of DOC-residue in root and stem residues was higher than in leaf residues at the later stage of incubation [16,26,27]. With the extension of the incubation time, residues were gradually decomposed and utilized by microorganisms [28,29,30]. The peak content of DOC-residue was different in the root residue treatments from that of the stem and leaf residues treatments. This is because of the formation of monosaccharides, amino acids and amino sugars in the early stage of residue decomposition. These substances in high-fertility conditions would induce a surge in microbial reproduction [31,32,33], which would utilize a large amount of these residual decomposition substances, resulting in a low content of DOC in the soil. In the early stage of the residues’ decomposition, DOC was mainly released in the form of CO2 and a lesser amount was stored in the soil. Later, with the enhancement of microbial activity, the degradation of microbial metabolites, dead microbial remains, cellulose and lignin would increase DOC content in soil [32,34].

4.2. Impact of Residue Types on POC in the Soil

The content of POC-residue derived from root and stem residues was generally higher than that in leaf residues, mainly because POC would be allocated by more-recalcitrant C components such as lignin in the root and stem residues, and relatively less easily-decomposed components such as carbohydrate, cellulose and hemicellulose in leaf residues [16,24]. Because of this, during the 540-day incubation period, the distribution differences of POC-residue ratio derived from root and stem residues in the treatments to the initial maize straw addition suggested that, because the root and stem residues contain more lignin and hemicellulose substances than leaf residues, the decomposition process of lignin and hemicellulose into the soil would favor POC [32,35,36]. Furthermore, soil fertility also regulates the decomposition of residues. High-fertility soil would contain a higher microbial biomass, more enzyme activity and better soil structure. Thus, a suitable environment could be created for microorganisms to use the substrates. Instead, low-fertility soils might be carbon deficient, limiting the metabolic activity of microorganisms, which would potentially affect the process of decomposition and transformation of maize residues in soil [37]. Previous studies reported the differences in C mineralization in the initial stage; meanwhile, after 365 days of culture, there was no significant difference in maize residue types (root, stem and leaf) [38]. Similarly, our results also showed (Figure 2, Figure 3 and Figure 4) that the residues’ carbon contribution was similar, namely the trend fluctuated in the short time but a relatively stable situation occurred with prolonged incubation time.

4.3. Impact of Residue Types and Fertility on Different SOC Fractions

Exogenous carbon added into the soil would be distributed into different soil organic carbon fractions such as labile or recalcitrant fractions or even converted to gas and lost. Our study focused on the labile organic fractions, where the soil organic carbon is quickly turned over. The residues’ quality differences among root, stem and leaf in maize residues could lead to the transformation and accumulation of soil labile organic carbon fractions and a difference in microbial utilization of different carbon sources [15,16,17]. Previous studies found that the leaf residues contained more-easily-decomposed components, such as sugars, cellulose and hemicellulose, and the root and stem residues contained more lignin components that were not easily decomposed [16,24], so the leaf residues could be decomposed and utilized quickly. Thus, regardless of low- or high-fertility treatments, residue C derived from the leaf residue was more easily distributed to the DOC fraction, showing that the DOC-residue derived from leaf residue was higher than that from the root and stem residues (Figure 3). Moreover, residue C derived from the root or stem residue was more easily distributed to the POC fraction, due to the accumulation of more slowly decomposing substances. In addition, the fertility level influenced the maize straw C distribution into the DOC or POC fraction. Meanwhile, low fertility due to lack of carbon or nutrients that would promote exogenous maize straw C decomposition and conversion to DOC. Moreover, high fertility due to relatively enriched carbon or nutrients would reduce the decomposition of exogenous maize straw C at the beginning time, which would give a chance that exogenous C could be decomposed slowly and converted to POC or even allow recalcitrant C fractions to be stored [22,23,39]. However, it should not be ignored that there were still some other organic carbon fractions that our study did not measure or pay attention to, such as microbial biomass carbon fraction and other labile organic carbon fractions, lost fractions (CO2 or leaching from the drainage pipe) and even recalcitrant C fractions [7,40,41].

5. Conclusions

Different parts of maize residues had important different effects on DOC and POC, specially affected by soil fertility (Figure 6). The distribution of the added residues’ carbon in low fertility was more conducive to DOC. Compared with the root and stem residues, the leaf residues were more likely to contribute to DOC. The added residues’ carbon in high fertility was more conducive to forming POC. Compared with the leaf residues, carbon derived from the root and stem residues was more likely to contribute to POC. Additionally, we could not ignore the unmeasured fractions that would also fix some of the maize carbon. Those results indicated that the addition of crop residues was effective for SOC, DOC and POC components. Distinguishing between the different crop straw parts returning to the field could give a differentiation strategy to furthermore improve soil organic matter and even fertility.

Author Contributions

J.P. proposed and designed the research. M.W. conducted experimental operations, analyzed statistics and wrote the manuscript. Y.Y. and S.W. assisted the test operation. J.P. reviewed the manuscript. All authors have read and agreed to the published version of the manuscript.

Funding

This work is supported by the National Key R&D Program of China (2022YFD1500204, 2021YFD1500204, Ministry of Science and Technology, China), the National Natural Science Foundation of China (41807086, National Science Foundation, China) and the Black Land Special Project for Shenyang Science and Technology Plan in 2021 (21-109-3-04, Shenyang Science and Technology Bureau, China).

Data Availability Statement

Data available on request due to restrictions eg privacy or ethical. The data presented in this study are available on request from the corresponding author. The data are not publicly available due to the first authors are still under their researches.

Conflicts of Interest

The authors declare no conflict of interest.

References

  1. Batjes, N.H. Total carbon and nitrogen in the soils of the world. Eur. J. Soil Sci. 2014, 65, 10–21. [Google Scholar] [CrossRef]
  2. Li, Y.; Wang, X.; Chen, Y.; Luo, Y.; Lian, J.; Niu, Y.; Gong, X.; Yang, H.; Yu, P. Changes in surface soil organic carbon in semiarid degraded Horqin Grassland of northeastern China between the 1980s and the 2010s. Catena 2018, 174, 217–226. [Google Scholar] [CrossRef]
  3. Oladele, S.O.; Adetunji, A.T. Agro-residue biochar and N fertilizer addition mitigates CO2-C emission and stabilized soil organic carbon pools in a rain-fed agricultural cropland. Int. Soil Water Conserv. Res. 2021, 9, 76–86. [Google Scholar] [CrossRef]
  4. Benbi, D.K.; Brar, K.; Toor, A.S.; Sharma, S. Sensitivity of Labile Soil Organic Carbon Pools to Long–Term Fertilizer, Straw and Manure Management in Rice-Wheat System. Pedosphere 2015, 25, 534–545. [Google Scholar] [CrossRef]
  5. Bongiorno, G.; Bunemann, E.K.; Oguejiofor, C.U.; Meier, J.; Gort, G.; Comans, R.; Mader, P.; Brussaard, L.; de Goede, R. Sen-sitivity of labile carbon fractions to tillage and organic matter management and their potential as comprehensive soil quality indicators across pedoclimatic conditions in Europe. Ecol. Indic. 2019, 99, 38–50. [Google Scholar] [CrossRef]
  6. Roper, M.M.; Gupta, V.V.S.R.; Murphy, D.V. Tillage practices altered labile soil organic carbon and microbial function without affecting crop yields. Soil Res. 2010, 48, 274–285. [Google Scholar] [CrossRef]
  7. Tang, H.; Xiao, X.; Li, C.; Pan, X.; Cheng, K.; Shi, L.; Li, W. Short-term responses of soil organic carbon and its labile fractions to different manure Nitrogen input in a double-cropping rice field. J. Agric. Sci. 2020, 158, 119–127. [Google Scholar] [CrossRef]
  8. Xu, M.; Lou, Y.; Sun, X.; Wang, W.; Baniyamuddin, M.; Zhao, K. Soil organic carbon active fractions as early indicators for total carbon change under straw incorporation. Biol. Fertil. Soils 2011, 47, 745–752. [Google Scholar] [CrossRef]
  9. Tang, H.; Xiao, X.; Li, C.; Tang, W.; Cheng, K.; Pan, X.; Wang, K.; Li, W. Effects of Different Soil Tillage Systems on Soil Carbon Management Index Under Double-Cropping Rice Field in Southern China. Agron. J. 2019, 111, 440–447. [Google Scholar] [CrossRef]
  10. Tang, H.; Cheng, K.; Shi, L.; Li, C.; Wen, L.; Li, W.; Sun, M.; Sun, G.; Long, Z. Effects of long-term organic matter application on soil carbon accumulation and nitrogen use efficiency in a double-cropping rice field. Environ. Res. 2022, 213, 113700. [Google Scholar] [CrossRef] [PubMed]
  11. Jin, Z.; Shah, T.; Zhang, L.; Liu, H.; Peng, S.; Nie, L. Effect of straw returning on soil organic carbon in rice–wheat rotation system: A review. Food Energy Secur. 2020, 9, e200. [Google Scholar] [CrossRef] [Green Version]
  12. Ndzelu, B.S.; Dou, S.; Zhang, X. Corn straw return can increase labile soil organic carbon fractions and improve water-stable aggregates in Haplic Cambisol. J. Arid. Land 2020, 12, 1018–1030. [Google Scholar] [CrossRef]
  13. Li, S.; Gu, X.; Zhuang, J.; An, T.; Pei, J.; Xie, H.; Li, H.; Fu, S.; Wang, J. Distribution and storage of crop residue carbon in aggregates and its contribution to organic carbon of soil with low fertility. Soil Tillage Res. 2016, 155, 199–206. [Google Scholar] [CrossRef]
  14. Li, Z.; Li, D.; Ma, L.; Yu, Y.; Zhao, B.; Zhang, J. Effects of straw management and nitrogen application rate on soil organic matter fractions and microbial properties in North China Plain. J. Soils Sediments 2018, 19, 618–628. [Google Scholar] [CrossRef]
  15. Rubino, M.; Lubritto, C.; D’Onofrio, A.; Terrasi, F.; Gleixner, G.; Cotrufo, M.F. An isotopic method for testing the influence of leaf litter quality on carbon fluxes during decomposition. Oecologia 2007, 154, 155–166. [Google Scholar] [CrossRef]
  16. Clemente, J.S.; Simpson, M.J.; Simpson, A.J.; Yanni, S.F.; Whalen, J.K. Comparison of soil organic matter composition after incubation with maize leaves, roots, and stems. Geoderma 2013, 192, 86–96. [Google Scholar] [CrossRef]
  17. Shahbaz, M.; Kuzyakov, Y.; Sanaullah, M.; Heitkamp, F.; Zelenev, V.; Kumar, A.; Blagodatskaya, E. Microbial decomposition of soil organic matter is mediated by quality and quantity of crop residues: Mechanisms and thresholds. Biol. Fertil. Soils 2017, 53, 287–301. [Google Scholar] [CrossRef]
  18. An, T.; Schaeffer, S.; Li, S.; Fu, S.; Pei, J.; Li, H.; Zhuang, J.; Radosevich, M.; Wang, J. Carbon fluxes from plants to soil and dynamics of microbial immobilization under plastic film mulching and fertilizer application using 13C pulse-labeling. Soil Biol. Biochem. 2015, 80, 53–61. [Google Scholar] [CrossRef]
  19. De Troyer, I.; Amery, F.; Van Moorleghem, C.; Smolders, E.; Merckx, R. Tracing the source and fate of dissolved organic matter in soil after incorporation of a 13C labelled residue: A batch incubation study. Soil Biol. Biochem. 2011, 43, 513–519. [Google Scholar] [CrossRef]
  20. Sun, L.; Sun, Z.; Hu, J.; Yaa, O.-K.; Wu, J. Decomposition Characteristics, Nutrient Release, and Structural Changes of Maize Straw in Dryland Farming under Combined Application of Animal Manure. Sustainability 2021, 13, 7609. [Google Scholar] [CrossRef]
  21. Meng, F.; Dungait, J.A.; Xu, X.; Bol, R.; Zhang, X.; Wu, W. Coupled incorporation of maize (Zea mays L.) straw with nitrogen fertilizer increased soil organic carbon in Fluvic Cambisol. Geoderma 2017, 304, 19–27. [Google Scholar] [CrossRef]
  22. Kelleher, B.P.; Simpson, A.J. Humic substances in soils, are they really chemically distinct. Environ. Sci. Technol. 2006, 70, 4080–4094. [Google Scholar] [CrossRef] [PubMed]
  23. Machinet, G.E.; Bertrand, I.; Chabbert, B.; Recous, S. Decomposition in soil and chemical changes of maize roots with genetic variations affecting cell wall quality. Eur. J. Soil Sci. 2009, 60, 176–185. [Google Scholar] [CrossRef]
  24. Kögel-Knabner, I. The macromolecular organic composition of plant and microbial residues as inputs to soil organic matter: Fourteen years on. Soil Biol. Biochem. 2017, 105, A3–A8. [Google Scholar] [CrossRef]
  25. Guggenberger, G.; Christensen, B.; Zech, W. Land-use effects on the composition of organic matter in particle-size separates of soil: I. Lignin and carbohydrate signature. Eur. J. Soil Sci. 1994, 45, 449–458. [Google Scholar] [CrossRef]
  26. Guillaumie, S.; San-Clemente, H.; Deswarte, C.; Martinez, Y.; Lapierre, C.; Murigneux, A.; Barrière, Y.; Pichon, M.; Goffner, D. MAIZEWALL. Database and Developmental Gene Expression Profiling of Cell Wall Biosynthesis and Assembly in Maize. Plant Physiol. 2006, 143, 339–363. [Google Scholar] [CrossRef] [Green Version]
  27. Hatfield, R.D.; Chaptman, A.K. Comparing Corn Types for Differences in Cell Wall Characteristics and p-Coumaroylation of Lignin. J. Agric. Food Chem. 2009, 57, 4243–4249. [Google Scholar] [CrossRef]
  28. Shahbaz, M.; Kätterer, T.; Thornton, B.; Börjesson, G. Dynamics of fungal and bacterial groups and their carbon sources during the growing season of maize in a long-term experiment. Biol. Fertil. Soils 2020, 56, 759–770. [Google Scholar] [CrossRef] [Green Version]
  29. Wei, L.; Ge, T.; Zhu, Z.; Ye, R.; Peñuelas, J.; Li, Y.; Lynn, T.M.; Jones, D.L.; Wu, J.; Kuzyakov, Y. Paddy soils have a much higher microbial biomass content than upland soils: A review of the origin, mechanisms, and drivers. Agric. Ecosyst. Environ. 2021, 326, 107798. [Google Scholar] [CrossRef]
  30. Wang, B.; An, S.; Liang, C.; Liu, Y.; Kuzyakov, Y. Microbial necromass as the source of soil organic carbon in global ecosystems. Soil Biol. Biochem. 2021, 162, 108422. [Google Scholar] [CrossRef]
  31. Xu, Y.; Gao, X.; Liu, Y.; Li, S.; Liang, C.; Lal, R.; Wang, J. Differential accumulation patterns of microbial necromass induced by maize root vs. shoot residue addition in agricultural Alfisols. Soil Biol. Biochem. 2021, 164, 108474. [Google Scholar] [CrossRef]
  32. Zhu, Z.; Ge, T.; Hu, Y.; Zhou, P.; Wang, T.; Shibistova, O.; Guggenberger, G.; Su, Y.; Wu, J. Fate of rice shoot and root residues, rhizodeposits, and microbial assimilated carbon in paddy soil–Part 2: Turnover and microbial utilization. Plant Soil 2017, 416, 243–257. [Google Scholar] [CrossRef]
  33. Zheng, X.D.; Liang, C.M.; Chen, X.B.; Hu, Y.J.; Qiu, H.S.; Xia, Y.H.; Liu, Z.Z.; Wei, L.; Ge, T.D.; Gunina, A.; et al. Plant res-idue-derived hydrophilic and hydrophobic fractions contribute to the formation of soil organic matter. Biol. Fertil. Soils 2021, 57, 1021–1028. [Google Scholar] [CrossRef]
  34. Liang, C.; Amelung, W.; Lehmann, J.; Kästner, M. Quantitative assessment of microbial necromass contribution to soil organic matter. Glob. Chang. Biol. 2019, 25, 3578–3590. [Google Scholar] [CrossRef]
  35. Blaud, A.; Lerch, T.; Chevallier, T.; Nunan, N.; Chenu, C.; Brauman, A. Dynamics of bacterial communities in relation to soil aggregate formation during the decomposition of 13C-labelled rice straw. Appl. Soil Ecol. 2012, 53, 1–9. [Google Scholar] [CrossRef]
  36. Cui, S.; Liang, S.; Zhang, X.; Li, Y.; Liang, W.; Sun, L.; Wang, J.; Bezemer, T.M.; Li, Q. Long-term fertilization management affects the C utilization from crop residues by the soil micro-food web. Plant Soil 2018, 429, 335–348. [Google Scholar] [CrossRef]
  37. Bell, J.M.; Smith, J.L.; Bailey, V.L.; Bolton, H. Priming effect and C storage in semi-arid no-till spring crop rotations. Biol. Fertil. Soils 2003, 37, 237–244. [Google Scholar] [CrossRef]
  38. Xu, Y.; Ding, F.; Gao, X.; Wang, Y.; Li, M.; Wang, J. Mineralization of plant residues and native soil carbon as affected by soil fertility and residue type. J. Soils Sediments 2018, 19, 1407–1415. [Google Scholar] [CrossRef]
  39. Wang, R.-J.; Song, J.-S.; Feng, Y.-T.; Zhou, J.-X.; Xie, J.-Y.; Khan, A.; Che, Z.-X.; Zhang, S.-L.; Yang, X.-Y. Changes in soil organic carbon pools following long-term fertilization under a rain-fed cropping system in the Loess Plateau, China. J. Integr. Agric. 2021, 20, 2512–2525. [Google Scholar] [CrossRef]
  40. Stockmann, U.; Adams, M.A.; Crawford, J.W.; Field, D.J.; Henakaarchchi, N.; Jenkins, M.; Minasny, B.; McBratney, A.B.; de Courcelles, V.d.R.; Singh, K.; et al. The knowns, known unknowns and unknowns of sequestration of soil organic carbon. Agric. Ecosyst. Environ. 2013, 164, 80–99. [Google Scholar] [CrossRef]
  41. Sun, L.; Sun, Z.; Hu, J.; Opoku-Kwanowaa, Y.; Wu, J. Combined application of animal manure and stover enhance labile organic carbon and benefit the microbial community in dark brown soil. Arch. Agron. Soil Sci. 2021, 69, 519–532. [Google Scholar] [CrossRef]
Figure 1. Schematic map of the tested device.
Agronomy 13 01121 g001
Figure 2. Distribution of different straw carbon in SOC in different fertility soils over 540 days. SOC-residue represents the carbon content derived from different residue types in SOC. LF and HF represent low- and high-fertility soil levels, respectively. R in blue, S in red and L in green represent the residues of the root, stem and leaf, respectively. Error bars represent the standard deviations from the mean (n = 3). F, R and F × R in black represent fertility level, residue type and the interaction of fertility level and residual type. *, **, *** and ns indicate significant difference at p < 0.05, 0.01 and 0.001, and no significance by ANOVA analysis, respectively. Different uppercase letters indicate significant differences between different treatments in the same sampling time, while different lowercase letters indicate significant differences between different sampling times in the same treatment (p < 0.05).
Agronomy 13 01121 g002
Figure 3. Distribution of different straw residues in DOC in different fertility soils over 540 days of the experiment. DOC-residue represents the content of carbon derived from different residue types in DOC. LF and HF represent low- and high-fertility soil levels, respectively. R in blue, S in red and L in green represent the residues of root, stem and leaf, respectively. Error bars represent the standard deviations from the mean (n = 3). F, R and F × R in black represent fertility level, residue type and the interaction of fertility level and residual type. ns indicates no significant difference by ANOVA analysis, respectively. Different uppercase letters indicate significant differences between different treatments in the same sampling time, while different lowercase letters indicate significant differences between different sampling times in the same treatment (p < 0.05).
Agronomy 13 01121 g003
Figure 4. Distribution of different straw residues in POC in different fertility soils over 540 days of the experiment. POC-residue represents the content of carbon derived from different residue types in POC. LF and HF represent low- and high-fertility soil levels, respectively. R in blue, S in red and L in green represent the residues of root, stem and leaf, respectively. Error bars represent the standard deviations from the mean (n = 3). F, R and F × R in black represent fertility level, residue type and the interaction of fertility level and residual type. *** and ns indicate significant difference at p < 0.001, and no significance by ANOVA analysis, respectively. Different uppercase letters indicate significant differences between different treatments in the same sampling time, while different lowercase letters indicate significant differences between different sampling times in the same treatment (p < 0.05).
Agronomy 13 01121 g004
Figure 5. Distribution of C-residue in DOC and POC (%) under different treatments over 540 days of the experiment. LF and HF indicate low- and high-fertility soils. R, S and L indicate the residues of root, stem and leaf. Error bars represent the standard deviations from the mean (n = 3). Different uppercase letters indicate significant differences between different treatments in the same sampling time, while different lowercase letters indicate significant differences between different sampling times in the same treatment (p < 0.05).
Agronomy 13 01121 g005
Figure 6. Changes of DOC and POC under different treatments over 540 days of the experiment.
Agronomy 13 01121 g006
Table 1. Basic properties of the tested soil (0–20 cm).
Soil FertilityFertilizerSoil Organic Carbon (g kg−1)Total Nitrogen (g kg−1)C/Nδ13C (‰)
Low fertility (LF)No fertilizer
(0 kg N hm−2)
11.55 ± 0.09 B1.30 ± 0.03 B8.87 ± 0.15 A−17.88 ± 0.41 B
High fertility (HF)Manure fertilizer
(270 kg N hm−2)
20.61 ± 0.25 A2.32 ± 0.01 A8.89 ± 0.08 A−19.45 ± 0.04 A
Note: Different uppercase letters indicate significant differences between two soil fertility levels at p < 0.05.
Table 2. ANOVA analysis for the effect of sampling time (S), fertility (F) and residue type (R).
FactorDfDistribution-DOCDistribution-POCUnmeasured
FpFpFp
S4149.627<0.00154.432<0.00161.848<0.001
F113.000<0.0114.577<0.00113.942<0.001
R216.260<0.0018.692<0.0017.782<0.01
S × F452.657<0.001101.074<0.001111.221<0.001
S × R83.639<0.016.355<0.0015.636<0.001
F × R22.4190.0985.987<0.016.780<0.01
S × F × R83.578<0.013.102<0.012.874<0.01
Disclaimer/Publisher’s Note: The statements, opinions and data contained in all publications are solely those of the individual author(s) and contributor(s) and not of MDPI and/or the editor(s). MDPI and/or the editor(s) disclaim responsibility for any injury to people or property resulting from any ideas, methods, instructions or products referred to in the content.

