Article

Quantitative Impacts of Climate Change and Human Activities on Grassland Productivity in Otog Banner, China from 2001 to 2020

1
State Key Laboratory of Eco-Hydraulics in Northwest Arid Region of China, Xi’an University of Technology, Xi’an 710048, China
2
School of Civil and Architectural Engineering, Henan University, Kaifeng 475004, China
*
Author to whom correspondence should be addressed.
Agronomy 2023, 13(4), 1140; https://doi.org/10.3390/agronomy13041140
Submission received: 28 February 2023 / Revised: 11 April 2023 / Accepted: 12 April 2023 / Published: 17 April 2023
(This article belongs to the Section Grassland and Pasture Science)

Abstract

:
The responses of grassland net primary productivity (NPP) to climate change (CC) and human activities (HA) have received much attention and are inconsistent on different spatial scales. The accurate and quantitative evaluation of the impacts of CC and HA on grassland NPP at a county scale is very important to reveal the external driving factors on grassland NPP and guide the protection of the grassland ecosystem in the arid sandy area of China. In this study, the improved CASA model was adopted to quantify the grassland NPP in Otog Banner, China from 2001 to 2020. The spatiotemporal dynamics of grassland NPP and the relationships between grassland NPP and climate factors in space were analyzed using the methods of simple linear regression and relative sensitivity coefficient. Furthermore, the relative contributions to grassland NPP dynamics caused by CC and HA were explored using the quantitative method based on partial derivative. The results revealed that the mean value of grassland NPP was 175.17 g C m−2 yr−1, and exhibited a significant decrease trend periodically at a rate of 2.14 g C m−2 yr−1 from 2001 to 2020. The spatial distribution of grassland NPP increased from west to east gradually and ranged in 17.48–498.09 g C m−2 yr−1. Grassland NPP exhibited significant linear patterns along the gradients of climate factors, and was the most sensitive to sunshine duration (SSD). Approximately 86.83% of the grassland showed a degradation trend and 39.71% showed a serious degradation trend. The CC contribution to grassland NPP dynamics was 0.593 g C m−2 yr−1, and precipitation was the key driving climate factor, while the contribution of HA was −2.733 g C m−2 yr−1, which was the primary factor leading to large-scale degradation of grassland in Otog banner. This study indicates that the status of the grassland ecosystem in Otog Banner is not optimistic, and measures for grassland ecosystem restoration and improvement need to be further strengthened.

1. Introduction

Vegetation productivity is the source of food, raw materials, and fuel for human life. Plants fix and convert solar energy into plant biomass through photosynthesis. Net primary productivity (NPP) is the remaining part of total organic matter produced by photosynthesis of green plants minus autotrophic respiration [1]. NPP is the main factor in judging the carbon source/sink of the ecosystem and regulating the ecological process, playing critical roles in global carbon balance and climate change [2,3,4]. With the rapid development of remote sensing, the light use efficiency models based on the readily available remote sensing data have been widely used in the quantitative evaluation of spatiotemporal changes of NPP on a regional or global scale [5]. Among them, the Carnegie-Ames-Stanford-Approach (CASA) model [6] has been widely used in many studies at home and abroad for evaluating vegetation NPP and the dynamics at different spatial scales by using remote sensing and near surface climate data [7,8,9,10]. In the CASA model, the use efficiency of vegetation on APAR that reaches the surface. However, the maximum light use efficiency (LUE) of vegetation is set as the fixed value of 0.389 g C MJ−1, which ignores the difference of maximum LUE for different vegetation types, resulting in significant errors in NPP simulated [11]. Zhu et al. [12] studied the maximum LUE of different vegetation types based on the measured data of vegetation NPP in China, and proposed an improved CASA model, of which the applicability and simulation accuracy were effectively improved, and good simulation results have been achieved in many studies.
Grassland is one of the most common types of vegetation cover on earth, and is also a key player in global carbon cycle and maintaining climate stability [13,14,15]. Grassland NPP is a key index reflecting the function and stability of grassland ecosystems and is highly sensitive to climate change (CC) and human activities (HA). Quantitative analysis of the relative impacts of different external driving factors on grassland NPP has become one of the hot issues of grassland management [16,17,18,19]. In view of the responses of grassland NPP to CC and HA in China, many studies have been carried out based on the light use efficiency models. Liu et al. [20] found that grassland NPP in China from 1982 to 2016 was positively correlated to precipitation, but negatively to temperature. Yan et al. [21] reported that from 2000 to 2015, CC had greater positive impact than HA on grassland NPP in northern China, and the positive effects of solar radiation, precipitation, and temperature decreased in turn, while HA was the leading factor in the grassland restoration and degradation. Xu et al. [22] revealed that in the Qinghai-Tibet Plateau, the impact of HA on the alpine grassland had effectively reduced due to the grazing withdrawal program implemented since 2000, while the impact of CC was gradually significant, and temperature and solar radiation were the leading factors driving NPP change. Chen et al. [23] concluded that human activities had a significant impact on the restoration of grassland NPP in Xinjiang since the 1980s, mainly due to the policy of the grazing withdrawal program. Guo et al. [24] revealed that from 2001 to 2018, precipitation had the strongest positive correlation with grassland NPP in Inner Mongolia on the annual scale, followed by solar radiation, while temperature had a negative correlation with grassland NPP. Mu et al. [25] found that from 2001 to 2009, the increase in grassland NPP caused by CC and HA accounted for 19.77% and 80.23% in Inner Mongolia, respectively. For the aforementioned studies, there are great differences in the responses of grassland NPP to CC and HA in China on different temporal and spatial scales, and there is no consensus on the driving mechanisms of CC and HA on grassland NPP dynamics. Most of the research focuses on large-scale spaces such as the whole country, river basin, or province, and there are relatively few studies on small and medium-sized scales such as a county. Secondly, the CASA model does not consider the differences of maximum LUE for different grassland types, resulting in errors in the estimations of grassland NPP. Thirdly, the methods analyzing the impacts of CC and HA on grassland NPP cannot obtain the spatial distribution difference of different driving factors or evaluate the driving effect of a single factor in CC or HA. County is an important part of China’s urban system and the key support for the integrated development of urban and rural areas. It is of great significance to promote the construction of new urbanization and build a new industrial and agricultural urban-rural relationship. Besides, it is also the smallest administrative unit for the use and management of natural grasslands in China [26]. Therefore, to quantitatively evaluate the grassland NPP dynamics and their responses to CC and HA at a county scale in terms of time and space is very necessary to for China’s grassland management and regulation, and is very useful for giving insight into the driving mechanisms of different driving factors on grassland NPP.
As one of the six major pastoral areas in China, Inner Mongolia has one fifth of China’s natural grassland, which provides sufficient basic resources for the local animal husbandry and is also an important natural ecological barrier [27,28,29,30]. In recent years, affected by CC and HA, grassland degradation, desertification, and salinization in Inner Mongolia have become prominent [27,31]. Otog Banner is located in the hinterland of Ordos City, Inner Mongolia, and is the main composition area of western Ordos Plateau. Ordos Plateau is the transitional zone between grassland and desert, and is also the main source of coarse sand of the Yellow River [32]. The ecological environment of Ordos Plateau is extremely fragile, and very sensitive to climate change [33]. Otog Banner is the dry erosion center of Ordos Plateau, with low vegetation coverage, low precipitation, high evaporation, and scarce water resources. It is a typical representative area of the arid sandy area in northern China and Ordos Plateau. In addition, Otog Banner is located in the agricultural and pastoral ecotone in northern China. The agricultural and pastoral ecotone in northern China, as an ecotone and ecologically fragile area between the agricultural and pastoral area, is an important ecological security barrier where planting and grassland animal husbandry are intertwined [34]. For a long time, under the dual influence of natural and human factors, the balance of “grass-livestock-human” harmonious coexistence in the region has been disrupted, and ecological problems such as grassland degradation are becoming increasingly prominent [35]. Otog Banner is a major animal husbandry banner in Ordos City, with a natural grassland area accounting for approximately 93.5% of its total national territory, having important ecological functions. However, due to the dual influence of natural and human factors, the ecological situation of the grassland in Otog Banner is becoming increasingly severe, with prominent problems such as grassland degradation, desertification, and salinization. The grassland resources surveys showed that the area of degradation, desertification, and salinization of the natural grassland in Otog Banner reached 46.55%, 78.85%, and 50.95% of the total grassland area in the 1980s, 2000, and 2010 respectively, leading to the serious decline in grassland NPP in Otog Banner. This not only restricts the sustainable development of the regional animal husbandry economy, but also poses a great threat to the stability of the fragile grassland ecosystem in the region.
In this study, Otog Banner was taken as a typical study area of grassland in the arid sandy area of China. The NPP of different grassland types from 2001 to 2020 was calculated with the improved CASA model. Then, the driving effects of different climate factors and human activities on the spatiotemporal dynamics of grassland NPP in Otog Banner were explored by using the methods of linear regression, relative sensitivity coefficient, and quantitative method based on partial derivations. The specific objectives were as follows: (1) calculate grassland NPP of different grassland types and analyze the interannual variations of grassland NPP from 2001 to 2020; (2) explore the spatial distribution characteristics of grassland NPP and the spatial responses and sensitivities to climate factors; (3) reveal the spatiotemporal dynamics of grassland NPP, and quantitatively evaluate the relative impacts of CC and HA on grassland NPP dynamics. The research results can provide theoretical reference for realizing the optimal management and sustainable utilization of grassland ecosystems.

2. Materials and Methods

2.1. Study Area

Otog Banner (106°41′ E~108°54′ E, 38°18′ N~40°11′ N, Figure 1) is located at the southwest of Ordos City, Inner Mongolia Autonomous Region, China, with a total area of 2.04 × 10⁴ km2. The altitude ranges in 962~2063 m, gradually decreased from the northwest to the southeast. The climate is dry, with little rain, windy and sandy, with rich sunshine and strong evaporation, belonging to a typical temperate continental climate. The mean annual values of temperature, evaporation, and precipitation were 7.7 °C, 1721.1 mm, and 241.2 mm. The annual precipitation is concentrated from May to September, with extremely uneven spatiotemporal distribution. Otog Banner has about 1.92 × 10⁴ km2 natural grassland, accounting for 93.55% of the whole banner area. The natural grassland types mainly include temperate steppe (13.03%), temperate desert-steppe (45.04%), temperate steppe-desert (24.31%), temperate desert (3.63%), lowland saline meadow (4.89%) and other types of grassland (2.65%), of which the first three types account for 88.06% of the total area of natural grassland in Otog Banner.

2.2. Data Collection and Pre-Processing

The climate factors used in this study were temperature (TEM), precipitation (PRE), relative humidity (RHU), sunshine duration (SSD), wind speed (WIN), and reference evapotranspiration (ET0). Temperature, precipitation, and sunshine duration are the basic input data for the improved CASA model to calculate grassland NPP. The daily data of each climate factor for 2001–2020 were from the stations of Otog Banner, Huinong, and Taole in or surrounding the study area, which were downloaded from the National Meteorological Science Data Center of China (http://data.cma.cn/, 15 August 2022), The reference evapotranspiration was calculated by Penman-Monteith (PM-FAO56) approach [36]. Then, the spatial interpolation of each climate factor was processed by using the interpolation tool of ArcGIS, obtaining the raster images of climate factors, of which the pixel size, arrangement and projection information were consistent with the processed raster images of Normalized Difference Vegetation Index (NDVI).
NDVI is another basic input data for the calculation of grassland NPP by improved CASA model. In this study, NDVI data were the level 3 monthly synthetic products (MOD13A3) of Moderate Resolution Imaging Spectroradiometer (MODIS). MOD13A3 had a spatial resolution of 1 km, and was the monthly data from 2001 to 2020, obtained from https://ladsweb.modaps.eosdis.nasa.gov/search/ (15 August 2022). The NDVI data in MOD13A3 product were extracted and converted into TIFF format and the projection coordinate system were set as WGS_1984_UTM_Zone_48n using HDF-EOS to GeoTIFF Conversion Tool (HEG), and then the raster images were processed using the “extract by mask” tool of ArcGIS to obtain the monthly NDVI raster data of the study area from 2001 to 2020.

2.3. Methods

2.3.1. Calculation of Grassland NPP

The CASA model is a process-based model driven by climate data and remote sensing and has been well calibrated [6,37,38]. Zhu et al. [12] optimized and improved the CASA model considering the difference of maximum light use efficiency (LUE) for different vegetation types, and the vegetation NPP estimated were more in line with the reality.
The improved CASA model is expressed as follows:
NPP ( x , t ) = A P A R ( x , t ) × ε ( x , t )
where NPP(x,t) represents the vegetation NPP of pixel x in month t, g C m−2 month−1; APAR(x,t) is the photosynthetically active radiation absorbed by vegetation of pixel x in month t, MJ m−2 month−1; ε(x,t) denotes the actual light use efficiency of vegetation of pixel x in month t, g C MJ−1.
The actual LUE of vegetation (ε) is mainly impacted by temperature and water, and its calculation formula is:
ε ( x , t ) = T ε 1 ( x , t ) × T ε 2 ( x , t ) × W ε ( x , t ) × ε m a x
where Tε1(x,t), Tε2(x,t) indicate the stresses of low and high temperature on LUE (Zhu et al., 2004); Wε(x,t) is the water stress on LUE; εmax is the maximum LUE of vegetation at ideal conditions. The εmax values for different vegetation types are different [39], and adopt the research results of Bao et al. [40] in this study, that is, 0.553 g C MJ−1 for temperate steppe, 0.511 g C MJ−1 for temperate desert-steppe, temperate steppe-desert and temperate desert, 0.654 g C MJ−1 for lowland saline meadow, and 0.389 g C MJ−1 for other grassland types.
APAR can be estimated by using remote sensing data. The calculation formula is:
A P A R ( x , t ) = S O L ( x , t ) × F P A R ( x , t ) × 0.5
where, SOL(x,t) represents the total solar radiation at pixel x in month t, calculated by sunshine duration, MJ m−2 month−1; FPAR(x,t) denotes the fraction of APAR; the constant of 0.5 is the fraction of SOL that is available for vegetation (0.38–0.71 μm).
FPAR mainly depends on the vegetation type and its canopy, which can be reflected by NDVI retrieved from remote sensing data [6]. According to relevant studies [6,41], there was a near-linear relationship between FPAR and vegetation NDVI, which is given by:
F P A R ( x , t ) = ( NDVI ( x , t ) NDVI i , m i n ) × ( F P A R m a x F P A R m i n ) NDVI i , m a x NDVI i , m i n + F P A R m i n
where, NDVI(x,t) denotes the vegetation NDVI of pixel x in month t; NDVIi,max, NDVIi,min are NDVI values corresponding to 95% and 5% of NDVI population i, respectively; FPARmax, FPARmin are independent of vegetation type, which are 0.950 and 0.001, respectively.
Some other studies [37,42,43] showed that FPAR also had a linear relationship with the Simple Ratio Index (SR). The formulas are:
F P A R ( x , t ) = ( SR ( x , t ) SR i , m i n ) × ( F P A R m a x F P A R m i n ) SR i , m a x SR i , m i n + F P A R m i n
SR ( x , t ) = 1 + NDVI ( x , t ) 1 NDVI ( x , t )  
where, SR is the Simple Ratio Index, a ratio vegetation index.
Los et al. [44] found that FPAR calculated by the mean values of those estimated by the FPARNDVI and FPARSR had the smallest bias. The model is given as:
F P A R ( x , t ) = α × F P A R NDVI + ( 1 α ) × F P A R SR
where, FPARNDVI is FPAR estimated with Formula (4); FPARSR is FPAR estimated with Formula (5); α is an adjustment coefficient and set to 0.5.

2.3.2. Changing Trend of Grassland NPP

The ordinary least square method [7,45,46] was used to assess the changing trend of grassland NPP in Otog Banner from 2001 to 2020.
θ s l o p e = n × i = 1 n ( i × NPP i ) ( i = 1 n i ) ( i = 1 n NPP i ) n × i = 1 n i 2 ( i = 1 n i ) 2
where, θslope is the interannual change rate of NPP, NPPi is the grassland NPP in year i, and n is the number of simulated years, θslope < 0 indicates a decrease trend, θslope > 0 indicates an increase trend.

2.3.3. Spatial Responses and Sensitivities of Grassland NPP to Climate Factors

In this study, the arithmetic mean and standard deviation values of grassland NPP were calculated at intervals of 0.1 °C in temperature, 5 mm in precipitation, 0.2% in relative humidity, 5 h in sunshine duration, 0.02 m s−1 in wind speed, and 3 mm in reference evapotranspiration. Then, the spatial responses of grassland NPP to the gradients of climate factors were explored by piecewise linear regression. Furthermore, the spatial sensitivities of grassland NPP to different climate factors were quantitatively analyzed by using the relative sensitivity coefficient [47,48,49]. The relative sensitivity coefficient is calculated with the Formula (9).
S x = Δ NPP Δ x × | x | NPP
where, Δ x is the change in climate factor x ; | x | is the absolute value of x ; Δ NPP is the NPP change caused by Δ x . S x > 0 indicates that NPP increases with the increase in climate factor, and S x < 0 indicates that NPP decreases with the increase in climate factor. The larger the | S x | , the stronger the sensitivity of NPP to the change in climate factor.

2.3.4. Quantitative Evaluation of the Driving Factors to Grassland NPP Dynamics

The impact evaluation equation, quantitative method based on partial derivative proposed by [21,50,51], was introduced to calculate the contributions of different climate factors and human activities to the dynamics of grassland productivity. The formula is:
θ s l o p e = C c o n + H c o n = C ( TEM ) + C ( PRE ) + C ( RHU ) + C ( SSD ) + C ( WIN ) + C ( ET 0 ) + R E = NPP TEM × TEM n + NPP PRE × PRE n + NPP RHU × RHU n + NPP SSD × SSD n + NPP WIN × WIN n + NPP ET 0 × ET 0 n + R E
where, θ s l o p e is the interannual change rate of NPP; C c o n , H c o n represents the contribution of climate change and human activities to the interannual change rate of grassland NPP, respectively; C ( TEM ) , C ( PRE ) , C ( RHU ) , C ( SSD ) ,   C ( WIN ) , C ( ET 0 ) respectively represent the contribution of temperature (TEM), precipitation (PRE), relative humidity (RHU), sunshine duration (SSD), wind speed (WIN) and reference evapotranspiration (ET0) to the interannual change rate of grassland NPP; C ( TEM ) can be expressed as NPP TEM × TEM n , NPP TEM is the partial correlation coefficient between grassland NPP and TEM when eliminating the interference of other climate factors, and TEM n is the interannual change rate of TEM; C ( PRE ) , and C ( RHU ) , C ( SSD ) ,   C ( WIN ) , C ( ET 0 ) also adopt the same calculation method; R E is the residual between the annual change rate of grassland NPP and the contributions of climate factors studied, representing the contribution of human activities (HA) to the dynamics of grassland NPP, including grazing, reclamation, fertilization and other human utilization and management activities of grassland.

3. Results

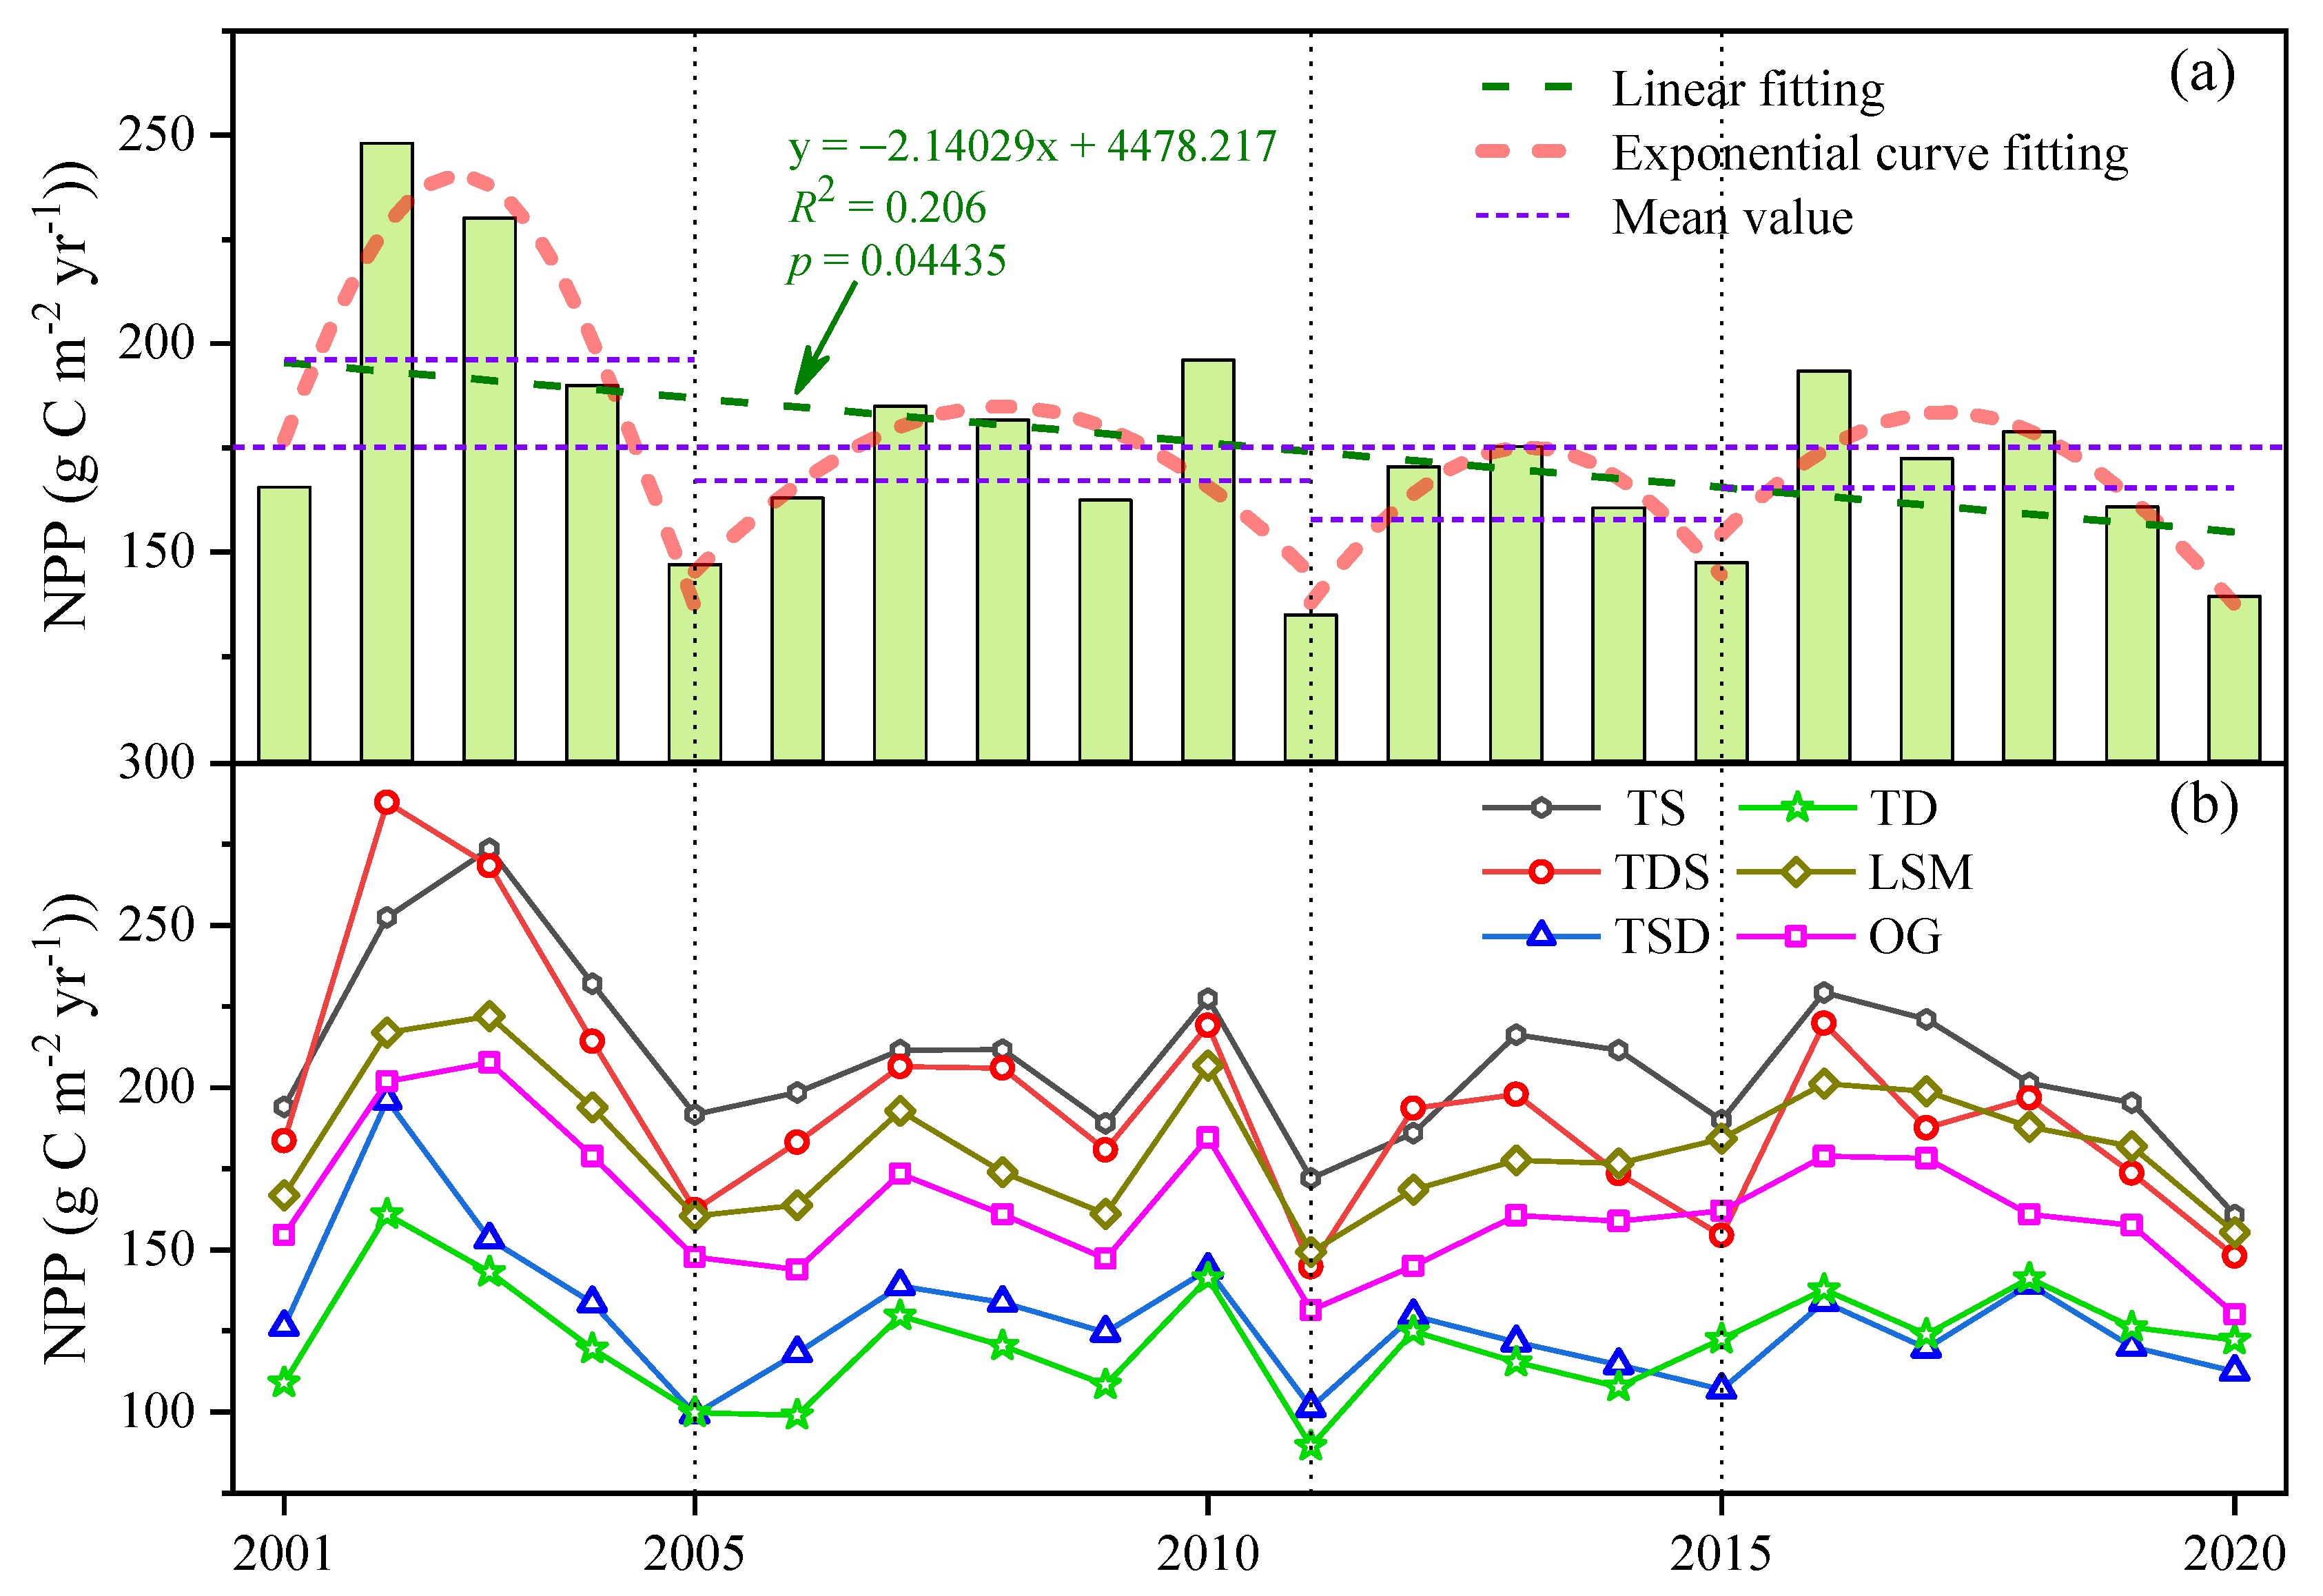
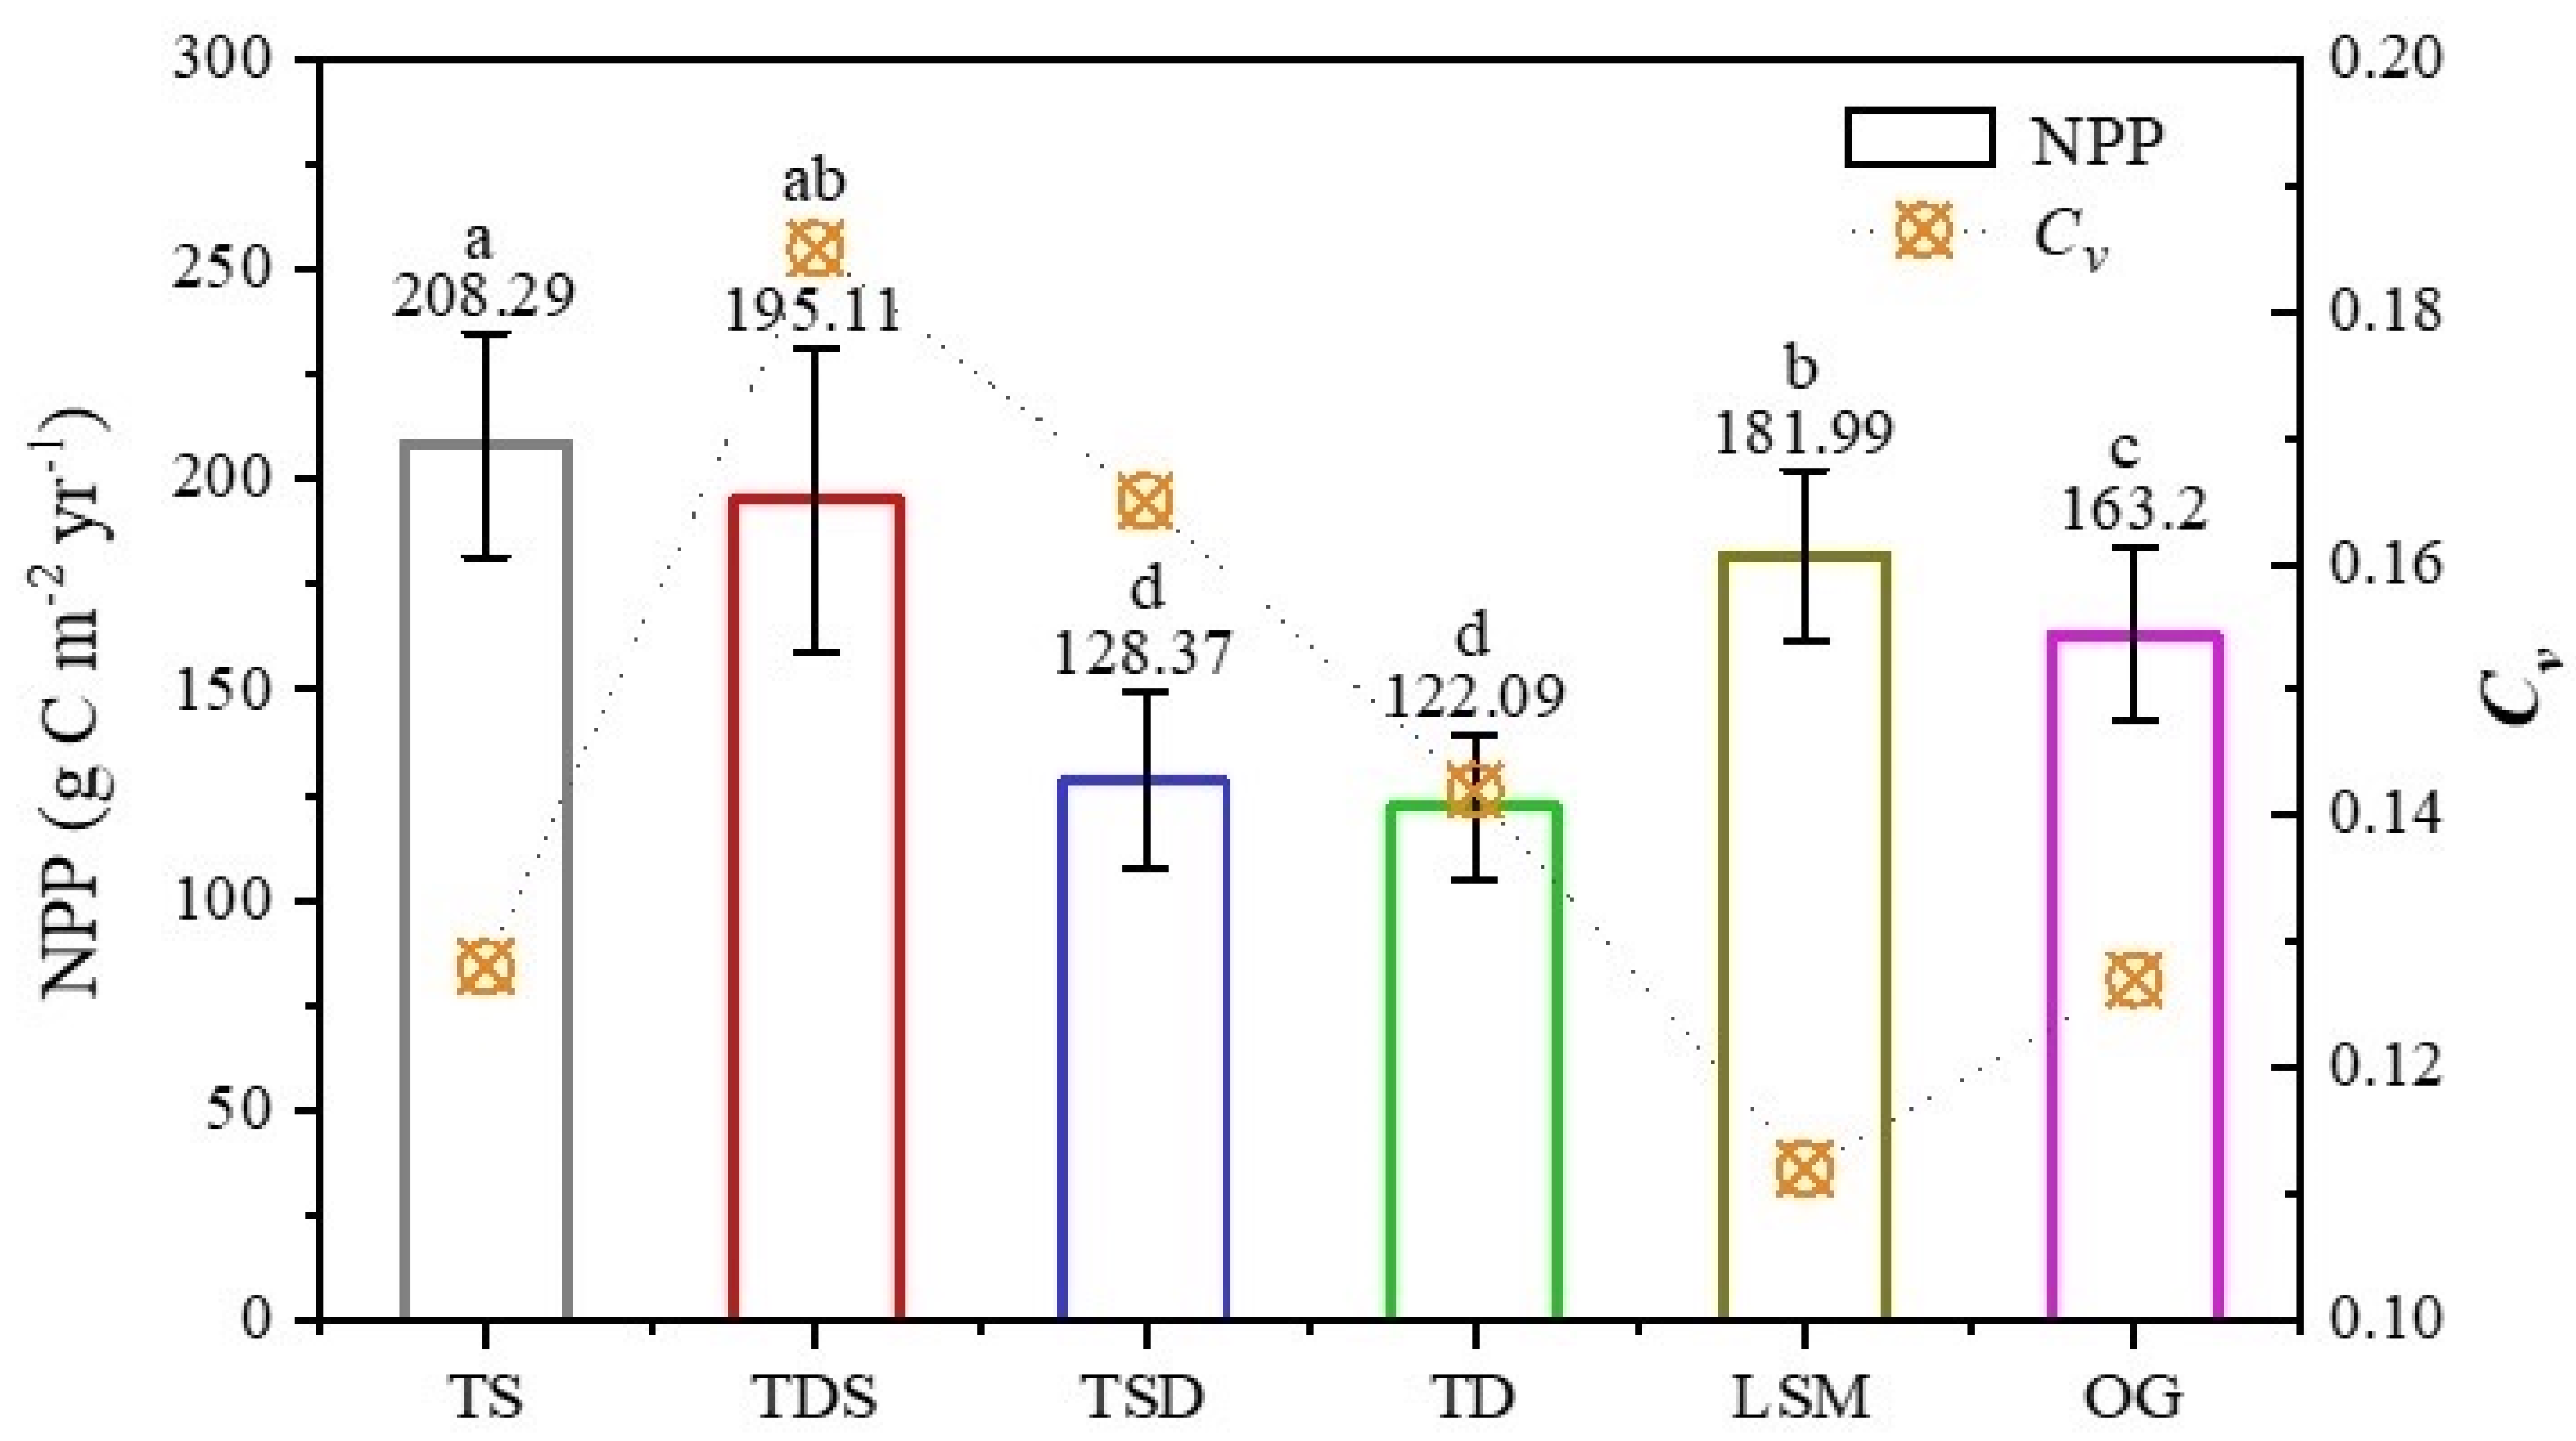
3.1. Interannual Variation in Grassland NPP

From 2001 to 2020, the interannual changes of grassland NPP for the whole region and different grassland types in Otog Banner are shown in Figure 2. For the whole region, grassland NPP exhibited a significant decrease trend at a rate of 2.14 g C m−2 yr−1 (p < 0.05) (Figure 2a), and the mean annual NPP was 175.17 g C m−2 yr−1. The maximum NPP appeared in 2002, reaching 248.07 g C m−2 yr−1, and the minimum NPP was 134.98 g C m−2 yr−1 in 2011. The decrease process of NPP had a certain fluctuation cycle, which could be divided into four stages over time: 2001–2005, 2005–2011, 2011–2015, and 2015–2020. The grassland NPP in each stage showed a significant unimodal index curve change. The mean annual NPP in 2001–2005 was 196.20 g C m−2 yr−1, which was 12.0% higher than that in 2001–2020, while the mean annual NPP in the latter three stages were lower than that in 2001–2020. For different grassland types, the interannual variation processes of grassland NPP were similar to that of grassland NPP for the whole region (Figure 2b). The change rates respectively were temperate steppe (TS) −1.91 g C m−2 yr−1 (p = 0.062), temperate desert-steppe (TDS) −2.99 g C m−2 yr−1 (p = 0.028), temperate steppe-desert (TSD) −1.45 g C m−2 yr−1 (p = 0.078), temperate desert (TD) 0.10 g C m−2 yr−1 (p = 0.883), lowland saline meadow (LSM) −0.57 g C m−2 yr−1 (p = 0.486), and other grassland (OG) −1.93 g C m−2 yr−1 (p = 0.143). Among them, only TDS with the largest area had a significant decrease trend in NPP, playing a leading role in the significant decrease in grassland NPP for the whole region, while the NPP of TD showed a certain improvement trend, but not significant. As shown in Figure 3, the mean annual NPP of different grassland types ranked as follows: TS > TDS > LSM > OG > TSD > TD, and the coefficients of variation in NPP ranked as follows: TDS > TSD > TD > TS > OG > LSM. It can be seen that the NPP of desert grasslands (TDS, TSD, TD) had larger dispersion and violent fluctuation due to the fragile ecological environment, indicating that desert grasslands were more vulnerable to the interference of external factors.

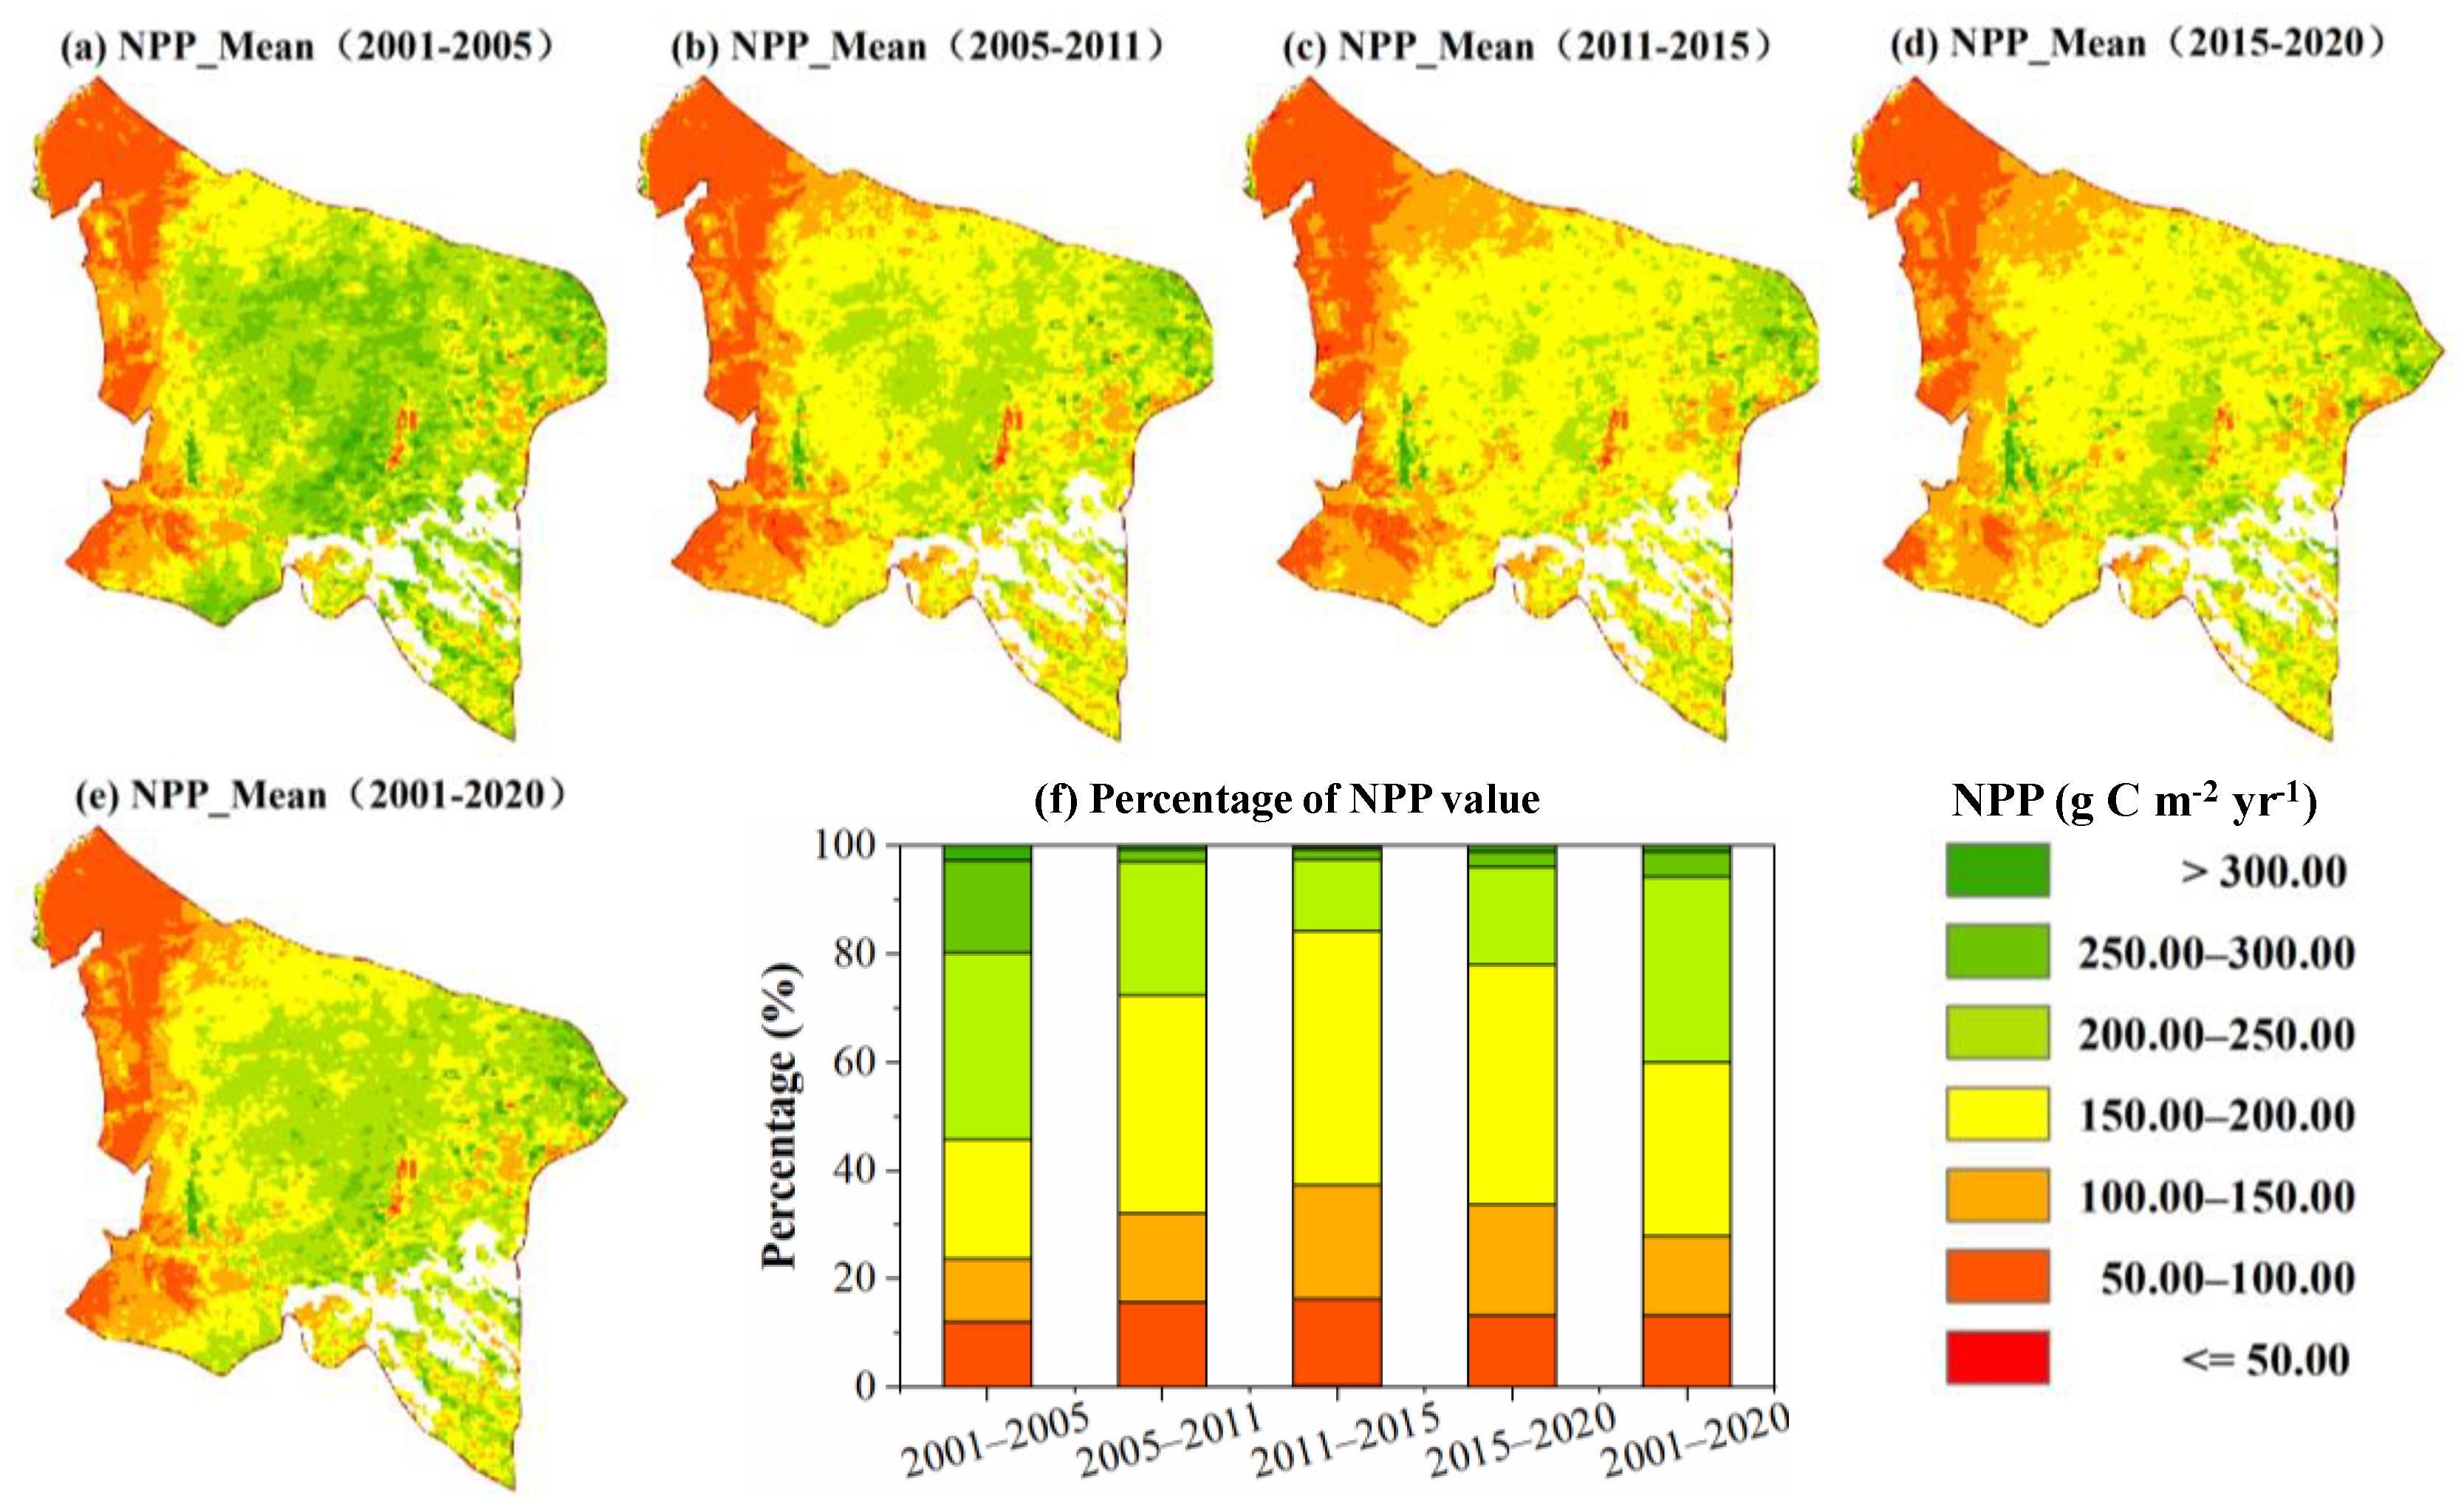
3.2. Spatial Patterns of Grassland NPP

The spatial distribution of grassland NPP in Otog Banner is shown in Figure 4. Grassland NPP increased evidently from the west to the east of the study area, ranging from 17.48 to 498.09 g C m−2 yr−1 (Figure 4e,f). The area with NPP in the range of 150.00–250.00 g C m−2 yr−1 accounted for 66.49% of the total grassland area, where the main grassland type was TDS distributed in the middle of the study area. The area with NPP below 150.00 g C m−2 yr−1 accounted for 27.85% of the total grassland area, where the main grassland types were TD and TSD distributed in the west of the study area. While the area with NPP above 250.00 g C m−2 yr−1 only accounted for 5.67% of the total grassland area, where the main grassland types were TS and LSM distributed in the east of the study area. As can be seen from Figure 4a–d,f, in the recent 20 years, grassland NPP of Otog Banner had a decrease trend, and the low NPP area spread from west to east. During 2015–2020, the decrease process eased slightly, indicating that a series of policies implemented by the state for grassland protection and restoration since the 21st century had gradually achieved positive effects after 2015.
According to the method of Section 2.3.3, the spatial variations of grassland NPP exhibited strong linear correlations with the gradients of climate factors (Figure 5). Grassland NPP showed significant decrease trends along the gradients of temperature (TEM) (7.8–10.0 °C), sunshine duration (SSD) (2880–2995 h) and reference evapotranspiration (ET0) (1105–1177 mm), significant increase trends along the gradients of precipitation (PRE) (185.0–285.0 mm) and wind speed (WIN) (1.89–2.43 m s−1), while the relationship with the gradients of relative humidity (RHU) (46.2–49.8%) was slightly complex, first increasing significantly and then decreasing significantly. It can be seen that the climate factors did not meet the ideal conditions for grassland growth except RHU in the arid sandy area of China, indicating that the grassland ecosystem in the arid sandy area of China is very fragile due to adverse climate conditions. The absolute values of sensitivity coefficients of grassland NPP to various climate factors from large to small were: SSD (−19.52) > RHU (15.85/−19.07) > ET0 (−12.87) > WIN (4.99) > TEM (−3.28) > PRE (1.93), revealing that grassland NPP was the most sensitive to SSD in space, followed by RHU and ET0, while relatively weak to WIN, TEM, and PRE.

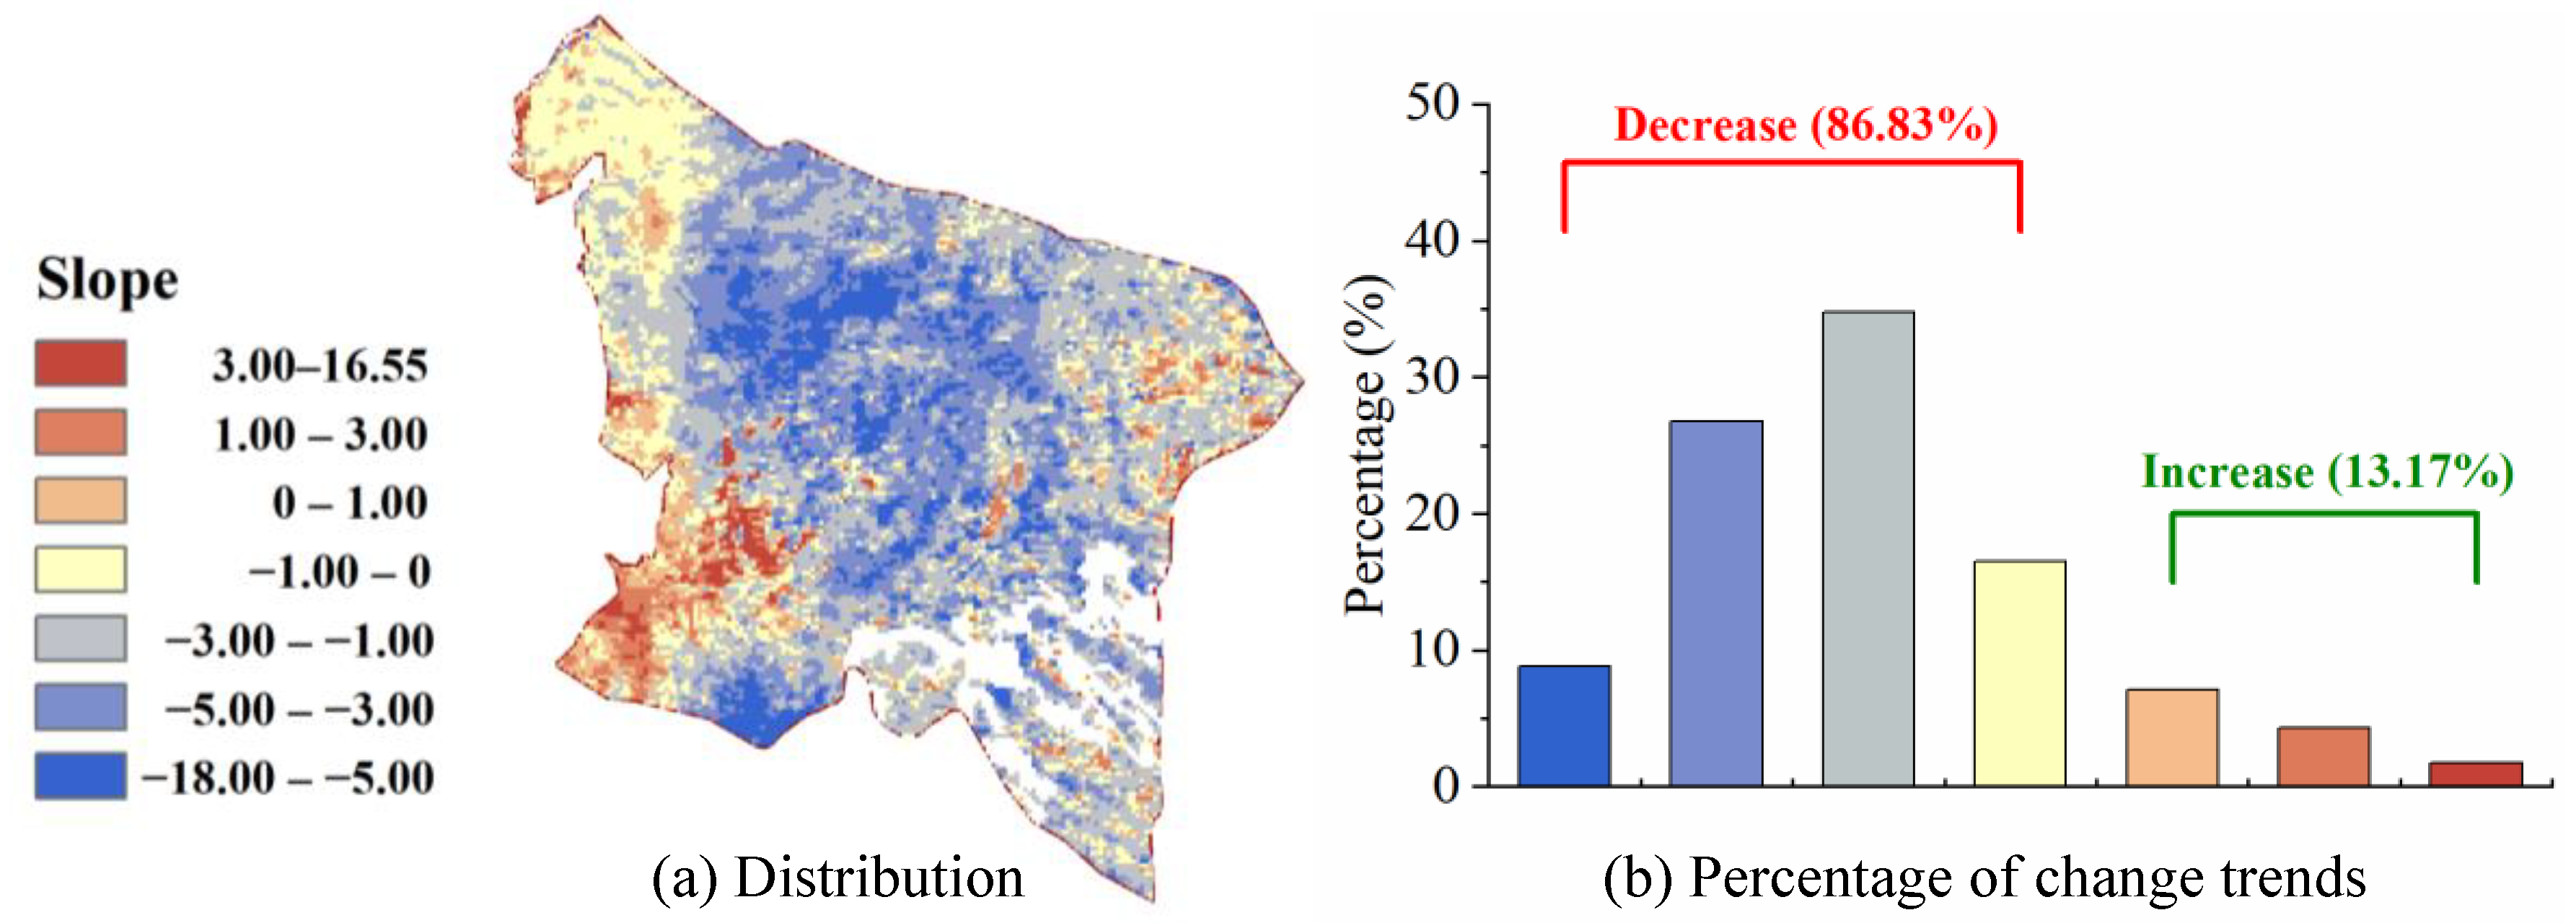
3.3. Spatiotemporal Dynamics of Grassland NPP

The changing trend of NPP for individual pixel in Otog Banner from 2001 to 2020 is shown in Figure 6. The change rates of grassland NPP ranged from −18.00–16.54 g C m−2 yr−1. The decrease area of grassland NPP reached 86.83% of the total grassland area. The area with change rates of −1.00–−5.00 g C m−2 yr−1 accounted for 61.49% of the total grassland area, where the main grassland type was TDS that distributed in the middle of the study area. Whereas, the increase area of grassland NPP only accounted for 13.17% of the total grassland area, where the main grassland type was temperate steppe-desert that distributed in the southwest.
The changing patterns of grassland NPP were evaluated according to the classification criteria formulated in Table 1 (Wu et al., 2021; Zhu et al., 2019), and the spatial distribution of changing patterns was shown in Figure 7. From 2001 to 2020, the area of severely degraded grassland reached 39.71% (0.761 × 10⁴ km2) of the total grassland area, mainly distributed in the north central region of the study area. The area of slightly degraded grassland accounted for 47.12% (0.903 × 10⁴ km2) of the total grassland area. While significantly and slightly restored grasslands were only 2.86% (0.055 × 10⁴ km2) and 10.31% (0.198 × 10⁴ km2) of the total grassland area, respectively. For different grassland types, TDS showed the most serious degraded trend, of which the degraded area reached 94.18% and the seriously degraded area accounted for 47.27%. Followed by TS and TSD, of which the seriously degraded areas accounted for 37.69% and 35.76%, respectively. TDS, TS, and TSD covered 88.06% (1.688 × 10⁴ km2) of the total grassland area, which were the dominant grassland types of Otog Banner. Their large-scale continuous degradation had very adverse impacts on the carrying capacity and stability of the grassland ecosystem in Otog Banner. The grasslands of the other three types (TDS, LSM, and OG) only covered 11.94% of the total grassland area, and more than 65.00% for each of them also showed a degraded trend.

3.4. Contributions of Climatic and Human Factors to Grassland NPP Dynamics

The contributions of climatic factors to the dynamics of grassland NPP in the study area were calculated and shown in Figure 8. According to Table 2, from 2001 to 2020, TEM, SSD andET0 had negative contributions to the dynamics of grassland NPP, which were −0.003, −0.022, and −0.255 g C m−2 yr−1, respectively. While PRE, RHU, and WIN showed positive contributions, which were 0.479, 0.268, and 0.126 g C m−2 yr−1, respectively. The absolute value of PRE contribution was the largest, followed by RHU and ET0, while the absolute value of TEM contribution was the smallest. The positive contribution of PRE mainly acted on TDS (0.610 g C m−2 yr−1) distributed in the middle and TSD (0.361 g C m−2 yr−1) distributed in the west (Figure 8b). RHU had a positive contribution to TDS (0.604 g C m−2 yr−1) distributed in the middle, while a negative contribution to TSD (−0.846 g C m−2 yr−1) was distributed in the middle west (Figure 8c). The negative contribution of ET0 acted on almost the whole study area, prominently on TDS (−0.664 g C m−2 yr−1) and TS (−0.566 g C m−2 yr−1) (Figure 8f). In addition, although the contribution of WIN to grassland NPP dynamics of the whole study area was only 0.126 g C m−2 yr−1, its contribution to TSD in the west reached −0.770 g C m−2 yr−1 (Figure 8e). RHU and WIN may be the key climatic factors leading to the decrease in grassland NPP of TSD in the west.
Based on Figure 8, the contributions of climate change (CC) and human activities (HA) were obtained and shown in Figure 9. According to Table 2, CC made a positive contribution to the dynamics of grassland NPP, but the value was only 0.593 g C m−2 yr−1. On the contrary, HA had a negative contribution to the dynamics of grassland NPP, with a contribution value of −2.733 g C m−2 yr−1, of which the absolute value was much greater than the positive contribution of CC. For different grassland types, the contributions of CC and HA were different. CC made positive contributions to the NPP dynamics of TS, TDS, lowland saline meadow (LSM) and other grassland (OG), while negative contributions to the NPP dynamics of TSD and temperate desert (TD). While the signs of HA contribution to the NPP dynamics of different grassland types were just opposite to those of CC. In addition, each of the absolute values of CC contributions to the NPP dynamics of different grassland types were far less than those of HA.
On the basis of Figure 9 and the assessment criteria designed in Table 3, the restoration and degradation areas dominated by CC and HA were determined (Figure 10 and Figure 11). The climate-dominated grassland area was only about half of the human-dominated grassland area (34.37% vs. 65.63%), and the impacts of both CC and HA on grassland degradation was much greater than those on grassland restoration (climate-dominated degradation vs. climate-dominated restoration: 87.20% vs. 12.80%, human-dominated degradation vs. human-dominated restoration: 86.84% vs. 13.36%). Moreover, the grassland was dominated by the degradation process as a whole in the study area, and the degradation areas dominated by CC and HA accounted for 29.97% and 56.86% of the total grassland area, respectively. In terms of different grassland types, the degradation area was larger than the restoration area for each grassland type in the climate-dominated area, especially for TDS, TSD, TD, and OG. In the human-dominated area, the percentages of degradation were much larger than those of restoration for TS, TDS, LSM, and OG, while the percentages of degradation were slightly lower than those of restoration for TSD and TD.
In summary, CC can promote the improvement of grassland NPP to a certain extent, and the promotion impact was mainly from regional precipitation in Otog Banner. HA was the dominant factor affecting the grassland NPP dynamics. The absolute value of its negative contribution to grassland NPP was much higher than the positive contribution of CC. However, the overall grassland degradation was the joint result of CC and HA, but the climate-dominated degradation area was only about half of the human-dominated degradation area. The grassland types of climate-dominated degradation were mainly TSD and TD distributed in the west, and the grassland types of human-dominated degradation were mainly TDS and TS distributed in the middle and east.

4. Discussion

4.1. Dynamics of Grassland NPP

In this paper, the interannual variation in NPP had a significant decrease trend from 2001 to 2020, consistent with the decrease trend of grassland NPP on the global scale from 1996 to 2008 [7]. However, it was inconsistent with several studies in different spatial scales in China. For instance, Liu et al. [20] found that grassland NPP significantly increased at a rate of 2.40 g C m−2 yr−1 from 1982 to 2016 in China, while had an insignificant decrease trend from 1999 to 2016. Yan et al. [21] revealed that grassland NPP increased significantly at rates of 1.66 g C m−2 yr−1 and 3.34 g C m−2 yr−1 in northern China and Inner Mongolia, respectively, from 2000 to 2015. Zhao et al. [30] reported that grassland NPP showed a fluctuating growth trend, with a growth rate of 4.53 g C m−2 yr−1 in Inner Mongolia. Gao et al. [52] concluded that grassland NPP exhibited an overall increase trend with an increase rate of 3.77 g C m−2 yr−1 from 1987 to 2016 in Siziwang Banner. The differences of grassland NPP changing trends are mainly due to the different scales of the study area, for the reason that the studies on large spatial scales often ignore the unique particularity of small-scale areas and cannot accurately express the characteristics of small-scale areas in them. While the differences of change rates in grassland NPP are affected by many factors, such as study area scale, geographical location, grassland type, climate characteristics, and study period. Spatially, the fluctuation range of grassland NPP was 17.48–498.09 g C m−2 yr−1 in Otog Banner, included in the grassland NPP range of 0.55–788.00 g C m−2 yr−1 in Inner Mongolia reported by Yang et al. [53], but the overall mean value (175.17 g C m−2 yr−1) was lower than that in Inner Mongolia (343.46 g C m−2 yr−1). Grassland NPP increased from west to east in Inner Mongolia [30,54,55]. Otog Banner is located in the arid sandy area in the west of Inner Mongolia, where climate conditions are poor, the water and heat factors are unbalanced, compared with the east of Inner Mongolia. So that grassland NPP in Otog Banner was at a low level. Similarly, grassland NPP increased from west to east in Otog Banner, also correlated with the distribution of different grassland types [56,57].

4.2. Impacts of Climate Change and Human Activities on Grassland NPP

Climate change (CC) and human activities (HA) are the critical important factors for grassland growth [58,59]. The spatial variations of grassland NPP were most sensitive to sunshine duration (SSD), followed by relative humidity (RHU) and reference evapotranspiration (ET0). Grassland NPP showed a single peak variation with RHU gradients and reached the peak at about 47.5%, which may be the suitable RHU value for grassland growth in arid sandy areas. Grassland NPP had strong negative correlations with SSD and ET0. The reasons may be that SSD in the arid sandy area had exceeded the light saturation point of grassland [60,61], and the continuous increase in SSD would result in the increase in ET0, causing the decrease in available water for grassland growth. In Otog Banner, 86.83% of the grasslands were in a degraded trend, and 39.71% showed a serious degraded trend. It can be seen that a series of grassland ecological restoration projects implemented in Inner Mongolia since 2000 had positive effects on promoting the improvement of the grassland ecosystem in Inner Mongolia [30,62], but not significant in Otog Banner. For the interannual variation in grassland NPP in Otog Banner, CC had a positive contribution, and precipitation was the main climate factor to promote the growth of grassland, consistent with the conclusions on grassland NPP in Inner Mongolia reported by Su et al. [63], Hua et al. [64] and Zhao et al. [30]. This can be explained by the fact that the growth of grassland in Inner Mongolia was mainly limited by precipitation, especially in the arid sandy area in the west of Inner Mongolia, and the increase in precipitation may greatly promote the growth of grassland [21,65]. HA was the dominant factor driving the grassland NPP dynamics in the study area, and its absolute contribution was much greater than that of CC. While the overall degradation of grassland was the joint result of CC and HA. The climate-dominated degradation mainly occurred in the west, where the soil type was mainly grey desert soil, the grassland types were mainly temperate steppe-desert (TSD) and temperate desert (TD) with sparse vegetation coverage, the climatic conditions were worse than those in the middle and eastern regions, and the grassland was more sensitive to CC. Additionally, due to the restrictions of poor climate and high altitude, the HA in the west were not as intense as those in the middle and eastern regions. Human-dominated degradation mainly occurred in the middle and east. As the important animal husbandry base in Ordos and Inner Mongolia, animal husbandry production activities are mainly carried out in the middle and eastern regions with high grassland productivity. The unreasonable development of animal husbandry and overgrazing may be the most important reasons for grassland degradation [66,67,68]. In addition, grassland degradation may be also affected by other industries, such as grassland reclamation, mining, industrial, and enterprise land occupation. Therefore, the effective measures and policies for grassland resource protection in Otog Banner should be further strengthened to curb the continuous deterioration of the grassland ecosystem.
The spatiotemporal evolution of grassland NPP Is the result of the joint drive of CC and HA. CC, as the internal driving factor, directly affects the physiological and biochemical processes of grassland NPP, determining the potential of grassland NPP. Many studies often overlook the impact of HA and only consider the impact of CC on grassland NPP. Moreover, most of them only take precipitation (PRE) and temperature (TEM) as climate influencing factors to analyze the responses of grassland NPP to CC. It is believed that PRE and TEM provide necessary hydrothermal conditions for grassland NPP and are the most active factors affecting grassland NPP [69,70]. Nevertheless, this assertion is relatively one-sided. In this study, PRE, RHU, and ET0 are the main climate factors affecting interannual changes in grassland NPP, and grassland NPP is most sensitive to SSD, RHU, and ET0 in space, while the impact of TEM on these two aspects is very weak. This may be because the fluctuations in TEM have not yet had a substantial impact on grassland NPP, but is enough to prove that other meteorological factors besides PRE and TEM can also have an undeniable impact on grassland NPP. HA is the external factor that affects the restoration or degradation of grassland NPP and cannot be ignored [33,71]. This study indicates that the negative contribution of HA is 4.6 times greater than the positive contribution of CC to grassland NPP. Grazing is the main way of utilizing grassland resources and the main type of HA that affects the restoration or degradation of grassland NPP [72]. Moderate grazing contributes to the healthy and sustainable development of grassland ecosystems, but overgrazing can damage grassland communities and lead to degradation of grassland NPP [66,73]. In addition, policies for grassland ecological protection are also the main types of HA that affect grassland NPP, such as the Fencing and Rotational Grazing Program, Returning Grazing Land to Grassland, Balance Management of Grass and Livestock, and Grassland Ecological Compensation implemented by the Chinese government [62,74]. The study by Wang [75] showed that the implementation of Grassland Ecological Compensation (Second round, 2016–2020) had resulted in an increase in the average height, coverage, and yield of natural grassland in Otog Banner, which was consistent with the conclusion shown in Figure 2 of this study that the average grassland NPP from 2015 to 2020 had increased compared to the average grassland NPP from 2011 to 2015.

5. Conclusions and Perspectives

Taking Otog Banner in the arid sandy area of China as the representative study area, the spatiotemporal dynamics of grassland NPP from 2001 to 2020 were evaluated, and the impacts of different climate change (CC) and human activities (HA) on grassland NPP dynamics were quantitatively analyzed, which will help to strengthen the management of the grassland ecosystem to avoid further grassland degradation in the arid sandy area of China. Meanwhile, this study could provide new insights into the responses of grassland NPP to CC and HA. The main findings were as follows:
(1)
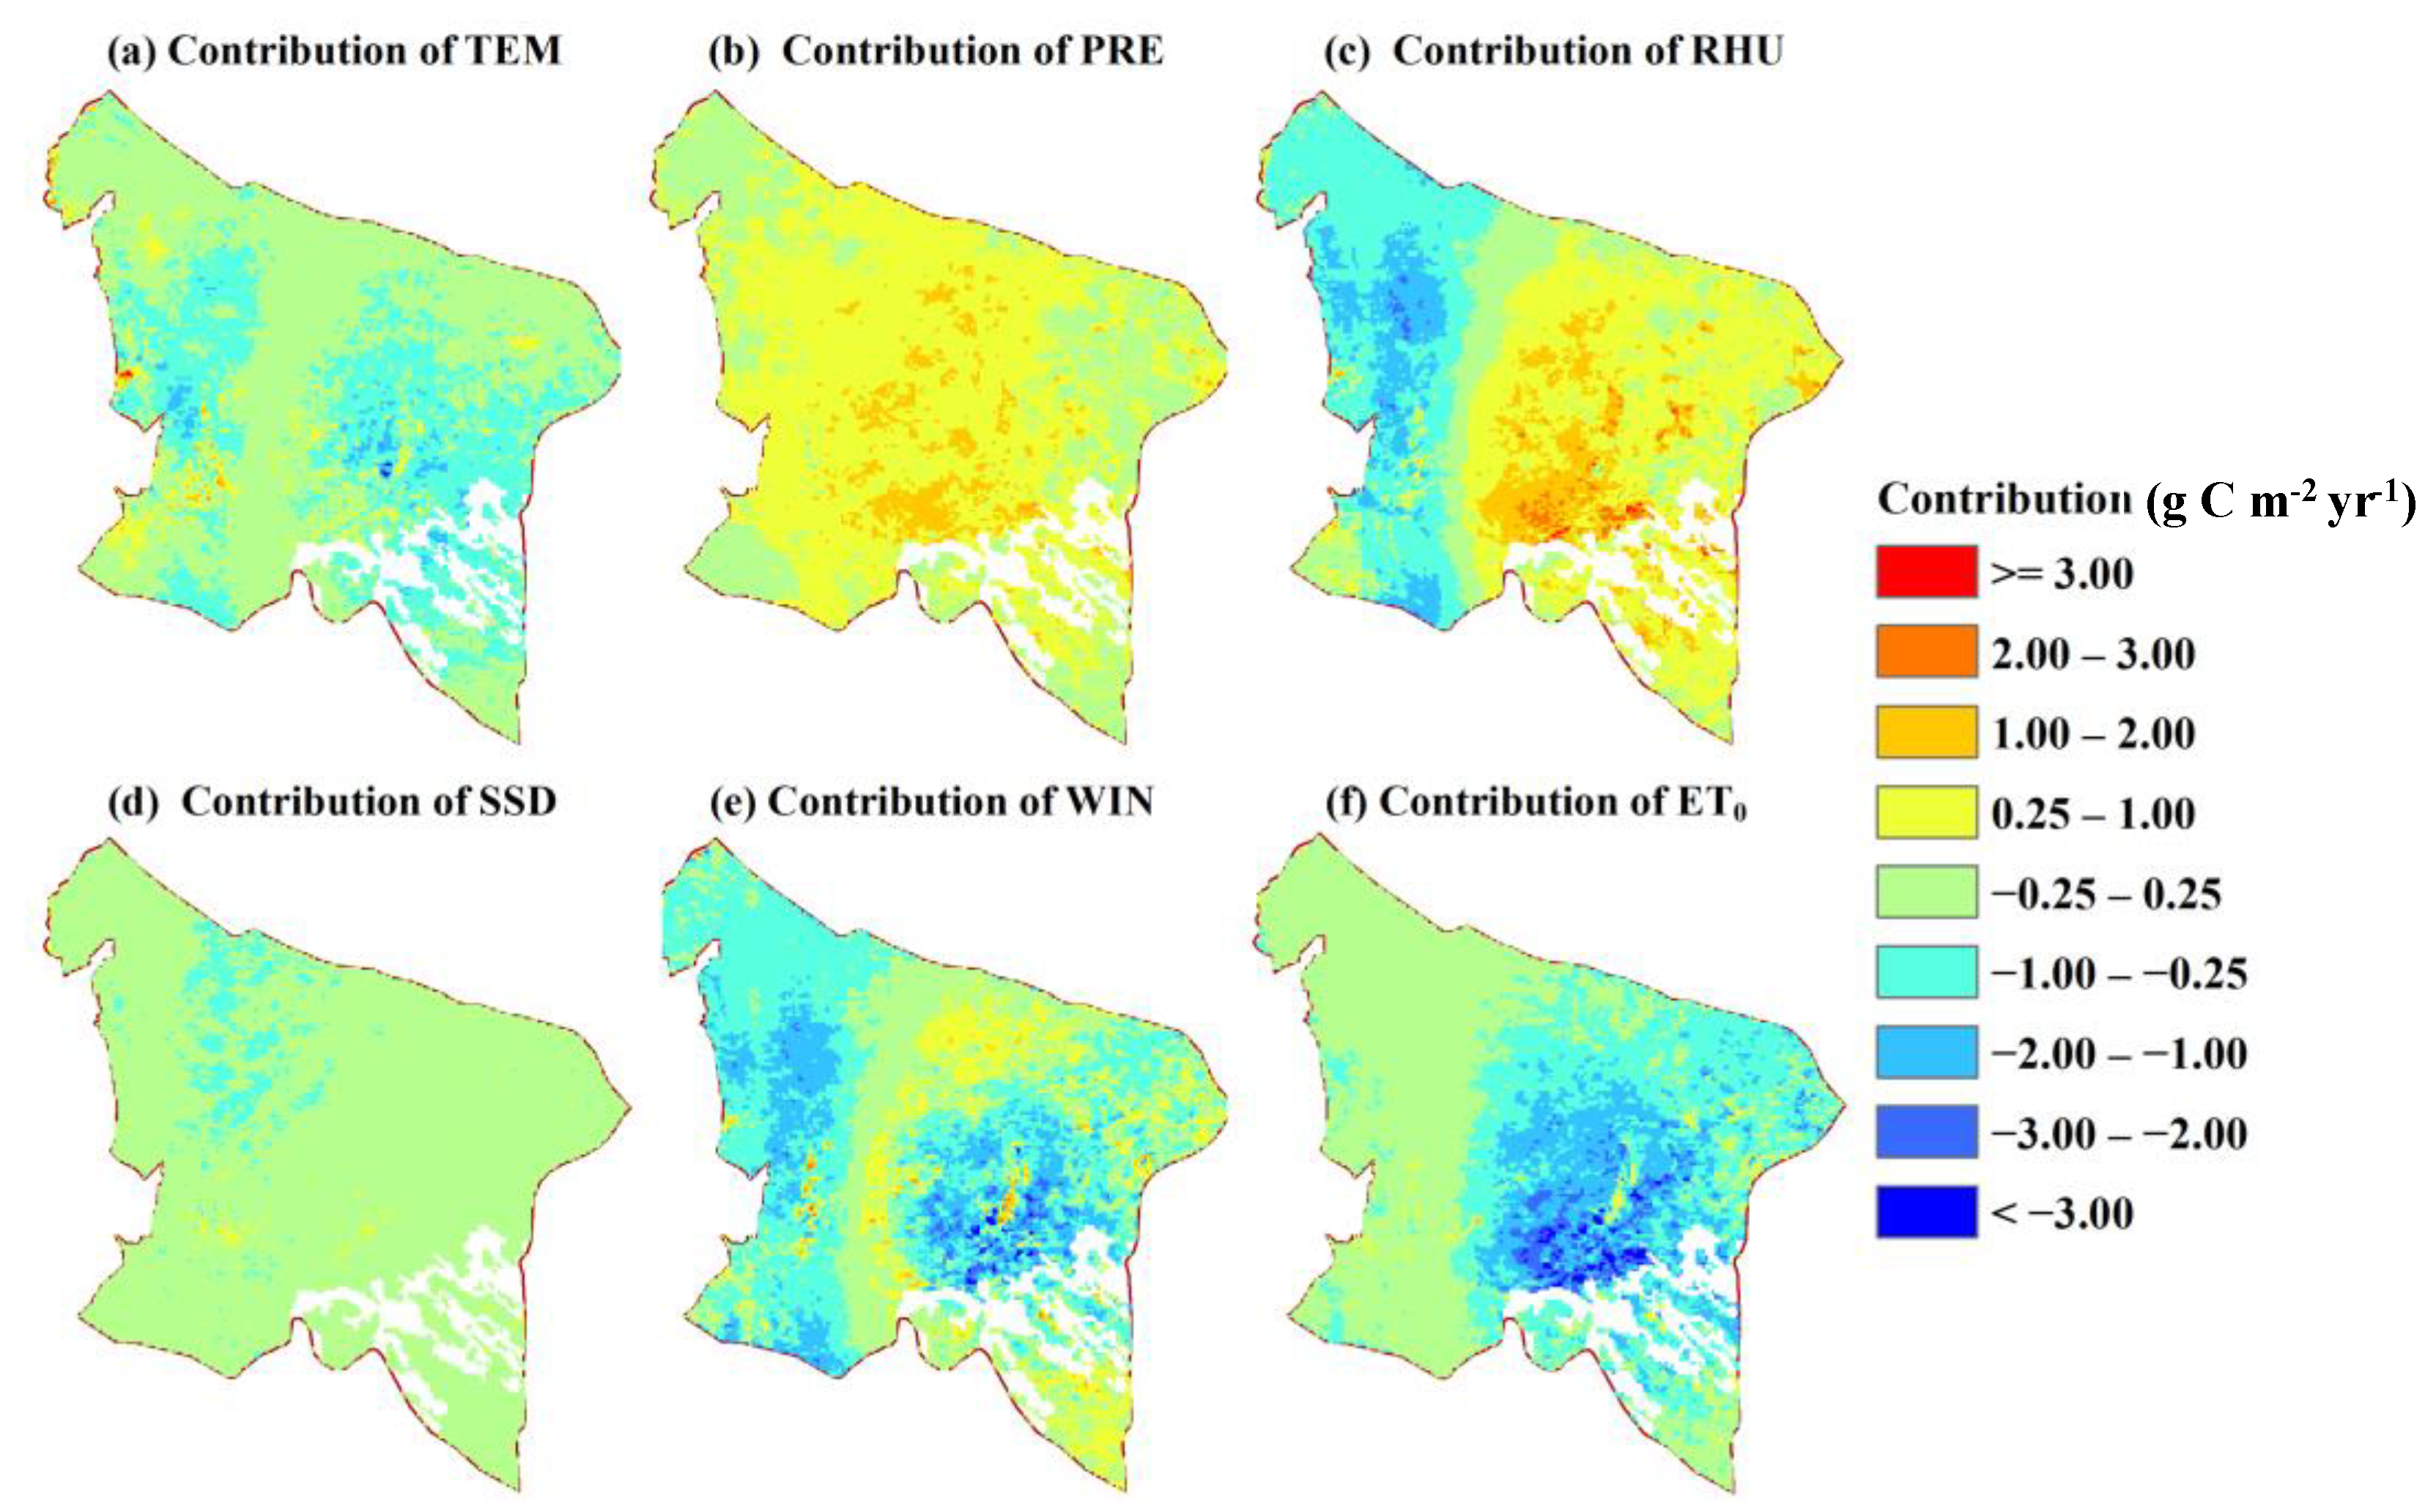
For the whole study area, grassland NPP showed a significant decrease trend with years. The multi-year mean value of grassland NPP was 175.17 g C m−2 yr−1, only half of that in Inner Mongolia. The spatial patterns of grassland NPP showed a strong linear correlation with the gradients of climate factors. Sunshine duration (SSD) was the most sensitive climate factor that affected the spatial patterns of grassland NPP in the study area.
(2)
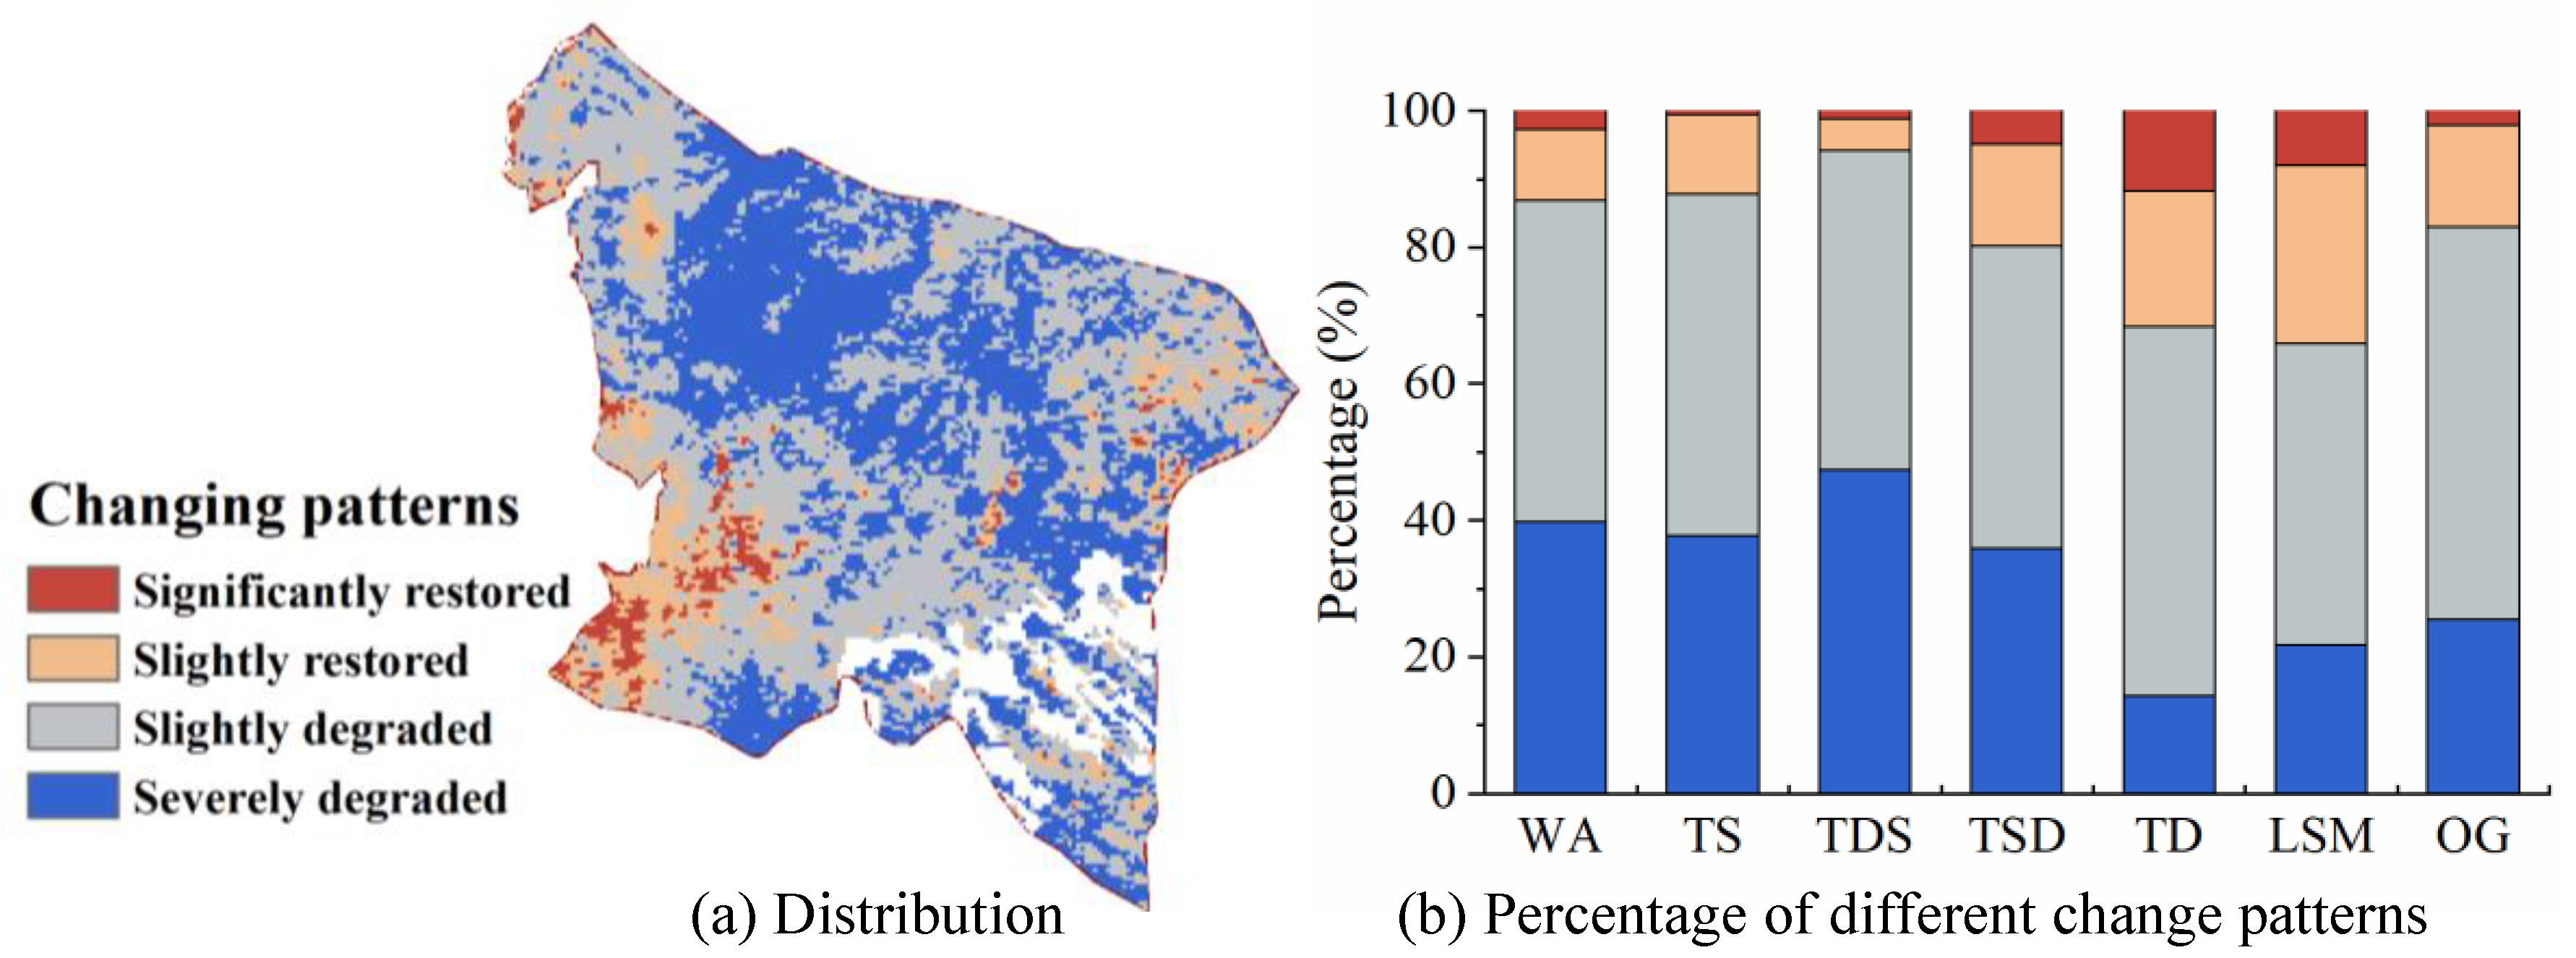
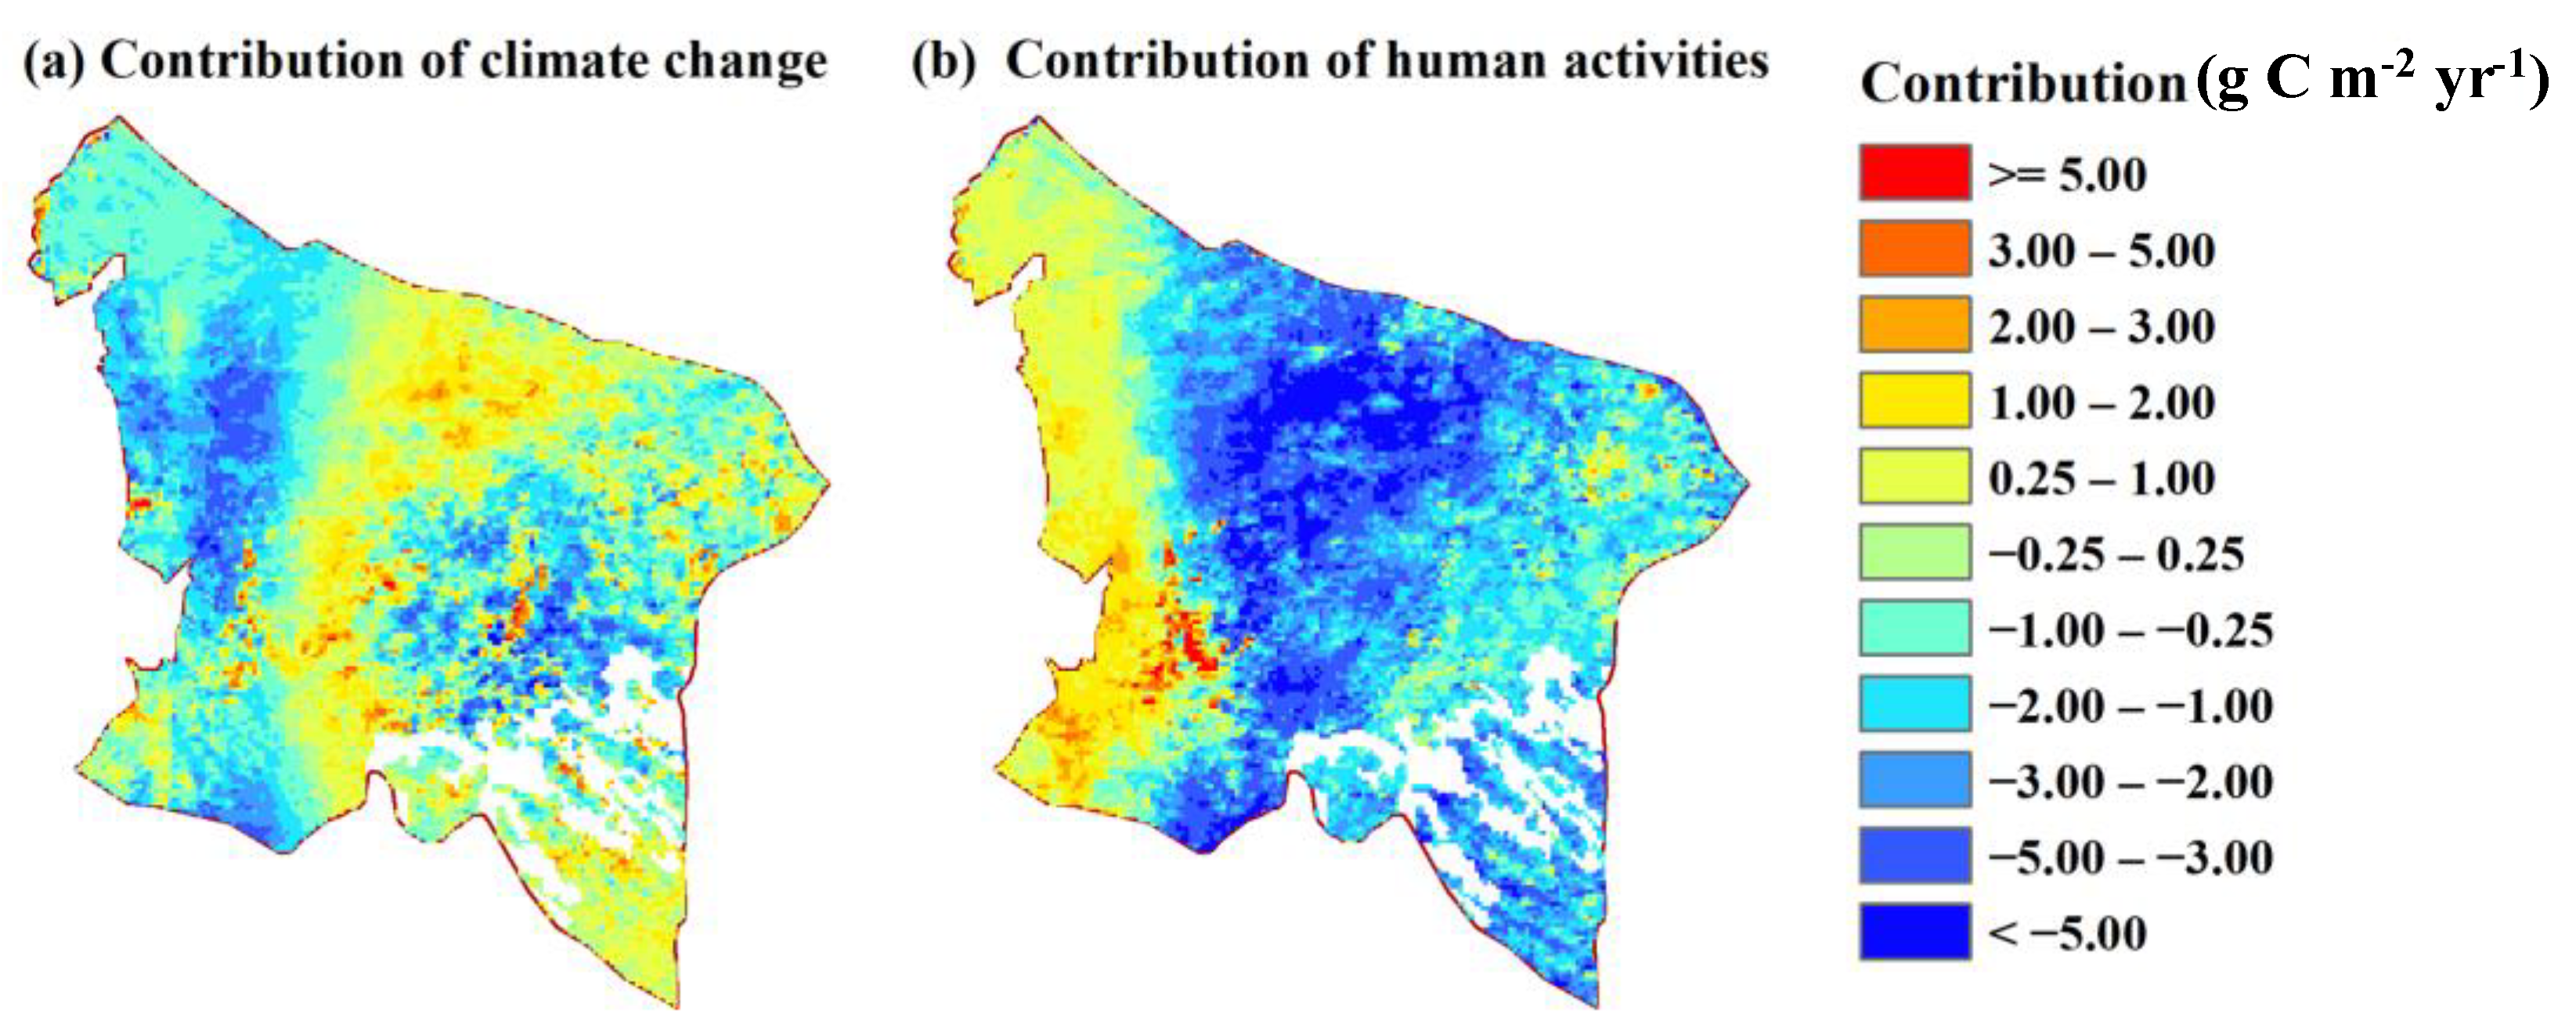
86.83% of the grassland area showed a degradation trend, including 39.71% seriously degraded and 47.12% slightly degraded. The negative contribution of HA to grassland NPP dynamics was −2.733 g C m−2 yr−1, while the positive contribution of CC was only 0.593 g C m−2 yr−1. The climate-dominated degradation was mainly distributed in the west, while the human-dominated degradation was mainly distributed in the middle and east.
(3)
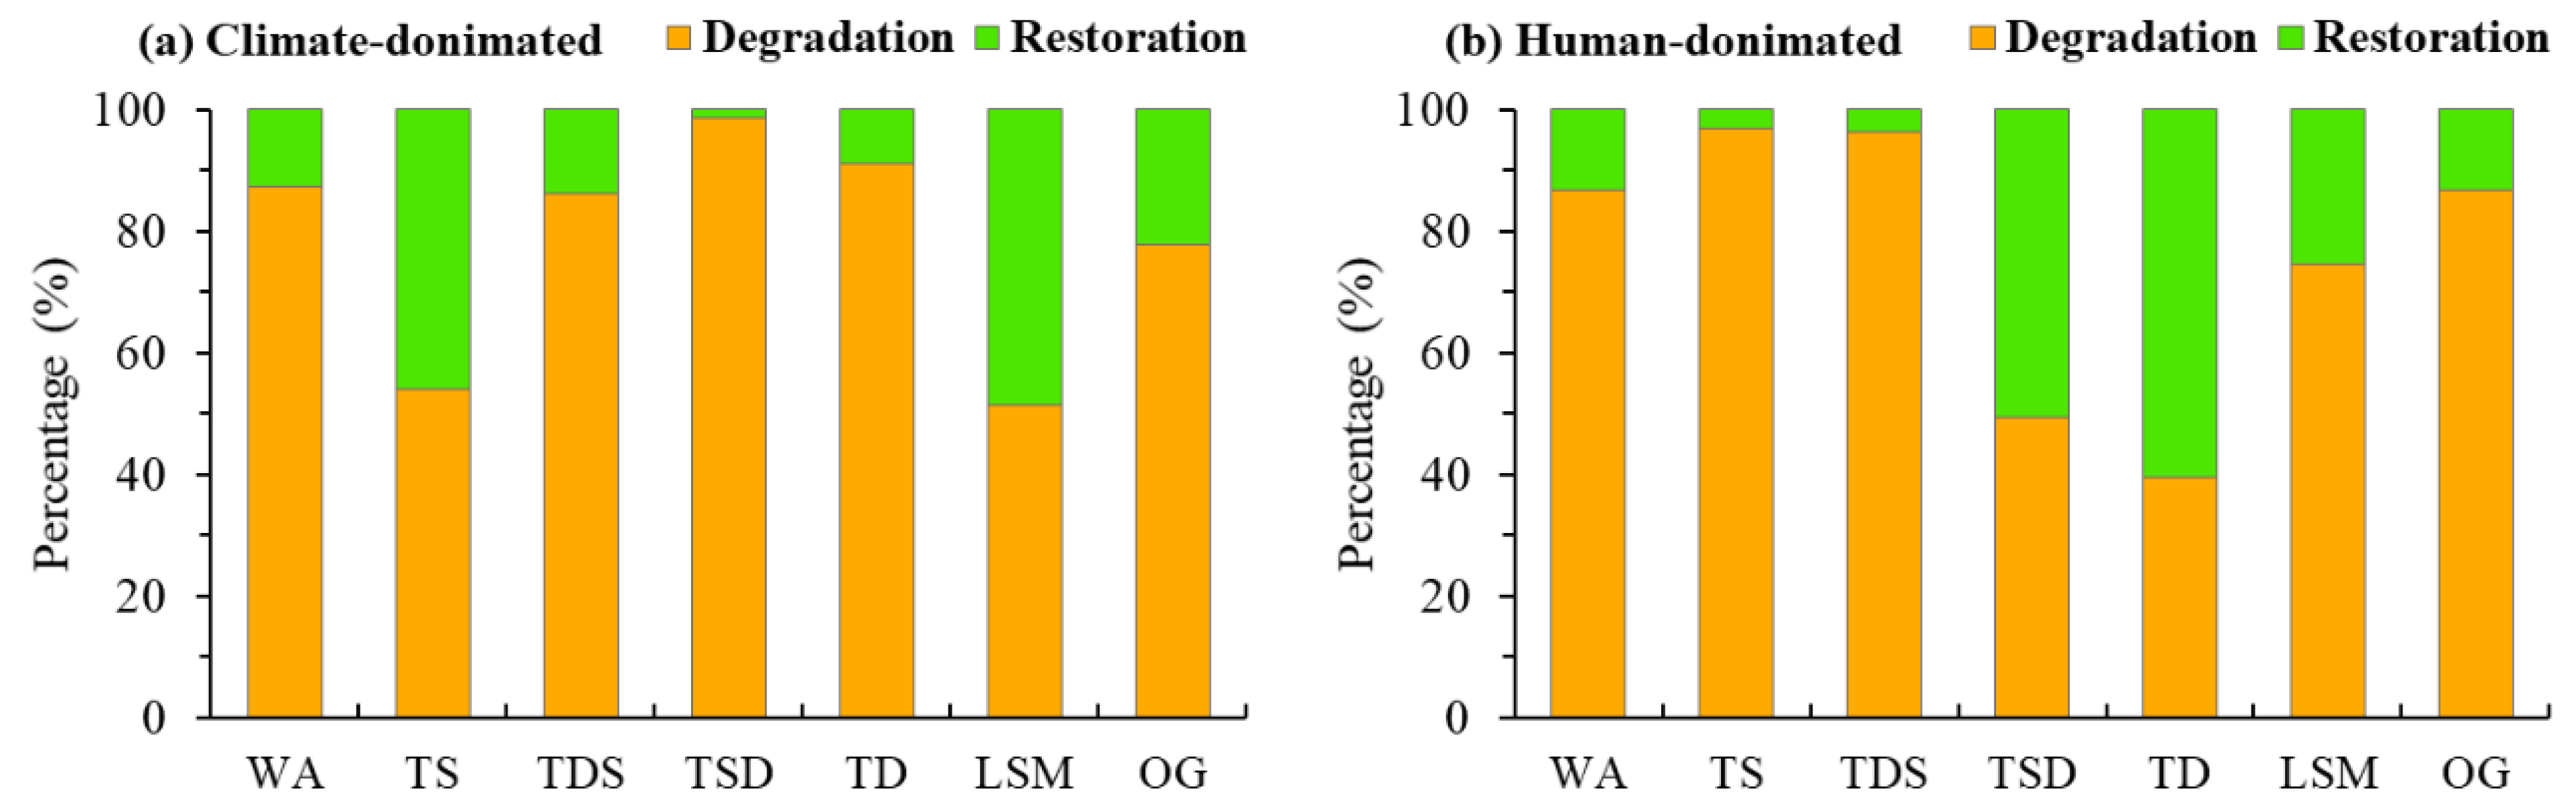
The overall degradation of the grassland in Otog Banner was the joint result of CC and HA. The climate-dominated degradation was mainly distributed in the west and accounted for 29.97% of the total grassland area; while the human-dominated degradation was mainly distributed in the middle and east and accounted for 56.86% of the total grassland area.
(4)
The study results showed that the stability of the grassland ecosystem in Otog Banner has been seriously threatened. The government should further strengthen the protection measures for the grassland ecosystem in order to curb the damage of HA and mitigate the adverse effects of CC on the grassland ecosystem. Additionally, actively developing the artificial grassland and yard-feeding livestock industry, a development model of animal husbandry that combines planting and breeding, could fully utilize the advantages of local natural resources, and enhance the carrying capacity and anti-interference ability of grassland resources in Otog Banner. At the same time, encouraging agricultural and pastoral families to develop diversified production and operation models, expanding their income sources through working outside, would gradually weaken their dependence on natural resources for survival and livelihood, achieving sustainable development of the social economy and ecosystem in pastoral area.
(5)
In the study, we quantified and separated the impact of CC and HA on grassland NPP, and quantitatively analyzed the driving contributions of different climate factors to grassland NPP dynamics. The study results can provide reference for the sustainable utilization and management of grassland ecosystems in Otog Banner, and provide an approach for quantitatively analyzing the responses of grassland or other vegetation ecosystems to climate change and human activities at different spatiotemporal scales. However, the study did not achieve a separate assessment of the impact of different HA types. This requires extensive investigation work as the basis, and further related work will be carried out in future research. In addition, grassland NPP is an important indicator in the carbon cycle process. Under the background of “Carbon Peaking and Carbon Neutrality” in China, research on the carbon sequestration effect of grassland ecosystems is also the focus of future work.

Author Contributions

Conceptualization, H.L. and X.S.; methodology, H.L. and R.W.; software, H.L. and R.W.; validation and formal analysis, H.L.; investigation, H.L. and X.S.; resources and data curation, H.L. and R.W.; writing—original draft preparation, H.L.; writing—review and editing, X.S.; visualization, H.L. and R.W.; supervision, X.S.; project administration and funding acquisition, X.S. and H.L. All authors have read and agreed to the published version of the manuscript.

Funding

This research was funded by “National Key Research and Development Program of China, grant number 2016YFC0400301”, “Natural Science Basic Research Program of Shaanxi: 2023-JC-ZD-30”, “Doctoral Dissertation Innovation Fund of Xi’an University of Technology, grant number 310-252072114” and “Henan University Postdoctoral Research Funding Project, grant number CJ3050A0670676”.

Data Availability Statement

The time series of MOD13A3 were obtained from the Level-1 and Atmosphere Archive & Distribution System (LAADS) Distributed Active Archive Center (DAAC) (https://ladsweb.modaps.eosdis.nasa.gov/search/, accessed on 15 August 2022). And the time series of meteorological data were obtained from National Meteorological Science Data Center of China (http://data.cma.cn/, accessed on 15 August 2022).

Conflicts of Interest

The authors declare no conflict of interest.

References

  1. Field, C.B.; Behrenfeld, M.J.; Randerson, J.T.; Falkowski, P. Primary Production of the Biosphere: Integrating Terrestrial and Oceanic Components. Science 1998, 281, 237–240. [Google Scholar] [CrossRef] [PubMed]
  2. Steffen, W.; Noble, I.; Canadell, J.; Apps, M.; Schulze, E.-D.; Jarvis, P.G. The Terrestrial Carbon Cycle: Implications for the Kyoto Protocol. Science 1998, 280, 1393–1394. [Google Scholar] [CrossRef]
  3. Dong, J.; Kaufmann, R.K.; Myneni, R.B.; Tucker, C.J.; Kauppi, P.E.; Liski, J.; Buermann, W.; Alexeyev, V.; Hughes, M.K. Remote Sensing Estimates of Boreal and Temperate Forest Woody Biomass: Carbon Pools, Sources, and Sinks. Remote Sens. Environ. 2003, 84, 393–410. [Google Scholar] [CrossRef]
  4. Chen, L.; Li, H.; Zhang, P.; Zhao, X.; Zhou, L.; Liu, T.; Hu, H.; Bai, Y.; Shen, H.; Fang, J. Climate and Native Grassland Vegetation as Drivers of the Community Structures of Shrub-Encroached Grasslands in Inner Mongolia, China. Landsc. Ecol. 2015, 30, 1627–1641. [Google Scholar] [CrossRef]
  5. Haberl, H.; Erb, K.H.; Krausmann, F.; Gaube, V.; Bondeau, A.; Plutzar, C.; Gingrich, S.; Lucht, W.; Fischer-Kowalski, M. Quantifying and Mapping the Human Appropriation of Net Primary Production in Earth’s Terrestrial Ecosystems. Proc. Natl. Acad. Sci. USA 2007, 104, 12942–12947. [Google Scholar] [CrossRef]
  6. Potter, C.S.; Randerson, J.T.; Field, C.B.; Matson, P.A.; Vitousek, P.M.; Mooney, H.A.; Klooster, S.A. Terrestrial Ecosystem Production: Process Model Based on Global Satellite and Surface Data. Glob. Biogeochem. Cycles 1993, 7, 811–841. [Google Scholar] [CrossRef]
  7. Liu, Y.; Yang, Y.; Wang, Q.; Khalifa, M.; Zhang, Z.; Tong, L.; Li, J.; Shi, A. Assessing the Dynamics of Grassland Net Primary Productivity in Response to Climate Change at the Global Scale. Chin. Geogr. Sci. 2019, 29, 725–740. [Google Scholar] [CrossRef]
  8. Wei, X.; Yan, C.; Wei, W. Grassland Dynamics and the Driving Factors Based on Net Primary Productivity in Qinghai Province, China. ISPRS Int. J. Geo-Inf. 2019, 8, 73. [Google Scholar] [CrossRef]
  9. Schaefer, K.; Collatz, G.J.; Tans, P.; Denning, A.S.; Baker, I.; Berry, J.; Prihodko, L.; Suits, N.; Philpott, A. Combined Simple Biosphere/Carnegie-Ames-Stanford Approach Terrestrial Carbon Cycle Model. J. Geophys. Res. Biogeosci. 2008, 113, 1–13. [Google Scholar] [CrossRef]
  10. Zhang, J.; Hao, X.; Hao, H.; Fan, X.; Li, Y. Climate Change Decreased Net Ecosystem Productivity in the Arid Region of Central Asia. Remote Sens. 2021, 13, 4449. [Google Scholar] [CrossRef]
  11. Pu, S.; Fang, J.; He, J.; Xiao, Y. Spatial distribution of grassland biomass in China. Acta Phytoecol. Sin. 2014, 28, 491–498. (In Chinese) [Google Scholar]
  12. Zhu, W.; Pan, Y.; He, H.; Yu, D.; Hu, H. Simulation of Maximum Light Use Efficiency for Some Typical Vegetation Types in China. Chin. Sci. Bull. 2006, 51, 457–463. [Google Scholar] [CrossRef]
  13. Fang, J.Y.; Guo, Z.; Di Piao, S.L.; Chen, A.P. Terrestrial Vegetation Carbon Sinks in China, 1981–2000. Sci. China Ser. D Earth Sci. 2007, 50, 1341–1350. [Google Scholar] [CrossRef]
  14. Bengtsson, J.; Bullock, J.M.; Egoh, B.; Everson, C.; Everson, T.; O’Connor, T.; O’Farrell, P.J.; Smith, H.G.; Lindborg, R. Grasslands-More Important for Ecosystem Services than You Might Think. Ecosphere 2019, 10, e02582. [Google Scholar] [CrossRef]
  15. Liu, Y.; Yang, Y.; Wang, Q.; Du, X.; Li, J.; Gang, C.; Zhou, W.; Wang, Z. Evaluating the Responses of Net Primary Productivity and Carbon Use Efficiency of Global Grassland to Climate Variability along an Aridity Gradient. Sci. Total Environ. 2019, 652, 671–682. [Google Scholar] [CrossRef]
  16. Chen, T.; Bao, A.; Jiapaer, G.; Guo, H.; Zheng, G.; Jiang, L.; Chang, C.; Tuerhanjiang, L. Disentangling the Relative Impacts of Climate Change and Human Activities on Arid and Semiarid Grasslands in Central Asia during 1982–2015. Sci. Total Environ. 2019, 653, 1311–1325. [Google Scholar] [CrossRef]
  17. Yang, Y.; Wang, Z.; Li, J.; Gang, C.; Zhang, Y.; Zhang, Y.; Odeh, I.; Qi, J. Comparative Assessment of Grassland Degradation Dynamics in Response to Climate Variation and Human Activities in China, Mongolia, Pakistan and Uzbekistan from 2000 to 2013. J. Arid Environ. 2016, 135, 164–172. [Google Scholar] [CrossRef]
  18. Liu, Y.; Wang, Q.; Zhang, Z.; Tong, L.; Wang, Z.; Li, J. Grassland Dynamics in Responses to Climate Variation and Human Activities in China from 2000 to 2013. Sci. Total Environ. 2019, 690, 27–39. [Google Scholar] [CrossRef]
  19. Zhou, W.; Yang, H.; Huang, L.; Chen, C.; Lin, X.; Hu, Z.; Li, J. Grassland Degradation Remote Sensing Monitoring and Driving Factors Quantitative Assessment in China from 1982 to 2010. Ecol. Indic. 2017, 83, 303–313. [Google Scholar] [CrossRef]
  20. Liu, Y.; Zhou, R.; Ren, H.; Zhang, W.; Zhang, Z.; Zhang, Z.; Wen, Z. Evaluating the Dynamics of Grassland Net Primary Productivity in Response to Climate Change in China. Glob. Ecol. Conserv. 2021, 28, e01574. [Google Scholar] [CrossRef]
  21. Yan, Y.; Liu, X.; Wen, Y.; Ou, J. Quantitative Analysis of the Contributions of Climatic and Human Factors to Grassland Productivity in Northern China. Ecol. Indic. 2019, 103, 542–553. [Google Scholar] [CrossRef]
  22. Xu, H.; Wang, X.; Zhang, X. Alpine Grasslands Response to Climatic Factors and Anthropogenic Activities on the Tibetan Plateau from 2000 to 2012. Ecol. Eng. 2016, 92, 251–259. [Google Scholar] [CrossRef]
  23. Chen, T.; Tang, G.; Yuan, Y.; Guo, H.; Xu, Z.; Jiang, G.; Chen, X. Unraveling the Relative Impacts of Climate Change and Human Activities on Grassland Productivity in Central Asia over Last Three Decades. Sci. Total Environ. 2020, 743, 140649. [Google Scholar] [CrossRef] [PubMed]
  24. Guo, D.; Song, X.; Hu, R.; Cai, S.; Zhu, X.; Hao, Y. Grassland Type-Dependent Spatiotemporal Characteristics of Productivity in Inner Mongolia and Its Response to Climate Factors. Sci. Total Environ. 2021, 775, 145644. [Google Scholar] [CrossRef]
  25. Mu, S.; Zhou, S.; Chen, Y.; Li, J.; Ju, W.; Odeh, I.O.A. Assessing the Impact of Restoration-Induced Land Conversion and Management Alternatives on Net Primary Productivity in Inner Mongolian Grassland, China. Glob. Planet. Chang. 2013, 108, 29–41. [Google Scholar] [CrossRef]
  26. Liu, H.; Song, X.; Wen, W.; Jia, Q.; Zhu, D. Quantitative Effects of Climate Change on Vegetation Dynamics in Alpine Grassland of Qinghai-Tibet Plateau in a County. Atmosphere 2022, 13, 324. [Google Scholar] [CrossRef]
  27. Hu, Y.; Nacun, B. An Analysis of Land-Use Change and Grassland Degradation from a Policy Perspective in Inner Mongolia, China, 1990–2015. Sustainability 2018, 10, 4048. [Google Scholar] [CrossRef]
  28. Zhou, W.; Yang, H.; Zhou, L.; Chen, Y.; Huang, L.; Ju, W. Dynamics of Grassland Carbon Sequestration and Its Coupling Relation with Hydrothermal Factor of Inner Mongolia. Ecol. Indic. 2018, 95, 1–11. [Google Scholar] [CrossRef]
  29. Zhou, W.; Gang, C.; Zhou, L.; Chen, Y.; Li, J.; Ju, W.; Odeh, I. Dynamic of Grassland Vegetation Degradation and Its Quantitative Assessment in the Northwest China. Acta Oecologica 2014, 55, 86–96. [Google Scholar] [CrossRef]
  30. Zhao, Y.; Liu, H.; Zhang, A.; Cui, X.; Zhao, A. Spatiotemporal Variations and Its Influencing Factors of Grassland Net Primary Productivity in Inner Mongolia, China during the Period 2000–2014. J. Arid Environ. 2019, 165, 106–118. [Google Scholar] [CrossRef]
  31. Zhao, H.L.; Zhao, X.Y.; Zhou, R.L.; Zhang, T.H.; Drake, S. Desertification Processes Due to Heavy Grazing in Sandy Rangeland, Inner Mongolia. J. Arid Environ. 2005, 62, 309–319. [Google Scholar] [CrossRef]
  32. Zheng, Y.R.; Zhang, X.S. The diagnosis and optimal design of high efficient ecological economy system in maowusu sandy land. Acta Phytoecol. Sin. 1998, 22, 262–268. (In Chinese) [Google Scholar]
  33. Li, X.G.; Liu, H.M.; Wang, L.X.; Zhuo, Y. Vegetation cover change and its relationship between climate and human activities in ordos plateau. Chin. J. Agrometeorol. 2014, 35, 470–476. (In Chinese) [Google Scholar]
  34. Zhou, S.Q.; Zhao, K. Coupling coordination of capital and livelihood stability of farmers and herdsmen in the agro-pastoral ecotone in northern China. Arid Land Resour. Environ. 2022, 36, 9–15. (In Chinese) [Google Scholar]
  35. Zhou, L.H.; Hou, C.X. Key problems of grassland utilization and the graze ban policy in farming-pastoral ecotone of Northern China. Arid Land Geogr. 2019, 42, 354–362. (In Chinese) [Google Scholar]
  36. Allen, R.G.; Pereira, L.S.; Raes, D.; Smith, M. Crop Evapotranspiration: Guidelines for Computing Crop Water Requirements; FAO Irrigation and Drainage Paper No. 56, Rome; Food Agric. Organ: Roma, Italy, 1998. [Google Scholar]
  37. Field, C.B.; Randerson, J.T.; Malmström, C.M. Global Net Primary Production: Combining Ecology and Remote Sensing. Remote Sens. Environ. 1995, 51, 74–88. [Google Scholar] [CrossRef]
  38. Potter, C.S. Continental-Scale Comparisons of Terrestrial Carbon Sinks Estimated from Satellite Data and Ecosystem Modeling 1982–1998. Glob. Planet. Chang. 2003, 39, 201–213. [Google Scholar] [CrossRef]
  39. Yu, D.; Shi, P.; Shao, H.; Zhu, W.; Pan, Y. Modelling Net Primary Productivity of Terrestrial Ecosystems in East Asia Based on an Improved CASA Ecosystem Model. Int. J. Remote Sens. 2009, 30, 4851–4866. [Google Scholar] [CrossRef]
  40. Bao, G.; Xin, X.; Bao, Y.; Wang, M.; Yuan, Z.; Wulantuya. Optimization of maximum light use efficiency in Inner Mongolia Steppe. Spectrosc. Spectr. Anal. 2016, 36, 3280–3286. (In Chinese) [Google Scholar]
  41. Sellers, P.J. Canopy Reflectance, Photosynthesis and Transpiration. Int. J. Remote Sens. 1985, 6, 1335–1372. [Google Scholar] [CrossRef]
  42. Los, S.O.; Justice, C.O.; Tucker, C.J. A Global 1° by 1° NDVI Data Set for Climate Studies Derived from the GIMMS Continental NDVI Data. Int. J. Remote Sens. 1994, 15, 3493–3518. [Google Scholar] [CrossRef]
  43. Sellers, P.J.; Randall, D.A.; Collatz, G.J.; Berry, J.A.; Field, C.B.; Dazlich, D.A.; Zhang, C.; Collelo, G.D.; Bounoua, L. A Revised Land Surface Parameterization (SiB2) for Atmospheric GCMs. Part 1. Model Formulation. J. Clim. 1996, 9, 676–705. [Google Scholar] [CrossRef]
  44. Los, S.O. Linkages between Global Vegetation and Climate: An Analysis Based on NOAA Advanced Very High Resolution Radiometer Data; National Aeronautics and Space Administration (NASA): Washington, DC, USA, 1998. [Google Scholar]
  45. Li, K.; Liu, X.; Hu, Y.; Mohammat, A.; Geng, F.; Han, W. Long-Term Increasing Productivity of High-Elevation Grassland Caused by Elevated Precipitation and Temperature. Rangel. Ecol. Manag. 2020, 73, 156–161. [Google Scholar] [CrossRef]
  46. Li, D.; Xu, D.; Wang, Z.; You, X.; Zhang, X.; Song, A. The Dynamics of Sand-Stabilization Services in Inner Mongolia, China from 1981 to 2010 and Its Relationship with Climate Change and Human Activities. Ecol. Indic. 2018, 88, 351–360. [Google Scholar] [CrossRef]
  47. Beven, K. A Sensitivity Analysis of the Penman-Monteith Actual Evapotranspiration Estimates. J. Hydrol. 1979, 44, 169–190. [Google Scholar] [CrossRef]
  48. Yin, Y.; Wu, S.; Dai, E. Spatio-temporal attribution of potential evapotranspiration in China from 1971 to 2008. Chin. Sci. Bull. 2010, 55, 3329–3337. (In Chinese) [Google Scholar] [CrossRef]
  49. Guo, W.; Huang, S.; Zhao, J.; Li, Z.; Huang, Q.; Deng, M. Spatio-temporal dynamics and driving forces of potential evapotranspiration in the Wei River Basin. Trans. Chin. Soc. Agric. Eng. 2021, 37, 81–89. (In Chinese) [Google Scholar]
  50. Zhang, M.; Yuan, N.; Lin, H.; Liu, Y.; Zhang, H. Quantitative Estimation of the Factors Impacting Spatiotemporal Variation in NPP in the Dongting Lake Wetlands Using Landsat Time Series Data for the Last Two Decades. Ecol. Indic. 2022, 135, 108544. [Google Scholar] [CrossRef]
  51. Roderick, M.L.; Rotstayn, L.D.; Farquhar, G.D.; Hobbins, M.T. On the Attribution of Changing Pan Evaporation. Geophys. Res. Lett. 2007, 34, L17403. [Google Scholar] [CrossRef]
  52. Gao, Y.; Wang, H.; Zhao, M. Spatio-temporal dynamics of vegetation net primary productivity and its response to climate change in desert steppe, Inner Mongolia: A case study in Siziwang Banner. J. China Agric. Univ. 2020, 25, 100–107. (In Chinese) [Google Scholar]
  53. Yang, H.; Zhou, W.; Shi, P.; Huang, L. Analysis of temporal-spatial variations of NPP and coupling relationship with hydrothermal factors in grasslands of Inner Mongolia. Res. Soil Water Conserv. 2019, 26, 234–240. (In Chinese) [Google Scholar]
  54. Ren, H.; Shang, Y.; Zhang, S. Measuring the Spatiotemporal Variations of Vegetation Net Primary Productivity in Inner Mongolia Using Spatial Autocorrelation. Ecol. Indic. 2020, 112, 106108. [Google Scholar] [CrossRef]
  55. Hao, L.; Wang, S.; Cui, X.; Zhai, Y. Spatiotemporal Dynamics of Vegetation Net Primary Productivity and Its Response to Climate Change in Inner Mongolia from 2002 to 2019. Sustainability 2021, 13, 13310. [Google Scholar] [CrossRef]
  56. Zhang, T.; Yu, G.; Chen, Z.; Hu, Z.; Jiao, C.; Yang, M.; Fu, Z.; Zhang, W.; Han, L.; Fan, M.; et al. Patterns and Controls of Vegetation Productivity and Precipitation-Use Efficiency across Eurasian Grasslands. Sci. Total Environ. 2020, 741, 140204. [Google Scholar] [CrossRef] [PubMed]
  57. Qin, X.; Hong, J.; Ma, X.; Wang, X. Global Patterns in Above-Ground Net Primary Production and Precipitation-Use Efficiency in Grasslands. J. Mt. Sci. 2018, 15, 1682–1692. [Google Scholar] [CrossRef]
  58. Hossain, M.L.; Li, J. Effects of Long-Term Climatic Variability and Harvest Frequency on Grassland Productivity across Five Ecoregions. Glob. Ecol. Conserv. 2020, 23, e01154. [Google Scholar] [CrossRef]
  59. Jia, W.; Liu, M.; Yang, Y.; He, H.; Zhu, X.; Yang, F.; Yin, C.; Xiang, W. Estimation and Uncertainty Analyses of Grassland Biomass in Northern China: Comparison of Multiple Remote Sensing Data Sources and Modeling Approaches. Ecol. Indic. 2016, 60, 1031–1040. [Google Scholar] [CrossRef]
  60. Yue, S.; Xu, D.; Liu, C. Photosynthetic characteristics and main influence factors of five kinds of forage grass in desert steppe. Southwest China J. Agric. Sci. 2015, 28, 390–396. (In Chinese) [Google Scholar]
  61. Kasischke, E.S.; Melack, J.M.; Craig Dobson, M. The Use of Imaging Radars for Ecological Applications—A Review. Remote Sens. Environ. 1997, 59, 141–156. [Google Scholar] [CrossRef]
  62. Li, P.; Bennett, J. Understanding Herders’ Stocking Rate Decisions in Response to Policy Initiatives. Sci. Total Environ. 2019, 672, 141–149. [Google Scholar] [CrossRef]
  63. Su, R.; Yu, T.; Dayananda, B.; Bu, R.; Su, J.; Fan, Q. Impact of Climate Change on Primary Production of Inner Mongolian Grasslands. Glob. Ecol. Conserv. 2020, 22, e00928. [Google Scholar] [CrossRef]
  64. Hua, Y.; Sa, R.; Wang, B. Spatial and temporal variation of grassland NPP and its driving forces in Inner Mongolia. J. Desert Res. 2021, 41, 130–139. (In Chinese) [Google Scholar]
  65. Hao, L.; Sun, G.; Liu, Y.; Gao, Z.; He, J.; Shi, T.; Wu, B. Effects of Precipitation on Grassland Ecosystem Restoration under Grazing Exclusion in Inner Mongolia, China. Landsc. Ecol. 2014, 29, 1657–1673. [Google Scholar] [CrossRef]
  66. Hoffmann, C.; Giese, M.; Dickhoefer, U.; Wan, H.; Bai, Y.; Steffens, M.; Liu, C.; Butterbach-Bahl, K.; Han, X. Effects of Grazing and Climate Variability on Grassland Ecosystem Functions in Inner Mongolia: Synthesis of a 6-Year Grazing Experiment. J. Arid Environ. 2016, 135, 50–63. [Google Scholar] [CrossRef]
  67. Liu, H.; Song, X.; Qin, L.; Wen, W.; Liu, X.; Hu, Z.; Liu, Y. Improvement and Application of Key Pasture Theory for the Evaluation of Forage–Livestock Balance in the Seasonal Grazing Regions of China’s Alpine Desert Grasslands. Sustainability 2020, 12, 6794. [Google Scholar] [CrossRef]
  68. Li, H.; Hong, Y.; Deng, G.; Wu, R.; Zhang, H.; Zhao, J.; Guo, X. Impact of climate change and human activities on net primary productivity of grasslands in Inner Mongolia, China during 1982−2015. Chin. J. Appl. Ecol. 2021, 32, 415–424. (In Chinese) [Google Scholar]
  69. Zhang, M.; Lal, R.; Zhao, Y.; Jiang, W.; Chen, Q. Spatial and Temporal Variability in the Net Primary Production of Grassland in China and Its Relation to Climate Factors. Plant Ecol. 2017, 218, 1117–1133. [Google Scholar] [CrossRef]
  70. Ma, R.; Xia, C.; Liu, Y.; Wang, Y.; Zhang, J.; Shen, X.; Lu, X.; Jiang, M. Spatiotemporal Change of Net Primary Productivity and Its Response to Climate Change in Temperate Grasslands of China. Front. Plant Sci. 2022, 13, 899800. [Google Scholar] [CrossRef]
  71. Wu, N.; Liu, A.; Ye, R.; Yu, D.; Du, W.; Chaolumeng, Q.; Liu, G.; Yu, S. Quantitative Analysis of Relative Impacts of Climate Change and Human Activities on Xilingol Grassland in Recent 40 Years. Glob. Ecol. Conserv. 2021, 32, e01884. [Google Scholar] [CrossRef]
  72. Grime, J.P. Competitive Exclusion in Herbaceous Vegetation. Nature 1973, 242, 344–347. [Google Scholar] [CrossRef]
  73. Liu, Y.Y.; Zhang, Z.Y.; Tong, L.J.; Wang, Q.; Zhou, W.; Wang, Z.Q.; Li, J.L. Spatiotemporal dynamics of China’s grassland NPP and its driving factors. Chin. J. Ecol. 2020, 39, 349–363. (In Chinese) [Google Scholar]
  74. Robinson, B.E.; Li, P.; Hou, X. Institutional Change in Social-Ecological Systems: The Evolution of Grassland Management in Inner Mongolia. Glob. Environ. Chang. 2017, 47, 64–75. [Google Scholar] [CrossRef]
  75. Wang, M.N. Analysis on the Influence of the Second Round of Grassland Ecological Protection Subsidy and Reward Policy on Grassland Productivity and Social Development in Otog. Master Thesis, Inner Mongolia Agricultural University, Hohhot, China, 2021. [Google Scholar]
Figure 1. Geographical location and grassland distribution of the study area.
Agronomy 13 01140 g001
Figure 2. Interannual variations of NPP for the whole region (a) and different grassland types (b). Temperate steppe (TS), Temperate desert-steppe (TDS), Temperate steppe-desert (TSD), Temperate desert (TD), Lowland saline meadow (LSM), Other grassland (OG).
Agronomy 13 01140 g002
Figure 3. Mean annual values and variation coefficients ( C v ) of NPP for different grassland types in Otog Banner. Temperate steppe (TS), Temperate desert-steppe (TDS), Temperate steppe-desert (TSD), Temperate desert (TD), Lowland saline meadow (LSM), Other grassland (OG). Different small letters meant significant difference at 0.05 level.
Agronomy 13 01140 g003
Figure 4. Spatial distributions of grassland NPP.
Agronomy 13 01140 g004
Figure 5. Spatial responses of grassland NPP to different climate factors, namely, (a) Temperature (TEM), (b) precipitation (PRE), (c) Relative humidity (RHU), (d) Sunshine duration (SSD), (e) Wind speed (WIN), (f) Reference evapotranspiration (ET0).
Agronomy 13 01140 g005
Figure 6. Changing trends of grassland NPP.
Agronomy 13 01140 g006
Figure 7. Changing patterns of grassland NPP. Whole study area (WA), Temperate steppe (TS), Temperate desert-steppe (TDS), Temperate steppe-desert (TSD), Temperate desert (TD), Lowland saline meadow (LSM), Other grassland (OG).
Agronomy 13 01140 g007
Figure 8. Contributions of climate factors to the dynamics of grassland NPP. Temperature (TEM), precipitation (PRE), Relative humidity (RHU), Sunshine duration (SSD), Wind speed (WIN), Reference evapotranspiration (ET0).
Agronomy 13 01140 g008
Figure 9. Contributions of climate change and human activities to the dynamics of grassland NPP.
Agronomy 13 01140 g009
Figure 10. Grassland restoration and degradation dominated by climate change and human activities.
Agronomy 13 01140 g010
Figure 11. Statistical analysis of the grassland restoration and degradation areas dominated by climate change and human activities. Whole study area (WA), Temperate steppe (TS), Temperate desert-steppe (TDS), Temperate steppe-desert (TSD), Temperate desert (TD), Lowland saline meadow (LSM), Other grassland (OG).
Agronomy 13 01140 g011
Table 1. Changing patterns of grassland NPP.
θ s l o p e pChanging Patterns
>0<0.05Significantly restored
>0>0.05Slightly restored
<0>0.05Slightly degraded
<0<0.05Severely degraded
θ s l o p e is the interannual change rate of NPP. p is the result of significance test of θ s l o p e .
Table 2. Statistical results of the contributions of climatic factors and human activities to the dynamics of grassland NPP, (g C m−2 yr−1).
TypeTEMPRERHUSSDWINET0CCHA
WA−0.0030.4790.268−0.0220.126−0.2550.593−2.733
TS−0.2200.3090.5420.042−0.070−0.5660.036−1.943
TDS−0.0530.6100.604−0.0030.103−0.6640.598−3.586
TSD−0.1600.361−0.846−0.106−0.770−0.050−1.5700.122
TD0.0230.378−0.476−0.030−0.407−0.006−0.5190.622
LSM−0.0530.3740.3710.0100.179−0.2230.658−1.229
OG−0.0940.3000.4050.0200.137−0.3150.453−1.646
Whole study area (WA), Temperate steppe (TS), Temperate desert-steppe (TDS), Temperate steppe-desert (TSD), Temperate desert (TD), Lowland saline meadow (LSM), Other grassland (OG), Temperature (TEM), precipitation (PRE), Relative humidity (RHU), Sunshine duration (SSD), Wind speed (WIN), Reference evapotranspiration (ET0).
Table 3. Evaluation of the relative impacts of climate change and human activities on grassland NPP dynamics.
Scenario θ s l o p e C c o n H c o n Driving Action
1>0>0>0 | C c o n | > | H c o n | ,   Climate - dominated
| C c o n | < | H c o n | , Human-dominated
2>0<0Climate-dominated
3<0>0Human-dominated
4<0<0<0 | C c o n | > | H c o n | ,   Climate - dominated
| C c o n | < | H c o n | , Human-dominated
5<0>0Climate-dominated
6>0<0Human-dominated
θ s l o p e is the interannual change rate of NPP. C c o n and H c o n represent the contributions of climate change and human activities to the interannual change rate of grassland NPP, respectively.
Disclaimer/Publisher’s Note: The statements, opinions and data contained in all publications are solely those of the individual author(s) and contributor(s) and not of MDPI and/or the editor(s). MDPI and/or the editor(s) disclaim responsibility for any injury to people or property resulting from any ideas, methods, instructions or products referred to in the content.

