Article

The Effect of Faecal Sludge Biochar on the Growth and Yield of Tomato (Solanum lycopersicum L.) Cultivar Micro-Tom

1
Department of Chemistry, Faculty of Science and Engineering, Swansea University, Swansea SA2 8PP, UK
2
Department of Biosciences, Faculty of Science and Engineering, Swansea University, Swansea SA2 8PP, UK
3
Department of Geography, Faculty of Science and Engineering, Swansea University, Swansea SA2 8PP, UK
*
Author to whom correspondence should be addressed.
Agronomy 2023, 13(5), 1233; https://doi.org/10.3390/agronomy13051233
Submission received: 5 April 2023 / Revised: 23 April 2023 / Accepted: 25 April 2023 / Published: 27 April 2023
(This article belongs to the Special Issue Application of Biochar as Fertilizer and Restorative in Agriculture)

Abstract

:
Full-scale pyrolysis of faecal sludge in developing nations is an emerging technology for the complete removal of pathogens and the concurrent creation of biochar, a soil amendment shown to enhance crop productivity. Currently there is little information on the effects of faecal sludge biochar on soil and crop yield. Faecal sludge biochar was applied to an acidic, sandy soil to assess its effects on plant growth and yield in Micro-Tom, a model cultivar of tomato (Solanum lycopersicum L.). We examined four soil application treatments: a control soil, fertilizer treatment, biochar treatment, and a combined biochar and fertilizer treatment. The combined treatment of biochar and fertilizer together produced a tomato yield 2980% greater than the tomato yield from control soil, whereas biochar on its own increased the yield by 1060%. There was no significant difference in plant height between the combined biochar and fertilizer application and biochar on its own; however, both treatments significantly increased plant height compared to control soil. Below ground biomass showed a similar pattern, with no significant difference between biochar alone and combined biochar and fertilizer treatments, and both treatments resulted in significantly increased below ground biomass compared to control soil. The combined biochar and fertilizer treatment resulted in significantly lower water runoff than all other treatments. These findings have great potential implications for increasing food security and the creation of more sustainable agricultural practices, especially in developing regions.

1. Introduction

It is estimated that 2.3 billion people in the world still do not have access to basic sanitation facilities [1]. Approximately 2.1–2.6 billion people in low- and middle-income nations depend on onsite sanitation facilities [2] that generate vast quantities of untreated faecal sludge (FS) each day. In developing countries, the dumping of untreated faecal sludge from onsite sanitation facilities straight into the environment causes water pollution due to the high nutrient content and poses a danger to public health due to the high pathogen content. Long-term and more sustainable solutions to deal with faecal sludge that do not involve expensive water- and energy-intensive sewer systems are needed.
The thermochemical treatment of faecal sludge produces biochar, which differs from charcoal as its main use is soil amendment [3]. Biochar is a carbon-rich, charcoal-like material produced by biomass pyrolysis at temperatures of 350–1000 °C in the absence of oxygen [4]. The original feedstock source and pyrolysis temperature are the two principal factors determining the physico–chemical properties of biochars [5,6,7]. Other parameters influencing biochar properties include residence time, heating rate, and feedstock particle size [8]. Residence time has been shown to have no influence on the ash content or pH of biochar, with the feedstock being the primary driver in terms of inorganic mineral content, pH, and ash content of biochar [9]. The use of biochar to enhance soil fertility and increase crop growth arose from the analysis of Amazonian black earth (Terra Preta), a very dark, fertile soil with higher organic carbon and nutrient contents than surrounding soils [10]. Not only does biochar improve the carbon content and nutrient levels, but it can also increase the cation-exchange capacity (CEC) of the soil [10], the water-holding capacity [11], and increase pH levels in acidic soil [12]. As well as improving the physical and chemical properties of soil, biochar as a soil amendment is beneficial for long-term carbon sequestration and enhancement of soil microbial life [13,14,15]. Biochar can be applied to improve poor acidic soils, the majority of which are found in the tropics and subtropics [16] in developing nations, which are more at risk of climate change and food insecurity [17,18]. Many developing nations, such as countries located in Sub-Saharan Africa, suffer from soil degradation [19], including low soil pH, low fertility, and low water-holding capacity [20].
The greatest rise in food demand is also projected to occur in the world’s poorest nations, where climate change will likely decimate crop yields by 15–20% [21]. In developing nations, subsistence farming and small-scale agricultural settings are widespread, so improving soil health is critical to increase crop yield and alleviate food insecurity in these regions. The application of inorganic fertilizer to improve soil fertility has increased over the years in developing nations. However, there are still potential constraints to its large-scale application, such as supply problems and inappropriate fertilizer blends for local soil properties [22]. These constraints are greater in countries with limited or non-existent input subsidy programs, and thus overall, approximately only a third of sub-Saharan African farmers use inorganic fertilizers [23]. Biochar has the potential to be used as either an alternative where fertilizer is not readily available or to be used in combination with fertilizer to improve nutrient uptake and increase crop yield [24]. The application of biochar with inorganic fertilizer has shown to improve crop yield and profitability in Ghana [25]. Additionally, only a small fraction of acidic soil is used for arable crops globally, but approximately 50% of the earth’s potential arable lands are acidic [26]. Faecal sludge biochar with its liming capability has the potential to improve these soils and increase crop productivity.
Aside from poor, infertile soils, climate change-induced droughts will exacerbate food insecurity by decreasing farming output and negatively impacting the livelihoods of smallholder farmers in developing nations [27]. Nearly 6 billion people will experience clean water scarcity by 2050 due to the rising demand for water, declining water resources, and increasing water pollution, driven by rapid economic and population growth [28]. Biochar has the potential to alleviate drought conditions and improve crop yield due to its water-holding capacity (WHC) [29]. The porous structure of biochar results in greater WHC of soil [30] and increases water availability [31,32,33]. Biochar application has been shown to reduce wilting in tomato seedlings under drought conditions [34]. The adsorption behaviour of biochar is also strongly aligned with its cation-exchange capacity, and this along with WHC is critical to improving water and nutrient retention in the sandy soils of smallholding farms in developing regions such as Sub-Saharan Africa [19].
Biochar production from faecal sludge creates an opportunity to recover nutrients from waste alongside increased soil fertility, crop yields, and food security in the poorest regions on the planet. There is a considerable amount of research investigating the characteristics of sewage sludge-derived biochar but less on faecal sludge biochar [35]. Faecal sludge biochar has been shown to increase yield and tissue nutrient concentrations in lettuce [36] as well as increase the pH and CEC of soil [37]. Research has largely focused on small-scale laboratory produced biochar; however, it is becoming increasingly important to investigate the biochar characteristics and agronomic properties of operational up-scaled sludge treatment technologies [38]. The real-world, large-scale production of FS biochar can result in biochars with varying characteristics, which influence the effectiveness of these biochars in improving soil properties and increasing crop yields. The properties of faecal sludge itself can vary over season and location [39], and heavy metal concentrations within biochars can be affected by the disposal of polluting waste in community toilets [40]. In large-scale treatment facilities, sintering of the material can occur in the reactor, leading to the removal of these sintered mineral depositions from the reactor on a weekly basis [41]. Therefore, biochar towards the end of the week may contain more sintered material, which would affect its properties. The ash content of biochar influences the biochar pH and plays an important role in it use as a soil amendment due to the liming effect. The ash content of FS biochars can vary over time and location due to contamination of faecal sludge by sand and grit caused by poorly lined containment structures [42] and sand adhering to the faecal sludge from the surface of drying beds [43]. Investigating the effectiveness of faecal sludge biochar from large-scale treatment plants as soil amendments is crucial to inform the use of these biochars in the future and to help solve the sanitation crisis in developing countries.
Tomatoes were chosen for this study as they are one of the most popular and most widely grown vegetables in the world [44] and tomato production is a major source of income for smallholder farmers in developing countries [45,46,47]. The tomato cv. Micro-Tom was chosen as it is an ideal candidate cultivar for a tomato model system. This is due to its small size, rapid life cycle (70–90 days from seed to fruit ripening), and its suitability for large-scale cultivation [48,49].
The aim of this study was to assess the agronomic potential of three large-scale-produced faecal sludge biochars on the yield of the tomato cultivar Micro-Tom (Solanum lycopersicum L.) in acidic, nutrient-poor soils. The effects on plant height, leaf length, tomato yield, above and below ground biomass, water runoff, and soil properties of application of biochar, fertilizer, and combined fertilizer and biochar treatments were investigated.

2. Materials and Methods

2.1. Biochar

The faecal feedstocks for the preparation of the biochars used in this study were sourced from three different faecal sludge and septage processors in India: Narsapur in Andhra Pradesh, Warangal in Telangana, and Wai in Maharashtra. The Warangal and Narsapur treatment plants currently have a capacity of 15 m3 per day, whereas the Wai treatment plant has a capacity of 70 m3 per day. FS collected from septic tanks is delivered to each processing plant where it is stored in holding tanks for homogenization of the sludge. Tide Technocrats Private Limited have several community-scale faecal sludge and septage processors that sanitise faecal waste and dewater the sludge (5–10% moisture content) using solar energy in drying beds. Solar drying is managed on-site and expedited by spreading the sludge in a 10 mm layer. The sludge is pyrolysed into biochar using a flame temperature operating range of 550–750 °C. The process relies on autothermal operation, thus a limited supply of oxygen flows through an air fan into the main reaction chamber to allow for partial oxidation. The biochar is stored in airtight boxes and quenched in water baths. Three 5 kg biochar samples were collected from each processor in September 2018. Previous work showed that there were some differences in biochar properties in terms of pH, pore volume, electrical conductivity, carbon content, and ash content [50]. Therefore, the glasshouse trial included three replicates of each biochar to determine the effect on plant height and fruit yield of each biochar.
The basic characteristics of the biochars, WGL_BC (Warangal biochar), NSP_BC (Narsapur biochar), and WAI_BC (Wai biochar), are given in Table 1. Detailed methods for determining the biochar properties were previously reported [50].

2.2. Soil

The soil selected for the study had similar pH values to Indian red soil, which is found in many regions of India, including Andhra Pradesh and Telangana, and is acidic in nature with pH 5.4 [43]. The soil used for this study was collected from farmland at Cathelyd Isaf Farm (51°42′38.0″ N; 3°54′40.9″ W) near Swansea, Wales. It had a loamy, sandy texture and was acidic in nature, with a pH measured at 5.0 ± 0.06. A composite sample was collected down to 0.2 m of the topsoil layer, and then sieved through a 5 mm sieve. At the end of the trial, 5:1 deionised water to soil solutions were prepared and the pH of the soil was measured using a Voltcraft soil pH meter. Soil electrical conductivity was measured using a Whatman CDM 400 electrical conductivity meter. The soil textural and chemical properties are reported in Supplementary information (Tables S1 and S2).

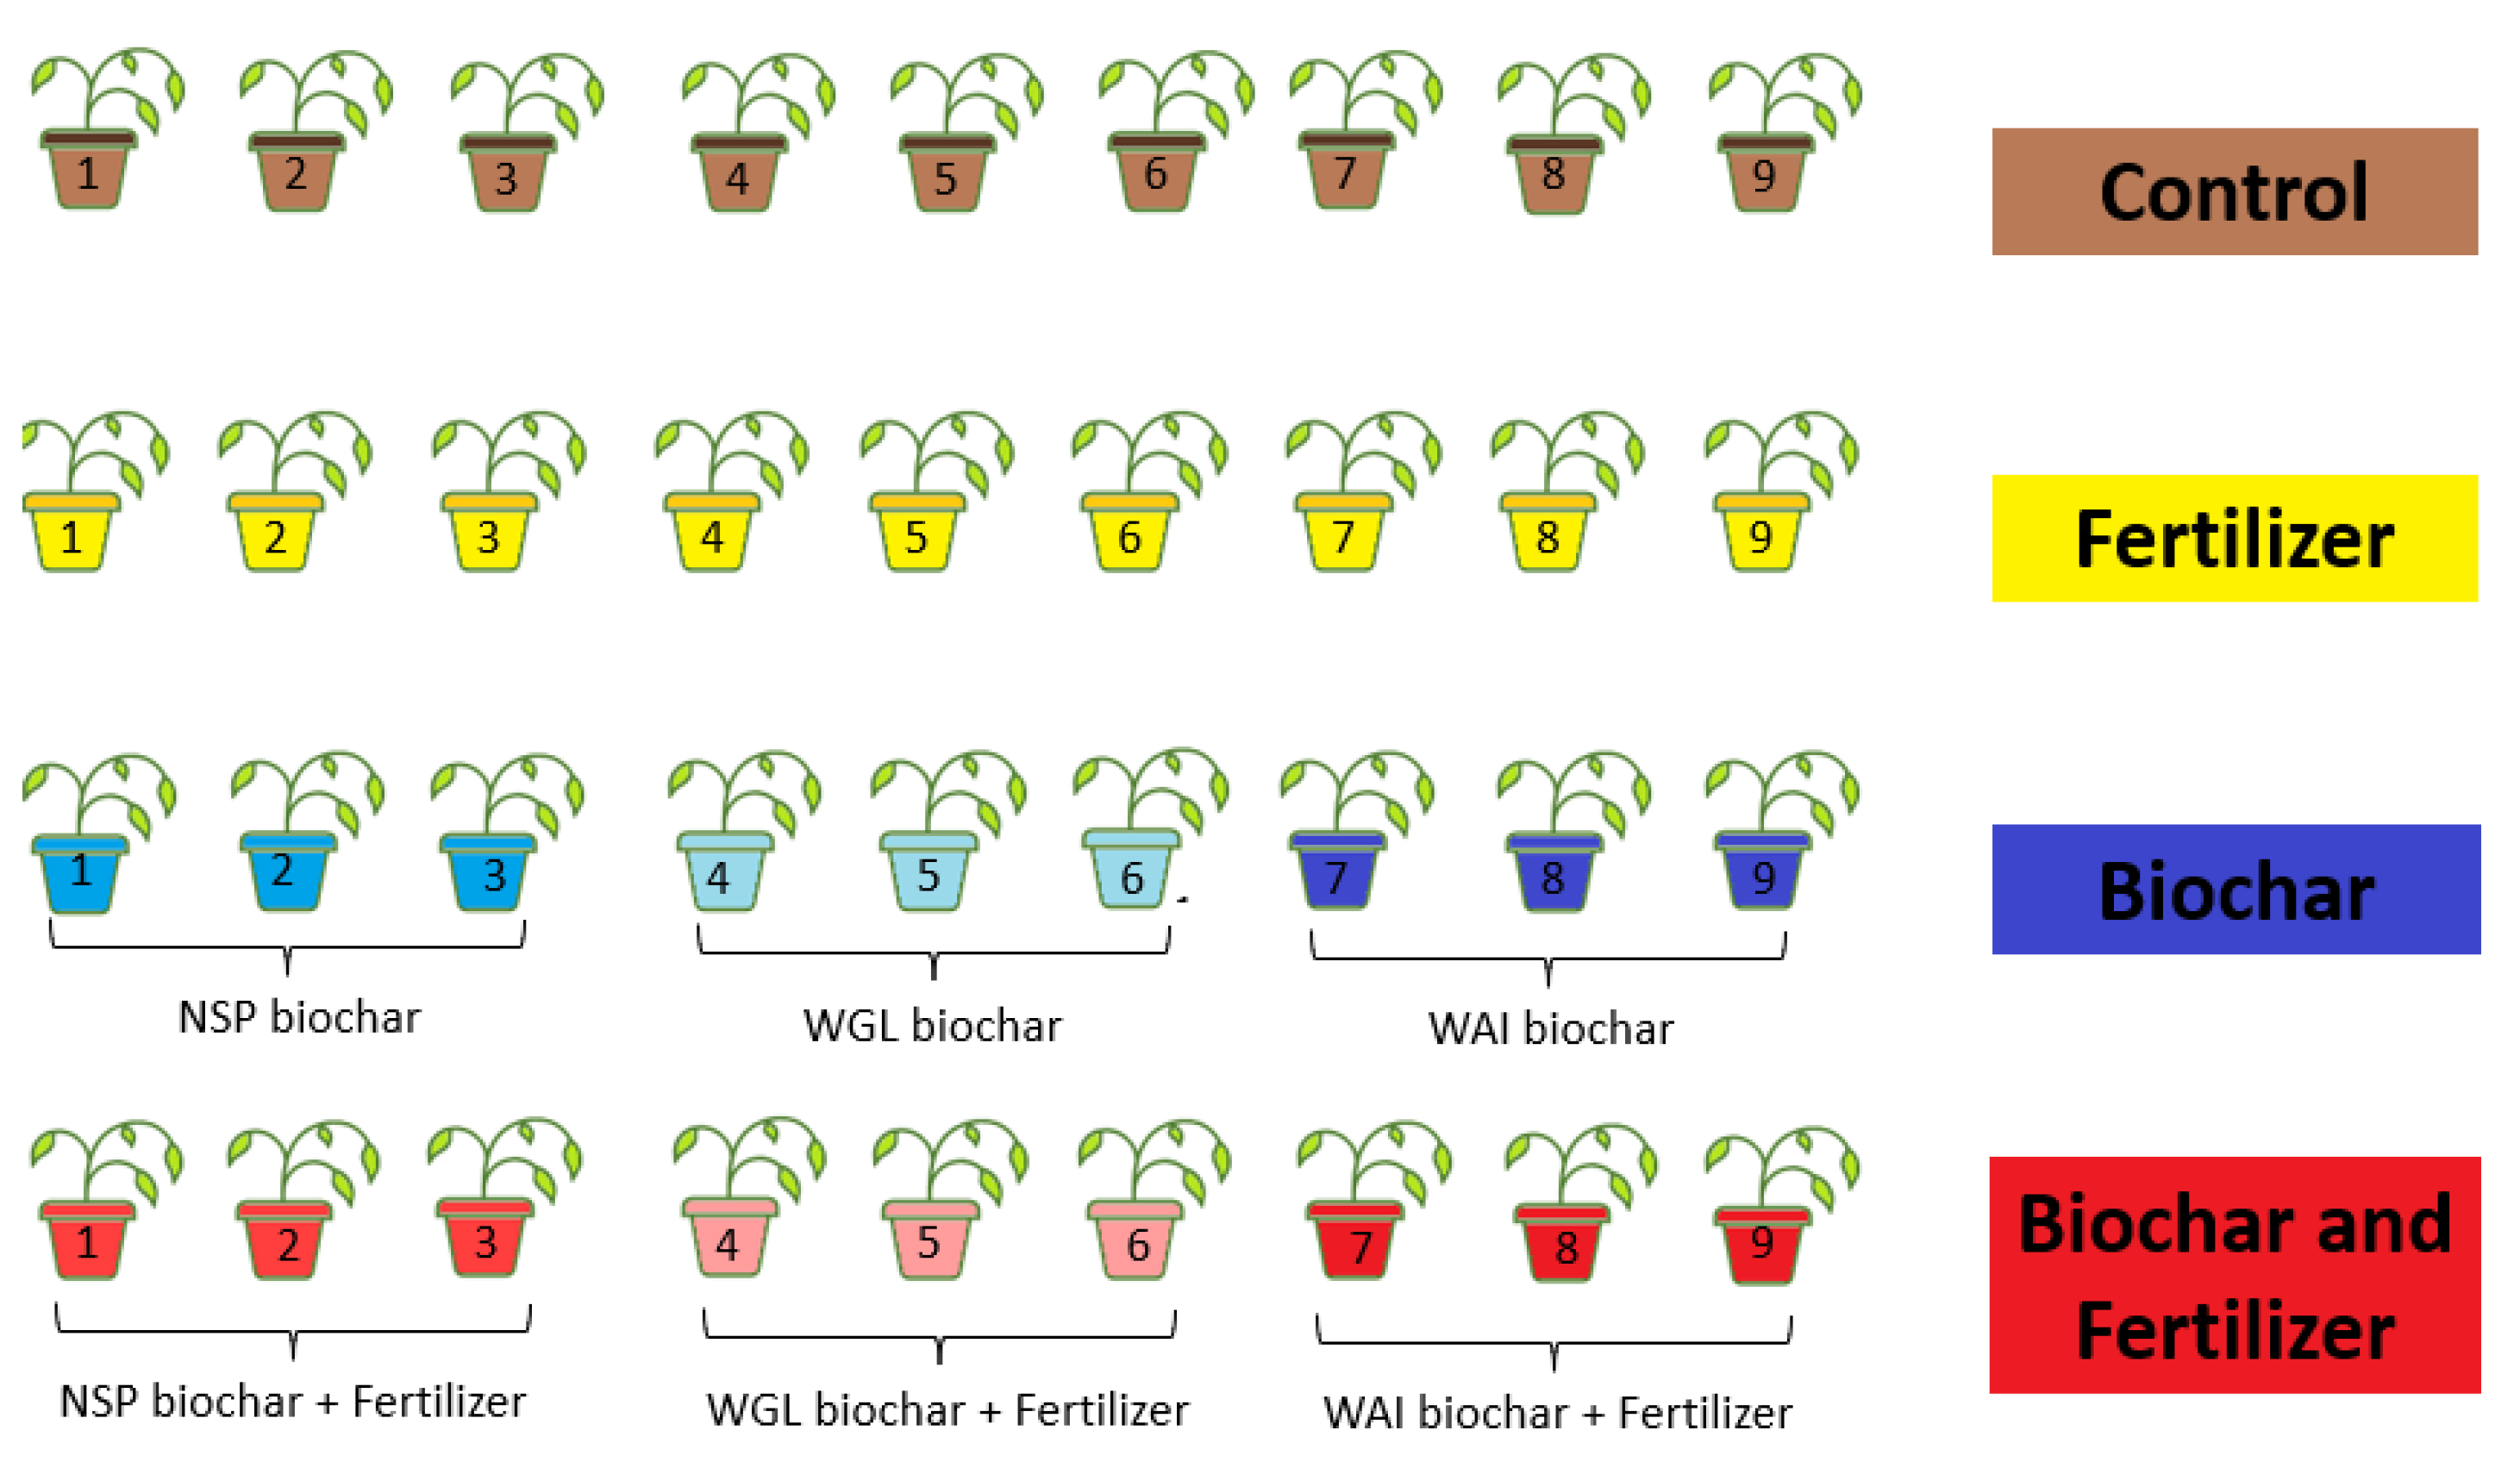
2.3. Plant Growth Experiment

The Micro-Tom cultivar (Solanum lycopersicum L.) was used to examine the impacts of faecal sludge biochar on plant height, fruit yield, water runoff, above and below ground biomass, and leaf length. The tomato plant trials were carried out between June and August 2020 in an outdoor glasshouse environment to maintain conditions close to field conditions whilst maintaining control over certain parameters. The temperature ranged from a minimum of 7 °C to a maximum of 49 °C, and the humidity ranged from 17% to 100%. The average temperature for the duration of the trial was 19.3 ± 6.2 °C and the average humidity was 80.6 ± 16.7%.
Cylindrical plastic pots 9 cm in diameter and 8.7 cm in height were used for the pot trials. The experimental design was a random block design with four treatments and nine replications. The four treatments were: (i) soil (control); (ii) soil with fertilizer (Fert); (iii) soil with biochar (BC); and (iv) soil with biochar and fertilizer (BC + Fert). All treatments containing biochar, including the combined biochar and fertilizer treatment, were divided into subgroups with three of each biochar from the three different processing plants in Warangal (WGL), Wai (WAI), and Narsapur (NSP) (Figure 1). The fertilizer used was a commercial seaweed enriched fertilizer called Gro-Sure (NPK 6.0 3.0 10.0). An environmental logger (Elitech multi-use temperature and humidity data logger model RC-51H) was used to record the temperature and humidity every 2 h for the duration of the trial (Supplementary Figures S1 and S2).
In each pot, 137.74 g of air-dried soil was packed and biochar was applied at 4.2% (w/w), which was approximately equivalent to 10 t ha−1. A commercial liquid tomato fertilizer was applied, equivalent to 90 kg of nitrogen, 50 kg of phosphorus, and 50 kg of potassium ha−1. Fertilization commenced 4 weeks after the seeds were planted and continued once a week for the duration of the experiment.
Seeds of tomato were sown in seedling trays using a commercial compost to encourage germination before being transplanted into the treatment pots. After two weeks, the germinated seedlings from the seedling trays were transferred to the pots containing soil and biochar. For the first 10 days, the pots were watered without drainage and moisture levels were monitored using a soil moisture sensor (Manufacturer: HYCKee).
After 10 days, sealable polythene bags were placed around each pot and the plants were watered with drainage to allow the runoff water volume to be measured. All pots were irrigated with the same volume of water every other day and occasionally every day depending on weather conditions. Measurements of water runoff commenced on day 22 after initial seed planting and plant height on day 31 when the plants had grown to a height that allowed accurate measurement. Plant height was measured using a tape measure from the soil to the tip of the plant. Plant height was measured every other day throughout the experiment. During the trial, the runoff from each plant was collected in a polythene bag placed around the pot. After an hour, water runoff was measured by decanting the water from the polythene bags into a measuring cylinder. The length of the largest leaf in each plant was measured throughout the experiment starting from Day 24 after planting. At harvest, all fruits were counted and weighed, and the wet above ground and below ground biomass for each plant were measured. The roots were carefully removed from the soil and washed with water before being placed on paper towels to remove excess water before weighing.

2.4. Statistical Analysis

The relationship between the biochar soil treatments and the specific plant responses and soil properties were examined using generalised linear models in R (R Core Team, 2021). Plant growth responses, which were plant height, leaf length, and above and below ground biomass, were examined against the four different treatments (control, fertilizer, biochar, and combined biochar and fertilizer) using a GLM (generalised linear model) and a post-hoc pairwise test was applied to examine the significance across the different treatments using the emmeans package [51], which was adjusted accordingly for the different model distributions. For all plant responses, the GLM was modelled to a gamma distribution due to the positive skewness displayed, except for plant height, which was modelled to a Gaussian distribution. A second set of GLMs was applied to the same plant growth responses to examine whether the presence of biochar (regardless of fertilizer treatment) was more influential than the combination of treatments. This analysis was then repeated to examine whether the presence of fertilizer was the overriding factor affecting plant growth. AIC scores for each of the models in each case were compared to ascertain the most parsimonious model. The same set of analyses was repeated for soil properties, including water runoff, pH, and electrical conductivity (EC), also using a gamma distribution due to the positive skewness in the dataset’s distributions. For fruit production (number of fruits and yield), the dataset also showed positive skewness, which was appropriate to a gamma distribution. However before the same set of analyses was conducted, the dataset was transformed to remove zeros in order to avoid model error from the small number of individuals that did not produce any fruit. For all plant and soil responses, an additional analysis was conducted to examine whether biochar type significantly altered the response variable. The data were subsetted into biochar presence, and GLM models were applied to examine all response variables against the three different types of biochar (Warangal, Narsapur, and Wai), except for EC, as biochar was not significant in altering soil EC. The results are listed in Supplementary material.

3. Results

3.1. Plant Growth Responses

3.1.1. Plant height and leaf length

Plants treated with the biochar and fertilizer combination grew the tallest (11.5 cm) and plants that were subjected to biochar only were the second tallest (10.5 cm) (Table 2).
In terms of plant height, there a was marked difference between plant height for individuals that were treated with biochar and those that were not (Figure 2).
The biochar only and biochar + fertilizer treatments were not significantly different from each other, showing that the additional application of fertilizer was not needed to obtain similar total plant height; however, both treatments were significantly different from the control treatment (Table 3). The best model explaining plant height variation was the one in which all treatment terms were included, as it had the lowest AIC value of 136.2828 (Table 4).
The model that included biochar presence only as a term had a lower AIC value (141.8475) than the model that included fertilizer presence only as a term (154.9203), and both explained less variation in the model than the model that included all separate treatment terms (Table 4).
Interestingly, when we explored the accumulation of height over time for all individuals across all treatments (Figure 3), all treatments displayed a similar pattern of growth, showing a classic asymptote pattern of growth. Only those individuals that were not subjected to either biochar or the combination of biochar and fertilizer were markedly smaller.
Leaf length also showed a very similar pattern as plant height, with a marked difference in plants that were either grown in biochar or biochar + fertilizer (Figure 2a). The most parsimonious model explaining leaf length was the model that included all treatment terms, having the lowest AIC value of 74.4528 (Table 4). Moreover, all treatments were significantly different from each other, except for biochar and biochar + fertilizer (Table 3). Again, similar to plant height, both of the models that contained biochar presence only and fertilizer presence only as terms had much higher AIC values (90.45016 and 130.4761, respectively) than the most parsimonious model. Overall, the presence of fertilizer seemed less effective than the presence of biochar alone for both plant height and leaf length. Additionally, biochar type was examined to determine whether it impacted plant height and leaf length. The generalised linear models showed no significant difference in growth across the different biochar types (Table S3 and Figure S3), showing that the origin/properties of the biochar did not alter plant growth responses.

3.1.2. Above and Below Ground Biomass

Plants had greater above ground biomass when they were grown in the treatment of biochar + fertilizer (Figure 4). Plants grown in the fertilizer only and biochar only treatments showed similar biomass production. Plants grown in the control condition had markedly lower biomass than all other treatments. The most parsimonious model was the model that included all terms, having the lowest AIC of 108.4831 (Table 4). Additionally, all combinations of treatments were significantly different from each other, except the fertilizer only and biochar only treatments (Table 3), which is evident in Figure 4 from the overlapping ranges. However, it is important to note the biochar only treatment had a much higher median than the fertilizer only treatment. Additionally, biochar type was separately analysed for all plants receiving biochar application and it was shown that biochar type had no significant influence on above ground biomass (Figure S4).
Below ground biomass also differed across treatments, with plants grown in the biochar or biochar + fertilizer treatments showing markedly greater below ground biomass than those plants that were grown in the fertilizer only or control treatments (Figure 5). The most parsimonious model was that which included all treatments terms, having the lowest AIC value of 87.85519 (Table 4). All combinations of treatments were significantly different from each other, apart from the biochar only and biochar + fertilizer treatments and the biochar only and fertilizer only treatments (Table 3). Interestingly, for below ground biomass, when biochar type was examined separately, there was a significant difference between biochar types (Table S3 and Figure S4), with plants grown in the NSP biochar type having significantly lower below ground biomass than plants grown in the WAI and WGL biochar types. This significant difference may indicate that biochar type may not impact above ground plant growth, but it may be important in altering below ground growth and processes.

3.2. Fruit Production

The number of fruits produced per plant was markedly higher for plants grown in the biochar only and biochar + fertilizer treatments, with the biochar + fertilizer treatment producing the most amount of fruit (Figure 6).
The model that included all combination treatment terms was the most parsimonious model, having the lowest AIC value of 142.6897 (Table 4), and all treatments were significantly different from each other except the control and fertilizer only treatments, which both produced much fewer fruit (Table 3). Fruit yield also showed a similar pattern, with the biochar + fertilizer treatment having markedly higher yields (28.9 g) (Figure 7) than the biochar only (11.9 g) and fertilizer only (3.3 g) treatments (Table 2).
The most parsimonious model was the one that included all treatment terms and all treatments were significantly different from each other (Table 3 and Table 4). Whilst there was no significant difference between the control and fertilizer only treatments for the number of fruits produced, there was a significant difference in yield between the fertilizer only and control treatments. The fertilizer only treatment produced a significantly greater yield than the control treatment. Overall, it was clear that the biochar + fertilizer treatment produced larger and more numerous fruits than any other treatment. Additionally, when biochar type was separately analysed, there was no significant difference between biochar type and fruit number or yield (Table S3 and Figure S5).

3.3. Soil Properties

Water runoff was much lower in plants grown in the biochar only or biochar and fertilizer treatments (Figure 8). The model containing all treatment combinations was the most parsimonious (AIC 457.4257), and the results showed that all combinations were significantly different from each other, apart from the control and fertilizer only treatments (Table 3 and Table 4). Interestingly, when biochar type was separately analysed, there was no significant difference, showing that the origin and/or properties of the biochar did not alter the water-holding capacity of the soil (Table S3, Figure S6).
The soil pH displayed unusual results (Figure 9). Although both the biochar only and biochar fertilizer treatments had higher soil pH values overall, they were not significantly different from the soil pH in the control treatment (Table 3). The model containing all treatment combination terms was not the most parsimonious, with an AIC value of 37.294 (Table 4). The model that explained the most variation in the data was the model containing biochar presence only as a term (AIC 35.74), showing that the presence of biochar was more important in explaining the changes in pH. There was a significant difference between biochar type when this was examined separately, with the WGL biochar type being significantly different from both the WAI and NSP biochar types. Thus, biochar type was an important factor influencing soil pH (Figure S7).
Electrical conductivity was higher in soils treated with fertilizer alone, rather than the application of biochar alone (Figure 10). The model with all combination treatment terms was the most parsimonious model (Table 4), and the results showed that the fertilizer alone treatment was significantly different from the control and biochar + fertilizer treatments (Table 3 and Figure 7). Biochar type was separately analysed, showing the NSP biochar to be significantly different from the WAI and WGL biochars (Table S3). Interestingly, although biochar type produced significant differences in both soil pH and EC, different biochars were responsible for these differences.

4. Discussion

The application of biochar improved plant growth and yield overall. For plant height and leaf length, the application of biochar only and biochar + fertilizer greatly improved growth but the treatments were not markedly different from each other, showing that the additional application of fertilizer with biochar did not result in more growth than the application of biochar alone. However, this was not the case for biomass and fruit production, which are more commercially important factors. For biomass and fruit production (number and weight), the combination of biochar and fertilizer greatly increased yield in comparison to biochar application alone. However, interestingly for all plant and fruit parameters, the application of biochar alone outperformed the application of fertilizer alone. These results showed that biochar could potentially be used as an alternative to fertilizer in poor, acidic soils; however, the best condition for higher tomato yields was the application of both fertilizer and biochar.
The changes in the soil properties in this study were more variable than those in plant growth and yield parameters. Water runoff greatly decreased with the application of biochar when compared to the control or fertilizer only treatments, which was not surprising considering biochar’s ability to increase the soil’s water-holding capacity [11,52]. Interestingly, water runoff was the lowest under the biochar + fertilizer regime, which may have been due to higher water requirements needed for those plants grown in this treatment as they produced higher yields, rather than due to differences in soil properties between the biochar only and biochar + fertilizer treatments. The changes in soil properties were less clear-cut than those in water runoff. Biochar application did increase soil pH to make it more alkaline, but there was no clear pattern across the different treatment types. What appeared to be more important was the presence of biochar regardless of the fertilizer combination. The electrical conductivity of the soil was also complex with no clear pattern across the different treatments; however, soil with fertilizer application alone had much higher EC values.

4.1. Implications for Plant growth and Crop Yield

Previous research has shown that the application of biochar to soil improves plant growth in tomatoes [53,54,55], including sewage sludge biochar [56,57]. Additional studies have also shown that faecal sludge biochar improves plant yields in other crops, such as lettuce [36]. Our work supports this research, clearly showing that the application of biochar increased plant height, leaf length, and biomass. Our study also showed that the application of biochar greatly improved fruit yield both in total number and weight of tomatoes. This was in contrast to other studies reporting no significant impact on tomato yields [55,58]. However, both studies used alkaline or neutral soil whereas our study used acidic, poor soils, demonstrating that the application of biochar to increase yield works best on poorer and acidic soils. This shows that highly alkaline faecal sludge biochar can be used to ameliorate acidic soil and has the potential to increase crop yields, which has important implications for food security. Biochar treatment alone also produced significantly greater yield than fertilizer treatment alone. Biochars produced from nutrient-rich feedstocks such as faecal sludge can be described as biochar-based fertilizers [59], therefore biochar alone can supply nutrients necessary for increased yield. Also of significance is the type of soil used in this study; it was an acidic, loamy sand with low nutrient concentrations and low CEC (Tables S1 and S2). The leaching of nutrients in sandy soils is a significant problem and is caused by low WHC, nutrient retention, and CEC. Biochar application has increased WHC in sandy soils [60] and produced positive effects on CEC in a sandy loam soil [61]. The high CEC and WHC of the biochars led to increased nutrient retention and reduced leaching in the sandy soils used in this study, thus explaining the differences in yield between fertilizer and biochar treatments.
It has been proposed [62] that the increased plant growth observed in biochar-amended soils is largely due to the liming effect of alkaline biochars. A meta-analysis of field studies reported that soils with initial pH values ≤ 6.5 tended to show greater yield increases with biochar addition than those with initial pH values > 6.5 [24], thus biochar is most effective in acidic, poor soils, which our study also demonstrated. Additionally, it was previously demonstrated that the combination of biochar and fertilizer produced greater yield than the use of fertilizer alone [24], which was again demonstrated in our study. The reason for this is most likely due to the liming effect caused by biochar, which increases nutrient availability and absorption. Phosphorus adsorption and bioavailability are both affected by soil pH, with the most available forms of phosphorus occurring at pH ranges between 5.5 and 7.0. [63]. It is not only phosphorus availability that is impacted by the liming effect but also calcium and potassium availability [64], which are all essential for healthy plant growth. Furthermore, our study showed that biochar application improved plant growth and yield more effectively than fertilizer alone, which is also linked to the liming effect increasing nutrient absorption.
The liming effect of biochar can also decrease soil exchangeable acidity and increase soil exchangeable base cations, thereby increasing the CEC (cation-exchange capacity) of the soil itself [65,66]. An increase in CEC within soil after biochar addition has been linked to an increase in crop yield [13]. Biochar application has produced positive effects on CEC in a sandy loam soil [61]. The CEC of biochar itself is also crucial. Biomass with a high ash content, such as faecal sludge, produces biochar with a high CEC [16], and the CECs of manure-derived biochars are generally higher than those of woody biochars [67]. The high CEC of biochar and larger surface area limit nutrient leaching in soil [68] and improve nutrient retention [69]. The soil in this study had a low CEC of 8.7 cmol·kg−1 (Table S2.). Soils with a CEC of less than 10 cmol·kg−1 have weak nutrient retention and supply capacities [37]. The CECs of the biochars were relatively high (Table 1). Therefore, the significant increases in yield and above ground biomass observed with the combined biochar and fertilizer treatment was partly due to the high CEC of the biochar. This enhanced the adsorption of the applied fertilizer to the biochar surface area, enabling nutrients within the fertilizer to be taken up more effectively by crops [70].
A meta-analysis of biochar effects on crop yield identified that ash-rich biochars were the most promising and that yield effects were greater when biochar was applied to sandy, acidic (pH < 6) soils with a low CEC and higher nitrogen content [71].
Overall, our study showed that the application of faecal sludge biochar greatly improved tomato plant growth and yield, especially in combination with fertilizer in poor soil, offering a real solution to increasing food security in areas with poorer soils. Moreover, the application of biochar alone resulted in greater yields and growth than the application of fertilizer alone, offering a potential and more sustainable alternative to commercial fertilizer.

4.2. Implications for Soil Properties

The high pH of faecal sludge biochars due to the high ash content contributes to the amelioration of acidic soil. The liming potential of these biochars may, however, be short-lived compared to other benefits such as CEC and WHC, which are longer lasting [72,73]. The processes behind increased WHC are thought to be related to an increase in micropores for physically retaining water or an increase in aggregation creating pore space for retaining water [52]. The fertilizer only treatment recorded a high EC value that was significantly different from all other treatments, and a significant difference between the control and combined biochar and fertilizer treatments was also recorded. The combined biochar and fertilizer treatment recorded a lower EC value due to the retention of soluble salts from the fertilizer by the biochar [74,75].
In this study, the water runoff from the biochar only treatment was significantly lower than that of the control and fertilizer only treatments (Figure 8), indicating that there was an increase in soil water-holding capacity from the biochar application alone. The addition of biochar to green roof soil previously resulted in an increase in water retention [76] and reduced runoff volume has been measured in sandy clay loam soil plots amended with biochar [77]. The combined biochar and fertilizer treatment had the least water runoff compared to biochar treatment alone (Figure 8). This was most likely due to the plants in the biochar + fertilizer treatment being the largest, so would have had larger water requirements, which may explain the reduced water runoff. Overall, the application of biochar increased water retention and improved crop productivity. This has great implications for not only arid regions but also for areas that are vulnerable to climate change-induced drought [78,79].

4.3. Implications for Food Security

The significant increase in yield with combined biochar and fertilizer treatment has implications for inorganic fertilizer use by smallholder farmers in developing nations. The use of inorganic fertilizer to increase soil fertility and crop yield is much lower in developing countries than in developed countries [80,81]. The results from the study indicate the potential of biochar to produce a greater yield with similar quantities of fertilizer as used previously. They also imply that the application of biochar rather than fertilizer could produce the same or higher yields. Field experiments would need to be conducted to determine the extent to which biochar application could increase crop yield, as tomato yields in the field are likely to differ from yields attained in pot-based experiments. Producing the same crop yield with less fertilizer and recycled phosphorus within faecal sludge biochar would reduce the rate of exhaustion of increasingly scarce phosphate rock reserves and benefit global phosphorus security [82,83]. Phosphorus is an irreplaceable plant-limiting nutrient [84] and is thus a crucial component in fertilizer, with most global phosphorus resources used as fertilizers in agriculture. However, phosphorus is a finite resource and our phosphorus reserves are already massively depleted, with the remaining reserves becoming increasingly difficult to mine [85]. It is estimated that the depletion of all remaining natural phosphorus reserves will occur within the next 100–400 years [86,87,88]. Faecal sludge biochar can improve phosphorus security not only by reducing the fertilizer requirement but also by providing a renewable form of phosphorus. Almost 100% of phosphorus consumed in food is excreted [89], and total phosphorus concentrations of faecal sludge biochar have been reported at 3.2–3.9% [35] and 5.4–8.1 wt.% [90]. Pyrolysis of faecal sludge is one method to recapture phosphorus from the food system as part of a circular economy, thereby increasing countries’ phosphorus security and reducing their dependance on increasingly inaccessible phosphate fertilizer markets.
Soil acidity is one of the major issues for improving soil health, increasing crop productivity, and achieving global food security. A small fraction of acidic soil is utilised for arable crops globally, despite accounting for 50% of the earth’s potential arable lands [26]. Managing soil acidity is critical to increasing soil fertility, crop yields, and food security. The majority of acidic soils are found in the tropics and subtropics [16] in developing nations, which are more at risk of climate change and food insecurity [17,18]. The quality of these acidic soils and crop productivity can be improved by the liming effect of alkaline biochar [62]. The degradation of soils also threatens crop productivity and food security, with 33% of the world’s soil classified as moderately to highly degraded [91]. Many developing nations suffer from soil degradation, including India, which alone supports 18% of the world’s human population and ranks second worldwide in farm output [92]. Biochar has been shown to improve degraded and low-fertility soils and improve crop yield [13,93,94]. Arid and semi-arid regions cover most parts of developing countries such as Africa and areas of India. Soils in these regions are becoming increasingly important for food security. The soils of arid regions are sandy with low organic matter content and very low nutrient levels. It is predicted that climate change will cause these dry regions to become dryer and more water-stressed [95]. Water stress caused by increasing droughts is a primary factor limiting plant growth and crop yield in arid regions [96]. The ability of biochar to retain both water and nutrients have led to improved soil health in sandy soils [97] and increased fruit yield of drought-stressed tomato plants grown in sandy loam soil [53]. The use of biochar as a soil amendment has the potential to play an important role in achieving global food security, particularly in developing nations.
The reduced water runoff observed with biochar addition also has implications for future water security. Water scarcity already affects every continent, with 1.8 billion people globally already impacted by drought and land degradation/desertification [28]. In the future, competition for water resources will intensify, which will have a significant impact on agriculture as it is the most water-demanding economic sector [28]. The predicted increase in water scarcity is linked to climate change-induced droughts, which are predicted to increase in frequency and severity due to decreased precipitation and increased evaporation [98]. Water scarcity is also related to a rise in water pollution, with the greatest increase in exposure to pollutants predicted to occur in developing countries due to greater economic and population growth and the lack of wastewater management systems [28]. The addition of biochar has been shown to increase tomato seedling resistance to drought [34] and increase plant growth and nutrient uptake in cabbage seedlings under water deficit conditions [99].

5. Conclusions

The results show for the first time that commercial, large-scale faecal sludge biochar addition to an acidic soil can increase the yield, fruit number, plant height, and plant biomass of Micro-Tom tomatoes. The application of biochar alone outperformed the application of fertilizer alone. Thus, faecal sludge biochar has the potential to become an alternative to fertilizer in poor, acidic soils. Biochar treatment produced a tomato yield approximately 1060% greater than that of control soil conditions. The combination of biochar and fertilizer significantly increased above ground biomass and fruit yield compared to biochar application alone. The combined application of biochar and fertilizer produced a tomato yield 2980% greater than that of control soil conditions.
The results of this study highlight the importance of both the soil and the biochars physical and chemical properties and shows that full-scale faecal sludge pyrolysis in developing nations is a credible technology for treating human waste. The benefits are numerous, including the removal of disease-causing pathogens from sludge and the concurrent creation of biochar, which has been shown to enhance crop productivity. There is clear potential for faecal sludge biochar to improve acidic, sandy soils and crop yield in developing nations more at risk of water scarcity and food insecurity. It is possible that the liming effect from faecal sludge biochar could be short-lived; therefore, longer-term field studies are needed to assess the duration of the reported positive liming effects of faecal sludge biochar addition on acidic soil and the reported increase in yield.

Supplementary Materials

The following supporting information can be downloaded at: https://www.mdpi.com/article/10.3390/agronomy13051233/s1. Table S1. Soil texture analysis carried out by Lancrop Laboratories, Pocklington. Table S2. Soil chemical analysis carried out by Maria Santiso Taboada (University of Santiago de Compostela). Table S3. The effects of biochar type on different plant growth, yield, and soil responses. Figure S1. Humidity (%) recorded by data logger for duration of outdoor greenhouse experiment. Figure S2. Temperature (°C) recorded by data logger for duration of outdoor greenhouse experiment. Figure S3. Left—plant height (cm) and right—leaf length (cm) measured at harvest for each biochar type, NSP (Narsapur biochar), WAI (Wai biochar), and WGL (Warangal biochar), in both biochar-containing treatments. Box plots show minimum, first quartile, median (the solid line in the box), third quartile, and maximum. Figure S4. Left—above ground and right—below ground biomass measured at harvest for each biochar type, NSP (Narsapur biochar), WAI (Wai biochar), and WGL (Warangal biochar), in both biochar-containing treatments. Box plots show minimum, first quartile, median (the solid line in the box), third quartile, and maximum. Open circle symbols indicate outliers. Figure S5. Left—fruit number and right—fruit yield measured at harvest for each biochar type, NSP (Narsapur biochar), WAI (Wai biochar), and WGL (Warangal biochar), in both biochar-containing treatments. Box plots show minimum, first quartile, median (the solid line in the box), third quartile, and maximum. Figure S6. Total water runoff (mL) for each biochar type, NSP (Narsapur biochar), WAI (Wai biochar), and WGL (Warangal biochar), in both biochar-containing treatments. Box plots show minimum, first quartile, median (the solid horizontal line in the box), third quartile, and maximum. Figure S7. Left—soil pH and right—soil electrical conductivity values for each biochar type, NSP (Narsapur biochar), WAI (Wai biochar), and WGL (Warangal biochar), in both biochar-containing treatments. Box plots show minimum, first quartile, median (the solid horizontal line in the box), third quartile, and maximum. Open circle symbols indicate outliers.

Author Contributions

H.L.N.: Conceptualization, Methodology, Investigation, Formal analysis, Writing—original draft. A.D.: Conceptualization, Methodology, Formal analysis, Supervision, Writing—review and editing. I.M.: Conceptualization, Supervision, Funding Acquisition, Writing—review and editing. I.R.: Writing—review & editing. All authors have read and agreed to the published version of the manuscript.

Funding

This work was supported, in whole or in part, by the Bill & Melinda Gates Foundation [OPP1149054], and under the grant conditions of the Foundation, a Creative Commons Attribution 4.0 Generic License has already been assigned to the author accepted manuscript version that might arise from this submission. The work was also supported by Swansea University’s ‘SUNRISE’ project funded through GCRF via EPSRC [EP/P032591/1].

Data Availability Statement

The datasets generated and analyzed for this study are available upon request.

Acknowledgments

The authors thank the staff of Tide Technocrats Ltd. for the supply of biochar, Maria Santiso Taboada (University of Santiago de Compostela), and Ann Lewis of Cathelyd Isaf Farm for supplying the soil used in this study.

Conflicts of Interest

The authors declare no conflict of interest. The funders had no role in the design of the study; in the collection, analyses, or interpretation of data; in the writing of the manuscript; or in the decision to publish the results.

References

  1. WHO; UNICEF. Progress on Household Drinking Water, Sanitation and Hygiene 2000–2017: Special Focus on Inequalities; United Nations Children’s Fund (UNICEF); World Health Organization: New York, NY, USA, 2019.
  2. UNICEF; WHO. Progress on Drinking Water, Sanitation and Hygiene-Joint Monitoring Programme 2017 Update and SDG Baselines; World Health Organization: Geneva, Switzerland, 2017; Volume 66. [CrossRef]
  3. Lehmann, J.; Joseph, S. Biochar for Environmental Management: Science, Technology and Implementation, 2nd ed.; Routledge: Milton Park Abingdon, UK, 2015. [Google Scholar]
  4. European Biochar Certificate (EBC). Guidelines for a Sustainable Production of Biochar. Eur. Biochar Found. 2016, 1–22, Version 6.2E of 4th February 2016. [Google Scholar] [CrossRef]
  5. Chen, B.; Zhou, D.; Zhu, L. Transitional adsorption and partition of nonpolar and polar aromatic contaminants by biochars of pine needles with different pyrolytic temperatures. Environ. Sci. Technol. 2008, 42, 5137–5143. [Google Scholar] [CrossRef] [PubMed]
  6. Tomczyk, A.; Sokołowska, Z.; Boguta, P. Biochar physicochemical properties: Pyrolysis temperature and feedstock kind effects. Rev. Environ. Sci. Bio/Technol. 2020, 19, 191–215. [Google Scholar] [CrossRef]
  7. Weber, K.; Quicker, P. Properties of biochar. Fuel 2018, 217, 240–261. [Google Scholar] [CrossRef]
  8. Agrafioti, E.; Bouras, G.; Kalderis, D.; Diamadopoulos, E. Biochar production by sewage sludge pyrolysis. J. Anal. Appl. Pyrolysis 2013, 101, 72–78. [Google Scholar] [CrossRef]
  9. Wang, S.; Zhang, H.; Huang, H.; Xiao, R.; Li, R.; Zhang, Z. Influence of temperature and residence time on characteristics of biochars derived from agricultural residues: A comprehensive evaluation. Process. Saf. Environ. Prot. 2020, 139, 218–229. [Google Scholar] [CrossRef]
  10. Glaser, B.; Haumaier, L.; Guggenberger, G.; Zech, W. The ‘Terra Preta’ phenomenon: A model for sustainable agriculture in the humid tropics. Sci. Nat. 2001, 88, 37–41. [Google Scholar] [CrossRef]
  11. Gaskin, J.W.; Speir, A.; Morris, L.M.; Ogden, L.; Harris, K.; Lee, D.; Das, K.C. Potential for Pyrolysis Char To Affect Soil Moisture and Nutrient Status of a Loamy sand Soil; Georgia Institute of Technology: Atlanta, GA, USA, 2007. [Google Scholar]
  12. Novak, J.M.; Busscher, W.J.; Laird, D.L.; Ahmedna, M.; Watts, D.W.; Niandou, M.A.S. Impact of Biochar Amendment on Fertility of a Southeastern Coastal Plain Soil. Soil Sci. 2009, 174, 105–112. [Google Scholar] [CrossRef]
  13. Glaser, B.; Lehmann, J.; Zech, W. Ameliorating physical and chemical properties of highly weathered soils in the tropics with charcoal—A review. Biol. Fertil. Soils 2002, 35, 219–230. [Google Scholar] [CrossRef]
  14. Lehmann, J.; Rillig, M.C.; Thies, J.; Masiello, C.A.; Hockaday, W.C.; Crowley, D. Biochar effects on soil biota—A review. Soil Biol. Biochem. 2011, 43, 1812–1836. [Google Scholar] [CrossRef]
  15. Windeatt, J.H.; Ross, A.B.; Williams, P.T.; Forster, P.M.; Nahil, M.A.; Singh, S. Characteristics of biochars from crop residues: Potential for carbon sequestration and soil amendment. J. Environ. Manag. 2014, 146, 189–197. [Google Scholar] [CrossRef]
  16. Yang, F.; Lee, X.-Q.; Wang, B. Characterization of biochars produced from seven biomasses grown in three different climate zones. Chin. J. Geochem. 2015, 34, 592–600. [Google Scholar] [CrossRef]
  17. Mekuria, W.; Noble, A. The Role of Biochar in Ameliorating Disturbed Soils and Sequestering Soil Carbon in Tropical Agricultural Production Systems International Water Management Institute (IWMI), 127 Sunil Mawatha, Pelawatte. Appl. Environ. Soil Sci. 2013, 2013, 354965. [Google Scholar] [CrossRef]
  18. Salinger, M.J.; Sivakumar, M.V.K.; Motha, R. Reducing Vulnerability of Agriculture and Forestry to Climate Variability and Change: Workshop Summary and Recommendations. In Increasing Climate Variability and Change; Salinger, J., Sivakumar, M., Motha, R.P., Eds.; Springer: Dordrecht, The Netherlands, 2005. [Google Scholar] [CrossRef]
  19. Gwenzi, W.; Chaukura, N.; Mukome, F.N.; Machado, S.; Nyamasoka, B. Biochar production and applications in sub-Saharan Africa: Opportunities, constraints, risks and uncertainties. J. Environ. Manag. 2015, 150, 250–261. [Google Scholar] [CrossRef] [PubMed]
  20. Nyamapfene, K.W. The Soils of Zimbabwe; Nehanda Publishers: Harare, Zimbabwe, 1991; Volume 1. [Google Scholar]
  21. World Bank. Ending Poverty and Hunger by 2030 an Agenda for the Global Food System, 2nd ed.; World Bank Group: Washington, DC, USA, 2015; pp. 3–6. [Google Scholar]
  22. Ricker-Gilbert, J. Inorganic Fertiliser Use among Smallholder Farmers in Sub-Saharan Africa: Implications for Input Subsidy Policies; The Role of Smallholder Farms in Food and Nutrition Security; Springer: Berlin, Germany, 2020; pp. 81–98. [Google Scholar]
  23. Sheahan, M.; Barrett, C.B. Ten striking facts about agricultural input use in Sub-Saharan Africa. Food Policy 2016, 67, 12–25. [Google Scholar] [CrossRef] [PubMed]
  24. Ye, L.; Camps-Arbestain, M.; Shen, Q.; Lehmann, J.; Singh, B.; Sabir, M. Biochar effects on crop yields with and without fertilizer: A meta-analysis of field studies using separate controls. Soil Use Manag. 2019, 36, 2–18. [Google Scholar] [CrossRef]
  25. MacCarthy, D.S.; Darko, E.; Nartey, E.K.; Adiku, S.G.K.; Tettey, A. Integrating Biochar and Inorganic Fertilizer Improves Productivity and Profitability of Irrigated Rice in Ghana, West Africa. Agronomy 2020, 10, 904. [Google Scholar] [CrossRef]
  26. Von Uexküll, H.R.; Mutert, E. Global extent, development and economic impact of acid soils. In Plant–Soil Interactions at Low pH: Principles and Management; Kluwer Academic Publishers: Dordrecht, The Netherlands, 1995; pp. 5–19. [Google Scholar]
  27. FAO. Climate Change, Water and Food Security Technical Background Document From the Expert Consultation Held on Security; FAO: Quebec City, QC, Canada, 2008; Volume 18. [Google Scholar]
  28. WWAP. The United Nations World Water Development Report 2018: Nature-Based Solutions for Water; 2018. [Google Scholar]
  29. Novak, J.M.; Busscher, W.J.; Watts, D.W.; Amonette, J.E.; Ippolito, J.A.; Lima, I.M.; Gaskin, J.; Das, K.C.; Steiner, C.; Ahmedna, M.; et al. Biochars Impact on Soil-Moisture Storage in an Ultisol and Two Aridisols. Soil Sci. 2012, 177, 310–320. [Google Scholar] [CrossRef]
  30. Herath, H.; Camps-Arbestain, M.; Hedley, M. Effect of biochar on soil physical properties in two contrasting soils: An Alfisol and an Andisol. Geoderma 2013, 209–210, 188–197. [Google Scholar] [CrossRef]
  31. Blanco-Canqui, H. Biochar and Soil Physical Properties. Soil Sci. Soc. Am. J. 2017, 81, 687–711. [Google Scholar] [CrossRef]
  32. Omondi, M.O.; Xia, X.; Nahayo, A.; Liu, X.; Korai, P.K.; Pan, G. Quantification of biochar effects on soil hydrological properties using meta-analysis of literature data. Geoderma 2016, 274, 28–34. [Google Scholar] [CrossRef]
  33. Uzoma, K.C.; Inoue, M.; Andry, H.; Fujimaki, H.; Zahoor, A.; Nishihara, E. Effect of cow manure biochar on maize productivity under sandy soil condition. Soil Use Manag. 2011, 27, 205–212. [Google Scholar] [CrossRef]
  34. Mulcahy, D.N.; Mulcahy, D.L.; Dietz, D. Biochar soil amendment increases tomato seedling resistance to drought in sandy soils. J. Arid. Environ. 2013, 88, 222–225. [Google Scholar] [CrossRef]
  35. Gold, M.; Cunningham, M.; Bleuler, M.; Arnheiter, R.; Schönborn, A.; Niwagaba, C.; Strande, L. Operating parameters for three resource recovery options from slow-pyrolysis of faecal sludge. J. Water, Sanit. Hyg. Dev. 2018, 8, 707–717. [Google Scholar] [CrossRef]
  36. Woldetsadik, D.; Drechsel, P.; Marschner, B.; Itanna, F.; Gebrekidan, H. Effect of biochar derived from faecal matter on yield and nutrient content of lettuce (Lactuca sativa) in two contrasting soils. Environ. Syst. Res. 2017, 6, 1–12. [Google Scholar] [CrossRef]
  37. Bai, X.; Li, Z.; Zhang, Y.; Ni, J.; Wang, X.; Zhou, X. Recovery of Ammonium in Urine by Biochar Derived from Faecal Sludge and its Application as Soil Conditioner. Waste Biomass-Valorization 2017, 9, 1619–1628. [Google Scholar] [CrossRef]
  38. Andriessen, N.; Ward, B.J.; Strande, L. To char or not to char? Review of technologies to produce solid fuels for resource recovery from faecal sludge. J. Water Sanit. Hyg. Dev. 2019, 9, 210–224. [Google Scholar] [CrossRef]
  39. Alvarenga, P.; Mourinha, C.; Farto, M.; Palma, P.; Sengo, J.; Morais, M.-C.; Cunha-Queda, C. Ecotoxicological assessment of the potential impact on soil porewater, surface and groundwater from the use of organic wastes as soil amendments. Ecotoxicol. Environ. Saf. 2016, 126, 102–110. [Google Scholar] [CrossRef]
  40. Barani, V.; Hegarty-Craver, M.; Rosario, P.; Madhavan, P.; Perumal, P.; Sasidaran, S.; Basil, M.; Raj, A.; Berg, A.B.; Stowell, A.; et al. Characterization of fecal sludge as biomass feedstock in the southern Indian state of Tamil Nadu. Gates Open Res. 2018, 2, 52. [Google Scholar] [CrossRef]
  41. Krueger, B.C.; Fowler, G.D.; Templeton, M.R.; Moya, B. Resource recovery and biochar characteristics from full-scale faecal sludge treatment and co-treatment with agricultural waste. Water Res. 2019, 169, 115253. [Google Scholar] [CrossRef]
  42. Niwagaba, C.B.; Mbéguéré, M.; Strande, L. Faecal sludge quantification, characterisation and treatment objectives. In Faecal Sludge Management: Systems Approach for Implementation and Operation; Strande, L., Ronteltap, M., Eds.; IWA Publishing: London, UK, 2014; pp. 19–44. [Google Scholar]
  43. Cunningham, M.; Gold, M.; Strande, L. Literature Review: Slow Pyrolysis of Faecal Sludge. 2016, p. 85. Available online: https://www.dora.lib4ri.ch/eawag/islandora/object/eawag%3A14834/datastream/PDF/view (accessed on 9 October 2021).
  44. Sainju, U.M.; Dris, R.; Singh, B. Mineral nutrition of tomato. Food Agric. Environ. 2003, 1, 176–184. [Google Scholar]
  45. Gil, R.; Bojacá, C.R.; Schrevens, E. Understanding the heterogeneity of smallholder production systems in the Andean tropics—The case of Colombian tomato growers. NJAS Wagening. J. Life Sci. 2019, 88, 1–9. [Google Scholar] [CrossRef]
  46. Mango, N.; Mapemba, L.; Tchale, H.; Makate, C.; Dunjana, N.; Lundy, M. Comparative analysis of tomato value chain competitiveness in selected areas of Malawi and Mozambique. Cogent Econ. Finance 2015, 3, 1088429. [Google Scholar] [CrossRef]
  47. Njenga, P.; Willilo, S.; Hine, J. First Mile Transport Challenges for Smallholder Tomato Farmers along Ihimbo-Itimbo Road, Kilolo District Tanzania Final Report Safe and sustainable transport for rural communities. Int. Forum Rural Transp. Dev. 2015, 35. Available online: https://assets.publishing.service.gov.uk/media/57a0899ae5274a31e000018a/61280-Njenga-Willilo-Hine-IFRTD-2015-FirstMileTransportTomatoesTanzania-Final-AFCAP-Tan2015c-v160114.pdf (accessed on 11 November 2022).
  48. Meissner, R.; Jacobson, Y.; Melamed, S.; Levyatuv, S.; Shalev, G.; Ashri, A.; Elkind, Y.; Levy, A. A new model system for tomato genetics. Plant J. 1997, 12, 1465–1472. [Google Scholar] [CrossRef]
  49. Campos, M.L.; Carvalho, R.F.; Benedito, V.A.; Peres, L.E.P. Small and remarkable. Plant Signal. Behav. 2010, 5, 267–270. [Google Scholar] [CrossRef]
  50. Nicholas, H.L.; Mabbett, I.; Apsey, H.; Robertson, I. Physico-chemical properties of waste derived biochar from community scale faecal sludge treatment plants. Gates Open Res. 2022, 6, 96. [Google Scholar] [CrossRef]
  51. Lenth, R.; Singmann, H.; Love, J.; Buerkner, P.; Herve, M. emmeans: Estimated marginal means, aka least-squares mean. R Package Version 1(7): 3. 2022. Available online: https://cran.r-project.org/web/packages/emmeans/index.html (accessed on 30 June 2022).
  52. Novak, J.M.; Lima, I.; Xing, B.; Gaskin, J.W.; Steiner, C.; Das, K.C.; Ahmedna, M.; Rehrah, D.; Watts, D.W.; Busscher, W.J.; et al. Characterization of designer biochar produced at different temperatures and their effects on a loamy sand. Ann. Environ. Sci. 2009, 3, 195–206. [Google Scholar]
  53. Akhtar, S.S.; Li, G.; Andersen, M.N.; Liu, F. Biochar enhances yield and quality of tomato under reduced irrigation. Agric. Water Manag. 2014, 138, 37–44. [Google Scholar] [CrossRef]
  54. Tartaglia, M.; Arena, S.; Scaloni, A.; Marra, M.; Rocco, M. Biochar Administration to San Marzano Tomato Plants Cultivated Under Low-Input Farming Increases Growth, Fruit Yield, and Affects Gene Expression. Front. Plant Sci. 2020, 11, 1281. [Google Scholar] [CrossRef]
  55. Vaccari, F.; Maienza, A.; Miglietta, F.; Baronti, S.; Di Lonardo, S.; Giagnoni, L.; Lagomarsino, A.; Pozzi, A.; Pusceddu, E.; Ranieri, R.; et al. Biochar stimulates plant growth but not fruit yield of processing tomato in a fertile soil. Agric. Ecosyst. Environ. 2015, 207, 163–170. [Google Scholar] [CrossRef]
  56. Hossain, M.K.; Strezov, V.; Nelson, P. Comparative Assessment of the Effect of Wastewater Sludge Biochar on Growth, Yield and Metal Bioaccumulation of Cherry Tomato. Pedosphere 2015, 25, 680–685. [Google Scholar] [CrossRef]
  57. Velli, P.; Manolikaki, I.; Diamadopoulos, E. Effect of biochar produced from sewage sludge on tomato (Solanum lycopersicum L.) growth, soil chemical properties and heavy metal concentrations. J. Environ. Manag. 2021, 297, 113325. [Google Scholar] [CrossRef] [PubMed]
  58. Polzella, A.; De Zio, E.; Arena, S.; Scippa, G.S.; Scaloni, A.; Montagnoli, A.; Chiatante, D.; Trupiano, D. Toward an understanding of mechanisms regulating plant response to biochar application. Plant Biosyst. Int. J. Deal. All Asp. Plant Biol. 2018, 153, 163–172. [Google Scholar] [CrossRef]
  59. Ndoung, O.C.N.; de Figueiredo, C.C.; Ramos, M.L.G. A scoping review on biochar-based fertilizers: Enrichment techniques and agro-environmental application. Heliyon 2021, 7, e08473. [Google Scholar] [CrossRef]
  60. Razzaghi, F.; Obour, P.B.; Arthur, E. Does biochar improve soil water retention? A systematic review and meta-analysis. Geoderma 2019, 361, 114055. [Google Scholar] [CrossRef]
  61. Revell, K.T.; Maguire, R.O.; Agblevor, F.A. Influence of Poultry Litter Biochar on Soil Properties and Plant Growth. Soil Sci. 2012, 177, 402–408. [Google Scholar] [CrossRef]
  62. Jeffery, S.; Verheijen, F.G.A.; van der Velde, M.; Bastos, A.C. A quantitative review of the effects of biochar application to soils on crop productivity using meta-analysis. Agric. Ecosyst. Environ. 2011, 144, 175–187. [Google Scholar] [CrossRef]
  63. Nigussie, A.; Kissi, E.; Misganaw, M.; Ambaw, G. Effect of Biochar Application on Soil Properties and Nutrient Uptake of Lettuces (Lactuca sativa) Grown in Chromium Polluted Soils. Environ. Sci. 2012, 12, 369376. [Google Scholar]
  64. Atkinson, C.J.; Fitzgerald, J.D.; Hipps, N.A. Potential mechanisms for achieving agricultural benefits from biochar application to temperate soils: A review. Plant Soil 2010, 337, 1–18. [Google Scholar] [CrossRef]
  65. Chintala, R.; Mollinedo, J.; Schumacher, T.E.; Malo, D.D.; Julson, J.L. Effect of biochar on chemical properties of acidic soil. Arch. Agron. Soil Sci. 2013, 60, 393–404. [Google Scholar] [CrossRef]
  66. Yuan, J.-H.; Xu, R.-K.; Qian, W.; Wang, R.-H. Comparison of the ameliorating effects on an acidic ultisol between four crop straws and their biochars. J. Soils Sediments 2011, 11, 741–750. [Google Scholar] [CrossRef]
  67. Tag, A.T.; Duman, G.; Ucar, S.; Yanik, J. Effects of feedstock type and pyrolysis temperature on potential applications of biochar. J. Anal. Appl. Pyrolysis 2016, 120, 200–206. [Google Scholar] [CrossRef]
  68. Lehmann, J.; Joseph, S. Biochar for Environmental Management: Science, Technology and Implementation; Routledge: Milton Park Abingdon, UK, 2012. [Google Scholar]
  69. Song, W.; Guo, M. Quality variations of poultry litter biochar generated at different pyrolysis temperatures. J. Anal. Appl. Pyrolysis 2012, 94, 138–145. [Google Scholar] [CrossRef]
  70. Xu, G.; Wei, L.L.; Sun, J.N.; Shao, H.B.; Chang, S.X. What is more important for enhancing nutrient bioavailability with biochar application into a sandy soil: Direct or indirect mechanism? Ecol. Eng. 2013, 52, 119–124. [Google Scholar] [CrossRef]
  71. Dai, Z.; Zhang, X.; Tang, C.; Muhammad, N.; Wu, J.; Brookes, P.C.; Xu, J. Potential role of biochars in decreasing soil acidification—A critical review. Sci. Total. Environ. 2017, 581–582, 601–611. [Google Scholar] [CrossRef] [PubMed]
  72. Kätterer, T.; Roobroeck, D.; Andrén, O.; Kimutai, G.; Karltun, E.; Kirchmann, H.; Nyberg, G.; Vanlauwe, B.; de Nowina, K.R. Biochar addition persistently increased soil fertility and yields in maize-soybean rotations over 10 years in sub-humid regions of Kenya. Field Crop. Res. 2019, 235, 18–26. [Google Scholar] [CrossRef]
  73. Woolf, D.; Lehmann, J.; Cowie, A.; Cayuela, M.L.; Whitman, T.; Sohi, S. 8 Biochar for Climate Change Mitigation: Navigating from Science to Evidence-Based Policy. Soil Clim. 2018, 219–248. Available online: https://rdg.ent.sirsidynix.net.uk/client/en_GB/library/search/detailnonmodal/ent:$002f$002fSD_ILS$002f0$002fSD_ILS:1879511/ada?qu=soil+and+climate&lm=EXCL_LR2 (accessed on 21 April 2022).
  74. Lehmann, J.; Silva, J.P., Jr.; Steiner, C.; Nehls, T.; Zech, W.; Glaser, B. Nutrient availability and leaching an an archaeological Anthrosol and a Ferralsol. Plant Soil 2003, 249, 343–357. [Google Scholar] [CrossRef]
  75. Liang, B.; Lehmann, J.; Solomon, D.; Kinyangi, J.; Grossman, J.; O’Neill, B.; Skjemstad, J.O.; Thies, J.; Luizão, F.J.; Petersen, J.; et al. Black Carbon Increases Cation Exchange Capacity in Soils. Soil Sci. Soc. Am. J. 2006, 70, 1719–1730. [Google Scholar] [CrossRef]
  76. Beck, D.A.; Johnson, G.R.; Spolek, G.A. Amending greenroof soil with biochar to affect runoff water quantity and quality. Environ. Pollut. 2011, 159, 2111–2118. [Google Scholar] [CrossRef] [PubMed]
  77. Sadeghi, S.H.; Hazbavi, Z.; Harchegani, M.K. Controllability of runoff and soil lossfrom small plots treated by vinasse-produced biochar. Sci Total Environ. 2016, 541, 483–490. [Google Scholar] [CrossRef]
  78. Field, C.B.; Barros, V.; Stocker, T.F.; Dahe, Q. Managing the Risks of Extreme Events and Disasters to Advance Climate Change Adaptation: Special Report of the Intergovernmental Panel on Climate Change; Cambridge University Press: Cambridge, UK, 2012. [Google Scholar]
  79. Mansoor, S.; Kour, N.; Manhas, S.; Zahid, S.; Wani, O.A.; Sharma, V.; Wijaya, L.; Alyemeni, M.N.; Alsahli, A.A.; El-Serehy, H.A.; et al. Biochar as a tool for effective management of drought and heavy metal toxicity. Chemosphere 2020, 271, 129458. [Google Scholar] [CrossRef] [PubMed]
  80. Zech, W.; Haumaier, L.; Hempfling, R.; MacCarthy, P.; Clapp, C.E.; Malcolm, R.L.; Bloom, P.R. Ecological Aspects of Soil Organic Matter in Tropical Land Use. Humic Subst. Soil Crop Sci. Sel. Read. 2015, 187–202. [Google Scholar] [CrossRef]
  81. Sanchez, P.A.; Denning, G.L.; Nziguheba, G. The African Green Revolution moves forward. Food Secur. 2009, 1, 37–44. [Google Scholar] [CrossRef]
  82. Dawson, C.; Hilton, J. Fertiliser availability in a resource-limited world: Production and recycling of nitrogen and phosphorus. Food Policy 2011, 36, S14–S22. [Google Scholar] [CrossRef]
  83. Cordell, D.; Rosemarin, A.; Schröder, J.; Smit, A. Towards global phosphorus security: A systems framework for phosphorus recovery and reuse options. Chemosphere 2011, 84, 747–758. [Google Scholar] [CrossRef]
  84. Steen, I. Phosphorus availability in the 21st century: Management of a non-renewable resource. Phosphorus Potassium 1998, 217, 25–31. [Google Scholar]
  85. Cordell, D.; Drangert, J.-O.; White, S. The story of phosphorus: Global food security and food for thought. Glob. Environ. Chang. 2009, 19, 292–305. [Google Scholar] [CrossRef]
  86. Cisse, L.; Mrabet, T.; Abdelkader, R.; Mazini, A. World Phosphate Production: Overview and Prospects. Phosphorus Res. Bull. 2004, 15, 21–25. [Google Scholar] [CrossRef]
  87. Günther, F. Hampered effluent accumulation process: Phosphorus management and societal structure. Ecol. Econ. 1997, 21, 159–174. [Google Scholar] [CrossRef]
  88. Van Vuuren, D.; Bouwman, A.; Beusen, A. Phosphorus demand for the 1970–2100 period: A scenario analysis of resource depletion. Glob. Environ. Chang. 2010, 20, 428–439. [Google Scholar] [CrossRef]
  89. Jonsson, H.; Stintzing, A.R.; Vinneras, B.; Salomon, E. EcoSanRes Publications Series-Guidelines on the use of urine and faeces in Crop Production. J. Indian Water Work. Assoc. 2004, 37, 293–295. [Google Scholar]
  90. Liu, X.; Li, Z.; Zhang, Y.; Feng, R.; Mahmood, I.B. Characterization of human manure-derived biochar and energy-balance analysis of slow pyrolysis process. Waste Manag. 2014, 34, 1619–1626. [Google Scholar] [CrossRef] [PubMed]
  91. FAO; IFAD; UNICEF; WFP; WHO. The State of Food Security and Nutrition in the World 2021; FAO: Rome, Italy, 2021.
  92. Bhattacharyya, R.; Ghosh, B.N.; Mishra, P.K.; Mandal, B.; Rao, C.S.; Sarkar, D.; Das, K.; Anil, K.S.; Lalitha, M.; Hati, K.M.; et al. Soil Degradation in India: Challenges and Potential Solutions. Sustainability 2015, 7, 3528–3570. [Google Scholar] [CrossRef]
  93. Biederman, L.A.; Harpole, W.S. Biochar and its effects on plant productivity and nutrient cycling: A meta-analysis. GCB Bioenergy 2013, 5, 202–214. [Google Scholar] [CrossRef]
  94. Randolph, P.; Bansode, R.; Hassan, O.; Rehrah, D.; Ravella, R.; Reddy, M.; Watts, D.; Novak, J.; Ahmedna, M. Effect of biochars produced from solid organic municipal waste on soil quality parameters. J. Environ. Manag. 2017, 192, 271–280. [Google Scholar] [CrossRef]
  95. Solomon, S.; Qin, D.; Manning, M.; Chen, Z.; Marquis, M.; Averyt, K.B.; Tignor, M.; Miller, H.L. Summary for policymakers. Clim. Chang. 2007, 85, 1–18. [Google Scholar]
  96. Elbeltagy, A.S.; Madkour, M. Impact of climate change on arid lands agriculture. Agric. Food Secur. 2012, 1, 3. [Google Scholar] [CrossRef]
  97. Ippolito, J.A.; Novak, J.M.; Busscher, W.J.; Ahmedna, M.; Rehrah, D.; Watts, D.W. Switchgrass Biochar Affects Two Aridisols. J. Environ. Qual. 2012, 41, 1123–1130. [Google Scholar] [CrossRef]
  98. IPCC. Global warming of 1.5 °C. An IPCC Special Report on the Impacts of Global Warming of 1.5 °C above Pre-Industrial Levels and Related Global Greenhouse Gas Emission Pathways, in the Context of Strengthening the Global Response to the Threat of Climate Change; World Meteorological Organization: Geneva, Switzerland, 2018.
  99. Yildirim, E.; Ekinci, M.; Turan, M. Impact of Biochar in Mitigating the Negative Effect of Drought Stress on Cabbage Seedlings. J. Soil Sci. Plant Nutr. 2021, 21, 2297–2309. [Google Scholar] [CrossRef]
Figure 1. Graphical representation of treatments and subgroups in the study.
Agronomy 13 01233 g001
Figure 2. Plant growth responses using different soil treatments: Control (control), Fert (fertilizer), BC (biochar), BC + Fert (biochar and fertilizer): (a) Mean leaf length per plant recorded at the end of the experiment; (b) mean plant height per plant recorded at the end of the experiment. Error bars denote standard deviations from the means of each treatment.
Agronomy 13 01233 g002
Figure 3. Plant height measured during the experiment for each treatment: Control (control), Fert (fertilizer), BC (biochar), BC + Fert (biochar and fertilizer).
Agronomy 13 01233 g003
Figure 4. Above ground biomass (g) measured at harvest for each treatment: Control (Control), Fert (fertilizer), BC (biochar), BC + Fert (biochar and fertilizer). Box plots show minimum, first quartile, median (the solid line in the box), third quartile, and maximum. Open circle symbols indicate outliers.
Agronomy 13 01233 g004
Figure 5. Below ground biomass (g) measured at harvest for each treatment: Control (control), Fert (fertilizer), BC (biochar), BC + Fert (biochar and fertilizer). Box plots show minimum, first quartile, median (the solid line in the box), third quartile, and maximum. Open circle symbols indicate outliers.
Agronomy 13 01233 g005
Figure 6. Number of tomatoes measured at harvest for each treatment: Control (control), Fert (fertilizer), BC (biochar), BC + Fert (biochar and fertilizer). Box plots show minimum, first quartile, median (the solid line in the box), third quartile, and maximum. Open circle symbols indicate outliers.
Agronomy 13 01233 g006
Figure 7. Tomato yield (g) measured at harvest for each treatment: Control (control), Fert (fertilizer), BC (biochar), BC + Fert (biochar and fertilizer). Box plots show minimum, first quartile, median (the solid line in the box), third quartile, and maximum. Open circle symbols indicate outliers.
Agronomy 13 01233 g007
Figure 8. Total water runoff for each treatment: Control (control), Fert (fertilizer), BC (biochar), BC + Fert (biochar and fertilizer). Box plots show minimum, first quartile, median (the solid line in the box), third quartile, and maximum. Open circle symbols indicate outliers.
Agronomy 13 01233 g008
Figure 9. Soil pH values measured at harvest for each treatment: Control (control), Fert (fertilizer), BC (biochar), BC + Fert (biochar and fertilizer). Box plots show minimum, first quartile, median (the solid line in the box), third quartile, and maximum.
Agronomy 13 01233 g009
Figure 10. Soil electrical conductivity (µS/cm) values measured at harvest for each treatment: Control (control), Fert (fertilizer), BC (biochar), BC + Fert (biochar and fertilizer). Box plots show minimum, first quartile, median (the solid line in the box), third quartile, and maximum. Open circle symbols indicate outliers.
Agronomy 13 01233 g010
Table 1. Proximate analyses, elemental analyses, pH, EC, and surface area measurements of biochars.
ParameterUnitWAI BCNSP BCWGL BC
pH[]11.81 ± 0.0111.82 ± 0.0112.25 ± 0.01
EC[mScm−1]2.70 ± 0.091.79 ± 0.179.00 ± 0.02
Moisture[%]3.08 ± 0.012.15 ± 0.310.98 ± 0.05
Ash[%]62.3 ± 0.3267.0 ± 2.6888.3 ± 0.21
C[%]21.1123.798.06
N[%]1.321.130.37
H[%]1.550.731.15
S[%]0.030.270.03
O *[%]13.77.12.1
H/C[]0.90.41.7
C/N[]18.724.625.4
O/C[]0.50.20.2
SBET N2[m2·g−1]3.52 ± 0.783.69 ± 0.3612.07 ± 4.12
N2 TPV[cm3·g−1]0.0110.0110.019
SBET CO2[m2·g−1]46.72 ± 7.074.20 ± 4.026.11 ± 2.6
CEC[cmol·kg−1]90.0 ± 6.541.9 ± 2.2129.3 ± 2.3
(EC = Electrical Conductivity, C = Carbon, N = Nitrogen, S = Sulfur, Oxygen, SBET = Surface Area measured by BET, TPV = Total Pore Volume, SSA = Specific Surface Area, CEC = Cation-Exchange Capacity). * Oxygen was calculated by subtracting the total percentages of carbon, hydrogen, nitrogen, sulfur, and ash content from 100.
Table 2. Mean values for all plant and soil parameters measured for each treatment (Control, Fertilizer, Biochar, and Biochar + Fertilizer).
Treatments
Plant and Soil ParametersControlFertilizerBiocharBiochar + Fertilizer
Plant height (cm)7.39.310.511.5
Tomato number1.01.75.913.3
Above ground biomass (g)0.62.42.76.0
Below ground biomass (g)0.51.42.34.1
Leaf length (cm)2.43.45.15.8
Fruit yield (g)1.03.311.928.9
pH5.55.35.85.5
Water runoff (mL)12211099859470
Electrical conductivity (µScm−1)13.854.431.636.0
Table 3. The effects of biochar and fertilizer treatments on different plant growth responses using a linear model including pairwise comparison for plant height and a gamma-distributed generalised linear model including pairwise comparison for leaf length, above and below ground biomass, number of fruits, fruit yield, water runoff, pH, and electrical conductivity.
p Values for Each Parameter Measured
Treatment Pairwise ComparisonPlant HeightLeaf LengthAbove Ground BiomassBelow Ground BiomassNumber of FruitsYieldWater RunoffpHEC
BiocharBiochar and fertilizer0.6260.7870.0020.6290.0010.0010.00030.9800.772
BiocharControl0.0005<0.00010.00010.0015<0.0001<0.0001<0.00010.51950.0174
BiocharFertilizer0.3899<0.00010.8850.1957<0.00010.00020.00260.03850.1381
Biochar and fertilizerControl<0.0001<0.0001<0.00010.0006<0.0001<0.0001<0.00010.75410.1035
Biochar and fertilizerFertilizer0.0394<0.00010.00050.0272<0.0001<0.0001<0.0001<0.00010.0354
ControlFertilizer0.0340.00010.00020.01810.2690.00560.35480.00560.0006
Table 4. Akaike’s information criterion outputs for three different sets of models for different plant growth, fruit production, and soil properties. One model had treatment as a factor with four different levels (biochar, biochar + fertilizer, fertilizer, and control) and the other two models were fitted as a binary presence/absence factor, one for biochar presence and absence and the second for fertilizer presence and absence only. Values highlighted with an * indicate the most parsimonious model with the lowest AIC value.
AIC Model Outputs
Plant Growth Response All TreatmentsBiochar PresenceFertilizer Presence
Plant height136.2828 *141.8475154.9203
Leaf length74.45228 *90.45016130.4761
Above ground biomass108.4831 *138.5443143.7842
Below ground biomass87.85519 *96.97702113.2051
Fruit outputs
Number of fruits142.6897 *155.8337200.9442
Yield 191.688 *213.0751255.12
Soil properties
Water runoff457.4257 *473.0119503.7687
pH37.29435.74379 *41.23772
EC277.1746 *303.3129310.2736
Disclaimer/Publisher’s Note: The statements, opinions and data contained in all publications are solely those of the individual author(s) and contributor(s) and not of MDPI and/or the editor(s). MDPI and/or the editor(s) disclaim responsibility for any injury to people or property resulting from any ideas, methods, instructions or products referred to in the content.

